British Pound (GBP/USD) Update: BoE’s Bailey, Elevated US Bond Yields

British Pound (GBP/USD) Update: BoE’s Bailey, Elevated US Bond Yields

UK inflation is expected to ‘fall sharply’ over the coming, starting with the April number – released May 24 – according to BoE Governor Andrew Bailey as high energy prices begin to drop out of the annual calculations. Mr. Bailey, in a speech given at the annual British Chamber of Commerce Conference, also sees food inflation easing, although his timing on this is less sure. While positive on the path of inflation, the UK central bank remains fully committed to bringing down inflation to the 2% target and won’t flinch from hiking interest rates further if needed, Governor Bailey added. On a more positive note, Mr. Bailey added,

‘Having said all that, things are looking a bit brighter than they did a couple of months ago. As the MPC published its November Monetary Policy Report (MPR) last year, we expected a shallow but long recession in the UK economy. In the latest MPR, published last week, we are now forecasting modest, but positive growth and a much smaller increase in unemployment.’

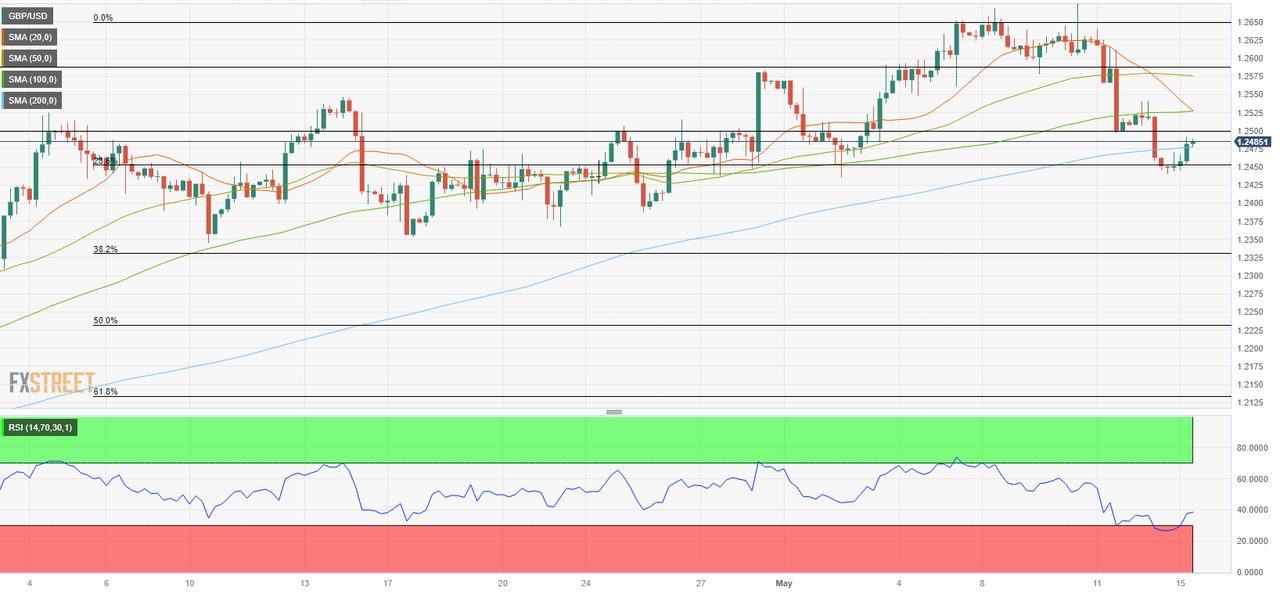
Cable (GBP/USD) is on the back foot over the last couple of days as higher US Treasury yields bolster the US dollar. The yield on the interest rate-sensitive US 2-year rose to a two-week high of 4.12% yesterday after various Fed members’ hawkish views on monetary policy hit the screens. The US 2-year currently trades with a yield of 4.08%. Interest rate cut predictions for this year are being pared back, bringing the market back towards the Federal Reserve’s stance that rates will remain unchanged, or move slightly higher, through the rest of the year.

GBP/USD currently trades around a prior short-term support level at 1.2447 with additional support from the 50-day moving average just below at 1.2391. Below here is a cluster of recent lows down to 1.2350. Initial resistance is seen at 1.2547 before 1.2515 (20dma), 1.2667, and 1.2680 come into view.

GBP/USD Daily Price Chart – May 17, 2023

image1.png


Gold Price Forecast: XAU/USD at Risk of Further Downside Below the Psychological $2000 Mark

Gold Price Forecast: XAU/USD at Risk of Further Downside Below the Psychological $2000 Mark

Gold (XAU/USD) AND DOLLAR INDEX FUNDAMENTAL BACKDROP

Gold prices have steadied following yesterday’s fall as key support level and 50-day MA come into play. The dollar index (DXY) has strengthened in the early part of the week as the continued deadlock over the US debt ceiling continues.

Gold prices have benefitted over the past few months as demand has surged on the back of recessionary concerns and the US banking crisis. However, given all the uncertainties, gold prices failed to sustainably hold above the $2000 mark leading market participants to wonder, is this the end of the bullish cycle? I for one see further uncertainty ahead as Central Banks look to pause rate hikes with Gold likely to be a beneficiary of any further market uncertainty in the second half of the year. The early week dollar strength has come about as safe haven demand for the USD spiked as tensions around the US debt ceiling reached fever pitch yesterday as US President Joe Biden and House Rep. Kevin McCarthy met. There were some positive developments according to both parties. McCarthy did however state that he isn’t optimistic a deal will be reached by the end of the week. Historically speaking the US came close to a debt default in 2011 with a default averted at the last minute. Given the debt ceiling has been raised around 66-68 time since WW2 market optimism this morning may not be misplaced after all.

image1.png

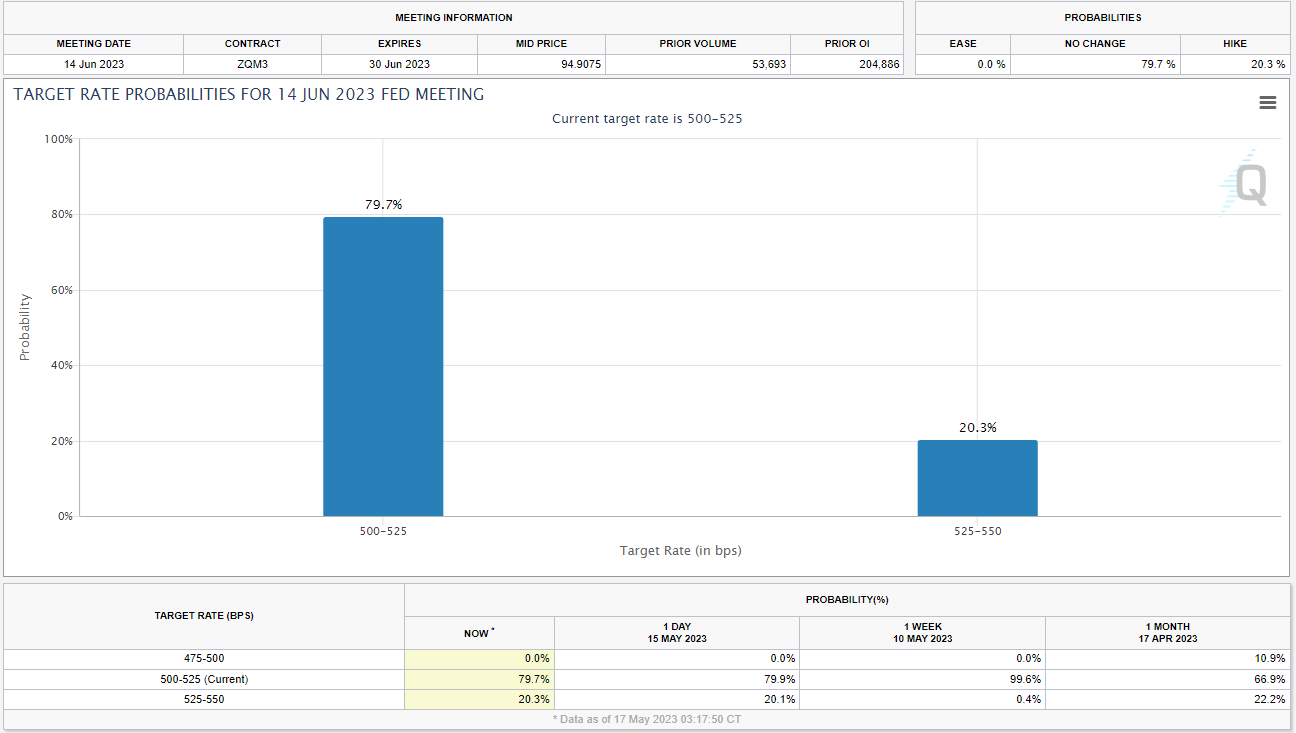
Yesterday’s US data came in mixed with retail sales MoM missing estimates while industrial production ticked higher. US Federal Reserve speakers continue to keep markets on alert as we heard from Atlanta Federal Reserve President Bostic said the Fed would need to stay super strong in fighting inflation even if it leads to an increase in unemployment. Austen Goolsbee from the Chicago Fed said rate cut discussions are premature with Thomas Barkin that he would be comfortable with further rate hikes. The comments and safe haven appeal of the US dollar saw the dollar index (DXY) rally to a 2-week high as it taps into the 100-day MA. The developments over the past week have seen expectations for a pause in Fed rate hikes decline from 99% a week ago down to 79% this morning per the FedWatch Tool above.

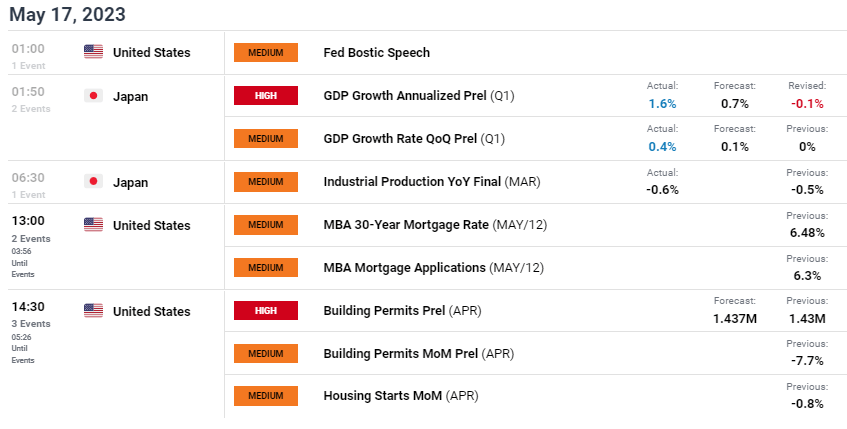
Not a lot to look forward to on the calendar today but we do have some medium impact data out of the US. The building permits preliminary data as well as housing starts for April are scheduled for release and may provide a clearer picture of the US housing market.

A picture containing text, font, number, screenshot  Description automatically generated

TECHNICAL OUTLOOK AND FINAL THOUGHTS

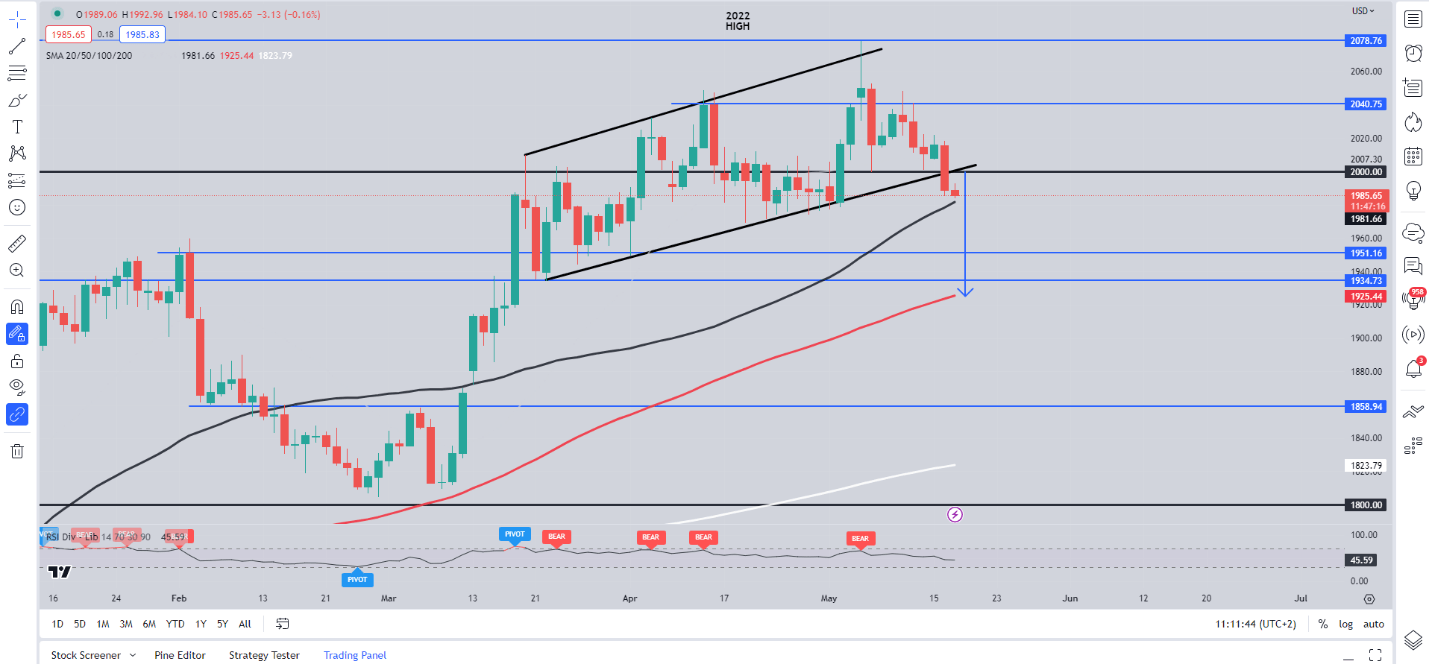
Form a technical perspective, Gold price action has been overshadowed of late by overall market sentiment and safe haven demand. However, the precious metal had been printing lower highs and lower lows since topping out at around the $2079 handle on May 4.

We have broken the ascending channel and currently trade just shy of the 50-day MA resting at $1981.50 with a break below opening up a potential retest of the 100-day MA around $1925. Of course, there are other intraday support levels which could scupper a test of the 100-day MA with support at $1970 and $1950 likely to prove stubborn. A push to the upside brings the psychological $2000 level back into play which currently lines up with the ascending channel breakout.

In short, we have seen some erratic moves of late which could continue with a lack of high impact data market sentiment, dollar index and developments around the US debt ceiling are likely to drive gold prices. Technicals are flashing bearish signals with a bias to the downside in the short-term seemingly appropriate. A daily candle close above the $2007 mark would invalidate the current bearish bias. I would advise caution and attention to developments on the dollar index as well as the US debt ceiling which could result in some unexpected price swings for the rest of the week.

Gold (XAU/USD) Daily Chart – May 17, 2023

image3.png

EUR/USD. 1.0800 may come under pressure soon – ING

EUR/USD. 1.0800 may come under pressure soon – ING

EUR/USD is coming under pressure again. Economists at ING expect the pair to test the 1.0800 level.

Pressure on 1.0800 coming?

“We keep stressing how 1.0800 is probably a key benchmark level to gauge market sentiment about the US debt-ceiling story.”

“We could see some good support at 1.0800, and a break lower could indicate the FX market moving more seriously to price in a US default.”

“The domestic story for the Euro is not deteriorating materially and the decline is almost entirely driven by the dollar leg, although yesterday’s ZEW figures in Germany did send some worrying signals.”


ECB’s de Cos: Stickier inflation to choke growth outlooks – MNI

ECB’s de Cos: Stickier inflation to choke growth outlooks – MNI

European Central Bank (ECB) policymaker and Bank of Spain’s Governor Pablo Hernandez de Cos said in an MNI interview on Wednesday, “the persistence of higher inflation would slow the recovery and would very likely lead to further tightening in the euro area.”

“The longer higher interest rates remain, the more likely that financing cost rises for banks and a deterioration in the quality of credit risk, de Cos added.

Market reaction

At the time of writing, EUR/USD is extending losses toward 1.0800, down 0.33% on the day at 1.0826. Broad-based US Dollar strength amid a cautious market mood is weighing on the main currency pair.

GBP/USD plummets to three-week low, eyes 1.2400 amid broad-based USD strength

GBP/USD plummets to three-week low, eyes 1.2400 amid broad-based USD strength

The GBP/USD pair adds to the previous day’s losses and remains under heavy selling pressure for the second successive day on Wednesday. The downward trajectory remains uninterrupted through the first half of the European session and drags spot prices to a three-week low, around the 1.2420 region in the last hour.

The British Pound continues to be undermined by rather unimpressive UK monthly jobs data released on Tuesday, which fueled speculations that fewer rate increases by the Bank of England (BoE) will be needed in the coming months to bring down inflation. This, along with some follow-through US Dollar (USD) buying, aggravates the bearish pressure surrounding the GBP/USD pair and contributes to the steep intraday decline.

In fact, the USD Index (DXY), which tracks the Greenback against a basket of currencies, jumps to a nearly two-month high and draws support from a combination of factors. The overnight hawkish comments by Cleveland Federal Reserve (Fed) President Loretta Mester reaffirmed expectations that the US central bank will keep interest rates higher for longer. Apart from this, worries about a global economic slowdown benefits the safe-haven buck.

The softer Chinese macro data released on Tuesday pointed to a wobbly post-COVID recovery in the world’s second-largest economy and fueled recession fears. This comes on the back of a standoff to raise the federal government’s borrowing limit and drives some haven flows towards the Greenback. That said, a modest bounce in the US equity futures, along with a downtick in the US Treasury bond yields, might cap the USD.

Nevertheless, the aforementioned fundamental backdrop suggests that the path of least resistance for the GBP/USD pair is to the downside. Even from a technical perspective, last week’s breakdown through the lower end of over a one-month-old ascending trend channel favours bearish traders and supports prospects for a further near-term depreciating move towards the next relevant support near the 1.2375-1.2370 region.

Democrats to launch discharge petition and are aiming to force debt ceiling vote – WSJ

Democrats to launch discharge petition and are aiming to force debt ceiling vote – WSJ

Citing Brendan Boyle, the top-ranking Democrat on the House Budget Committee, the Wall Street Journal (WSJ) reports that House Democrats will begin collecting signatures Wednesday for a discharge petition to raise the debt ceiling, in a desperate attempt to circumvent House Republican leadership and force a vote.

Key takeaways

“We only have two weeks to go until we may hit the x-date.”

“We must raise the debt ceiling now and avoid economic catastrophe.”

“I’ve always said a discharge petition is not a high-probability move. But at this point, we must try whatever it takes.”

“I urge my Republican colleagues, especially those who like to call themselves moderate at election time, to join us and ensure America pays its bills.”

“It takes the signatures of 218 House members—a majority, regardless of party—to move a bill to the floor by discharge petition. Republicans control the House, 222-213, so for their petition to succeed, Democrats would need at least five GOP representatives to sign on,” according to the WSJ.

Market reaction

Risk sentiment is taking a hint on the above headlines, strengthening the rebound in the US Dollar across the board. At the time of writing, the US Dollar Index is adding 0.41% on the day to trade at 102.98.

EUR/USD holds lower ground near 1.0850, awaits ECB-speak

EUR/USD holds lower ground near 1.0850, awaits ECB-speak

EUR/USD is holding lower ground near 1.0850 heading toward the European opening bells. The pair is treading water amid renewed US Dollar strength even as risk sentiment improves on US debt ceiling progress. All eyes remain on the US debt ceiling updates and ECB-speak.

The Relative Strength Index on the four-hour chart declined below 30, pointing to oversold conditions in the near term for EUR/USD. In case the pair stages a technical correction, 1.0850 (static level, 20-period Simple Moving Average (SMA)) aligns as interim resistance ahead of 1.0900 (psychological level, static level). A four-hour close above the latter could discourage sellers and open the door for an extended recovery toward 1.0930 (50-period SMA).

On the downside, 1.0800 (Fibonacci 50% retracement level of the latest uptrend) aligns as the next bearish target ahead of 1.0740 (Fibonacci 61.8% retracement).

EUR/USD has lost its traction and dropped to its weakest level in over a month below 1.0850 early Wednesday. Although the pair’s technical outlook points to oversold conditions, sellers could look to retain control unless there is a noticeable improvement in risk mood.

Although investors have turned optimistic about the US avoiding a default following the latest round of debt limit talks on Tuesday, markets remain risk-averse mid-week. The Euro Stoxx 50 Index is down nearly 0.3% in the early European morning and Dow Futures lose 0.75%.

Following his meeting with US President Joe Biden and other top congressional leaders on Tuesday, top congressional Republican Kevin McCarthy told reporters that it was possible to get a deal on raising the debt ceiling by the end of the week.

In the second half of the day, Building Permits and Housing Starts data for April will be featured in the US economic docket. Richmond Federal Reserve Bank President Thomas Barkin told Bloomberg on Tuesday that he was concerned about the commercial office sector. In case Building Permits, which are forecast to rise 3% following the 7.7% decline recorded in March, fall further in April, the US Dollar could have a difficult time gathering strength in the second half of the day.

Nevertheless, investors will continue to pay close attention to risk perception and comments from central bank officials. If Wall Street’s main indexes turn south after the opening bell, the USD should be able to stay resilient against its rivals and weigh on the pair.

Is This the Moment of Reckoning for Gold?

Is This the Moment of Reckoning for Gold?

The apparent progress in US debt ceiling talks and hawkish US Federal Reserve commentary has taken off some of the heat off gold’s rally. The focus now shifts to key support levels – a break below which would solidify the chances that gold’s rally had peaked for now.

XAU/USD has been lofty in recent weeks amid fears of a potential US debt default and hopes of an end of the Fed hiking cycle. But those drivers appear to be changing. “I’m confident that we’re going to continue to make progress toward avoiding default and fulfilling America’s responsibility as a leader on the world stage”, US President Joe Biden said after a meeting with top Republican lawmakers met at the White House on Tuesday.

XAU/USD Daily Chart

image1.png

US Treasury yields have risen in recent days following hawkish comments from Fed officials – Richmond Fed President Thomas Barkin said he was “comfortable” with raising rates further if needed to lower inflation. Cleveland Fed chief Loretta Mester said the US central bank was not at a point yet where it can hold rates steady. This follows remarks from New York Federal Reserve President John Williams last week that the Fed may not be done raising rates.

XAU/USD Monthly Chart

image2.png

The Fed earlier this month raised interest rates by 25 bps as expected, but indicated a pause in the hiking cycle. Markets are currently pricing in an 18% chance of another 25 basis points of a rate hike at the June meeting. The odds of 75 basis points rate cuts by the year-end have scaled back to 35% from 42% a week ago, according to CME’s FedWatch tool.

XAU/USD Weekly Chart

image3.png

On technical charts, the momentum on higher timeframe charts has been a concern in recent months. See previous updateson March 28,April 16,April 24, and the most recentMay 10update. However, a price confirmation has been lacking, that is, gold hasn’t broken any key support even on intraday charts. For instance, XAU/USD is holding above crucial support at the mid-April low of 1970 and the 200-period moving average on the 240-minute charts.

XAU/USD 240-minutes Chart

image4.png

However, Tuesday’s drop below the moving average is a sign that cracks are beginning to appear. This is confirmed by the 240-minute colour-coded candlestick chart (based on trending/momentum indicators) – for the first time since March, red candles have started to appear, that is, a bearish phase could be setting in. Moreover, on the daily charts, XAU/USD has entered a consolidation phase – note the early-May high of 2072 was part of the consolidation and not the start of a new leg higher (which the subsequent price action has confirmed).

XAU/USD Daily Chart

image5.png

To be fair, unless 1970 support gives way, the path of least resistance could be sideways at best. However, any break below 1970 could expose downside risks toward 1925.

Note: In the above colour-coded charts, Blue candles represent a Bullish phase. Red candles represent a Bearish phase. Grey candles serve as Consolidation phases (within a Bullish or a Bearish phase), but sometimes they tend to form at the end of a trend. Note: Candle colors are not predictive – they merely state what the current trend is. Indeed, the candle color can change in the next bar. False patterns can occur around the 200-period moving average, or around a support/resistance and/or in sideways/choppy market. The author does not guarantee the accuracy of the information. Past performance is not indicative of future performance. Users of the information do so at their own risk.

USD/JPY Price Forecast: Japanese GDP Supportive of BOJ Policy Shift

USD/JPY Price Forecast: Japanese GDP Supportive of BOJ Policy Shift

JAPANESE YEN FUNDAMENTAL BACKDROP

The Japanese Yen looks to be heading for its 5th consecutive loss against the USD after last nights US debt ceiling negotiations showed some positivity but not enough to ease market concerns just yet. Investors remain in favor of the greenback as a safe haven currency as opposed to the yen. This preference was even clearer after stellar Japanese GDP numbers (see economic calendar below) were unable to deter the recent trend.

ECONOMIC CALENDAR (GMT +02:00)

image1.png

From a Japanese perspective, the positive economic growth will lead nicely to elevated inflation levels (above their 2% target) and potentially result in some form of policy change – most likely by adjusting the current Yield Curve Control (YCC) conditions in the near future.

Bank of Japan (BOJ) money market pricing shows no real material change as expected upcoming meetings could be the start of the aforementioned changes by which hawkish repricing could take place.

BOJ INTEREST RATE PROBABILITIES

image2.png

Source: Refinitiv

Later today, US building permit data will be the focal point for the pair and is projected to come in marginally higher than the March print. Further US debt ceiling statements could add to volatility as it takes centre stage over other macro data.

TECHNICAL ANALYSIS

USD/JPY DAILY CHART

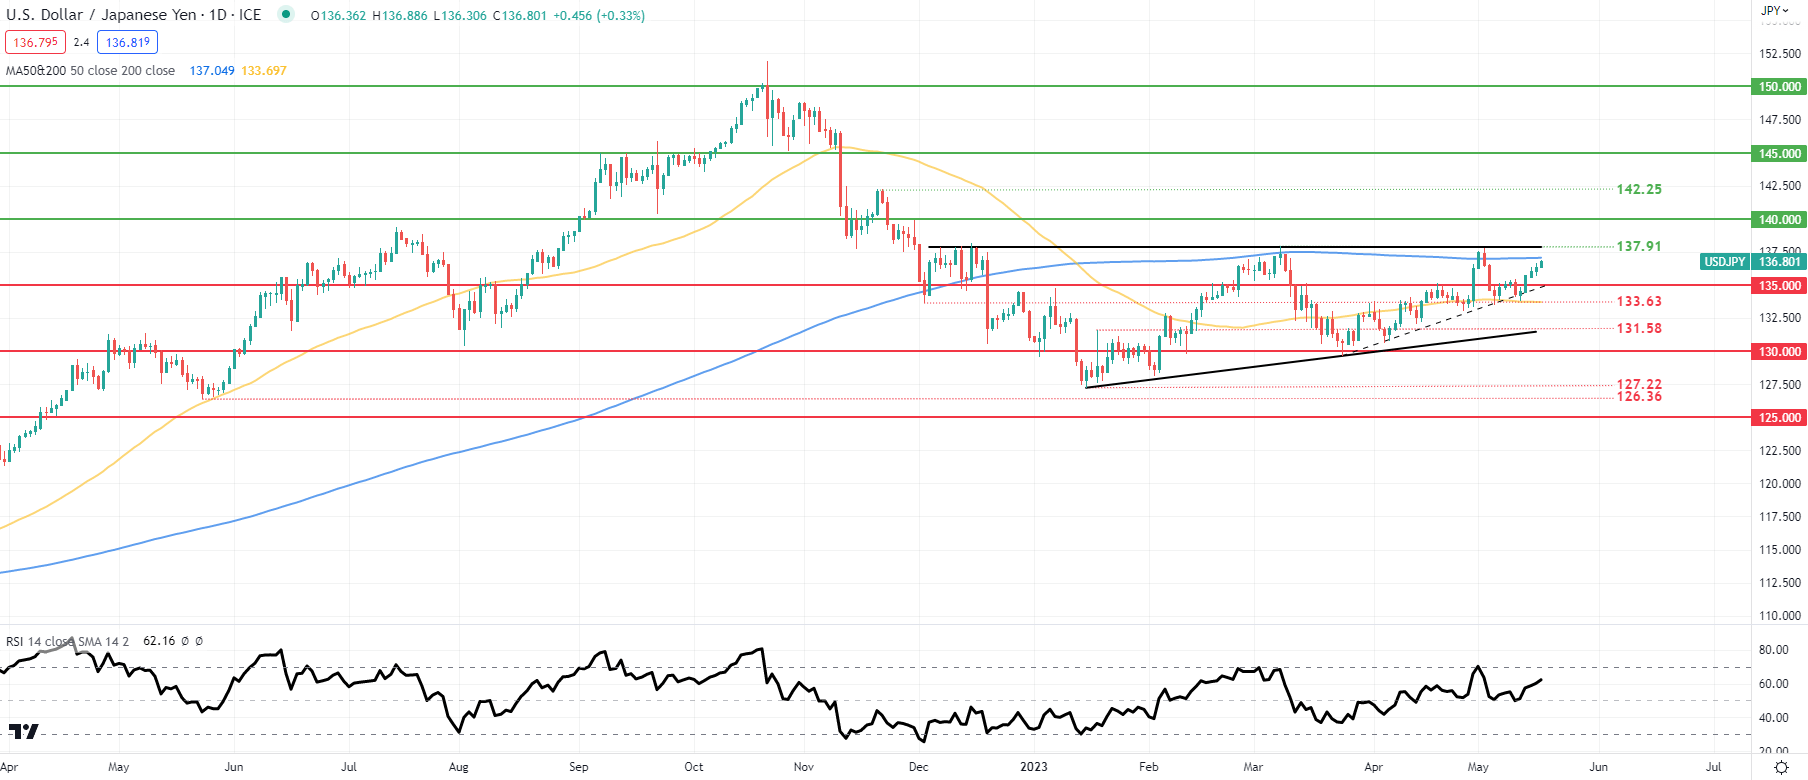
image3.png

Chart prepared by Warren Venketas, IG

USD/JPY shows price action now looking to retest the 200-day moving average (blue) for the first time since the beginning of May as the pair continues to trade within the developing ascending triangle pattern (black). A confirmation close above the 200-day MA could bring into consideration the triangle resistance breakout coinciding with the 137.91 March swing high.

That being said, the Relative Strength Index (RSI) could move back into overbought territory possibly hinting at yet another rejection by bears around this key area of confluence.

Trading Economic Data Means Looking Past the Numbers

Trading Economic Data Means Looking Past the Numbers

The foreign exchange market’s reaction to economic data is one of the most important subjects for traders to consider, but also one of the most vexed.

The monthly round of official and private releases from around the world covers everything from inflation and employment to the forward-looking views of corporate purchasing managers. Together with central bank pronouncements, it forms what we might call the framework of foreign exchange trading.

Major Economic Releases Can Dominate Trade

Markets may well hunker down, losing both volume and volatility, in the run-up to an eagerly anticipated number. Official US labor market statistics are perhaps the most obvious example here. When the trading community expects serious gains or crushing losses the session can be subdued from Asia’s open and right across Europe as participants nurse suspicions or hopes. Even when the market expects neither many traders will – in financial journalism’s enervating cliché – “wait and see.”

This makes sense of course, enervating or not. Obviously, there’s a link between the economic performance of a country with a freely floating currency and the performance of that currency against its peers. At the most basic level a strong piece of economic data will boost a currency, a weaker one will tend to see it fall.

However, to take the matter no further would be a grave error. For one thing, individual pieces economic data tend to influence currencies in a very fleeting way. The gains provided by even a blockbuster, expectation-shattering number can be undone by the end of a day’s session, and well before that in some cases. It may even mean no more than a few minutes’ spike one way or another.

So, there’s clearly more to know about data and its effects.

The first and perhaps most important thing is that, while data provide the rhythm, the world moves to a monetarist cadence and central banks will always play lead. So, ultimately, the longer-term effects any piece of economic news must be considered with a view to how it might change monetary policy. No single data release is ever likely to do that, and markets would have caused to worry if it did. Central banks like to be ahead of the numbers, ready to tighten or loosen policy as needed before trends turn.

Therefore, we might see the markets only very briefly cheer strong retail sales, say, or powerful job creation. They might be great for the politicians, but, if inflation remains docile, they might not mean anything at all in terms of central bank policy changes. And if rates aren’t going up or coming down, then the longer-term effect of the data on the currency won’t amount to much.

Of course, these days docile inflation is little more than a happy memory across much of the world as war in Ukraine boosts both food and fuel prices at a time when post-Covid supply chain storms are still raging.

Currencies Can Fall Even When Interest Rates Rise

In July of this year, the United States Federal Reserve delivered a three-quarter point interest rate rise, something which would have been considered extraordinary monetary action for most of the past thirty years. And yet the US Dollar actually lost ground by the end of the session for, in its post-rate-hike remarks, the Fed left markets reasonably sure that future actions were going to be a lot more measured.

So, we can on occasion see the phenomena of a ‘dovish’ rate hike, or even a ‘hawkish’ rate cut. That’s when a central bank takes action but strongly implies that it has finished doing so, or that the barrier to more is extremely high. Higher interest rates have not been terribly helpful to rare-breed Sterling bulls this year either. The United Kingdom’s political and economic turmoil has left the market wondering if its economy can bare higher borrowing costs. The US certainly looks much better placed to do so.

With all this in mind, merely watching and reacting to pieces of economic news is unlikely to make for a satisfactory trading strategy. Indeed, the Dollar’s broad gains this year have rendered data watching all-but meaningless in many countries. Their currencies have fallen against the Greenback regardless of the numbers as the US currency reveals itself as the ultimate safe-haven play.

Competent traders know where the market is focused and where in the business cycle we are. What that tends to mean in practice is which specific data releases are most likely to trigger changes in the monetary mood music.

These can change dramatically over time. Older readers may well recall the days when western industrial production figures were the ones to watch for the best central bank steer. In more recent times unemployment figures took over. Policymakers were leery of wage inflation and, poised to “withdraw the punchbowl” if the labor market party showed any sign of getting out of hand.

Now of course inflation figures themselves are perhaps the ones which traders look at most obsessively, with prices’ stubborn elevation. One day, the focus will move on again. It always does. But a nuanced approach to trading economic data should remain a constant.