Gold Price Latest: Waiting for the Fed’s Thoughts, $2K Currently Provides Support

Gold Price Latest: Waiting for the Fed’s Thoughts, $2K Currently Provides Support

Gold starts the week on the front foot after testing $2k support in the last couple of sessions. The precious metal continues to respect this level and with little in the way of high-impact economic data on the calendar this week, traders will look to commentary from a host of Federal Reserve speakers this week to provide some volatility. Today sees scheduled commentary from Fed members Bostic, Kashkari, Barkin, and Cook, while other board members speak throughout the week. The highlight of the week comes on Friday when Fed chair Jerome Powell is scheduled to speak at the Thomas Laubach Research Conference. According to the Fed’s website, this year’s conference will ‘highlight key issues in monetary policy and the economy and facilitate discussions on the challenges faced by monetary policymakers’.

This week’s Fed commentary will be closely followed by US Treasury traders for any clues about the central bank’s intentions going forward. According to one closely watched indicator, the Fed has finished tightening monetary policy and will start cutting interest rates at the end of the third quarter. This outlook is at odds with some of the more hawkish Fed members who continue to press their case for further rate hikes in the months ahead. The rate-sensitive US 2-year is currently trading with a yield of 4%, while the benchmark US 10-year changes hands at 3.48%.

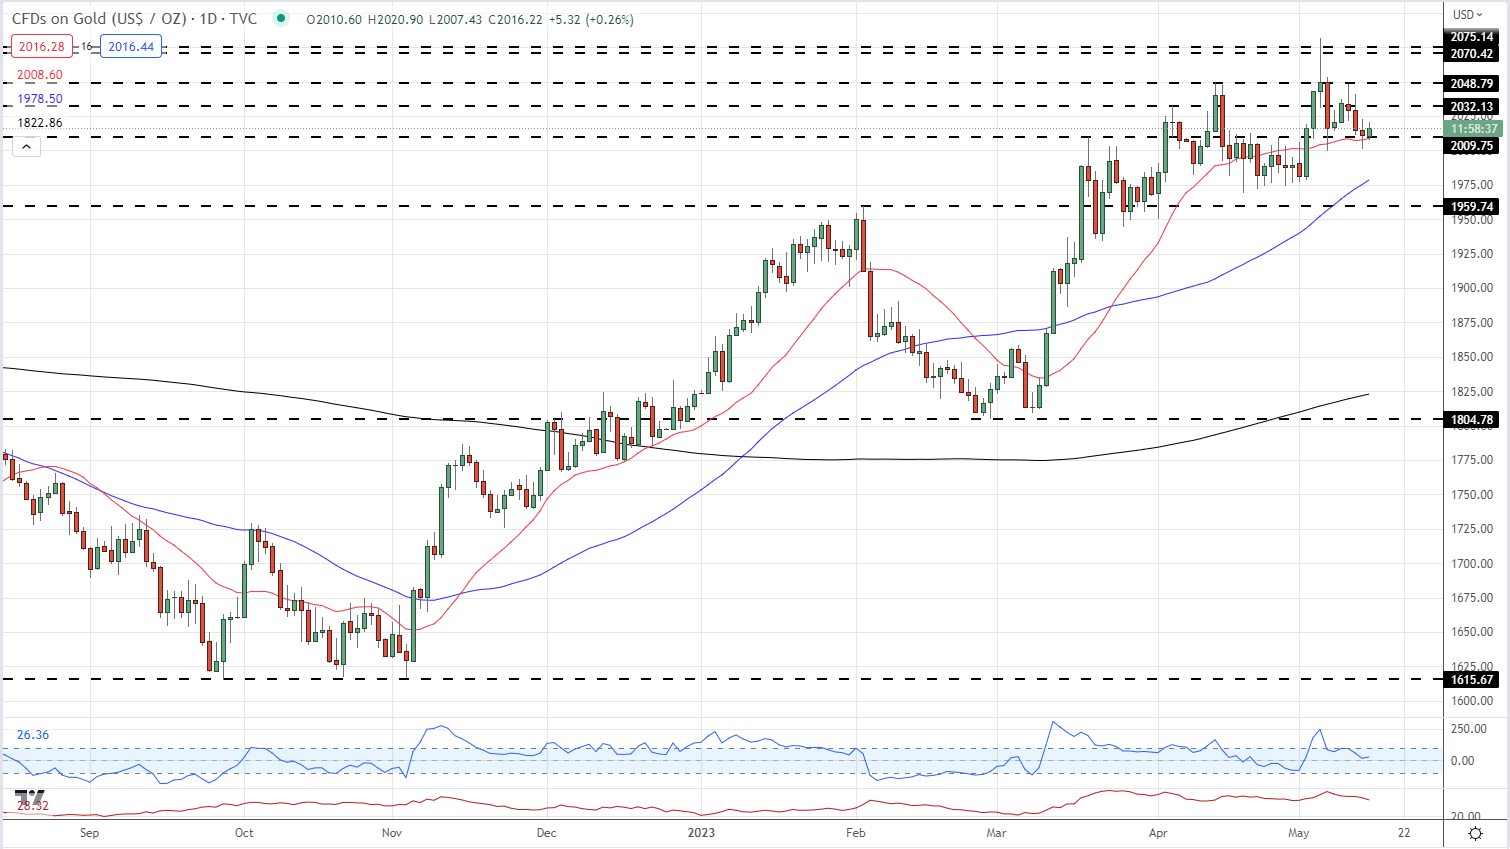
The precious metal remains bid above $2,000/oz. level and is looking to break back above Friday’s $2,022/oz. high. While support has held, a recent series of lower highs has compressed the price of gold, hinting at a breakout. Gold is being supported by the 20-day simple moving average, although this indicator remains under threat. If the 20-dma and the $2k level break then a cluster of prior lows down to $1,970/oz. should provide support.

Gold Price Daily Chart – May 15, 2023

Top 10 Candlestick Patterns To Trade the Markets

Top 10 Candlestick Patterns To Trade the Markets

Candlestick patterns are important tools in technical trading. Understanding them allows traders to interpret possible market trends and form decisions from those inferences. There are various types of candlestick patterns which can signal bullish or bearish movements. This article will briefly touch upon what candlestick patterns are and introduce the top 10 formations all traders should know to trade the markets with ease.

Try out our interactive trading quiz on forex patterns !

What are candlestick patterns?

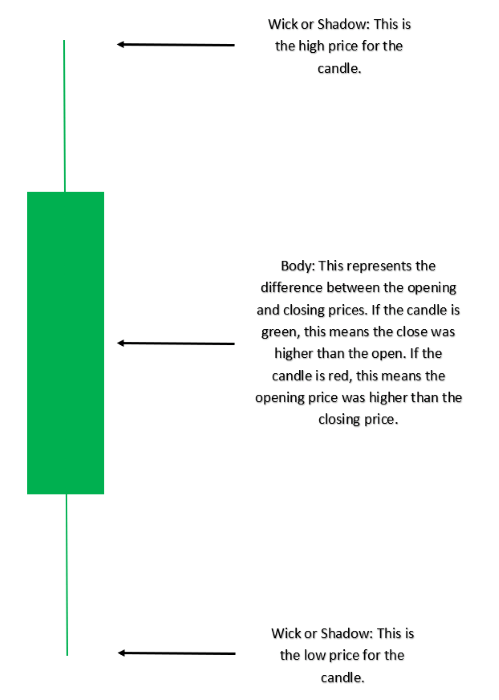
A candlestick is a single bar which represents the price movement of a particular asset for a specific time period. The information it displays includes the open, high, low and close for that time period.
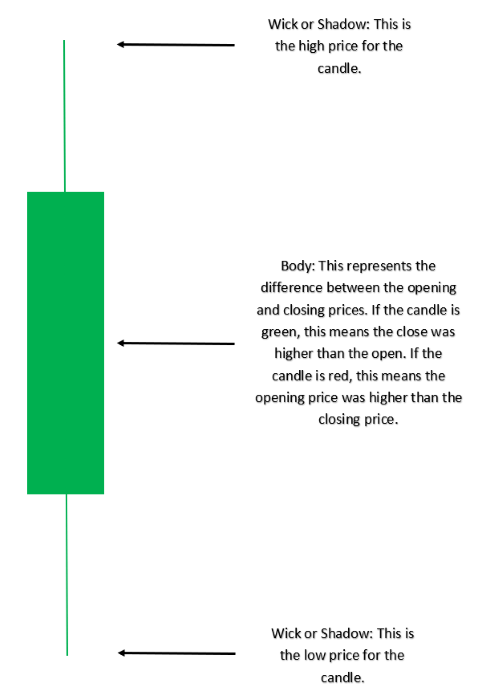
candlestick pattern

Candlestick patterns take into account one or more candlesticks to assist technical traders in developing inferences about future movements and price patterns of the underlying asset. These are displayed graphically on a chart, which is utilized for market analysis. Our guide to reading candlestick charts is a great place to start to learn how to interpret candlesticks for trading.

Candlestick Patterns can be Bullish or Bearish

In order to recognize and apply the most commonly used candlestick patterns to a trading strategy, traders need to understand how the inclination of these patterns can affect the market direction (trend). The tables below summarize the two main categories of price movement that candlesticks can indicate. Many of these patterns are featured in our top 10 list below.

Bullish Candlestick Patterns:

Candlestick Pattern Direction
Morning Star Bullish (Reversal)
Bullish Engulfing Bullish (Reversal)
Doji Bullish/Bearish (Indecision)
Hammer Bullish (Reversal)
Bullish Harami Bullish (Reversal)
Piercing Pattern Bullish (Reversal)
Inside Bars Bullish (Continuation)
Long Wicks Bullish/Bearish (Reversal)

Bearish Candlestick Patterns:

Candlestick Pattern Direction
Evening Star Bearish (Reversal)
Bearish Engulfing Bearish (Reversal)
Doji Bearish/Bullish (Indecision)
Bearish Harami Bearish (Reversal)
Dark Cloud Cover Bearish (Reversal)
Inside Bars Bearish/Bullish (Continuation)
Long Wicks Bearish/Bullish (Reversal)
Shooting Star Bearish (Reversal)

Top 10 Candlestick Patterns Traders Should Know

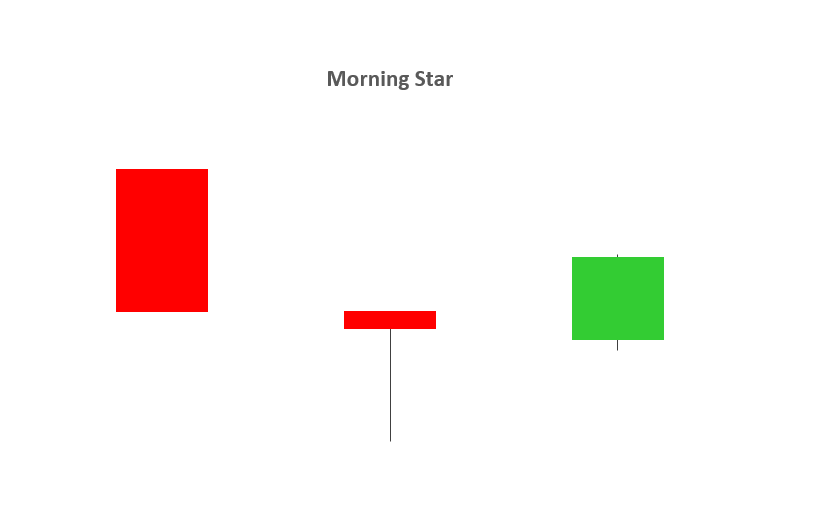
1 – EVENING STAR AND MORNING STAR

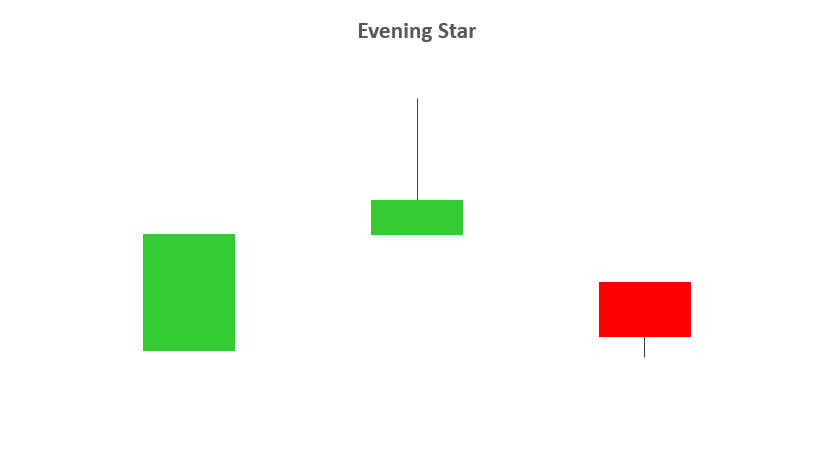
  • The evening and morning star candlestick patterns occur at the end of upwards/downward trends respectively and tend to indicate reversal patterns.
  • The names come from the star shaped formation of the arrangement.
  • As you can see from the image below, the first candlestick is in the direction of the trend, followed by a bullish or bearish candle with a small body. The third candlestick is seen in the direction of the reversal, ideally closing passed the halfway point of the first candlestick.
  • Trading this candlestick pattern will require a confirmation candle in the direction of the respective reversal – for example, traders will look for a bearish candle after the evening star.
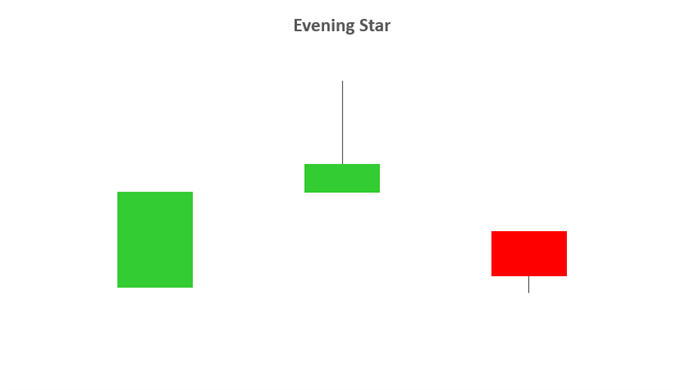
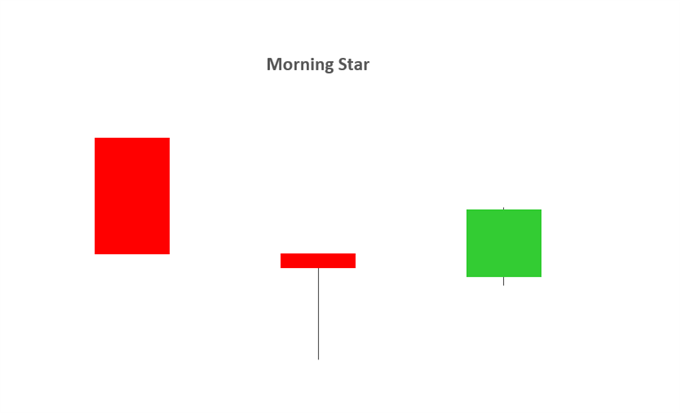
evening star candlestickmorning star candlestick

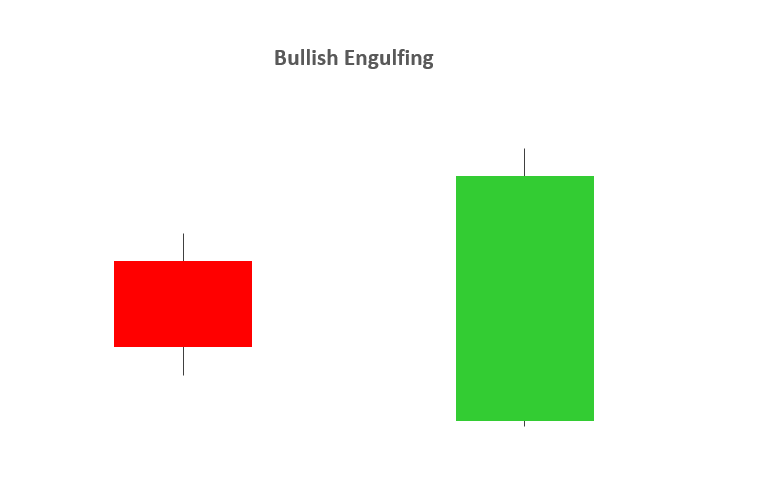
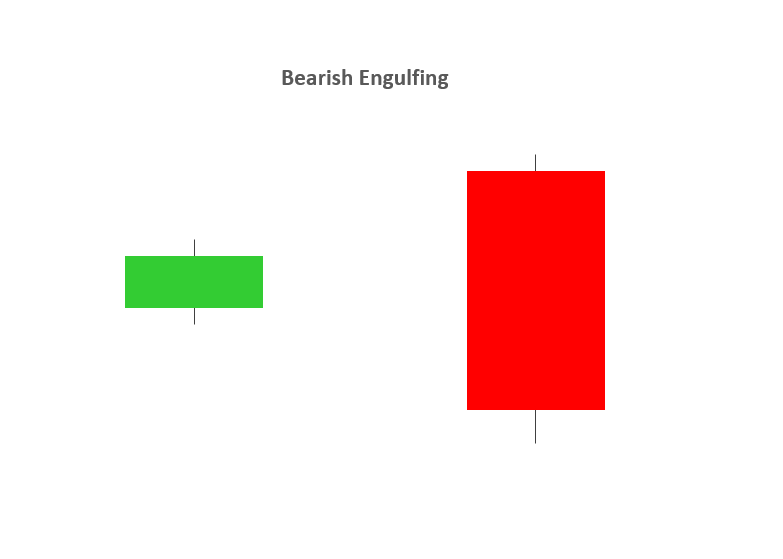
2 – BULLISH & BEARISH ENGULFING

  • A bullish or bearish engulfing candlestick pattern may indicate reversal patterns.
  • A bullish engulfing candlestick formation shows bulls outweigh bears. As the pattern below shows, the green body (bulls) covers completely the first candlestick (bears).
  • A bearish engulfing candlestick pattern is small green (or bullish) candle followed by a larger red (bearish) candle immersing the small green candle.
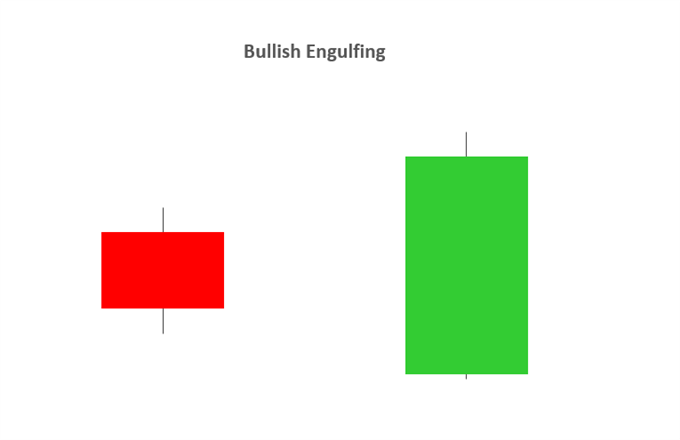
bullish engulfing candlestickbearish engulfing candlestick

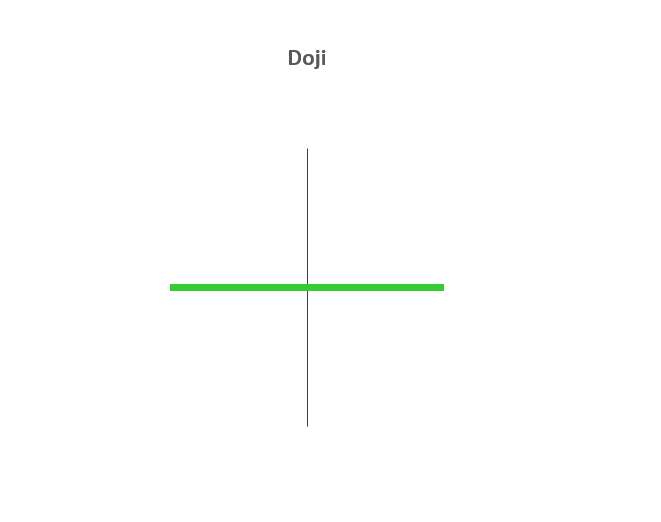
3 – DOJI

  • The Doji candlestick chart pattern is associated with indecision in the market of the underlying asset. This could mean potential reversal of the current trend or consolidation.
  • This pattern can occur at the top of an uptrend, bottom of a downtrend, or in the middle of a trend.
  • The candlestick itself has an extremely small body centered between a long upper and lower wick.
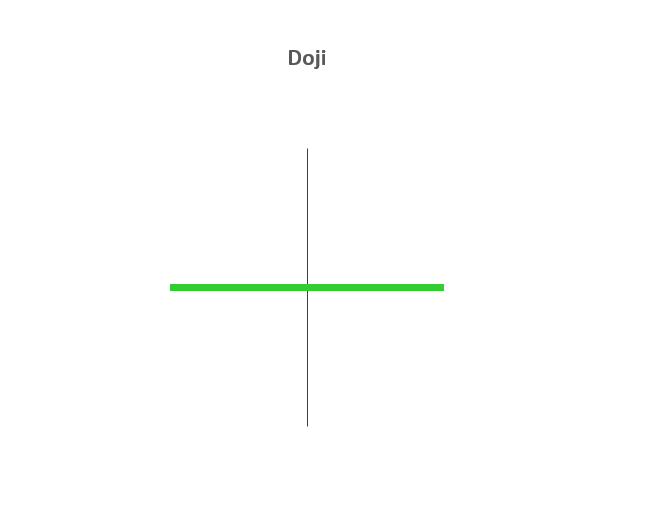
doji candlestick

4 – HAMMER

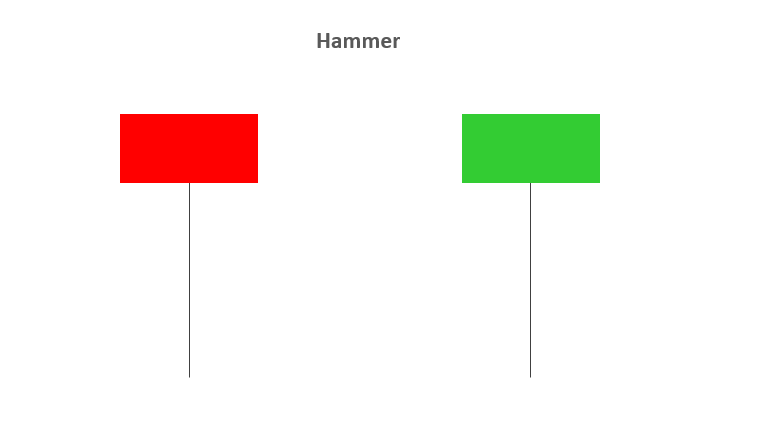
  • The Hammer candle is viewed as a bullish reversal usually occurring at the bottom of a downward trend.
  • This candle formation includes a small body whereby the open, high, low and close are roughly the same. There is a long lower wick beneath the body which should be more than twice the length of the candle body. The body may be bullish or bearish, however bullish is considered more favorable.
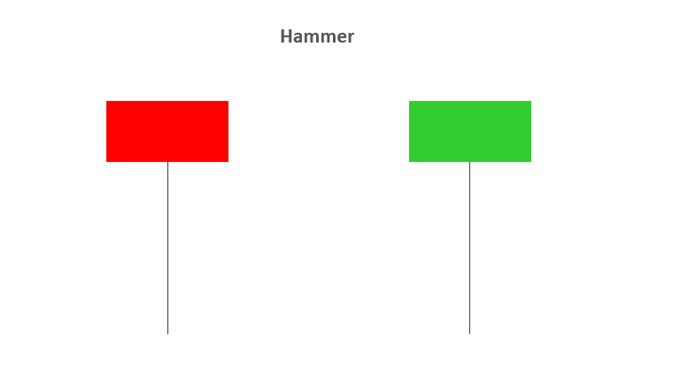
hammer candlestick

5 – BULLISH & BEARISH HARAMI

  • A Bullish or Bearish Harami may indicate reversal patterns.
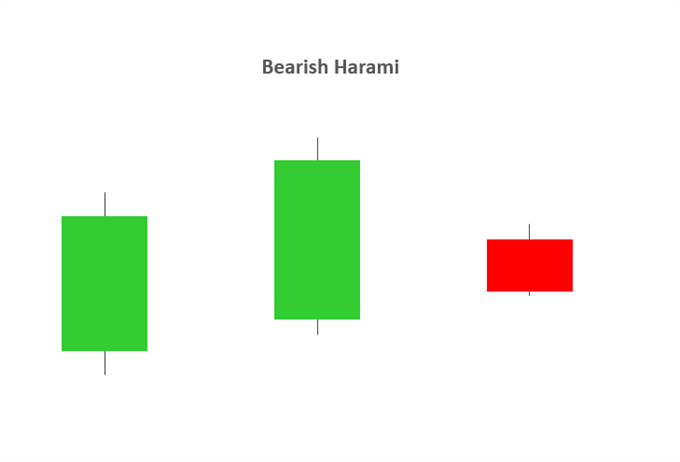
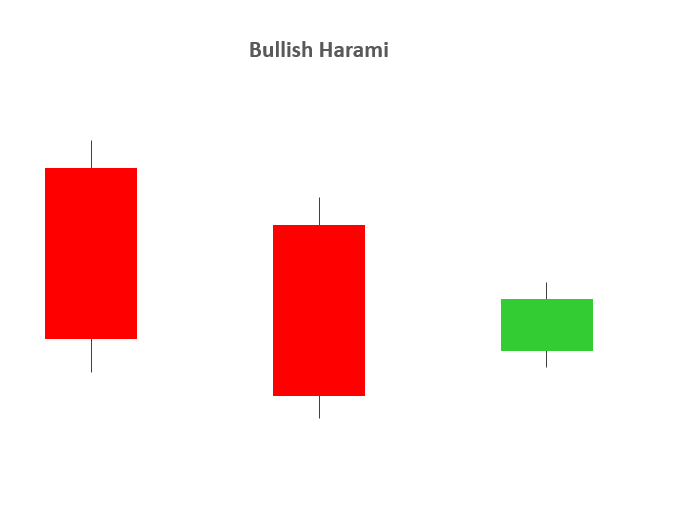
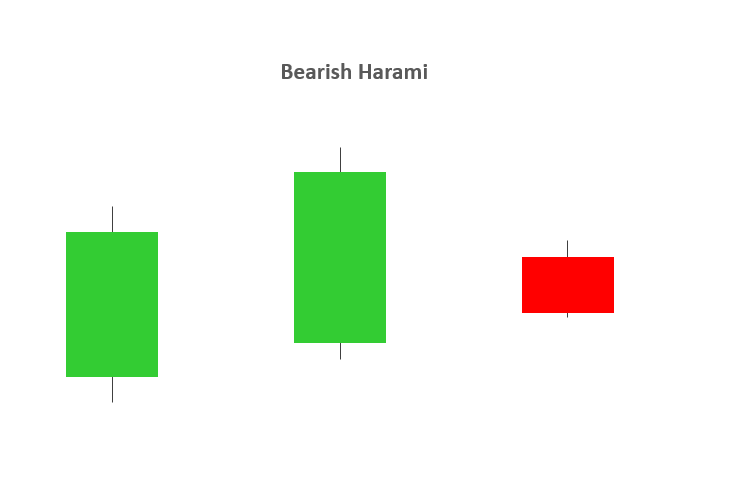
  • The word “Harami” means “pregnant” in Japanese, and the name has been given to this candlestick pattern because it resembles a pregnant woman. The second candle in the pattern must be contained within the body of the first candle as seen in the images below. This holds true for both bullish and bearish Harami’s.
  • A downtrend precedes a bullish Harami and an uptrend precedes that of a bearish Harami.
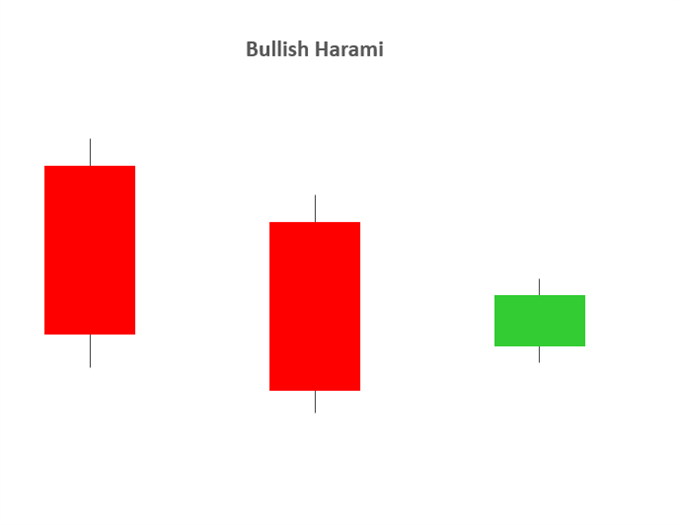
bullish harami candlestickbearish harami candlestick

6 – DARK CLOUD COVER

  • The Dark Cloud Cover pattern is seen as a bearish reversal pattern.
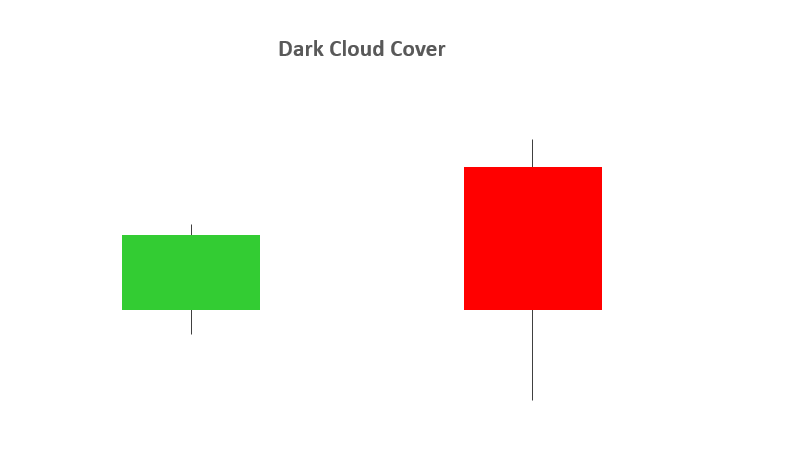
  • This candlestick pattern must occur during an uptrend. As seen in the image below, the bullish candle is followed by a bearish candle.
  • This bearish candle must confirm certain criteria to validate the Dark Cloud Cover pattern:

1. The opening price must by higher than the previous days close.

2. The closing price must close below the midpoint of the previous bullish candle.

  • The Dark Cloud Cover pattern looks similar to that of the Bearish Engulfing pattern. The difference between the two relates to the second candlestick. Bearish Engulfing pattern has the second candlestick opening above the close of the first, whilst the Dark Cloud Cover opens above the high of the first candle and closes below the midpoint of the first candlestick body.
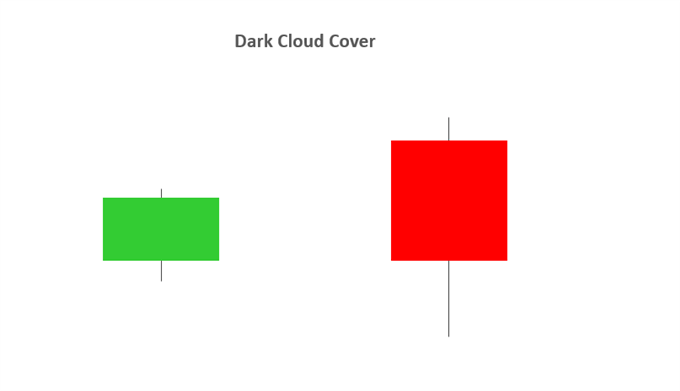
dark cloud cover candlestick

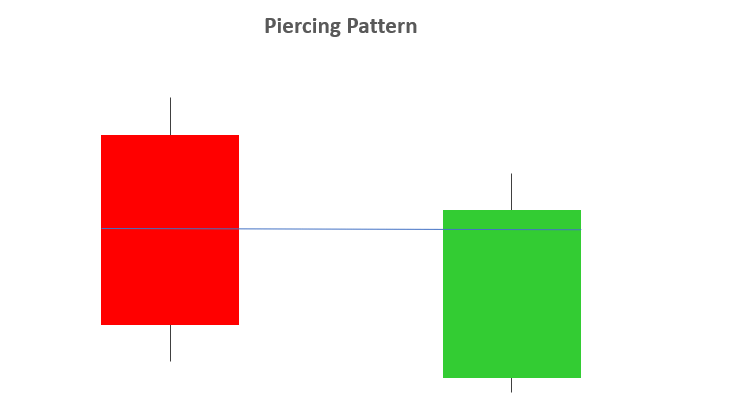
7 – PIERCING PATTERN

  • The Piercing Pattern is viewed as a bullish candlestick reversal pattern, at the end of a downtrend or during a pullback within an uptrend, or at the support.
  • There are two components of a Piercing Pattern formation:

1. Bearish candle

2. Bullish candle

  • A Piercing Pattern occurs when a bullish candle (second) closes above the middle of bearish candle (first) in a downward trending market.
  • The open price of the second candle should gap down at market open and ensue by closing above the mid-point of the previous candle as indicated below.
  • Both the Piercing and Dark Cloud Cover patterns have similar characteristics. The difference is that the piercing line is a bullish reversal pattern as mentioned above, whilst the Dark Cloud Cover pattern is a bearish reversal pattern.
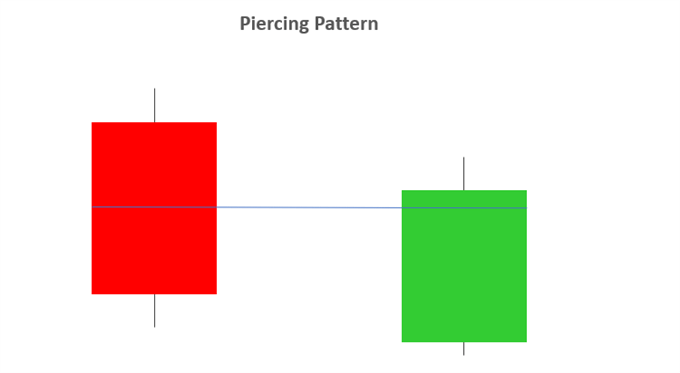
piercing pattern

8 – INSIDE BARS

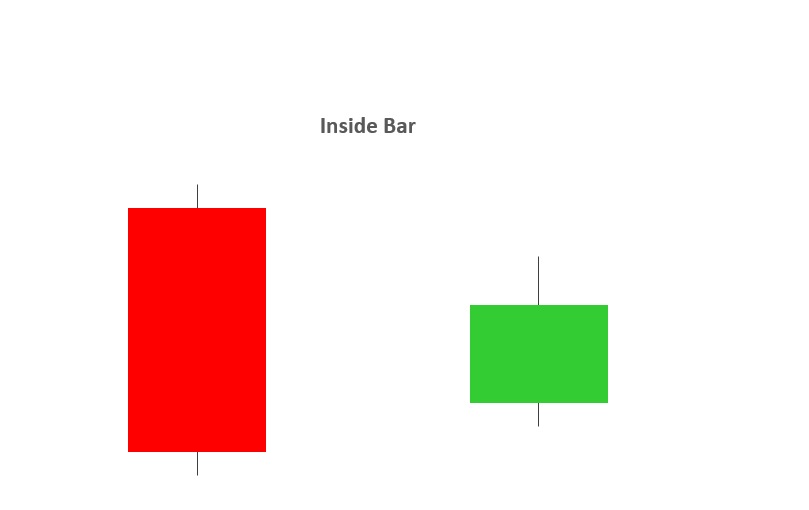
  • The Inside Bar pattern is utilized in trending markets whereby the high and low of the Inside bar is within the parameters of the previous candle or “mother bar”.
  • Inside Bars are traded within the direction of the trend – if the market is in a downtrend, the trader would look to continue with a short position with the presence of an Inside Bar. The same principal is applied in an uptrend.
  • Trading in the direction of the trend is not always a given as key levels of support/resistance can indicate a reversal. Classically, the entry points for traders is positioned above or below the high or low of the mother bar depending on the direction of the trade.
  • An inside bar is also similar to a bullish or a bearish harami candlestick pattern. The main difference being that with an inside bar, the highs and lows are considered while the real body is ignored.
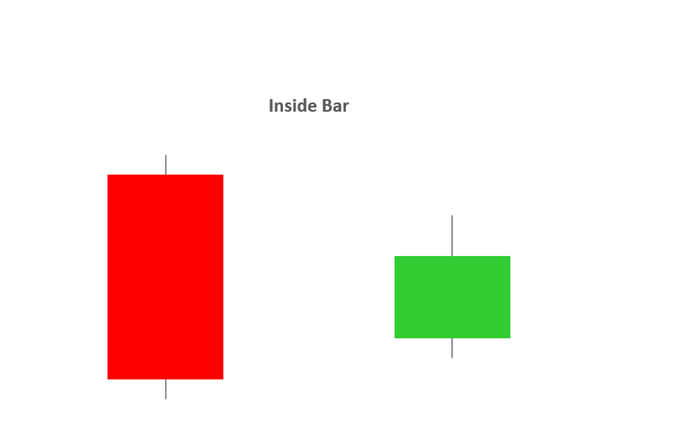
inside bar candlestick

9 – LONG WICKS

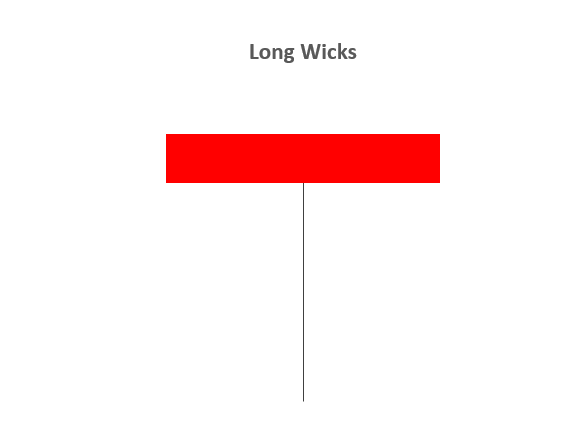
  • Long Wicks candlestick patterns often indicate a reversal in the trend.
  • Long Wicks occur when prices are tested and then rejected. The wick indicates rejected prices.
  • Identifying the trend is important to interpret the significance of the Long Wick.
  • Identifying key levels and price action is often used in conjunction with Long Wick patterns.
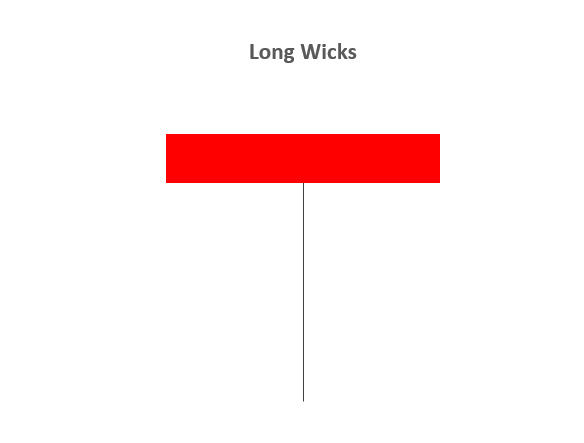
long wicks candlestick

10 – SHOOTING STAR

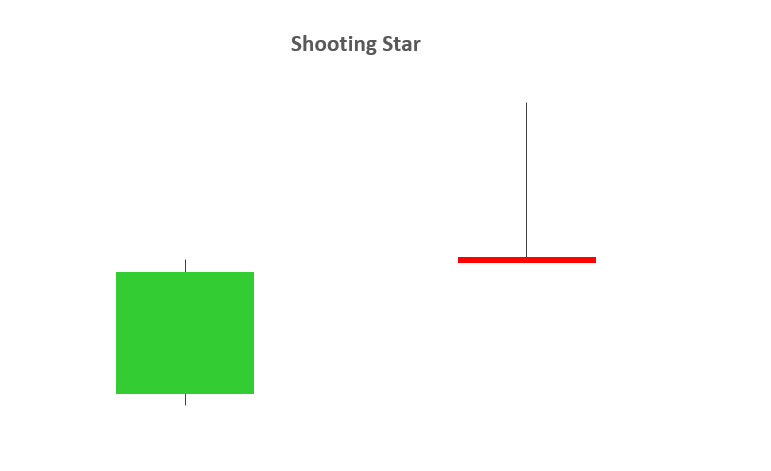
  • A Shooting Star is a bearish candle with a long upper wick, little or no lower wick and a small real body near the day’s low. It comes after an uptrend, and potentially indicates a trend reversal to the downside.
  • The distance between the high and opening price of the candle must be more than twice as large as the Shooting Star’s body. The distance between the lowest price for the day and the closing price must be very small or nonexistent.


shooting star candlestick

GBP/USD Price Forecast: Pound Fixated on US Factors

GBP/USD Price Forecast: Pound Fixated on US Factors

GBPUSD FUNDAMENTAL BACKDROP

The British pound carved out some marginal gains this Monday morning after positivity around the US debt ceiling emerged. There has been a tentative meeting scheduled for tomorrow with participants including President Joe Biden and House Speaker Kevin McCarthy to negotiate around avoiding a default. The President commented further stating that he believes a deal could be reached stoking risk sentiment with investors now marginally moving away from the safe haven USD. That being said, until markets receive more clarity around the situation, the greenback will remain the preferred currency against the pound.

Last week’s Bank of England (BoE) meeting expectedly raised interest rates by 25bps but money market pricing (see table below) showed a stark downward revision of upcoming rate hikes to a roughly 40bps from 70bps peak pre-announcement. The 40bps current view may be overenthusiastic as recessionary fears gain traction as well as the BoE’s inflation forecast suggesting lower inflation in the UK even at current rates. The aggressive monetary policy stance thus far should be sufficiently restrictive for the UK economy as signs of economic slowdown are starting to appear.

BANK OF ENGLAND INTEREST RATE PROBABILITIES

image1.png

Source: Refinitiv

Fed speakers will dominate the calendar today following on from officials last week who were less hawkish relative to prior commentary. Talks of data dependency and bank stress were mentioned but overall the preference remained restrictive. Fed speakers today (see below) could stoke some volatility for cable in what is a comparatively quiet day from an economic perspective.

ECONOMIC CALENDAR

image2.png

Source: DailyFX Economic Calendar

Foundational Trading Knowledge

Macro Fundamentals

Recommended by Warren Venketas

Start Course

TECHNICAL ANALYSIS

GBP/USD DAILY CHART

image3.png

Chart prepared by Warren Venketas, IG

Daily GBP/USD price action saw the 1.2500 handle (now resistance) being breached with 1.2400 not far off. The Relative Strength Index (RSI) fell to cautious levels favoring neither bullish nor bearish momentum short-term – this reflects the uncertain external environment influencing the pair.

EUR/USD: Break below 1.0800/1.00730 to hasten a retracement toward 1.05 – SocGen

EUR/USD: Break below 1.0800/1.00730 to hasten a retracement toward 1.05 – SocGen

The Euro retreated to the bottom spot in the G10 table after the marked selling on Friday. Economists at Société Générale expect EUR/USD to plummet toward 1.05  on a break under 1.0800/1.0730.

Profit-taking looks tactical

“The realignment of EUR/USD with bond spreads has run its course and hedge funds maintain their long position last week at 22.5% of OI, so the profit-taking looks tactical and does not suggest a more fundamental shift is afoot.”

“We can’t ignore the jeopardy of a deeper pullback of course, especially if US retail sales come in strong tomorrow.”

“Confluence of 100-DMA and the trendline going back to September 2022 near 1.0800/1.0730 is crucial support zone. A break would hasten a retracement towards 1.05.”

AUD/USD clings to gains near daily peak, just below 0.6700 amid modest USD downtick

AUD/USD clings to gains near daily peak, just below 0.6700 amid modest USD downtick

The AUD/USD pair regains positive traction on the first day of a new week and recovers a major part of Friday’s losses to a one-and-half-week low. Spot prices stick to strong intraday gains just below the 0.6700 mark through the first half of the European session and for now, seem to have stalled last week’s retracement slide from the highest level since February 24.

The US Dollar (USD) struggles to capitalize on its strong gains recorded over the past two days and eases from its highest level since early April touched this Monday, which, in turn, prompts some short-covering around the AUD/USD pair. A generally positive tone around the equity markets is seen undermining the safe-haven Greenback and benefitting the risk-sensitive Aussie. That said, any meaningful downside for the USD seems elusive amid reviving bets that the Federal Reserve (Fed) might stick to its hawkish stance in the wake of a rise in the US long-term inflation expectations.

In fact, the preliminary May reading from the University of Michigan released on Friday showed that consumers see prices over the next five years climbing at an annual rate of 3.2%  – the highest since 2011. This could force the Federal Reserve (Fed) to keep interest rates higher for longer, which continues to act as a tailwind for the US Treasury bond yields and supports prospects for the emergence of some USD dip-buying. This, along with worries about an imminent recession, could keep a lid on any optimism in the markets and contribute to capping the upside for the AUD/USD pair.

That said, the RBA’s hawkish outlook, indicating that some further tightening of monetary policy may be required to ensure that inflation returns to target in a reasonable timeframe, warrants caution for bearish traders. Moving ahead, the US economic docket, featuring the release of the Empire State Manufacturing Index, along with a scheduled speech by Minneapolis Fed President Neel Kashkari, might influence the USD price dynamics. Apart from this, the broader market risk sentiment might further contribute to producing short-term trading opportunities around the AUD/USD pair.

EUR/USD has started the new week on a firm footing and erased a small portion of last week’s losses.

EUR/USD has started the new week on a firm footing and erased a small portion of last week’s losses.

Money managers stayed relatively flat on Gold positioning. Economists at TD Securities expect long positions to grow once data turns convincingly negative.

Ambiguity with respect to the direction Gold prices are expected to take

“There is definite ambiguity with respect to the direction Gold prices are expected to take. Some speculative investors see Gold trending higher amid the implied Fed pause, which explains the long position increases. In sharp contrast, others see prices trending down in response to a firm Dollar, elevated rates and a bond sell off.”

“Before money managers take a more one sided view on where the yellow metal will go, markets will need to see more economic data.”

“For now, it is likely that money managers may want to continue to reduce length. However, once data turns convincingly negative and the Fed is seen to pivot ahead of hitting its inflation target, longs will grow robustly.”

EUR/USD attempts recovery towards 1.0900 ahead of EU data

EUR/USD attempts recovery towards 1.0900 ahead of EU data

EUR/USD is attempting a mild recovery toward 1.0900 early Monday, as the US Dollar bulls take a breather after the recent upsurge. Mixed ECB-speak and a cautious market mood could limit the further upside in the pair. EU Industrial Production data eyed.

The Fibonacci 38.2% retracement of the latest uptrend aligns as a key pivot level at 1.0870. If EUR/USD stabilizes above that level by using it as support, it could extend its upward correction to 1.0900 (psychological level, 20-period Simple Moving Average (SMA) on the four-hour chart) and 1.0950/1.0960 (Fibonacci 23.6% retracement, 200-period SMA).

On the downside, interim support seems to have formed at 1.0850 ahead of 1.0800 (psychological level, Fibonacci 50% retracement).

EUR/USD has started the new week on a firm footing and erased a small portion of last week’s losses. The pair could extend its correction in case buyers continue to defend 1.0870.

The broad-based US Dollar strength amid risk aversion weighed heavily on EUR/USD ahead of the weekend and the pair touched its lowest level in a month below 1.0850 on Friday. Early Monday, Euro Stoxx 50 trade in positive territory and US stock index futures rise between 0.25% and 0.35%, reflecting an improving market mood.

Over the weekend, European Central Bank (ECB) officials delivered a mixed message regarding the policy outlook. ECB Vice President Luis de Guindos told an Italian newspaper that they have now entered the home stretch of the monetary policy tightening path. On a hawkish note, “the ECB may need to raise interest rates longer than previously thought to help tame inflationary pressures,” policymaker Peter Kazimir said.


GBP/USD Price Forecast: Pound Fixated on US Factors

GBP/USD Price Forecast: Pound Fixated on US Factors

GBPUSD FUNDAMENTAL BACKDROP

The British pound carved out some marginal gains this Monday morning after positivity around the US debt ceiling emerged. There has been a tentative meeting scheduled for tomorrow with participants including President Joe Biden and House Speaker Kevin McCarthy to negotiate around avoiding a default. The President commented further stating that he believes a deal could be reached stoking risk sentiment with investors now marginally moving away from the safe haven USD. That being said, until markets receive more clarity around the situation, the greenback will remain the preferred currency against the pound.

Last week’s Bank of England (BoE) meeting expectedly raised interest rates by 25bps but money market pricing (see table below) showed a stark downward revision of upcoming rate hikes to a roughly 40bps from 70bps peak pre-announcement. The 40bps current view may be overenthusiastic as recessionary fears gain traction as well as the BoE’s inflation forecast suggesting lower inflation in the UK even at current rates. The aggressive monetary policy stance thus far should be sufficiently restrictive for the UK economy as signs of economic slowdown are starting to appear.

BANK OF ENGLAND INTEREST RATE PROBABILITIES

image1.png

Fed speakers will dominate the calendar today following on from officials last week who were less hawkish relative to prior commentary. Talks of data dependency and bank stress were mentioned but overall the preference remained restrictive. Fed speakers today (see below) could stoke some volatility for cable in what is a comparatively quiet day from an economic perspective.

TECHNICAL ANALYSIS

GBP/USD DAILY CHART

image3.png

Daily GBP/USD price action saw the 1.2500 handle (now resistance) being breached with 1.2400 not far off. The Relative Strength Index (RSI) fell to cautious levels favoring neither bullish nor bearish momentum short-term – this reflects the uncertain external environment influencing the pair.

Key resistance levels:

  • 1.2667
  • 1.2584
  • 1.2500

Key support levels:

  • 1.2400
  • 50-day MA (yellow)
  • 1.2345

BEARISH IG CLIENT SENTIMENT

IG Client Sentiment Data (IGCS) shows retail traders are currently net LONG on GBP/USD with 56% of traders net long (as of this writing). At DailyFX we typically take a contrarian view to crowd sentiment resulting in a short-term downside disposition.

AUD/JPY IG Client Sentiment: Our data shows traders are now net-long AUD/JPY for the first time since Apr 13, 2023 when AUD/JPY traded near 89.93.

AUD/JPY IG Client Sentiment: Our data shows traders are now net-long AUD/JPY for the first time since Apr 13, 2023 when AUD/JPY traded near 89.93.

AUD/JPY: Retail trader data shows 50.42% of traders are net-long with the ratio of traders long to short at 1.02 to 1. In fact, traders have remained net-long since Apr 13 when AUD/JPY traded near 89.93, price has moved 0.61% higher since then. The number of traders net-long is 8.54% higher than yesterday and 28.99% higher from last week, while the number of traders net-short is 7.41% lower than yesterday and 8.85% lower from last week.

We typically take a contrarian view to crowd sentiment, and the fact traders are net-long suggests AUD/JPY prices may continue to fall.

Our data shows traders are now net-long AUD/JPY for the first time since Apr 13, 2023 when AUD/JPY traded near 89.93. Traders are further net-long than yesterday and last week, and the combination of current sentiment and recent changes gives us a stronger AUD/JPY-bearish contrarian trading bias.