New Zealand Dollar Looks Past PM Jacinda Ardern’s Resignation, Eyes on Wobbly Markets

New Zealand Dollar Looks Past PM Jacinda Ardern’s Resignation, Eyes on Wobbly Markets

Asia-Pacific Market Briefing – New Zealand Dollar Looks Past NZ PM Ardern Stepping Down

The New Zealand Dollar was little changed after reports crossed the wires that Jacinda Ardern, New Zealand’s Prime Minister, announced that she would step down by February 7th. She also called for an election on October 14th. While that may introduce some near-term political uncertainty for NZD/USD, the sentiment-linked currency likely remains focused on external matters.

NZD underperformed against its major counterparts on Wednesday. This followed a notable deterioration in risk appetite during the Wall Street trading session. By the end of the day, the Dow Jones, S&P 500 and Nasdaq 100 fell -1.81%, -1.56% and -1.24%, respectively. This is as the VIX market ‘fear gauge’ rose about 5%.

This followed a slew of disappointing US economic data. Retail sales clocked in at -1.1% m/m in December, worse than the -0.9% consensus. Meanwhile, PPI final demand printed 6.2% y/y for the same month. That was much lower than the 6.8% estimate. This continued to show signs of a cooling economy and placed the focus on the Federal Reserve.

The 2-year Treasury yield sank to 4.09%, the lowest close since September 2022. Markets continued pricing away Fed rate hikes for this year. Now, Fed Funds Futures indicate that traders anticipate only 32 basis points in tightening this year. That means one more hike at the next meeting with the odds of a second rapidly diminishing.

Instead of traders looking forward to a dovish pivot, price action over the past 24 hours indicated that the greater fear was of a more pronounced economic slowdown that would indicate more trouble ahead. Stocks fell, traders bought up bonds which brought down yields and the risk-linked New Zealand Dollar took a drip.

This is leaving NZD/USD vulnerable to more downside heading into Thursday’s Asia-Pacific trading session. The sour tone set by Wall Street might make its way into regional bourses, pressuring indices like the Nikkei 225, ASX 200 and Hang Seng Index. Haven seeking would open the door for the US Dollar to potentially pull ahead.

New Zealand Dollar Technical Analysis

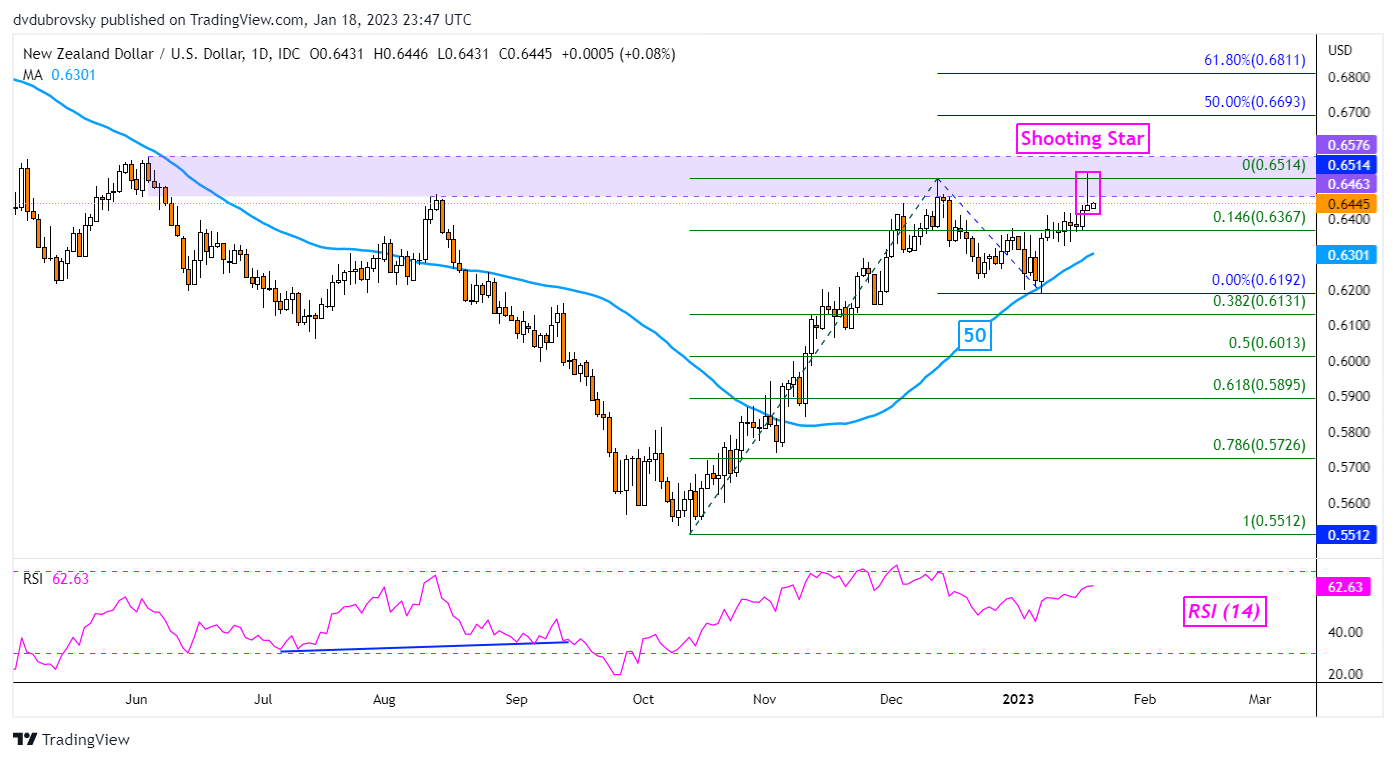
On the daily chart, NZD/USD has left behind a Shooting Star candlestick pattern. This is a sign of indecision as prices tried to push into the 0.6463 – 0.6576 resistance zone. While this doesn’t mean that a turn lower is in the cards, downside follow-through could open the door to a reversal. But, keep a close eye on the 50-day Simple Moving Average (SMA). It could hold as support, pivoting prices higher.

NZD/USD Daily Chart
NZD/USD Daily Chart


Australian Dollar Dipped After Slight Miss on Jobs Data. Where to for AUD/USD?

Australian Dollar Dipped After Slight Miss on Jobs Data. Where to for AUD/USD?

The Australian Dollar had a look lower after the unemployment rate came in at 3.5% for December against 3.4% previously and forecast.

There were -14.6k fewer jobs which were below the 25k forecast to be added and 58k prior.

Although a small miss, the unemployment rate continues to linger near multi-generational lows. Today’s numbers show that the labour market remains robust despite the Reserve Bank of Australia lifting the cash rate 3% from the pandemic emergency low.

The bank has stepped back large rate hikes and the futures market has a 50-50 chance of a 25 basis-point hike priced in for their February 7th monetary policy meeting.

Ahead of that meeting, the crucial fourth quarter CPI print will be released on Wednesday next week the 25th of January. The RBA has said that they expect it to rise to 8% later this year and if the price pressures move toward there sooner than they anticipate.

This would present a conundrum for the RBA and the projected rate path. Across the Pacific, the Federal Reserve continues to make it clear that it is going to continue tightening.

This became apparent overnight when US retail sales and PPI data were weaker than anticipated. The US Dollar initially softened and sent AUD/USD to a six-month peak at 0.7063.

Then several Fed speakers reiterated their hawkish stance and the ‘big dollar’ rallied across the board and the Aussie Dollar collapsed in the process. They mostly cited a 25 bp rise in rates as being appropriate rather than larger ones.

The Fed also has its Federal Open Market Committee (FOMC) meeting to decide on monetary policy and the market is expecting a 25 bp hike there on the 1st of February. The post-meeting commentary will be closely scrutinised for hints on rates going forward.

The next few weeks might be vital for AUD/USD and could see some clues for direction into 2023.

EUR/USD Forecast: Upcoming ECB Minutes to Augment Hawkish Bets?

EUR/USD Forecast: Upcoming ECB Minutes to Augment Hawkish Bets?

EURO FUNDAMENTAL BACKDROP

The euro has been receiving fundamental boosts from the both the U.S. and eurozone . Beginning with the EZ region, stickier inflation readings, lower energy costs and a hawkish central bank have all provided sustenance for the EUR. The European Central Bank (ECB) although late to the party in terms if their interest rate hiking cycle (relative to other major central banks) has been extremely aggressive in their stance of recent. Yesterday, the ECB’s Villeroy strongly defended President Christine Lagarde’s forward guidance in favor of a 50bps rate hike in the next meeting while this morning began with another ECB official (Klaas Knot) upholding the aggressive rhetoric by stating that “the ECB are planning to hike by 50bps multiple times.”

Later today, the President Lagarde is scheduled to speak at Davos (0930GMT) after which the ECB’s minutes (see economic calendar below) will take center stage. Both are expected to deliver the same hawkish message which could see the euro bid against the dollar.

From a USD point of view, concerns over U.S. economic growth by way of the recent misses on U.S. PPI and retail sales has cast a shadow over the greenback and has almost locked in a 25bps increment for the Fed’s next meeting in February. Hawkish Fed speakers are being largely dismissed by markets at this point which should follow the same path today with the Fed’s Collins, Brainard and Williams on the docket. U.S. building permits data are expected to push higher in December coming off extreme lows in November which may dampen dollar upside should actual data fall in line with estimates.

EUR/USD ECONOMIC CALENDAR

image1.png

EUR/USD DAILY CHART

image2.png

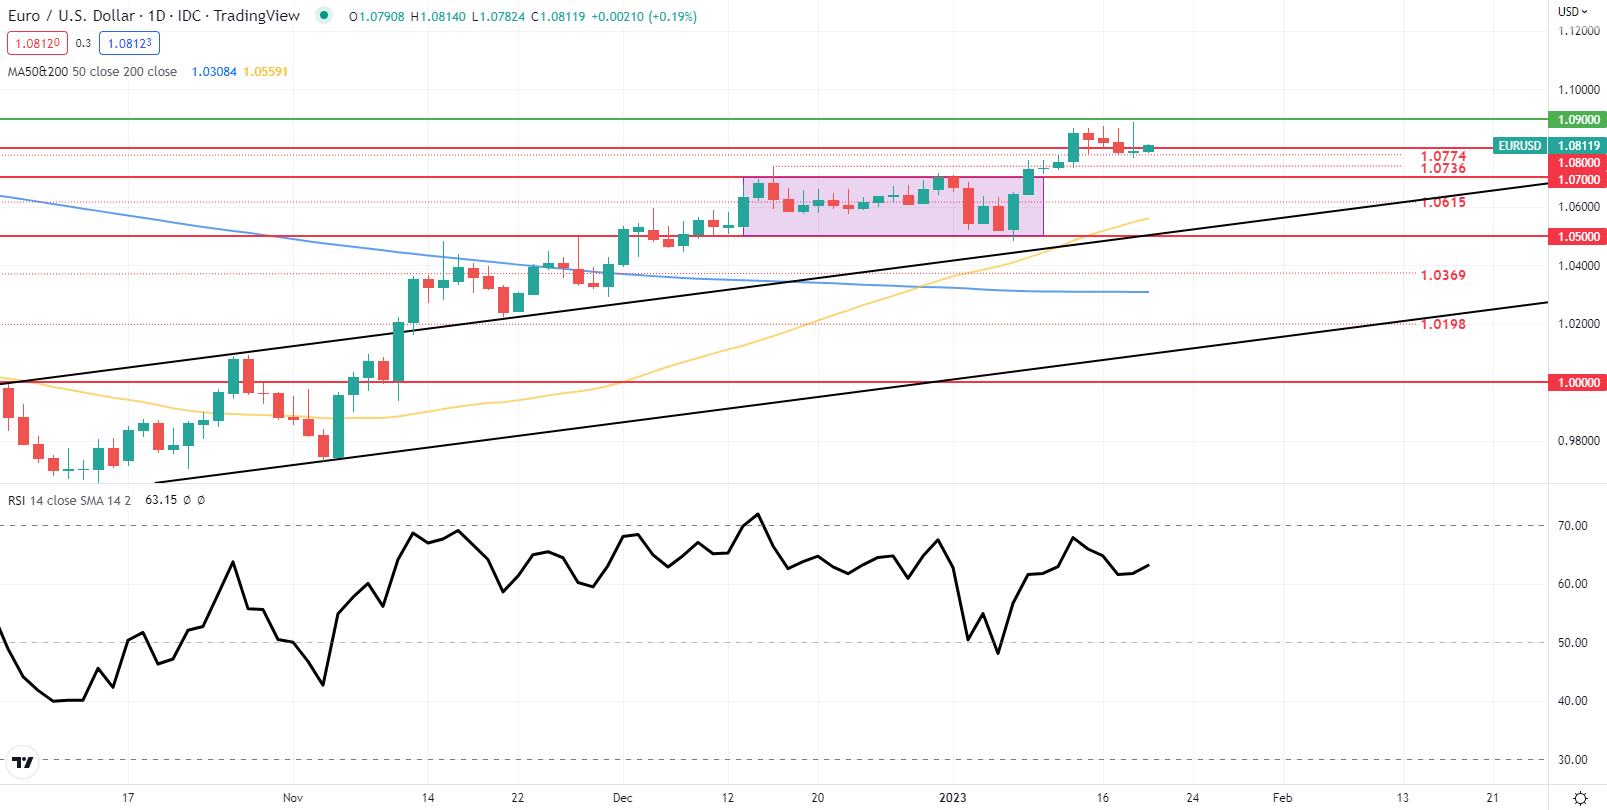
Daily EUR/USD price action shows a recent sideways consolidation appearing; however, yesterdays long upper wick could lead to subsequent downside – fundamentals would have to permit such a move. The euro has made a swift comeback reaching levels last seen in April of 2022 in roughly 3.5 months which may be why bulls are so wary to drive the market higher. The Relative Strength Index (RSI) echoes this sentiment with upside momentum showing signs of slowing (bearish/negative divergence). A slight dovish take on either the ECB Presidents address or the ECB’s minutes could spark a move lower.

Resistance levels:

  • 1.0900

Support levels:

  • 1.0800
  • 1.0774
  • 1.0736

BEARISH IG CLIENT SENTIMENT

IGCS shows retail traders are currently SHORT on EUR/USD, with 58% of traders currently holding short positions (as of this writing). At DailyFX we typically take a contrarian view to crowd sentiment; however, due to recent changes in long and short positioning, we arrive at a short-term bullish bias.


The US Dollar Bounces Back as Recession Fears Swirl. Where to for USD?

The US Dollar Bounces Back as Recession Fears Swirl. Where to for USD?

The US Dollar recovered from an eight-month low after soft data painted a concerning picture followed by several Federal Reserve talking tough on further rate hikes.

US retail sales for December were -1.1% month-on-month instead of the -0.9% anticipated and -0.6% prior. PPI for the same period was -0.5%, notably lower than the 0.1% forecast and 0.3% previously.

The numbers triggered fears of a recession and Wall Street finished the cash session lower with the major indices down well over a percent. Microsoft and Amazon announcing job cuts to their workforce didn’t help the mood.

Then a cavalcade of Fed speakers reminded markets of the impending rate hikes. Some pointed to 25 basis points (bp) being the most appropriate steps while St Louis Fed President James Bullard put the case forward to tighten more aggressively.

This pushed equities lower but assisted the US Dollar. The 2s 10s Treasury curve inverted another 5bp toward -0.70% on a bull flattening.

The Japanese Yen firmed today after the trade deficit for December was ¥ -1.448 billion, better than the estimates of ¥ -1.670 billion. The easing of energy prices and the impacts of an overall weaker Yen might be contributing to a better outcome for the archipelago nation.

The Bank of Japan also announced a technical tweak to its yield curve control (YCC) program that some commentators have equated to a slight easing in policy.

After making a six-month high in the New York session, the Australian Dollar stumbled on jobs data disappointment. The unemployment rate came in at 3.5% for December rather than the 3.4% anticipated and previously. Employment fell 14.k when forecasts were for 25k to be added.

Australian Commonwealth Government Bonds (ACGB) joined long-end Treasuries yields lower with the 10-year, collapsing around 30 bp. It is trading near 3.30% against 4.1% at the end of last month.

The New Zealand Dollar also slid lower after Prime Minister Jacinta Ardern announced her resignation on February 7th. She said that she ‘did not have enough in the tank’ to continue in the role.

Crude oil is under pressure with the WTI futures contract under US$ 79 bbl while Brent has traded below US$ 84 bbl today. Gold has found some shine as it approached US$ 1,910 an ounce.

Looking ahead, ECB President Christine Lagarde will be speaking from Davos and some Fed speakers will also be crossing the wires. Later on, the US will see data on housing starts, building permits and initial jobless claims.

The full economic calendar can be viewed here.

DXY (USD) INDEX TECHNICAL ANALYSIS

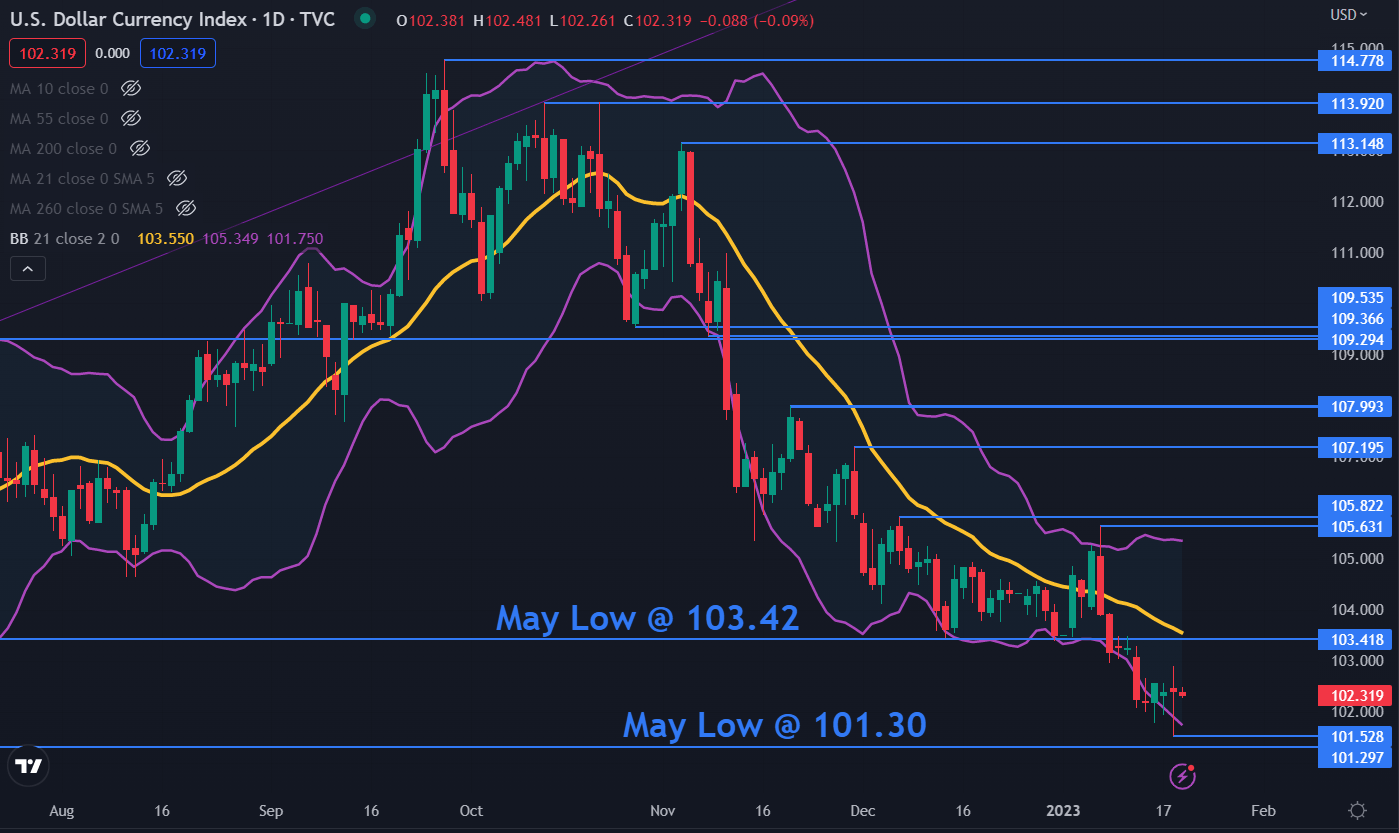
The DXY index made a low of 101.53 yesterday, just above the May low of 101.30. These levels may provide support.

The recent sell-off broke below the lower band of the 21-day simple moving average (SMA) based Bollinger Band. The close back inside the band might signal a pause in the bearish run or a potential reversal.

On the topside, resistance could be at the breakpoint of 103.42 or the prior peaks of 105.63 and 105.82.

image1.png


Crude Oil Prices Spooked by US Data, IEA Report as WTI Turns to EIA Inventories

Crude Oil Prices Spooked by US Data, IEA Report as WTI Turns to EIA Inventories

WTI crude oil prices fell 2.36 percent on Wednesday, marking the worst single-day drop in two weeks. The deterioration in energy prices was not an isolated event. A closer look at an intraday chart shows that oil prices fell alongside the S&P 500, which dropped the most in one month. This is as traders bought Treasuries, pushing prices up as yields came down in a flight to safety.

Risk aversion struck markets in the wake of softer-than-expected United States retail sales and wholesale inflation figures. This also caused markets to adjust monetary policy expectations. Now, Fed Funds Futures have almost fully priced out 2 rate hikes this year in favor of just a 25-basis point increase. Then, rate reductions are seen later in 2023. This continues to diverge from policymakers’ projections.

Focusing on oil-specific news, the International Energy Agency (IEA) released its latest report on the energy market. The IEA noted that the global oil supply could exceed consumption by about 1 million barrels per day in the first quarter. This is despite an anticipated demand revival from China, which is increasingly opening from lockdowns.

Looking at the remaining 24 hours, WTI will be eyeing the next inventory report from the Energy Information Administration (EIA). Oil stockpiles are seen shrinking by 13.21 million barrels in the previous week. That contrasts with a report by the American Petroleum Institute (API) that is looking at a buildup of 7.6 million barrels. An outcome towards the latter risks inducing further downside for oil.

Crude Oil Technical Analysis – Daily Chart

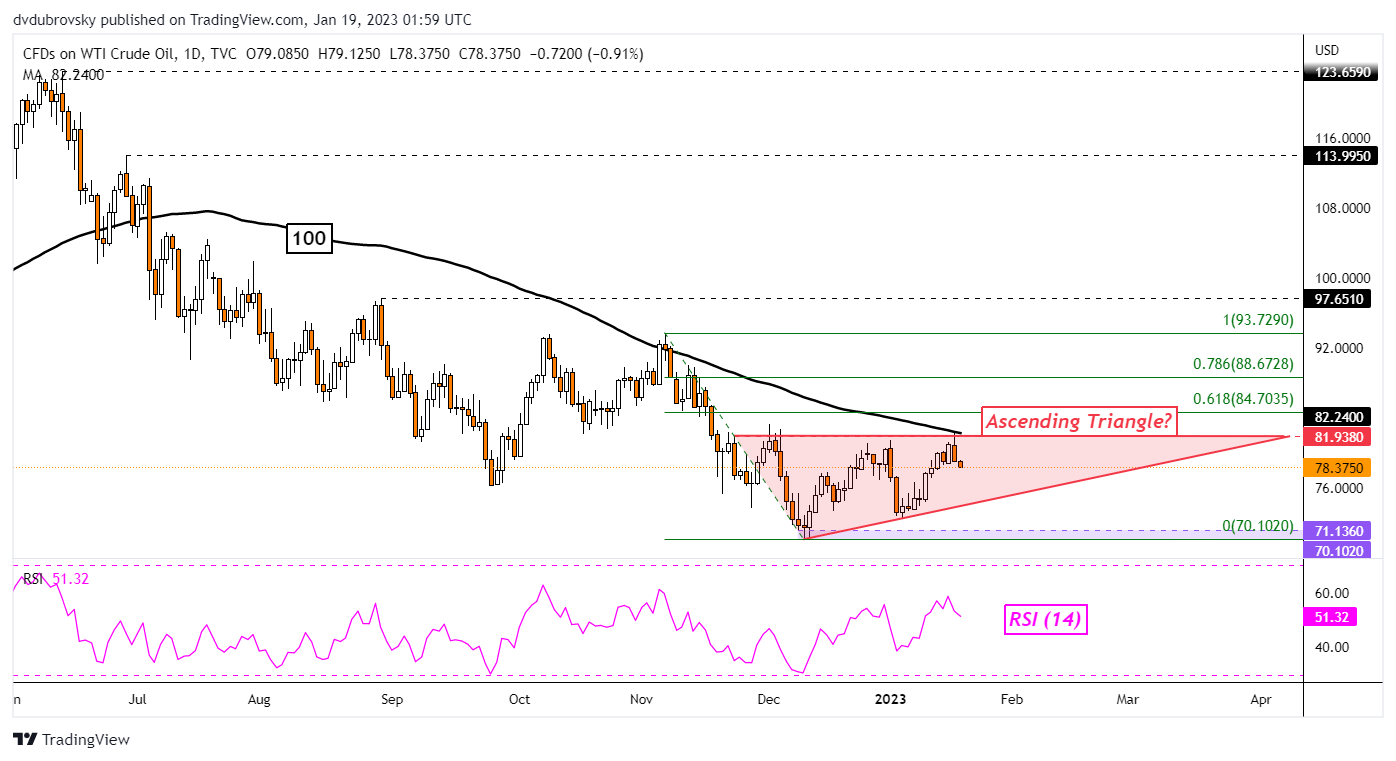
On the daily chart, WTI appears to be trading within the boundaries of an Ascending Triangle chart formation. This is typically a bearish pattern that may open the door to resuming the downtrend which preceded the triangle. Prices recently rejected the ceiling around 81.93, opening the door to a retest of the rising floor from December.

Crude Oil Technical Analysis – Daily Chart


EUR/USD Technical Outlook: At Crossroads

EUR/USD Technical Outlook: At Crossroads

EUR/USD TECHNICAL FORECAST – NEUTRAL

The Euro’s failure to extend gains against the US dollar following data last week that showed the dip in US inflation reinforcesthe near-term range outlookfor the single currency.

EUR/USD hasn’t been able to capitalize on last week’s gains following the rise above stiff resistance at the May 2022 high of 1.0786, coinciding with a slightly upward-sloping trendline from 2017. Over the past few days, it has held within the daily range high/low range of 12 January.

EUR/USD Daily Chart

image1.png

In general, the lack of follow-through price action after a technical break can be viewed as suspect. It can either be a false breakout or a case of lagged rise. In this regard, the resistance-turned-support at 1.0786 is crucial. A fall below the support would raise the odds of a false breakout, while a rebound from the support could raise the chance of a further rise in EUR/USD. The latter case could turn out to be a bullish flag/pennant formation.

EUR/USD Weekly Chart

image2.png

Any fall below 1.0786 could open the door toward quite a strong cushion at the early-January low of 1.0482. Furthermore, a break below 1.0482 would confirm that the upward pressure had faded somewhat, which could extend toward the 200-day moving average (now at about 1.0300). On the other hand, a decisive rise above last week’s high of 1.0867 could pave the way toward the 200-week moving average (now at about 1.1225) – a crucial barrier for the medium-term outlook.

Consumer price inflation, UK: December 2022

Consumer price inflation, UK: December 2022

1. Main points

  • The Consumer Prices Index including owner occupiers’ housing costs (CPIH) rose by 9.2% in the 12 months to December 2022, down from 9.3% in November.
  • The largest upward contributions to the annual CPIH inflation rate in December 2022 came from housing and household services (principally from electricity, gas, and other fuels), and food and non-alcoholic beverages.
  • On a monthly basis, CPIH rose by 0.4% in December 2022, compared with a rise of 0.5% in December 2021.
  • The Consumer Prices Index (CPI) rose by 10.5% in the 12 months to December 2022, down from 10.7% in November.
  • On a monthly basis, CPI rose by 0.4% in December 2022, compared with a rise of 0.5% in December 2021.
  • The largest downward contribution to the change in both the CPIH and CPI annual inflation rates between November and December 2022 came from transport (particularly motor fuels), clothing and footwear, and recreation and culture, with rising prices in restaurants and hotels, and food and non-alcoholic beverages making the largest partially offsetting upward contributions.

Back to table of contents

2. Consumer price inflation rates


Japanese Yen Crushed as Bank of Japan Disappoints, Policy Settings Left Unchanged

Japanese Yen Crushed as Bank of Japan Disappoints, Policy Settings Left Unchanged

The Japanese Yen weakened over 2 percent in the aftermath of January’s Bank of Japan monetary policy announcement. If losses are sustained, this will end up being the best single-day performance for USD/JPY since March 2020. Let us take a closer look at what happened here.

Well as it turns out, nothing much at all. The BoJ left all policy settings unchanged this month. This includes the policy balance rate (maintained at -0.1%) and the 10-year bond yield target of about 0%. Policymakers also mentioned that they would keep on with bond purchases with a degree of flexibility. That underscored the central bank’s intention to continue with yield curve control as planned.

To understand why the Yen swiftly weakened here, you need to go back to what happened in December. Last month, the central bank shocked markets by widening the yield curve band around 0% to plus/minus 50 basis points. That was from +/- 25bps. The central bank also increased asset purchases to JPY9 trillion each month from 7.3 trillion prior.

Markets viewed this as the central bank taking steps closer toward policy normalization. Skipping forward to last week, a story from Yomiuri Shimbun increased speculation that the central bank could take further steps toward policy tightening. As such, traders were heavily skewed towards some further adjustment today. When that did not happen, those bets were unwound.

So, where to for USD/JPY? Well, the currency seems vulnerable in the near term as markets will likely continue unwinding less-dovish bets that have been building up for the past few weeks. As it stands, the BoJ remains very dovish compared to its major peers. As such, the focus will shift to external factors ahead.

Over the remaining 24 hours, United State retail sales, PPI and industrial production could offer further clues about the health of the economy. Softer figures could see markets continue focusing on a Fed pivot. That may help USD/JPY come down slightly.

Market Reaction to Bank of Japan

Market Reaction to Bank of Japan

Japanese Yen Technical Analysis

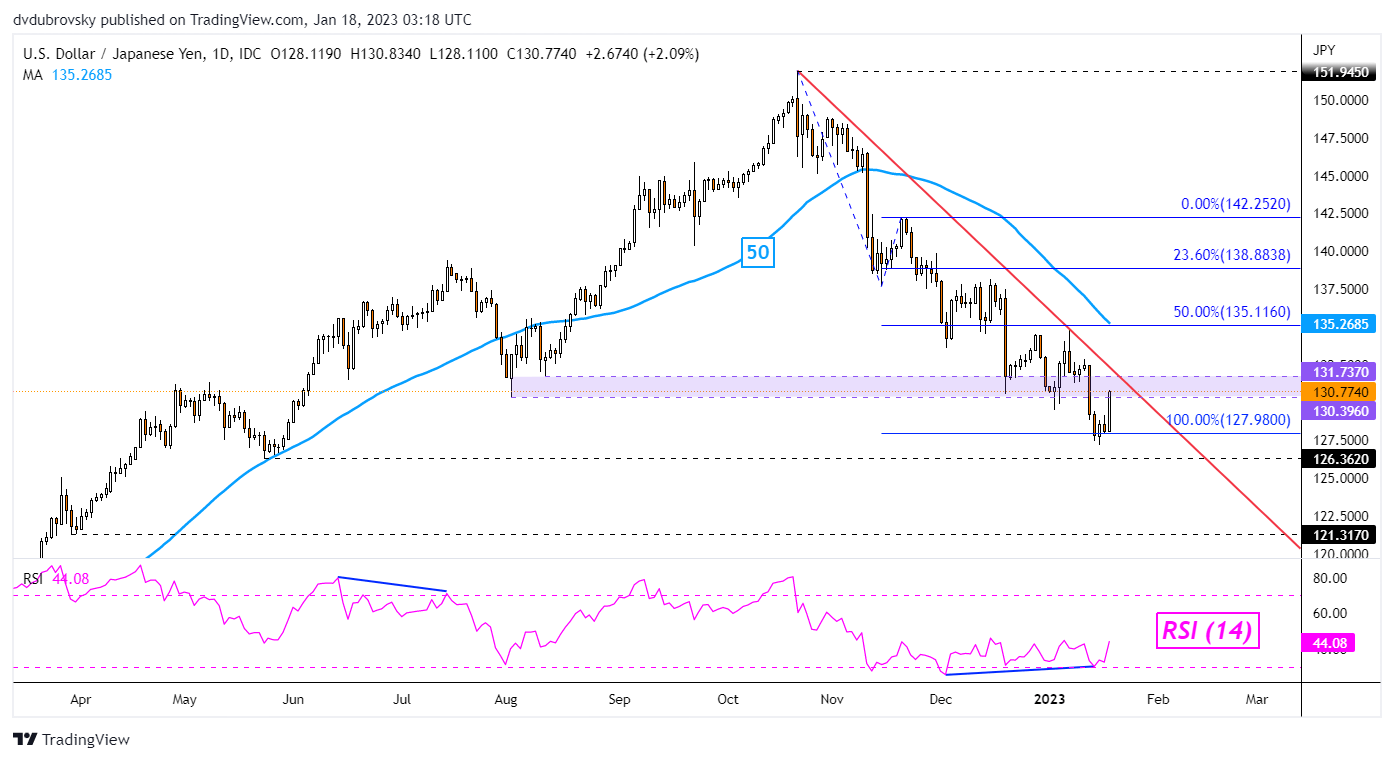
USD/JPY has bounced off the 100% Fibonacci extension level at 127.98 following the Bank of Japan. This follows persistent positive RSI divergence, which was already showing downside momentum fading. That is leaving the pair facing the former 130.39 – 131.73 support zone. The latter may now hold as new resistance. Keep a close eye on the falling trendline from October, which could maintain the downside bias. Otherwise, extending gains places the focus on the 50-day Simple Moving Average (SMA).

USD/JPY Daily Chart

USD/JPY Daily Chart


Bitcoin Technical Outlook: BTC/USD Turns Bullish

Bitcoin Technical Outlook: BTC/USD Turns Bullish

BITCOIN SHORT-TERM TECHNICAL OUTLOOK – BULLISH

Bitcoin’s break above key resistance in recent days has changed the trend bias to bullish from range.

After months of sideways price action characterized by low realized volatility, the momentum in Bitcoin appears to have finally picked up. BTC/USD has broken above key converged resistance on the 89-day moving average (a significant barrier since mid-2022), coinciding with another ceiling at the mid-December high of 18370. The break above the combined ceiling has paved way for the 200-day moving average and importantly implies that the short-term trend has turned bullish,as the previous update highlighted.

BTC/USD Daily Chart

image1.png

Importantly, the bullish break this month raises the odds further of a broader base building in cryptocurrencies –first highlighted mid-November as scenario 1.Interestingly, this month’s rise has meant that BTC/USD has retraced 100% of the November 2022 slide. When a market is able to retrace 100% of the last leg lower, it is often a sign of capitulation, suggesting that bears are exhausted for now.

BTC/USD Weekly Chart

image2.png

Having said that, because of the damage since 2021, any recovery path could be bumpy. Most immediately, BTC/USD needs to tackle resistance at the November high of 21470. A minor retreat wouldn’t be surprising given the significance of the hurdle. Still, there is ample support that could restrict the downside, starting with the 200-day moving average initially (now at about 19550), followed by the mid-December high of 18370. A break below 16300-16900 would confirm that the short-term upward pressure had reversed.

Beyond the short term, BTC/USD needs to clear the August 2022 high of 25200, coinciding with the 200-week moving average for the medium-term downward pressure to fade.

US Economic Release Snapshot: Inflation Expectations Fall

US Economic Release Snapshot: Inflation Expectations Fall

Each week, we break down the latest U.S. economic reports, including what the results mean for the overall health of the economy. Here, you will find how economists’ forecasts compare with actual results, key takeaways to consider, as well as a list of what’s on tap for the week ahead.

Reports for the Week of January 9

Consumer Price Index, December (Thursday)

  • Prior monthly CPI/core CPI growth: +0.1%/+0.2%
  • Expected monthly CPI/core CPI growth: –0.1%/+0.3%
  • Actual monthly CPI/core CPI growth: –0.1%/+0.3%
  • Prior year-over-year CPI/core CPI growth: +7.1%/+6.0%
  • Expected year-over-year CPI/core CPI growth: +6.5%/+5.7%
  • Actual year-over-year CPI/core CPI growth: +6.5%/+5.7%

Headline consumer prices fell by 0.1 percent in December, and year-over-year consumer inflation moderated as well. This report indicated that tight monetary policy is working to help combat inflation; however, there is still work to be done to get price growth back to the Fed’s target range.

University of Michigan consumer sentiment, preliminary January (Friday)

  • Expected/prior month sentiment: 60.7/59.7
  • Actual sentiment: 64.6

Consumer sentiment improved more than expected to start January, supported by falling short-term inflation expectations that came in below estimates. The report showed that one-year consumer inflation expectations fell from 4.4 percent in December to 4 percent in January against calls for a more modest drop to 4.3 percent.