No support coming for the Yen, the Loonie or even the Aussie in the near-term – SocGen

No support coming for the Yen, the Loonie or even the Aussie in the near-term – SocGen

USD/CHF is closer to being a sell than DXY is

“I can see no support coming for the Yen, the Loonie or even the Australian Dollar in the near-term.”

“But as the SNB reminds us, it’s more allergic to inflation than even the most hawkish central banks, GBP/CHF charts look ominous (sigh) and USD/CHF is closer to being a sell than DXY is.”

“Now, we head onwards to Friday’s BoJ meeting, UK GDP data and of course, US ISM and jobs. Thursday is setting itself up to be an in-between, not-very-exciting day. Maybe it’ll surprise. Maybe the snow will stick, the sun will come out and I’ll have a great day.”

Takata: Economic Activity, Prices, and Monetary Policy in Japan

Takata: Economic Activity, Prices, and Monetary Policy in Japan

I will begin my speech by talking about the current situation of economic activity and prices. The pace of recovery in overseas economies has slowed. Chart 1 shows developments in overseas economies in the January 2023 World Economic Outlook (WEO) Update released by the International Monetary Fund (IMF). Taking a detailed look by country and region, the U.S. economy has remained on a slowing trend, reflecting price rises and continued policy interest rate hikes, although firmness has been seen in private consumption. Since 2022, the Federal Reserve has continued to raise policy interest rates to address the highest level of inflation since the early 1980s. Although it has been gradually slowing the pace of rate hikes recently, the U.S. economy is expected to continue to slow as the significant rate increases are projected to have a cumulative impact over time.

In European economies, slowdowns have been observed, mainly with price rises pushing down private consumption, as these economies have continued to be affected by the situation in Ukraine. As for the outlook, European economies are likely to slow, reflecting the impact of policy interest rate hikes. The European Central Bank has also taken an aggressive tightening stance to address the highest level of inflation since the introduction of the euro currency in 1999.

With adjustments continuing to be made in its real estate market, the Chinese economy has slowed, reflecting the impact of COVID-19. China has experienced a surge in COVID-19 infections after reversing its zero-COVID policy in December 2022. While movement toward the normalization of economic activity has been seen recently, the pace of recovery in the Chinese economy is expected to be moderate, partly due to the impact of the pandemic on employment and income and to adjustment pressure remaining in the real estate market. However, if the impact of COVID-19 subsides and the normalization of economic activity progresses more rapidly than expected, the economy could grow faster. Thus, the outlook for the Chinese economy is highly uncertain as it entails both upside and downside risks. Meanwhile, emerging and commodity-exporting economies other than China have picked up on the whole, albeit with weakness seen in part.

Despite being affected by high commodity prices, Japan’s economy has picked up as the resumption of economic activity has progressed while public health has been protected from COVID-19. Chart 2 shows developments in the real GDP growth rate and the contribution of GDP components such as private final demand, public demand, and external demand (net exports). Real GDP increased for the latest October-December quarter, registering 0.6 percent on an annualized basis, as private final demand, which includes business fixed investment and private consumption, increased moderately. However, as Chart 3 shows, Japan’s real GDP has become only slightly higher than in the October-December quarter of 2019, just before the outbreak of COVID-19, and the pace of recovery from the downturn caused by the pandemic has been moderate compared with the United States and Europe.

Turning to prices in Japan, the year-on-year rate of change in the consumer price index (CPI) for all items less fresh food has been in the range of 4.0-4.5 percent due to rises in the price of such items as energy, food, and durable goods. Chart 4 compares inflation rates in Japan, the United States, and Europe. Japan’s inflation rate has been relatively low, and unlike in the United States and Europe, where the rise in services prices has significantly pushed up overall inflation, Japan’s inflation has been mainly led by higher goods prices due to cost-push factors stemming from a rise in import prices.

B. Outlook

I would like to explain the Bank of Japan Policy Board members’ baseline scenario of the outlook for economic activity and prices in Japan. The economy is likely to recover toward the middle of the projection period, with the impact of COVID-19 and supply-side constraints waning and with support from accommodative financial conditions and the government’s economic measures, although it is expected to be under downward pressure stemming from high commodity prices and slowdowns in overseas economies. Thereafter, as a virtuous cycle from income to spending gradually intensifies, Japan’s economy is projected to continue growing at a pace above its potential growth rate. Chart 5 shows the forecasts for economic activity and prices presented in the January 2023 Outlook for Economic Activity and Prices (Outlook Report). In terms of the median of the members’ forecasts, the real GDP growth rate is projected to be 1.9 percent for fiscal 2022, 1.7 percent for fiscal 2023, and 1.1 percent for fiscal 2024. Comparing the projections with those presented in the October 2022 Outlook Report, the projected growth rates for fiscal 2023 and 2024 are somewhat lower. The lower projection for fiscal 2023 mainly reflects the downward deviation in overseas economies from the previous baseline scenario, although the government’s economic measures are likely to make a positive contribution to the growth rate. The lower projection for fiscal 2024 reflects the waning effects of those economic measures.

The year-on-year rate of increase in the CPI for all items less fresh food is expected to decelerate toward the middle of fiscal 2023 due to the diminishing effects of a pass-through to consumer prices of cost increases led by a rise in import prices, as well as to the effects of the government’s economic measures pushing down energy prices. Thereafter, it is projected to accelerate again moderately on the back of an improvement in the output gap, rises in medium- to long-term inflation expectations and in wage growth, and the waning effects of the economic measures that have been pushing down energy prices. In terms of the median of the Policy Board members’ forecasts, the year-on-year rate of change in the CPI is expected to be 3.0 percent for fiscal 2022, 1.6 percent for fiscal 2023, and 1.8 percent for fiscal 2024. Comparing the projections with those presented in the October Outlook Report, the projected rate of increase in the CPI for fiscal 2023 is more or less unchanged, as the effects of such factors as the pass-through to consumer prices of cost increases led by a rise in import prices are likely to offset the pushing down of energy prices by the government’s economic measures. The projected rate of increase in the CPI for fiscal 2024 is somewhat higher due to the waning effects of the economic measures that have been pushing down energy prices.

C. Risks to the Outlook

So far, I have explained the Policy Board members’ baseline scenario of the outlook for economic activity and prices. I would now like to discuss a few points to which I am attentive with regard to risks to the outlook.

The first involves developments in overseas economic activity and prices. There has recently been significant difference between economic cycles in Japan and those abroad, partly reflecting diverging monetary policy responses. Following the shift to a floating exchange rate system in the 1970s, the monetary policy stances of advanced economies and their corresponding economic cycles were largely in sync. However, since 2022, the United States and Europe in particular have been compelled to pursue aggressive monetary tightening to address the rise in inflation. On this point, the situation in Japan, unlike in the United States and Europe, does not warrant a change in monetary policy stance, because the inflation rate in Japan has been comparatively low and the recent higher inflation is largely attributable to cost-push factors led by a rise in import prices. Therefore, as I mentioned earlier, Japan’s economy is expected to continue recovering at a relatively moderate pace, partly owing to the effects of large-scale monetary easing. If overseas economies experience sharper slowdowns, there is a risk that Japan’s economic activity and prices will be under stronger downward pressure.

The second point involves uncertainties regarding firms’ wage-setting behavior. Wage hikes play a crucial role in achieving a virtuous cycle between economic activity and prices triggered by improvement in corporate profits. However, it has been difficult to predict the course of this spring’s labor-management wage negotiations due to uncertainties about overseas economies. Firms may remain cautious about raising base pay, given that base pay hikes, which represent an across-the-board pay rise, could lead to a heavier burden on firms, including higher retirement benefits and pensions. As Chart 6 shows, wage growth in Japan has been at around only 2 percent for more than 20 years, even when including seniority- and performance-related wage increases. If firms remain cautious, there is a risk that future wage growth will be insufficient and that sustained inflation will not be achieved. On the other hand, wage hikes from this spring onward could be higher. The Japanese Trade Union Confederation, or Rengo, has set a 5 percent target for wage growth, including seniority- and performance-related wage increases, given that firms and society at large have become more aware than in recent years of the importance of base pay increases. For example, some firms have taken a more positive stance toward raising wages in light of inflation, amid tightening labor market conditions. In the early 1990s, I was heading up the employee union of the bank I was working at. The union was demanding an increase in base pay from management. My experience back then was that unions typically negotiated on the basis of a “living wage,” or a wage level that is necessary to maintain living standards, asking for an increase in base pay that would offset the previous year’s decrease in real income stemming from inflation. Although the idea of a “living wage” virtually disappeared after the collapse of the bubble economy, there has recently been a gradual return to wage increases that take into account the rise in prices, and I am paying attention to these wage developments.

The third point that I am attentive to is the possible effects of macroeconomic policies across countries and regions, especially how asset markets will be affected by global monetary tightening, particularly as conducted in the United States and Europe. Policy interest rate hikes in the United States will also affect emerging economies, which are still on their way to recovery from the pandemic, through capital flows in global financial markets. It is essential to note that the burden of U.S. dollar-denominated debt in emerging economies will grow as the dollar continues to appreciate. Furthermore, attention should be paid to whether hidden risks are building up outside the realm of conventional financial institutions, among so-called non-bank financial intermediaries.

In addition to these points, close attention is warranted over how the course of COVID-19 at home and abroad will affect private consumption and firms’ export and production activities, and how geopolitical risks, such as the situation in Ukraine since 2022, will impact the world economy, global financial markets, and the price of commodities, including grain. Given that “once in a century” risk events such as the COVID-19 pandemic and the Ukraine crisis have occurred nearly every year, it is vital to be prepared for such low-probability but high-impact tail events.

EUR/USD Price Analysis: Support structure stands in the way of a full blown breakout

EUR/USD Price Analysis: Support structure stands in the way of a full blown breakout

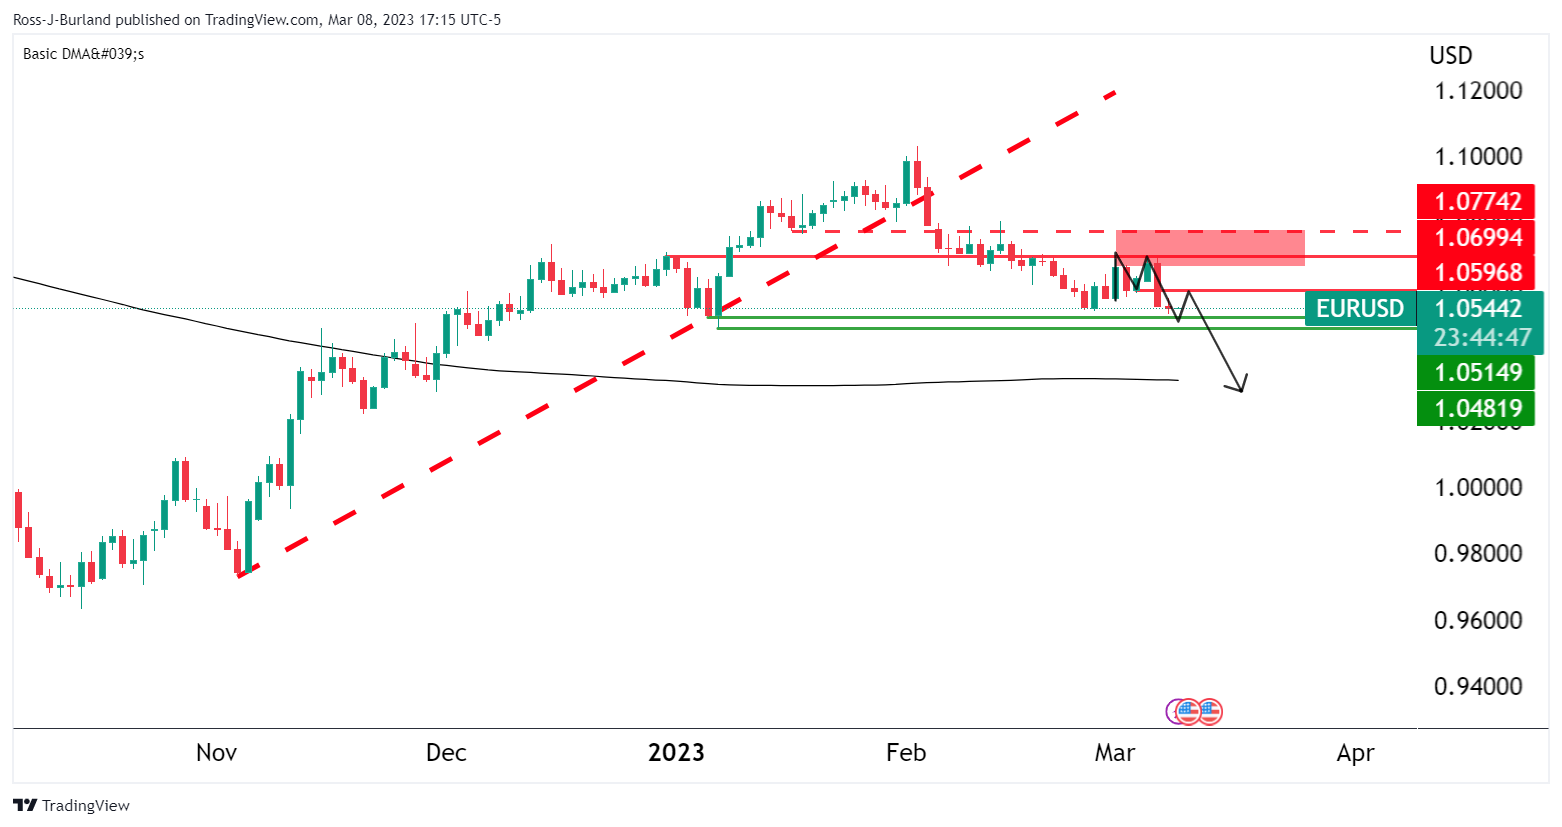
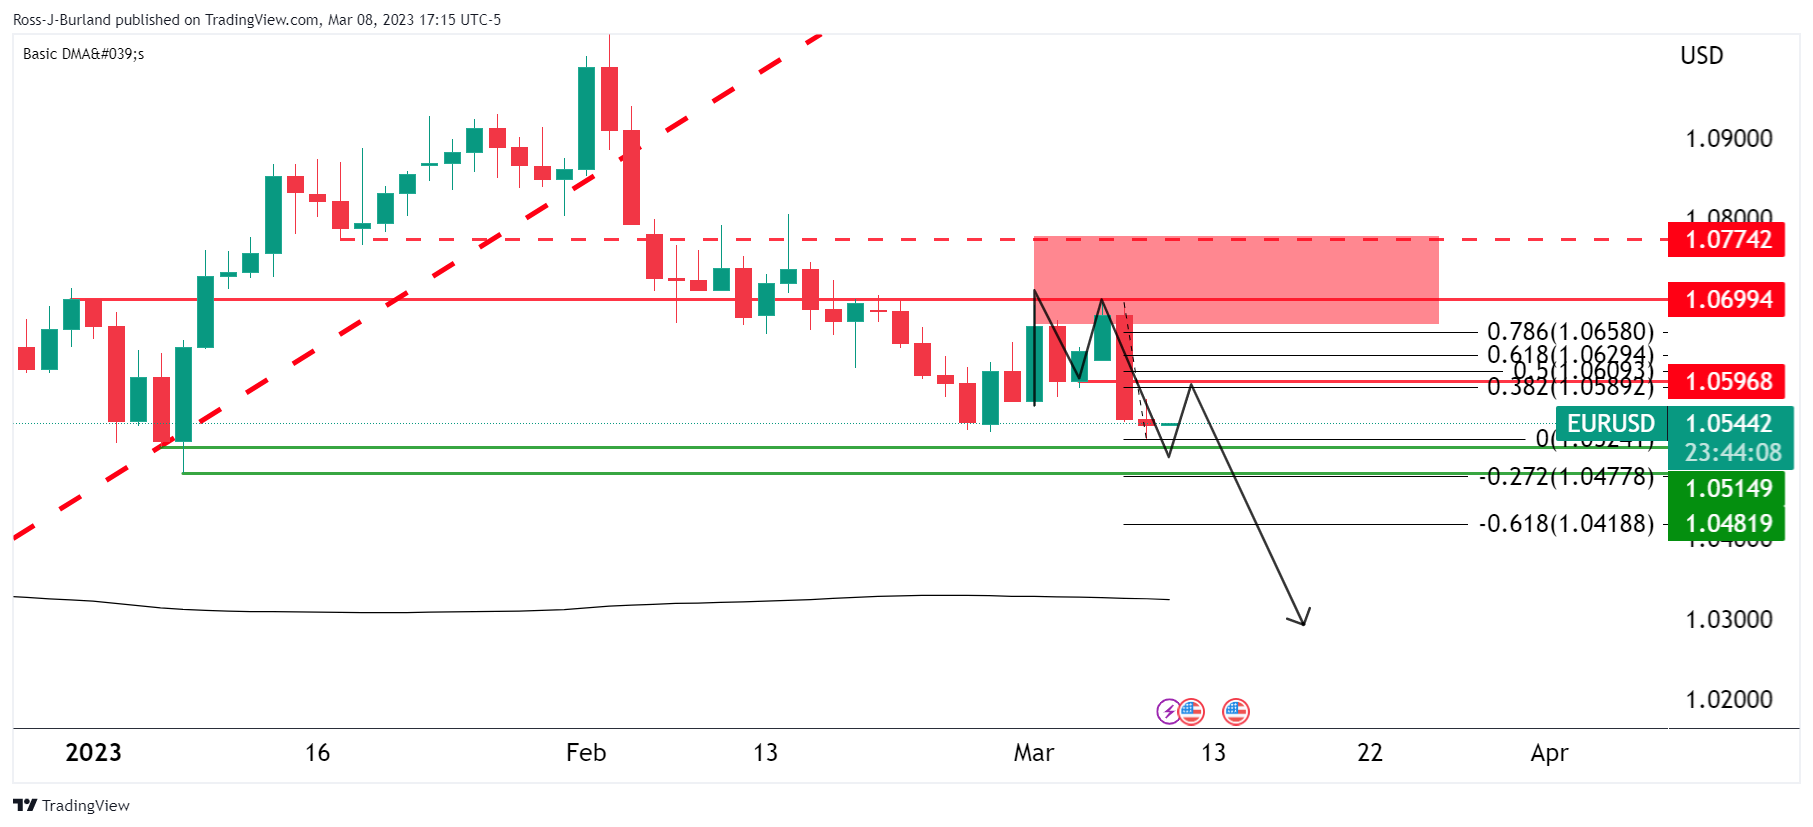
EUR/USD was little changed at 1.0547 but it fell to 1.0524 was trading just above this year’s low of 1.04820 reached on Jan. 6. after Federal Reserve Chairman Jerome Powell offered no major surprises on his second day of testimony before Congress and as investors waited for jobs data on Friday.

The Fed’s decisions will be hinging on data to be issued before the US central bank’s policy meeting in two weeks which makes this week’s US nonfarm Payrolls event key for EUR/USD. The price is rested above key structural support ahead of the event as the following illustrates:

EUR/USD daily charts

The price has carved out an M-formation which is a pattern that tends to see a retest of the neckline near a 50% mean reversion in this particular case.  1.0520 guards 1.0480 while bulls will need to get above 1.06 to open risk to 1.0700.

Euro Technical Outlook – Trapped in the Range. Will EUR/USD Breakout?

Euro Technical Outlook – Trapped in the Range. Will EUR/USD Breakout?

EUR/USD TECHNICAL ANALYSIS

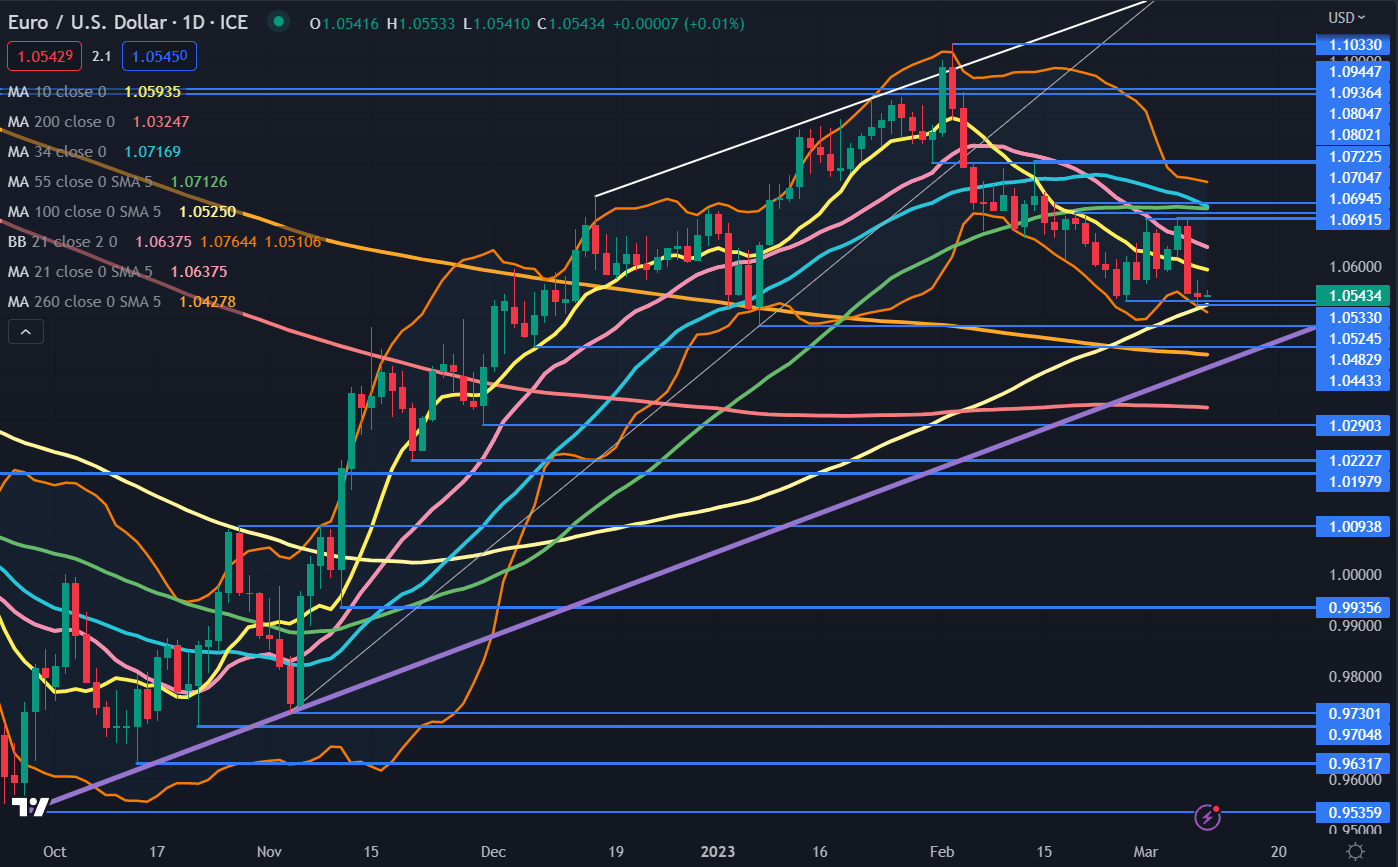
EUR/USD has been in a 1.0524 – 1.0722 range for three weeks despite several attempts to overcome both the topside and lower end of this range.

The peaks have setup potential resistance in the 1.0700 – 1.0720 area while the lows appear to be under threat but might provide near-term support in the 1.0524 – 1.0533 zone.

Overall, EUR/USD remains in an ascending trend channel and support could be at the lower bound of the channel, currently at 1.0410. Ahead of there, the previous lows of 1.0483 and 1.0443 may lend support.

The snap lower in response to comments made by Federal Reserve Chair Jerome Powell saw the US Dollar rally more broadly with rising Treasury yields. The benchmark 2-year bond traded at its highest yield since June 2007 above 5% overnight.

The EUR/USD price broke below the 10- and 21-day simple moving averages (SMA) and remains below the 34- and 55-day SMAs.

The 34-day SMA appears to be about to cross below the 55-day SMA. If this happens, it will form a Death Cross.

The longer-term 100-, 200- and 260-day SMAs remain below the and may provide support. A break below all three would see the ascending trend line broken and might suggest that bearish momentum has picked up steam.

At the same time, if that move was to occur soon, the price would trade outside the lower band of the 21-day Simple Moving Average (SMA) based Bollinger Band.

This price action could confirm the start of a new trend if there are several closes outside the lower band. A close back inside the band may suggest a pause in the bearishness or a potential reversal.

At the very least, a widening of the bands might indicate the expanding volatility is possibly opening the opportunity for more choppy trading conditions.

Resistance could be further up at the breakpoints and prior peaks of 1.0805, 1.0936, 1.0945 and 1.1030.

image1.png


Japanese Yen Price Setup Ahead of BOJ: USD/JPY, EUR/JPY, AUD/JPY

Japanese Yen Price Setup Ahead of BOJ: USD/JPY, EUR/JPY, AUD/JPY

US jobs data could overshadow the outcome of the Bank of Japan (BOJ) meeting on Friday.

The BOJ is widely expected to keep monetary policy settings steady, including interest rates and yield cap settings given that the central bank tweaked and adjusted the yield band as recently as December and given that this is the current Governor Kuroda’s last meeting as the central bank chief (term ends April 8).

The focus appears to be on US jobs data due later Friday after US Fed Chair Powell on Wednesday reiterated his message of higher and faster interest rate hikes, but stressed that the decision depends on incoming data, especially Friday’s jobs data and CPI numbers due next week. “We have not made any decision,” Powell said.

Although the growth of the non-farm payroll likely slowed to 224,000 in February, slower from 443,000 in January, unemployment is expected to hold near the five-decade low of 3.4%, suggesting that the jobs market remains hot. Meanwhile, consumer price inflation is expected to have slowed to 6.0% on-year in February from 6.4% in January, but core CPI remained steady at 0.4% on-month. Stronger-than-expected jobs and inflation data could shift the needle in favor of a 50-basis points rate hike at the next FOMC meeting Mar. 21-22.

USD/JPY Daily Chart

image1.png

US rates futures market is pricing in about an 80% chance of a 50 bps move at the next FOMC meeting after Powell on Tuesday stepped up hawkishness, saying the ultimate rate peak likely to be higher than expected and the central bank is prepared to increase the pace of rate hikes if needed. Pricing for the terminal fed funds rate stands at 5.67% by September from 5.48% before Powell’s testimony, and 5% at the end of January, close to 100 bps higher than the current Fed policy rate of 4.50%-4.75%.

In the meantime, what are the USD/JPY, EUR/JPY, and AUD/JPY charts saying?

USD/JPY 240-minute Chart

image2.png

USD/JPY – At crossroads

Despite the increased Fed hawkishness, USD/JPY continues to flirt with a tough resistance area at 135.00-138.00, including the early-January high, the 200-day moving average, not too far from the December high of 138.20. For more discussion on the topic see “Japanese Yen Forecast: High Bar for USD/JPY to Crack Resistance”, published February 26. To be fair, USD/JPY’s upward momentum on intraday charts remains intact (see color-coded candlestick charts based on trending/momentum indicators). Unless the pair breaks below a horizontal trendline from mid-February at about 135.25, the short-term upward pressure is unlikely to dissipate anytime soon (see previous update highlighting the point).

EUR/JPY – Rally showing signs of fatigue?

EUR/JPY is beginning to look heavy. Any break below a horizontal line from mid-February at about 144.10 would trigger a minor triple top pattern (the end-February and the early-March highs), opening the door toward the mid-January high of 142.85.

EUR/JPY 240-minute Chart

image3.png

AUD/JPY – Risk of a double top

AUD/JPY is testing a crucial cushion at the February low of 90.20. Any break below would trigger a minor double-top pattern (the January and February highs) with a potential price objective of around 87.50, near the December low of 87.00.

AUD/JPY Daily Chart

image4.png

USD/CAD flat-lines around 1.3800 mark amid softer USD, bullish potential intact

USD/CAD flat-lines around 1.3800 mark amid softer USD, bullish potential intact

The USD/CAD pair enters a bullish consolidation phase and oscillates in a narrow trading band around the 1.3800 mark, just below its highest level since October touched earlier this Thursday.

The subdued price action comes on the back of a modest US Dollar pullback from over a three-month high. This, along with an uptick in Crude Oil prices underpin the commodity-linked Loonie and acts as a headwind for the USD/CAD pair. That said, the downside remains cushioned amid hawkish Fed expectations and worries about a deeper global economic downturn.

In fact, the markets have started pricing in a jumbo 50 bps lift-off at the upcoming FOMC meeting on March 21-22. The bets were lifted by Fed Chair Jerome Powell on Wednesday, reiterating that interest rates would have to go higher and possibly faster to tame stubbornly high inflation. This remains supportive of elevated US Treasury bond yields and favours the USD bulls.

Meanwhile, the prospects for further tightening the Fed add to worries about economic headwinds stemming from rapidly rising borrowing costs. This, along with fading optimism over a strong Chinese economic recovery, which could dent fuel demand, should keep a lid on Crude Oil prices, suggesting that the path of least resistance for the USD/CAD pair is to the upside.

The bullish outlook is reinforced by the fact that the Bank of Canada became the first major central bank to pause its rate-hiking cycle on Wednesday amid signs of easing inflationary pressure. The USD/CAD pair seems poised to aim to reclaim the 1.3900 mark and extend the positive momentum further towards the October 2022 swing high, around the 1.3975-1.3980 zone.

Traders now look to the US economic docket, featuring the release of Challenger Job Cuts and the usual Weekly Initial Jobless Claims data, due later during the early North American session. The focus, however, will remain on the monthly Canadian jobs data, which, along with the crucial US NFP report, should provide a fresh directional impetus to the USD/CAD pair.

Learn to Take Losses Like a Winner

Learn to Take Losses Like a Winner

Nobody likes to be a loser, but taking losses well is required in order to be a winner. Just ask some of the most prolific hedge fund managers of all time. George Soros once said (I’m paraphrasing), it isn’t about being right, it’s about how much you make when you are right versus how much you lose when you are wrong.

Soros’ extremely successful disciple, Stanley Druckenmiller, once said in an interview that he estimates he is right about 60% of the time. This means he is wrong 40% of the time. Paul Tudor Jones, another billionaire macro legend, once said he is wrong about as often as he is right, but he also echoed Soros by saying that what matters the most is how much he makes on his winners when right versus how big the losses are when wrong.

That means that some of the most successful hedge fund managers in the world are wrong, a lot. And they don’t care because it is part of the game and not what really matters most. What they care about is managing the risk on their ideas and seeking asymmetry between their winning and losing ideas.

Accepting losing is of course easier said than done given it is human nature to dislike losing, so for many taking losses frequently can be a jagged pill to swallow. But you should embrace it, actually, because it is just part of the game and what will keep you in the game in the long run. Furthermore, the faster an idea hits its stop the faster you can move onto the next potential winner.

Not all losses are created equally. What should raise red flags is when you are constantly taking losses, or taking outsized losses relative to your wins. A loss could be a function of market conditions not conducive to your trading style/strategy, or it could be something deeper that implies you are not consistently following your trading rules.

When suffering a losing period (drawdown) take a close look at what you are doing. Examine your trade log, go through your journal, see if you are following your trading plan or deviating. If deviating, then you need to figure out what you need to do to get back on track. This is when losing isn’t acceptable, because it is self-inflicted.

However, if you are following your plan it could be a function of a market not conducive to your strategy, and while you should be flexible to adapting to market conditions, a solid time-proven strategy over multiple cycles should still come out ahead. The key here is to be consistent and seeing the strategy through the ups and downs.

Resources for Forex Traders

Whether you are a new or experienced trader, we have several resources available to help you; indicator for tracking trader sentiment, quarterly trading forecasts, analytical and educational webinars held daily, trading guides to help you improve trading performance, and one specifically for those who are new to forex.

Euro Latest: Euro Area Growth Flatlines, EUR/USD Dancing to Powell’s Tune

Euro Latest: Euro Area Growth Flatlines, EUR/USD Dancing to Powell’s Tune

Euro Area q/q growth flatlined in the last three months of 2022, in line with market expectations, while y/y growth rose by 1.8%, a fraction under market forecasts, according to the Eurostat, the statistical office of the European Union. Greece (+1.4%) recorded the highest increase of GDP compared to the previous quarter, followed by Malta (+1.2%) and Cyprus (+1.1%). The highest decreases were observed in Poland (-2.4%), Estonia (-1.6%) and Finland (-0.6%). The Euro Area recorded growth of 0.3% in the third quarter.

image1.png

For all market-moving events and economic data releases, see the real-time DailyFX Calendar

German data released earlier today showed retail sales weakening by more than expected while industrial production picked up sharply, beating forecasts easily.

image2.png

EUR/USD is little changed post-GDP data and remains at, or very close to, lows last seen at the start of January. A further re-pricing of US interest rate expectations, fueled by Fed chair Jerome Powell’s hawkish testimony to the Senate yesterday, powered the greenback higher against a range of currencies and hit risk sentiment hard. US 2-year bond yields touched a fresh 15-year high of 5.04%, while markets are now pricing in a 50 basis point rate hike at this month’s FOMC policy meeting.

EUR/USD broke out of the bearish flag formation we have following recently and currently trades just below 1.0550. Big figure support at 1.0500 is likely to hold any further sell-off in the short term although if Friday’s US Jobs Report is stronger-than-expected, this level will come under heavy pressure. Below here, 1.0460 comes into play.

EUR/USD Daily Price Chart – March 8, 2023

image3.png

USD/CAD sits near its highest level since November, above mid-1.3600s ahead of BoC

USD/CAD sits near its highest level since November, above mid-1.3600s ahead of BoC

The USD/CAD pair builds on the previous day’s bullish breakout momentum through the 1.3700 mark and climbs to its highest level since early November on Wednesday. The pair holds steady above mid-1.3700s through the first half of the European session and seems poised to prolong its recent upward trajectory witnessed over the past three weeks or so.

The emergence of fresh selling around Crude Oil prices undermines the commodity-linked Loonie, which, along with sustained US Dollar buying, continues to act as a tailwind for the USD/CAD pair. Investors remain worried that rapidly rising borrowing costs will dampen global economic growth and dent fuel demand. Apart from this, fading optimism over a strong economic recovery in China drags the black liquid lower for the second successive day.

The USD, meanwhile, stands tall near a multi-month peak and continues to draw support from the overnight hawkish remarks by Federal Reserve Chair Jerome Powell. In the prepared remarks for his semi-annual congressional testimony, Powell indicated that interest rates might need to go up faster and higher than previously anticipated. Powell further added that the US central bank is prepared to increase the pace of rate hikes to combat stubbornly high inflation.

This, in turn, lifts bets for a jumbo 50 bps lift-off at the March FOMC meeting and remains supportive of elevated US Treasury bond yields. In fact, the yield on the benchmark 10-year US government bond is holding steady near the 4.0% threshold and the rate-sensitive two-year Treasury note hovers near its highest level since 2007. This, along with growing worries about economic headwinds stemming from rapidly rising borrowing costs, benefits the safe-haven buck.

That said, signs of stability in the equity markets hold back the USD bulls from placing aggressive bets. Traders also seem reluctant and prefer to wait on the sidelines ahead of the Bank of Canada (BoC) meeting later this Wednesday. The Canadian central bank is expected to pause its tightening cycle and leave the overnight rate unchanged. This widens the Fed-BoC policy divergence and supports prospects for a further near-term appreciating move for the USD/CAD pair.

Traders on Wednesday will further take cues from the US economic docket, featuring the release of the ADP report on private-sector employment and JOLTS Job Openings data. This, along with Powell’s second day of congressional testimony, the US bond yields and the broader risk sentiment, will drive the USD demand. Apart from this, Oil price dynamics might further contribute to producing short-term trading opportunities around the USD/CAD pair.

Technical levels to watch

USD/CAD

Overview
Today last price 1.3756
Today Daily Change 0.0004
Today Daily Change % 0.03
Today daily open 1.3752
Trends
Daily SMA20 1.3516
Daily SMA50 1.3464
Daily SMA100 1.3501
Daily SMA200 1.3295
Levels
Previous Daily High 1.3761
Previous Daily Low 1.36
Previous Weekly High 1.3659
Previous Weekly Low 1.3534
Previous Monthly High 1.3666
Previous Monthly Low 1.3262
Daily Fibonacci 38.2% 1.37
Daily Fibonacci 61.8% 1.3661
Daily Pivot Point S1 1.3647
Daily Pivot Point S2 1.3543
Daily Pivot Point S3 1.3486
Daily Pivot Point R1 1.3808
Daily Pivot Point R2 1.3865
Daily Pivot Point R3 1.397