British Pound (GBP) Forecast: Fading Risk Sentiment Knocks Back Sterling

British Pound (GBP) Forecast: Fading Risk Sentiment Knocks Back Sterling

GBP/USD FUNDAMENTAL BACKDROP

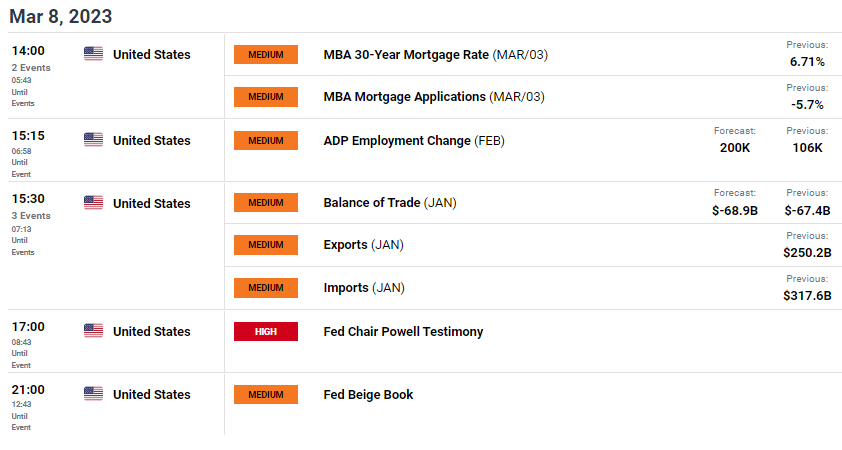
The pound is reacting negatively to the more aggressive guidance given by Fed Chair Jerome Powell during his testimony in front of the Senate Banking Committee yesterday. Naturally, the USD found support against all major currencies including GBP. Although there was some positive UK economic data yesterday (housing and retail sales), the scale of the dollar move outweighed any upside. Today, the US theme will continue to dominate the trading session and markets are keenly awaiting the ADP report (see economic calendar below) for February as well as the Fed Beige book that summarizes current economic conditions by filtering data from each District. Expectations for the ADP employment change is favoring a higher print which will only heighten the comments made from Fed Chair Jerome Powell yesterday and reiterate the tight labor market conditions in the US. Day 2 of Mr. Powell’s testimony is unlikely to touch on monetary policy issues hence the focus on ADP and the Beige book.

GBP/USD ECONOMIC CALENDAR

image1.png

TECHNICAL ANALYSIS

GBP/USD DAILY CHART

image2.png

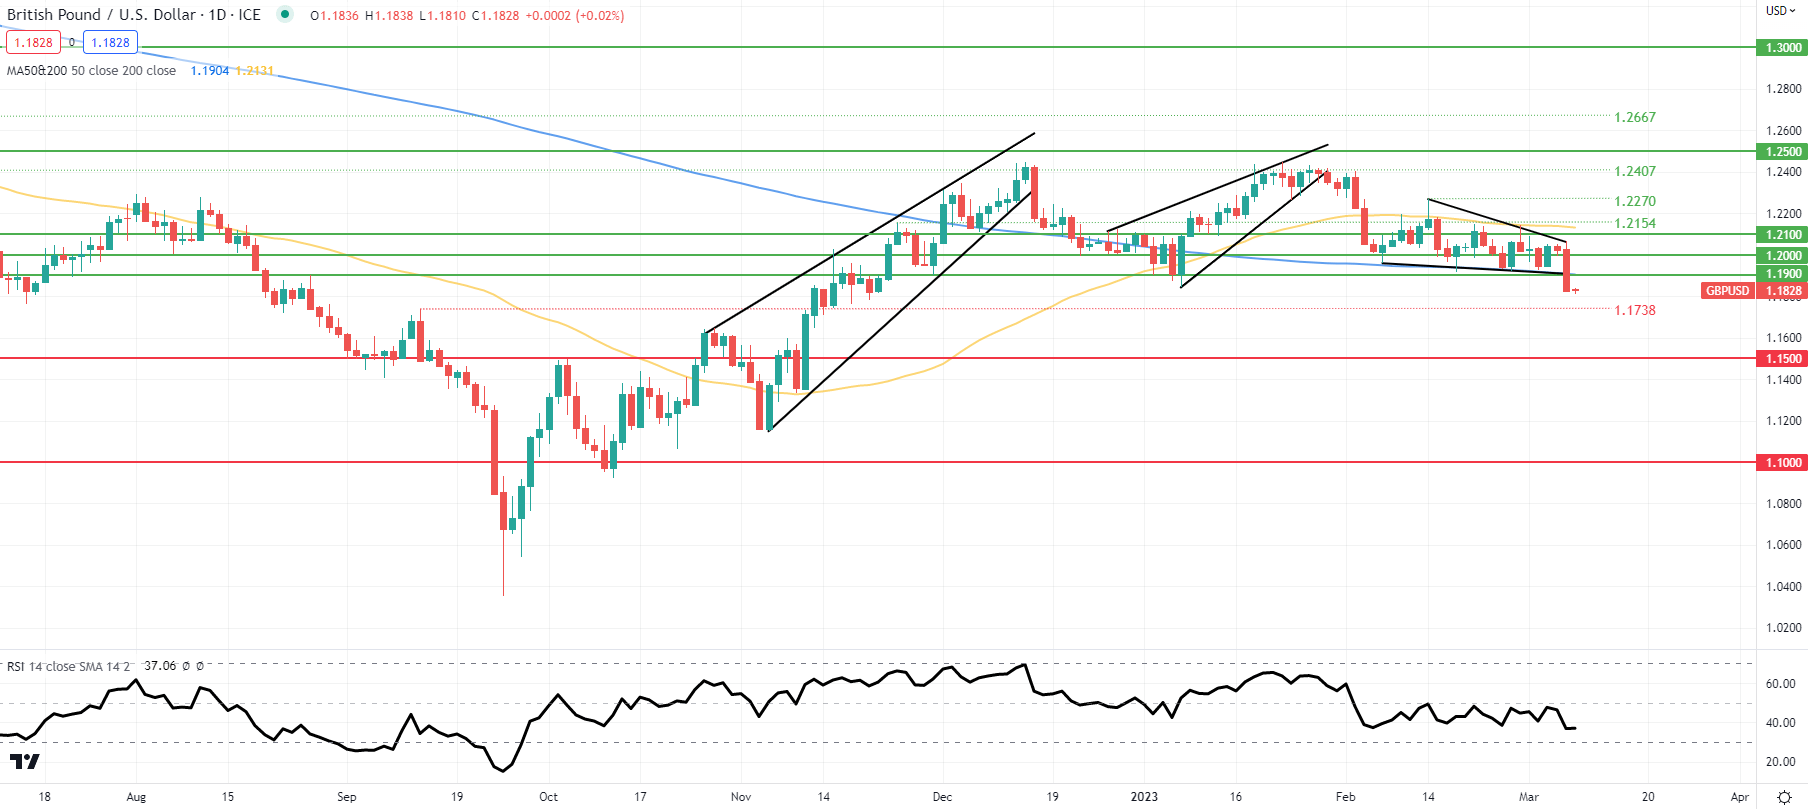
The daily GBP/USD chart above has price action in limbo around yesterdays close awaiting further fundamental data. After blasting below the 1.1900 psychological level, 200-day (blue) SMA and wedge support; likely invalidating the falling wedge chart pattern (black), bears now eye the 1.1738 swing high (now support). According to the Relative Strength Index (RSI), the pair has more room to fall before entering oversold territory but remains highly dependent on incoming data.

Key resistance levels:

  • 1.2000
  • 1.1900/200-day SMA

Key support levels:

  • 1.1738
  • 1.1500

BEARISH IG CLIENT SENTIMENT

IG Client Sentiment Data (IGCS) shows retail traders are currently LONG on GBP/USD, with 72% of traders currently holding long positions (as of this writing). At DailyFX we typically take a contrarian view to crowd sentiment resulting in a short-term upside disposition.

The Fed plans to keep hiking, but Australia is set to pause as it warns of recession risks

The Fed plans to keep hiking, but Australia is set to pause as it warns of recession risks

As Federal Reserve Chair Jerome Powell hints at bigger and possibly faster rate hikes ahead, Australia’s central bank could be headed toward a different path.

Reserve Bank of Australia’s governor Philip Lowe said in a speech Wednesday that the central bank is nearing a point where it’s ready to hit the brakes on rate hikes.

“With monetary policy now in restrictive territory, we are closer to the point where it will be appropriate to pause interest rate increases to allow more time to assess the state of the economy,” he said.

While emphasizing the central bank’s target to bring down the rise of living costs, he said the central bank grapples with two risks when making monetary policy decisions: “One is the risk of not doing enough, which would result in high inflation persisting and then later proving very costly to get down,” he said.

“The other is the risk that we move too fast, or too far, and that the economy slows by more than is necessary to bring inflation down in a timely way,” he said.

Lowe’s comments come after the central bank hiked its benchmark overnight cash rate by another 25 basis points to 3.6%, marking the highest that it’s been since June 2012.

Australia’s stocks slightly rose after the smaller hike and less hawkish commentary from the RBA, with the benchmark index S&P/ASX 200

closing 0.5% higher on Tuesday.

‘Plurals are gone’

Comparing the wording from the central bank’s previous meeting, Commonwealth Bank of Australia economist Gareth Aird said a pause could come as early as April.

“The plurals are gone,” Aird said, pointing to the changes from February’s description of “further increases in interest rates” to March’s description of “further tightening.”

Global Investors Contemplate Fallout From US Rates Reaching 6%

Global Investors Contemplate Fallout From US Rates Reaching 6%

All of a sudden, the prospect of US rates hitting 6% is becoming real enough for investors to rethink their strategies.

BlackRock Inc. and Schroders Plc are among those who are weighing in on the debate of what will happen if US rates peak at 6%. As late as end-February, investors across bonds, stocks and currency markets were still calling for an end to higher rates with bets for a broad rally in the second half.

Instead, Federal Reserve Chair Jerome Powell’s testimony on Tuesday is fueling expectations of a bigger hike this month, with traders pricing in peak rates of 5.6% from less than 5% at the end of last year. Treasury traders are doubling down on recession expectations, the dollar has rebounded while equity markets from the S&P 500 Index to the MSCI Asia Pacific gauge are giving up gains.

Given the robust job market and sticky inflation, “we think there’s a reasonable chance that the Fed will have to bring the Fed Funds rate to 6%, and then keep it there for an extended period to slow the economy and get inflation down to near 2%,” Rick Rieder, chief investment officer for global fixed income at BlackRock, said in a Tuesday note.

The Federal Reserve’s latest messaging sets the stage for the central bank to revert to a half-point hike, and stands in marked contrast to the softer stance adopted by peers in Australia and Canada. It’s also fueling fears of a hard landing for the US economy as the bond market telegraphs the growing odds of a recession.

Swaps traders are now pricing in a full percentage point of Fed hikes over the next four meetings.

“A 6% terminal rate is not out of the question now,” said Kellie Wood, deputy head of fixed income at Schroders Plc in Australia. “Expect to see a broad-based selloff in Aussie and Asian markets today led by the short end but with US rates underperforming.”

In the US, the spread between 2- and 10-year yields are showing a discount larger than a percentage point for the first time since 1981, when then-Fed Chair Paul Volcker was pushing through hikes to tackle double-digit inflation. The yield inversion indicator has over the decades anticipated recessions in the wake of aggressive Fed tightening campaigns.

Commodity currencies have retreated as the prospects of a US recession grow, with the Australian dollar sinking 2% on Tuesday. The Bloomberg Dollar Spot Index climbed to the highest since early January on Wednesday after rallying 1% the previous day. The yen is once again closing in on the 140 level against the greenback.

“Before Powell last night, we were more inclined to try shorting USD/JPY around the 137-138 level — think we would probably hold off on that, with Fed terminal rates very possibly heading to 6%,” said John Bromhead, a currency strategist at Australia & New Zealand Banking Group Ltd.

Credit markets are similarly bracing for the fallout from the repricing of US rates.

“It’s not our base case, but a 6% Fed Funds rate would likely result in a stronger dollar, weaker global growth and ultimately downside for risk asset valuations,” said Mark Reade, head of fixed-income desk research at Mizuho Securities Asia. “While China’s reopening and a relative scarcity of new supply would likely cushion the blow for Chinese USD bond spreads, it is unlikely those spreads emerge unscathed.”

Emerging Markets

The Fed rhetoric risks worsening the outlook for emerging-market assets, after Beijing’s modest economic growth target earlier this week dashed hopes of a resumption of the reopening rally that buoyed global markets earlier. The South Korean won, a proxy for risk sentiment in Asia, sank 1.8% on Wednesday.

“Higher-for-longer is becoming the base-case scenario, and if that scenario materializes, EM can suffer,” said Brendan McKenna, emerging markets strategist at Wells Fargo in New York. “Markets were really hoping for an early Fed pause and cuts this year, so far that scenario is not unfolding.”

Still, some investors see buying opportunities in the stock market.

“We would expect the more cyclical and cheaper markets of North Asia to be favored and rotation away from South Asia to continue,” said Sat Duhra, fund manager at Janus Henderson Investors. “Finally the higher quality tech names in North Asia, in particular semiconductors, are beginning to appear attractive on valuation and is a sector that should fully participate in any recovery in earnings.”

How Powell’s Surprise Rate Signal May Ripple Through Asia Stocks, Currencies

How Powell’s Surprise Rate Signal May Ripple Through Asia Stocks, Currencies

Asian assets face selling pressure after Federal Reserve Chair Jerome Powell jolted investors with unexpectedly aggressive comments on the outlook for higher interest rates.

Here’s how strategists see the impact rippling through Asia Wednesday following sharp moves during US trading: the dollar rallied 1%, stocks and commodities slumped and the US 2-year yield exceeded the 10-year one by a full percentage point.

Hebe Chen, analyst at IG Markets.

“For the Asian market, the Fed’s hawkish comments doused the recently ignited hope from RBA’s soft stance and South Korea’s new low inflation rate,” Chen said. “Equities will be under renewed pressure. In the mid- to long-term, the divergence between Fed and Asian central banks will likely see a further downtrend for the Asian currencies.”

Kellie Wood, deputy head of fixed income at Schroders Plc in Australia.

“A 6% terminal rate is not out of the question now,” said Wood. “Expect to see a broad-based selloff in Aussie and Asian markets today led by the short end but with US rates underperforming.”

John Bromhead, currency strategist at Australia & New Zealand Banking Group.

“Path of least resistance for USD/JPY is higher short-term as we see terminal pricing reset higher in the US,” said Bromhead. “We will get some clues on US labor market tonight (JOLTS + ADP) ahead of payrolls on Friday. I wouldn’t be fighting the USD trend ahead of that key release.”

Brendan McKenna, emerging markets strategist at Wells Fargo in New York.

“He was much more hawkish than markets expected, and I would expect that language to filter and ripple across into Asia as well,” said McKenna. “Higher-for-longer is becoming the base-case scenario, and if that scenario materializes, EM can suffer. Markets were really hoping for an early Fed pause and cuts this year, so far that scenario is not unfolding and EM giving back some its early gains.” McKenna added that “higher beta names like IDR and KRW” may face downward pressure, and while any selloff today could be a buying opportunity, “waiting for payrolls later this week might be most prudent.”

Anthony Doyle, head of investment strategy for Firetrail Investments.

“Local markets will take their lead from the weakness offshore today,” said Doyle. “The testimony confirmed the growing narrative that interest rate cuts may be some way off, and there is less and less likelihood that we will see any this year.”

Karen Jorritsma, head of Australian equities at RBC Capital Markets.

“It is clearly a step backwards for the markets given we had seen some comfort return after the last round when discussion appeared to be talking around an end in sight,” said Jorritsma. “This has raised uncertainty again and will rattle confidence.”

Goldman Expects Nearly 1 Million Drop In Tomorrow’s Job Openings

Goldman Expects Nearly 1 Million Drop In Tomorrow’s Job Openings

In his most hawkish speech since Jackson Hole, Fed Chair Powell made it very clear: if economic data keeps coming in as hot as February, the Fed will not only hike higher for longer, but may revert back to 50bps rate hikes (or even higher) at the next FOMC. Which begs the question: what will the barrage of economic data that starts with tomorrow’s ADP and JOLTs reports, goes through Friday’s Nonfarm Payrolls, and culminates with next week’s CPI, PPI and retail sales, show?

Well, as we have previously noted, January’s data was a one-time outlier across the board: not just jobs and inflation, but also retail sales. In fact, last Friday we showed that the latest BofA card data indicated a sharp slowdown in retail spending after the January splurge.

Also, three weeks ago we reported that Goldman found the layoffs/initial claims data is also artificially propped up, because when looking at state-level WARN notices which were coming in far hotter than expected…

… the layoffs rate translated into a far higher number than that indicated by the November JOLTS report.

Now, in a follow up analysis, Goldman has also found that the number of job openings signaled by the JOLTS report is also delayed in showing the true state of the labor market (at best), or simply rigged, and in a report by the bank’s chief economist Jan Hatzius (available to pro subs in the usual place), he writes that while “timelier alternative measures of job openings track official data reasonably well in most countries, but the official JOLTS job openings measure looks relatively high in the US.”

Some more details:

Given the importance of labor demand to the wage growth, inflation, and monetary policy outlook, timelier alternative measures of job openings have recently become useful metrics for tracking labor market rebalancing progress. These alternative measures generally track official job openings data reasonably well (left chart, Exhibit 3), although the official job openings measure from the Job Openings and Labor Turnover Survey (JOLTS) currently looks relatively high in the US (right chart, Exhibit 3).

Almost as if there is a political mandate under the Biden administration to fabricate data with the purpose of making the labor market appear stronger than usual. Of course, Goldman would never admit that political apparatchiks planted in the Dept of Labor and BLS have been tasked with “seasonally adjusting” numbers to make Biden look good. Instead it offers the following two explanations why the official data no longer represents reality:

We see two explanations for why the most recent JOLTS report likely overstates job openings.

  • First, the spurious evolution of seasonal factors during the pandemic likely biased JOLTS job openings upwards by 300-400k in December, but should have a negligible effect on the level of job openings in January.
  • Second, the response rate to the JOLTS survey collapsed from just below 60% in 2019 to 31% in December 2022. We see no reason why the lower response rate should imply a directional bias, but it does imply increased volatility that argues for discounting the recent JOLTS report, especially because it is so far out of line with timelier job openings indicators.

Goldman’s conclusion: since the BLS will find it difficult to rig the data any longer various adjustments fall out in the latest dataset, the bank sees “scope for a large pullback in official job openings in the US and forecast that job openings will fall by 800k to 10.2mn in next week’s January JOLTS report.”

A nearly 1 million drop in JOLTS will quickly reprice much of the recent tightening driven by expectations of “no landing” which has sent the terminal rate to 5.65% and the 2s10s below -100bps.

And once the JOLTS report confirms that the recent trend was spurious (at best) expect Friday’s jobs report to also come in far below the January level, and an extension of the previous downward sloping trendline, something which BofA already expects…

… as does Morgan Stanley, which writes that it expects “re-normalization of the economic data, starting with the payrolls print. Seasonal factors, warmer weather, and underlying changes in corporate behavior due to labor hoarding likely gave the January print a substantial boost. In non-seasonally adjusted terms, the economy will need to add close to 800k jobs in February for seasonally adjusted payrolls to net to zero, while in January, anything less than 3mm job losses would have delivered a positive number.”

ECB Balance Sheet Drops by €1 Trillion from Peak: QT Milestone

ECB Balance Sheet Drops by €1 Trillion from Peak: QT Milestone

The ECB had two major types of QE: It handed very large chunks of cash to banks via free-money loans, and it handed cash to the bond market by purchasing government and corporate bonds and asset-backed securities.

The ECB announced Step 1 of QT at its October meeting: It made the loan terms less attractive, thereby causing banks to pay them back, which removed this liquidity from various markets via the banks.

The ECB announced Step 2 of QT at its December meeting: reducing its bond holdings by letting them mature without replacement, limited by a cap.

So far, the reduction of its balance sheet has been mostly through Step 1 of QT, the reductions in loans.

The loan QT: liquidity rug-pull.

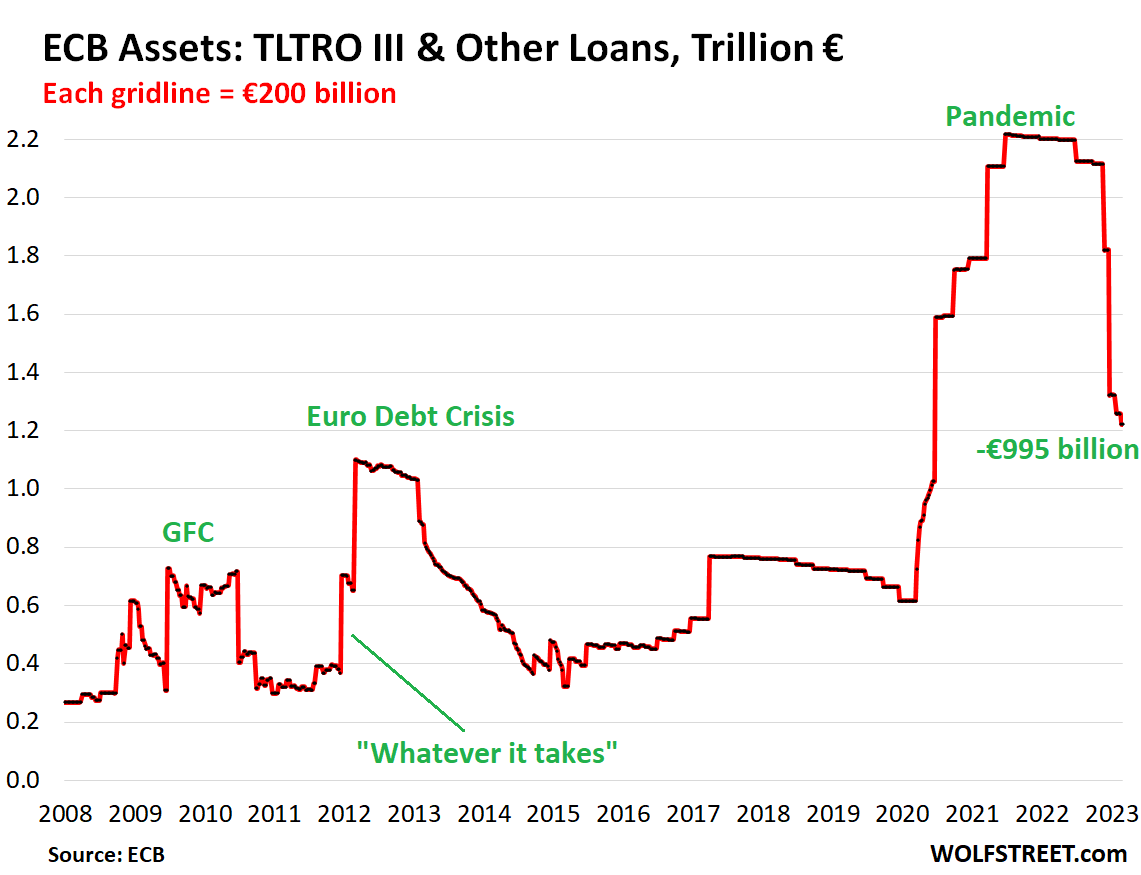
As part of the massive QE operations during the pandemic, the ECB lent cash to the banks via what it calls the Targeted Longer-Term Refinancing Operations (TLTRO III) with complex incentives that were so favorable that banks took the money and plowed it into whatever. From the beginning of the pandemic through July 2021, the ECB handed out €1.6 trillion of TLTRO III loans.

This came on top of the remaining loans from prior programs (LTRO) of €620 billion, bringing the total loan balance to €2.22 trillion at the peak in June 2021.

The loans have dates at which they can be paid back. The first payback date was in July 2022, when €74 billion in loans were paid back; the second was in November, when €296 billion were paid back; the third was in December, when €498 billion were paid back. At the January and February windows, smaller amounts were paid back.

The total balance of TLTRO Loans has now plunged by €995 billion from the peak in June, to €1.22 trillion today.

The ECB has always handled QE via loans, including during the “whatever it takes” moment in 2021:

The bond QT: now starting.

Step 2 of QT, announced at its December meeting, starts in March, initially at a rate of €15 billion a month. At the February meeting, it announced that the ramp-up period of €15 billion a month will go through June. It said it will decide on the future pace by then. Comments by ECB governors about the future pace of the bond QT indicate that it will accelerate after June.

These bonds will come off the balance sheet as they mature, which is when the ECB will receive cash in the amount of face value of these bonds. The roll-off is capped at €15 billion a month initially. Any proceeds from maturing bonds beyond the €15-billion cap will be reinvested in bonds.

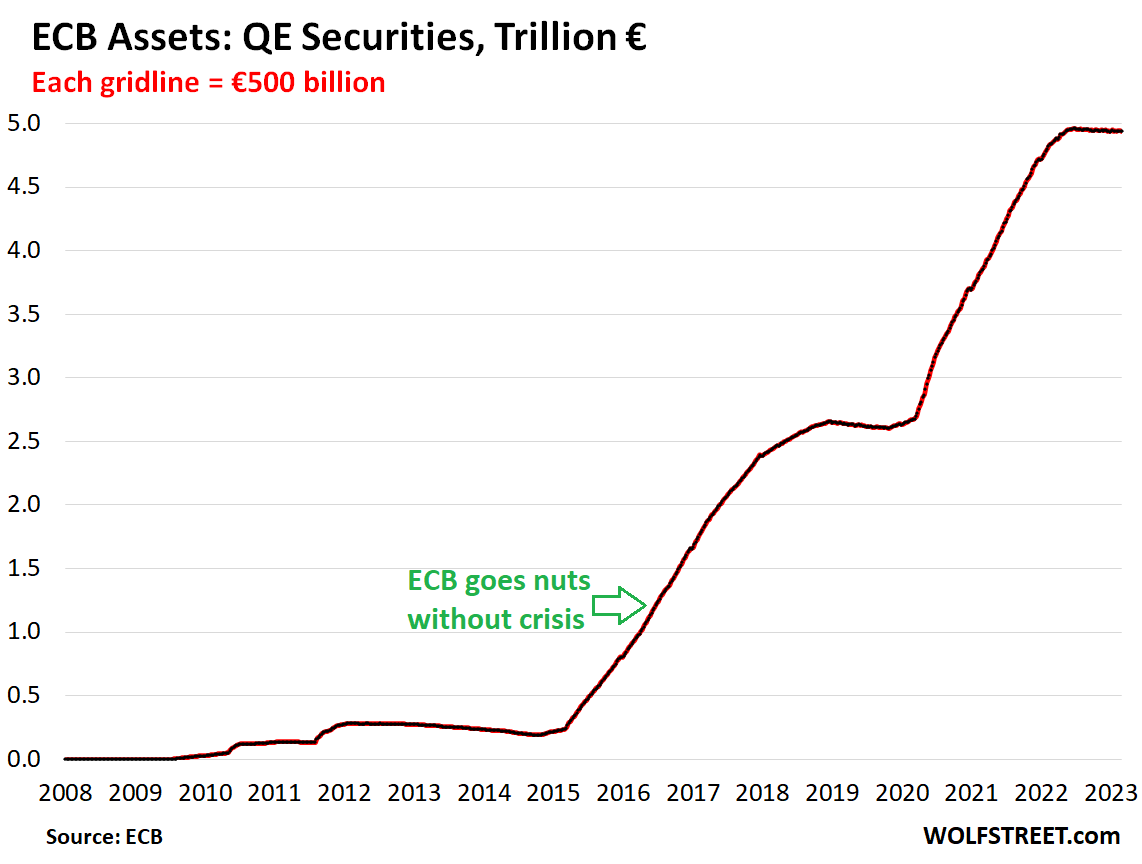
The ECB ended its bond QE in June 2022, and “securities held for monetary policy purposes” have remained roughly stable since then. On the balance sheet released today, which was as of March 3 – before the bond QT started – the balance of bonds dropped by €5 billion for the week and by €26 billion from the peak, to €4.96 trillion.

In 2015, the ECB suddenly got infected by the Fed’s virus of buying bonds, and it went hog-wild.

€1 trillion destroyed.

Like all central banks, when the ECB reduces the assets on its balance sheet, it receives money for the loans it had extended and for the securities it had bought, and it then destroys this money in the opposite way in which it had created it.

The ECB has now destroyed €1 trillion, mostly from loan payoffs (€995 billion), and starting to from the bond roll-off (€26 billion), combined a massive amount of liquidity that was drained from the financial system over the past few months – and more than the Fed’s $626 billion in QT.

Retail sales in January 2023 down 0.3% in real terms compared to the previous month

Retail sales in January 2023 down 0.3% in real terms compared to the previous month

Retail sales, January 2023 (provisional, calendar and seasonally adjusted) -0.3% on the previous month (real) -0.7% on the previous month (nominal) -6.9% on the same month last year (real) +2.8% on the same month last year ( nominal) WIESBADEN – According to provisional results from the Federal Statistical Office (Destatis), in January 2023 retail companies in Germany turned over 0.3% less in real terms (price-adjusted) and 0.7% in nominal terms (not price-adjusted) than in December 2022. In comparison compared to the same month of January 2022, the retail trade recorded a real drop in sales of 6.9% and a nominal

Gold Prices Collapse as Powell Flags Risk of Higher Peak Rates, Silver Hammered

Gold Prices Collapse as Powell Flags Risk of Higher Peak Rates, Silver Hammered

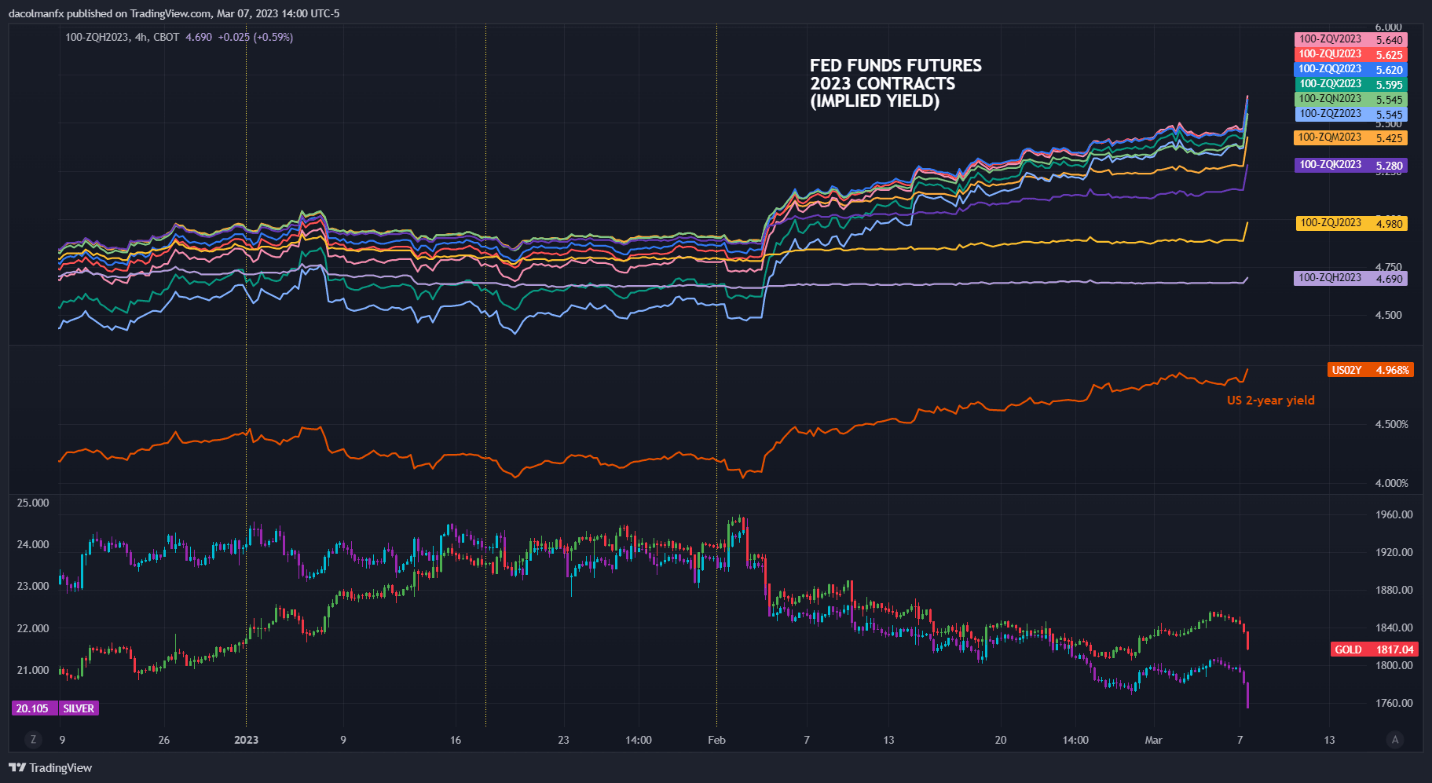
Gold prices (XAU/USD) plunged on Tuesday, falling nearly 2% below the $1,820 threshold, after Fed’s chair Powell embraced a hawkish stance at a Congressional hearing, indicating that the FOMC’s terminal rate is likely to settle higher than initially anticipated in response to sticky inflation. Silver (XAG/USD) also took a beating, plummeting more than 4% to $20.15, its lowest level since November 2022, a bearish move that was reinforced by the U.S. dollar surge in the FX space.

Powell admitted that inflation has not come down as fast as policymakers had hoped and that tight labor markets are exacerbating price pressures in the economy, complicating the Federal Reserve’s fight. The central bank chief also acknowledged that the institution is prepared to accelerate the pace of hikes if necessary, although he cautioned that future actions will be guided by the totality of incoming data.

FED FUNDS FUTURES, GOLD AND SILVER CHART

Chart, histogram  Description automatically generated

Source: TradingView

Powell’s remarks sparked a hawkish repricing of the monetary policy outlook, prompting expectations for borrowing costs to drift sharply higher, with Fed funds futures now implying a terminal rate of 5.640% versus 5.435% one week ago. This is obviously a negative development for rate-sensitive assets.

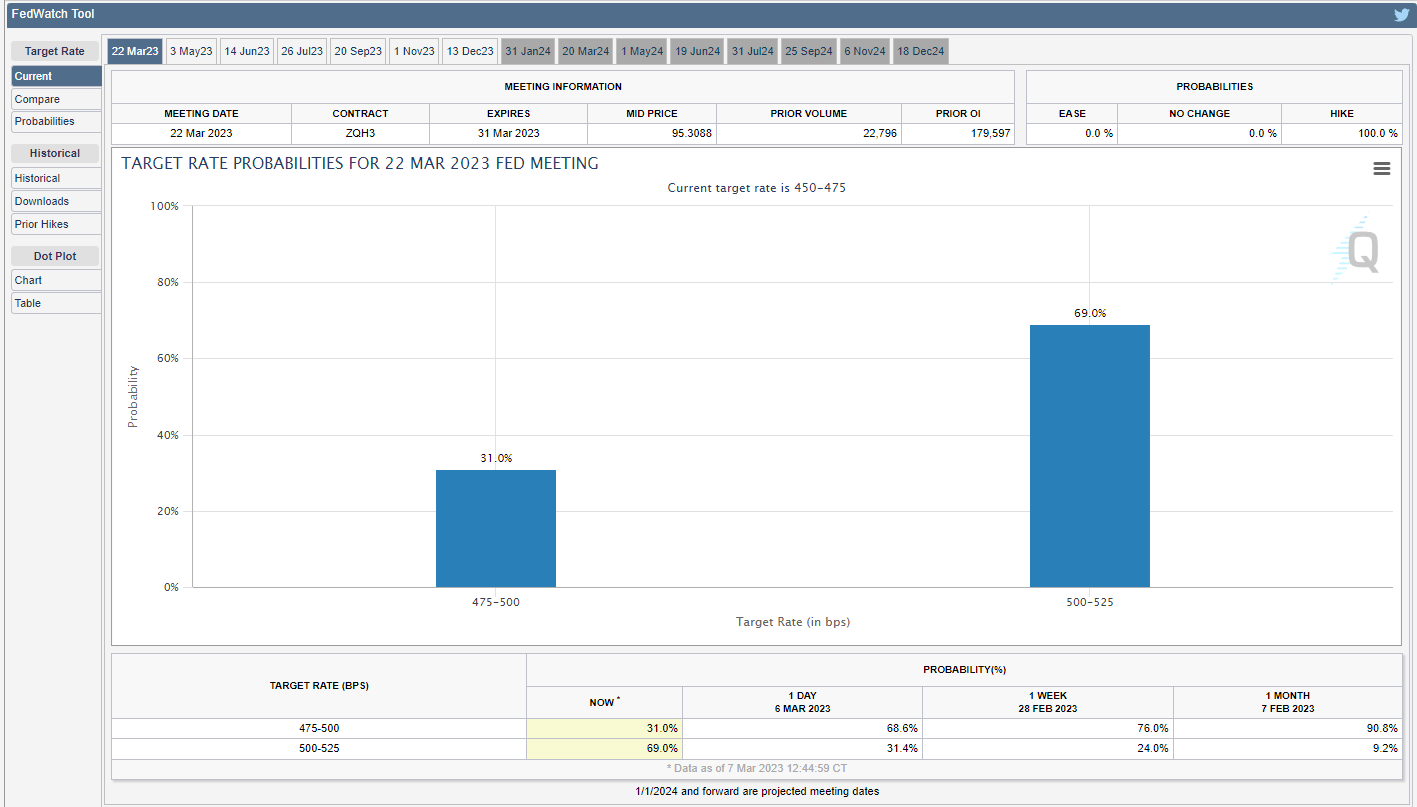
Tuesday’s event also led traders to discount with greater conviction the likelihood of a 50 basis point interest rate hike at the March FOMC meeting, raising the probability of that scenario to 69% at the time of writing (see chart below). There is room for those expectations to firm if economic strength continues, so gold and silver will remain in a vulnerable place for now.

image2.png

To better position for what lies ahead, traders should keep an eye on the calendar over the next few days. There are several key releases this week, but the February nonfarm payrolls report may be the most important one in shaping the debate over the Fed’s next steps. Consensus estimates indicate that U.S. employers added 203,000 workers last month, but the strong rise in the ISM services employment index and low jobless claims suggest we could be in for an upside surprise.

image3.png

GOLD PRICE TECHNICAL ANALYSIS

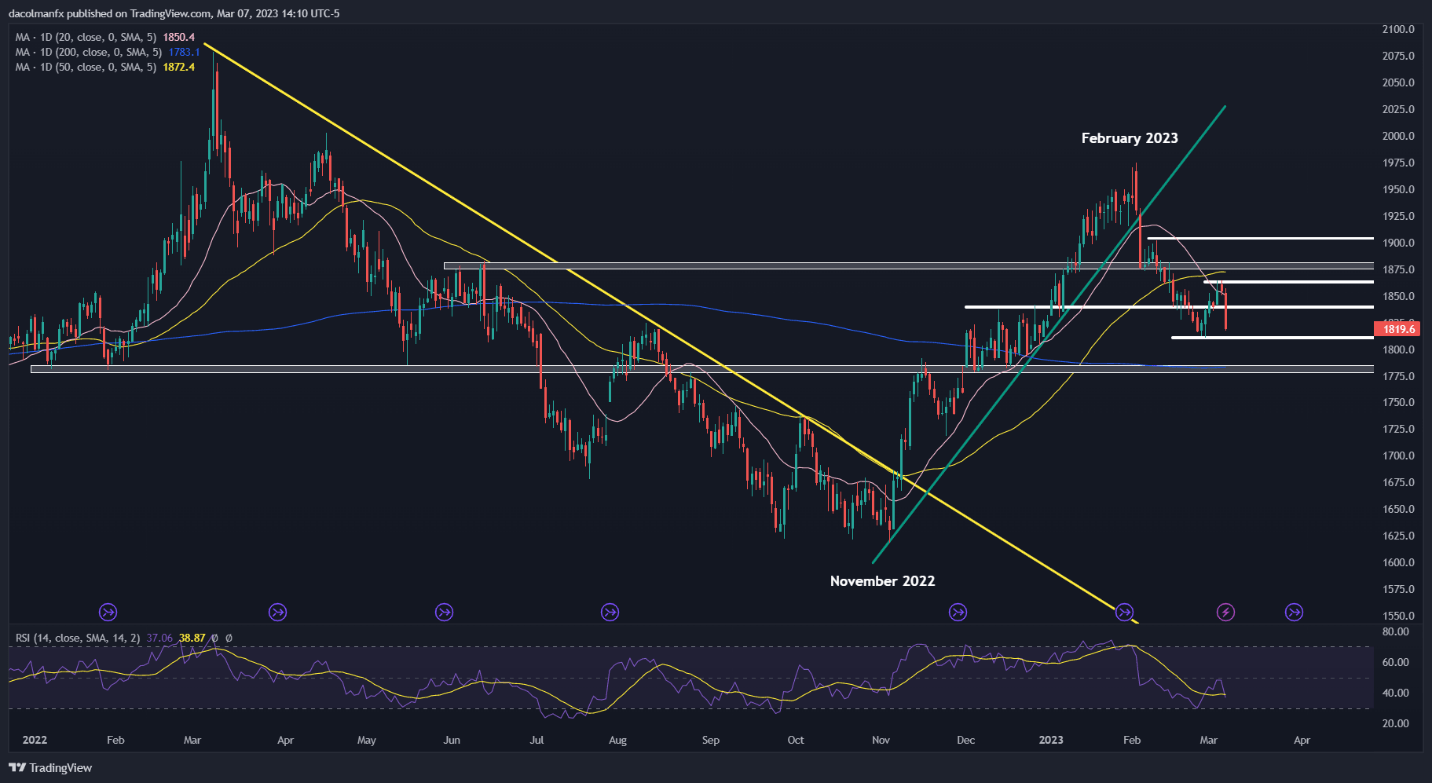
After Tuesday’s selloff, gold prices are quickly approaching a significant technical support level near $1,810, corresponding to the February’s low. If XAU/USD breaks down and falls below this floor, sellers could launch an attack on the 200-day simple moving average hovering around the $1,785 level. On the flip side, if buyers resurface and trigger a rebound, initial resistance is seen at $1,840, followed by $1,860.

GOLD TECHNICAL CHART

Chart, histogram  Description automatically generated


Dow Jones, S&P 500 Plunge on Powell Testimony. Is a Larger Fed Rate Hike Next?

Dow Jones, S&P 500 Plunge on Powell Testimony. Is a Larger Fed Rate Hike Next?

Asia-Pacific Market Briefing – Markets Bracing After Wall Street Volatility

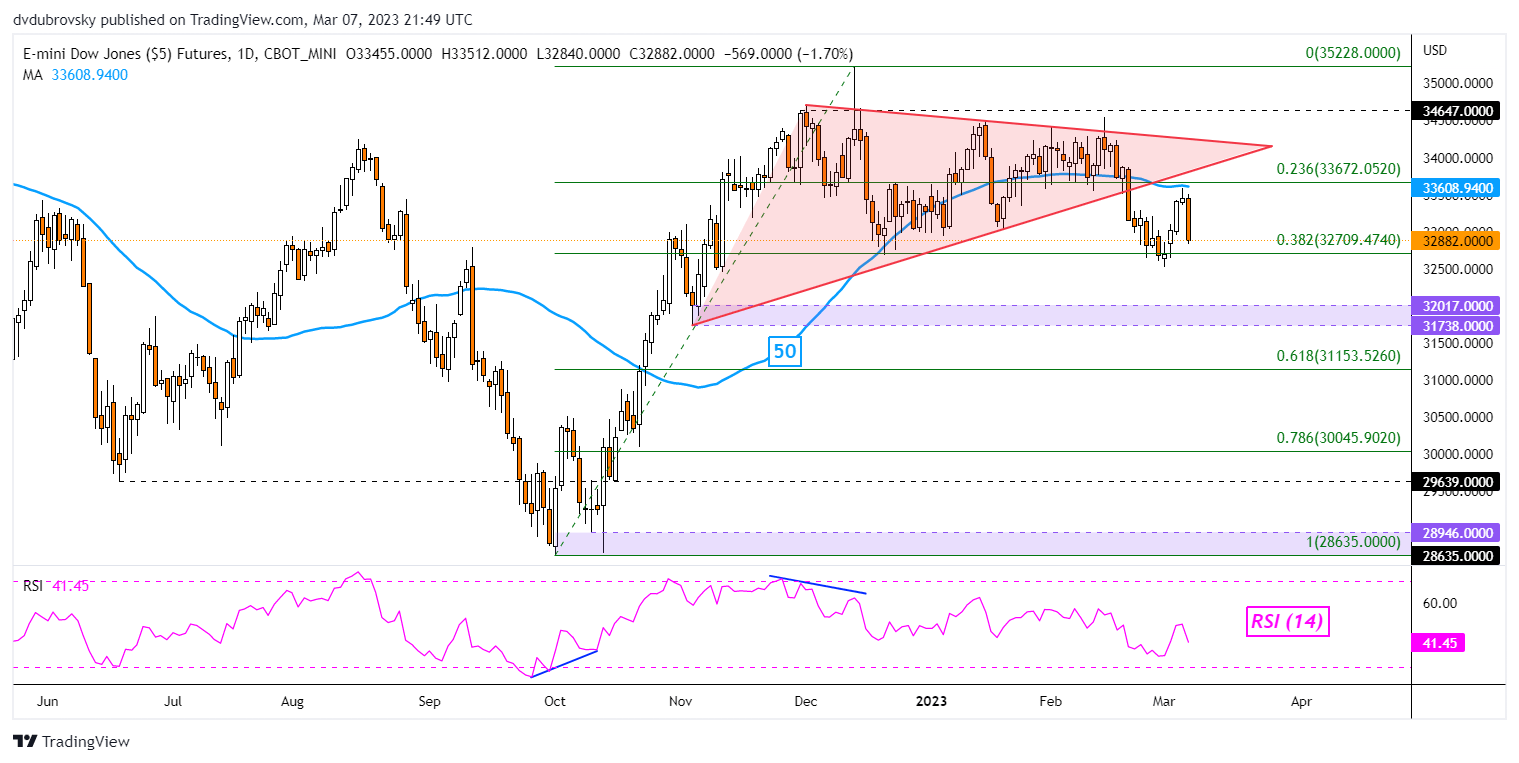
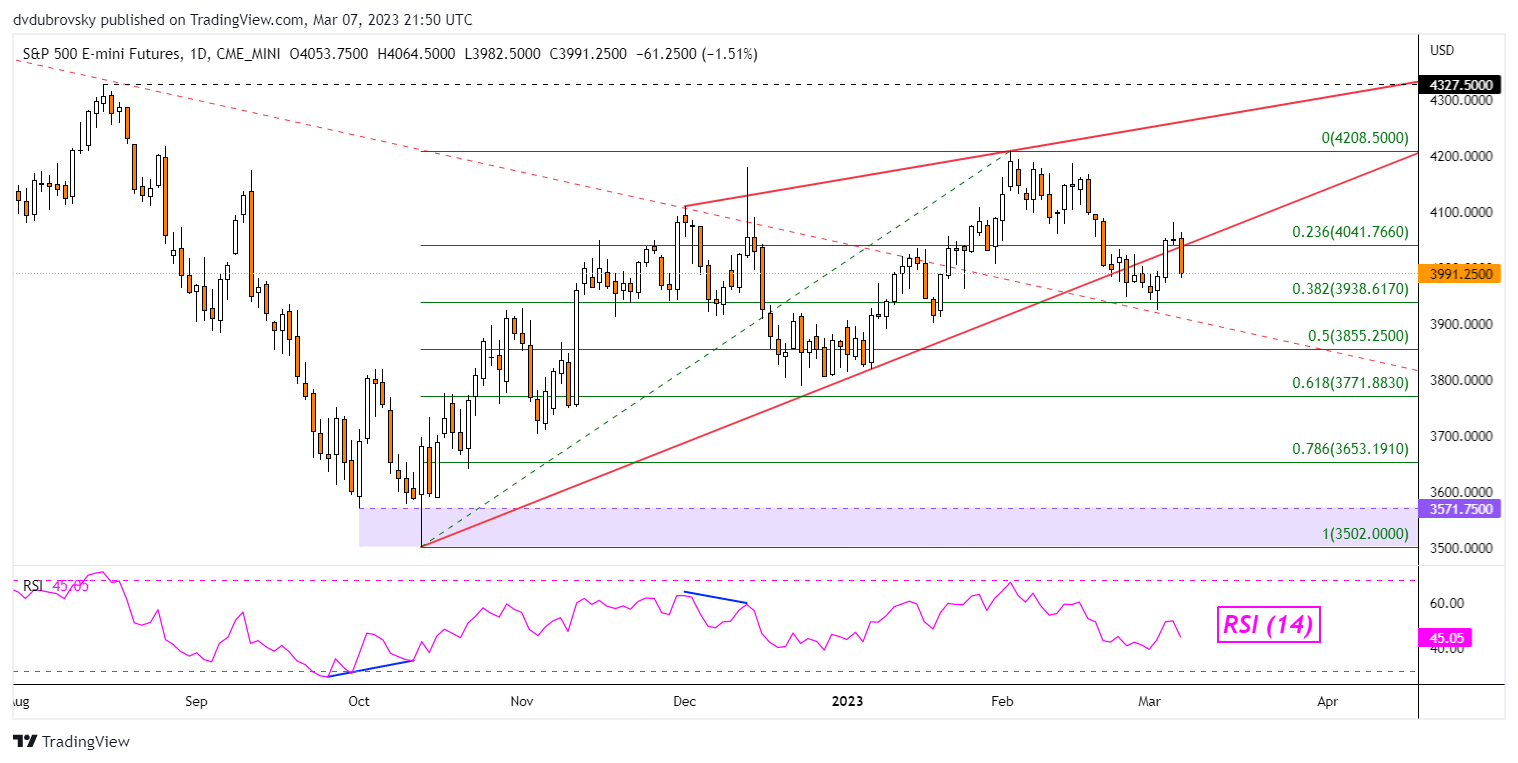
Wall Street received a reality check on Tuesday as the Dow Jones and S&P 500 sank 1.72% and 1.53%, respectively. The key culprit was what traders were anxiously anticipating, testimony from Federal Reserve Chair Jerome Powell before the Senate Banking Committee.

The key takeaway from Mr. Powell was that he noted that the central bank was prepared to speed up the pace of hikes again if warranted. Of course, this would continue to be influenced by incoming economic data. Furthermore, he noted that the Fed is likely looking at a higher rate peak than expected.

This testimony follows recent signs that inflation might be stickier than previously seen. The latest CPI and PCE report (the latter of which is the central bank’s preferred inflationary gauge) showed signs that the pace of disinflation slowed.

By the end of the day, market pricing started to favor a 50-basis point rate hike this month as opposed to 25. Treasury yields soared, sapping the appeal of stocks, inducing classic risk aversion. This leaves Asia-Pacific markets vulnerable heading into Wednesday’s trading session.

Dow Jones Technical Analysis

The Dow Jones turned lower after rejecting the 50-day Simple Moving Average (SMA). This also followed a breakout under a Symmetrical Triangle chart formation. This is placing the focus on immediate support, which is the 38.2% Fibonacci retracement level at 32709.

Daily Chart

Dow Jones Technical Analysis

S&P 500 Technical Analysis

Meanwhile, the S&P 500 rejected the ceiling of a bearish Rising Wedge chart formation. This is leaving the index also facing the 38.2% Fibonacci retracement level, which here is sitting at 3938.61. Confirming a breakout under the latter would open the door to an increasingly bearish technical bias.

Daily Chart

S&P 500 Technical Analysis

Hawkish vs Dovish: How Monetary Policy Affects FX Trading

Hawkish vs Dovish: How Monetary Policy Affects FX Trading

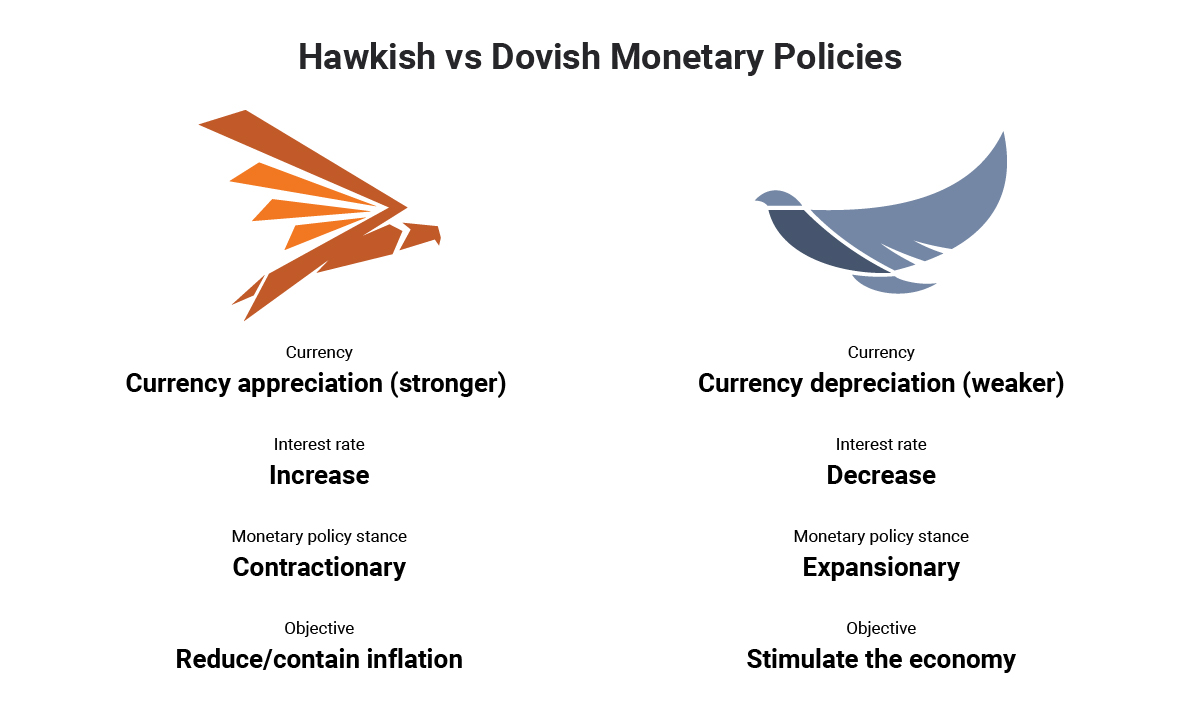
You have probably heard a financial news presenter say something along the lines of “The central bank governor came out slightly hawkish today after bouts of strong economic data”. The terms Hawkish and Dovish refer to whether central banks are more likely to tighten (hawkish) or accommodate (dovish) their monetary policy.

Central bank policy makers determine whether to increase or decrease interest rates, which have significant impact on the forex market. Policy makers increase interest rates to prevent an economy from overheating (to prevent inflation from going too high) and they decrease interest rates to stimulate an economy (to prevent deflation and stimulate GDP growth).

Hawkish and dovish policies affect currency rates through a mechanism central bankers like to call “forward guidance”. This is policy makers trying to be as transparent as possible in their communications to the market about where monetary policy may be heading.

Keep reading to learn more about hawkish and dovish policies and how to apply this knowledge to your forex trades.

What does hawkish mean?

The term hawkish is used to describe contractionary monetary policy. Central bankers can be said to be hawkish if they talk about tightening monetary policy by increasing interest rates or reducing the central bank’s balance sheet. A monetary policy stance is said to be hawkish if it forecasts future interest rate increases. Central bankers can also be said to be hawkish when they are positive about the economic growth outlook and expect inflation to increase.

Currencies tend to move the most when central bankers shift tones from dovish to hawkish or vice versa. For example, if a central banker was recently dovish, stating that the economy still requires stimulus and then, in a later speech, stated that they have seen inflation pressures rising and strong economic growth, you could see the currency appreciate against other currencies.

Some words that could be used describing a hawkish monetary policy include:

  • Strong economic growth
  • Inflation increasing
  • Reducing the balance sheet
  • Tightening of monetary policy
  • Interest rate hikes

Generally, words used that indicate increasing inflation, higher interest rates and strong economic growth lean towards a more hawkish monetary policy outcome.

What does dovish mean?

Dovish refers to the opposite. When central bankers are talking about reducing interest rates or increasing quantitative easing to stimulate the economy they are said to be dovish. If central bankers are pessimistic about economic growth and expect inflation to decrease or become deflation and they signal this to the market through their projections or forward guidance, they are said to be dovish about the economy.

Some words that could be used to describe a dovish monetary policy, include:

  • Weak economic growth
  • Inflation decreasing/deflation (negative inflation)
  • Increasing the balance sheet
  • Loosening of monetary policy
  • Interest rate cuts

Hawkish vs Dovish Explained

The below graphic provides a snapshot of the main differences between hawkish and dovish monetary policy:

hawkish vs dovishThe table below provides a more in depth comparison on dovish vs hawkish monetary policies, highlighting the differences between the two and how they impact currencies.

Hawkish monetary policies Dovish monetary policies
Increasing interest rates to stem inflation pressures

→ Currency could appreciate as capital flows to higher interest rate currency

Decreasing interest rates to stimulate the economy

→ Currency could depreciate as capital flows to a lower interest rate currency

Reducing the Federal Reserve balance sheet by selling mortgaged backed securities (MBS) and treasuries

→ Currency could appreciate as selling of treasuries and MBS could increase interest rates

Increasing the Federal Reserve balance sheet through quantitative easing (QE). QE is the purchasing of MBS and treasuries that increase the money supply in the economy to stimulate it.

→ Currency could depreciate as an increase in money supply decreases demand for the currency

Forward guidance from central banks include positive statements about the economy, economic growth, and inflation outlook.

→ Currency could appreciate as investors forecast further interest rate hikes

Forward guidance from central banks include negative statements about the economy, economic growth, and signs of deflation.

→ Currency could depreciate as investors forecast interest rate cuts

How to trade a Hawkish or Dovish Central Bank

A slight shift in tone from a central banker could have drastic consequences for a currency. Traders often monitor Federal Open Market Committee meetings and minutes to look for slight changes in language that could suggest further rate hikes or cuts and attempt to take advantage of this.

Monetary policy leaning dovish to hawkishMonetary policy standing as at 1 January 2019

The image above shows the different central banks current monetary policy stance. When a central banks’ monetary policy stance moves more towards the left (dovish) their currency could depreciate against other currencies. If the monetary policy stance moves more towards the right (hawkish) their currency could appreciate.

Trading a hawkish or dovish central bank isn’t as easy as buying a hawkish central bank currency or selling a dovish central bank currency. It has to do with changing interest rate expectations. Let’s look at two scenarios:

Scenario 1:

If a central bank is currently in a rate hiking cycle, the market will have already forecasted future interest rate hikes. It is the job of the trader to watch for clues and economic data that could shift the tone of the central bank to either more hawkish than currently, or to dovish. Currencies could move a large amount when the monetary tones shift from what they are currently.

Scenario 2:

Likewise, if a central bank is currently cutting rates and economic data hasbeen negative, the market would have priced-in the current dovish monetary stance. Traders would have to watch the central bankers forward guidance and economic data, which you can find on an economic calendar, for clues to whether they may become more dovish than currently, or hawkish.

In late 2018 the federal reserve was quite hawkish. Federal Reserve Chairman, Jerome Powell, stated that “we’re a long way away from neutral at this point” which the market perceived as hawkish (2 Oct 2018). This implied that the Federal Reserve still had to hike rates many more times to get to the neutral rate. Then on the 28th of November, the FOMC released their statement of monetary policy in which Jerome Powell said he saw rates at “just below neutral”. This shift in tone is like scenario 1 above, where the central banks shifts tone from hawkish to slightly dovish. Leading to a depreciation of the currency- see the charts below that show what happened to the Dollar Index (DXY) on the October 2, 2018 and then on the November 28, 2018.

October 2, 2018 – Federal Reserve Chairman, Jerome Powell says “We’re a long way away from neutral at this point” leading to appreciation of the Dollar.

15min US Dollar index chart, vertical line indicating October 2, 2018.

2nd October Federal Reserve chairman states that rates are a far away from neutralNovember 28, 2018 Federal Reserve Chairman says that interest rates are “just below neutral” indicating a shift in tone from hawkish to dovish. Dollar depreciations.

15min USD Dollar index chart

Federal reserve chairman Jerome Powell states that rates are just below neutralKeeping up to date with central banks can be difficult. At DailyFX we have a Central Bank Weekly Webinar where we analyze central bank decisions and keep you up to date with central bank activity.

If you are just starting out on your trading journey it is essential to understand the basics of forex trading in our New to Forex guide. We also offer a range of trading guides to supplement your forex knowledge and strategy development.

Senior Analyst, Tyler Yell of DailyFX sat down with former Federal Reserve Advisor, Danielle Dimartino Booth in a podcast that covered global central bank developments and Danielle’s biggest lesson she learned as a Fed insider.