litefinance-blog-audusd-05-04-22-768x419

Australian Dollar Yawned After RBA Hike by 0.25% as Expected. Where to for AUD/USD?

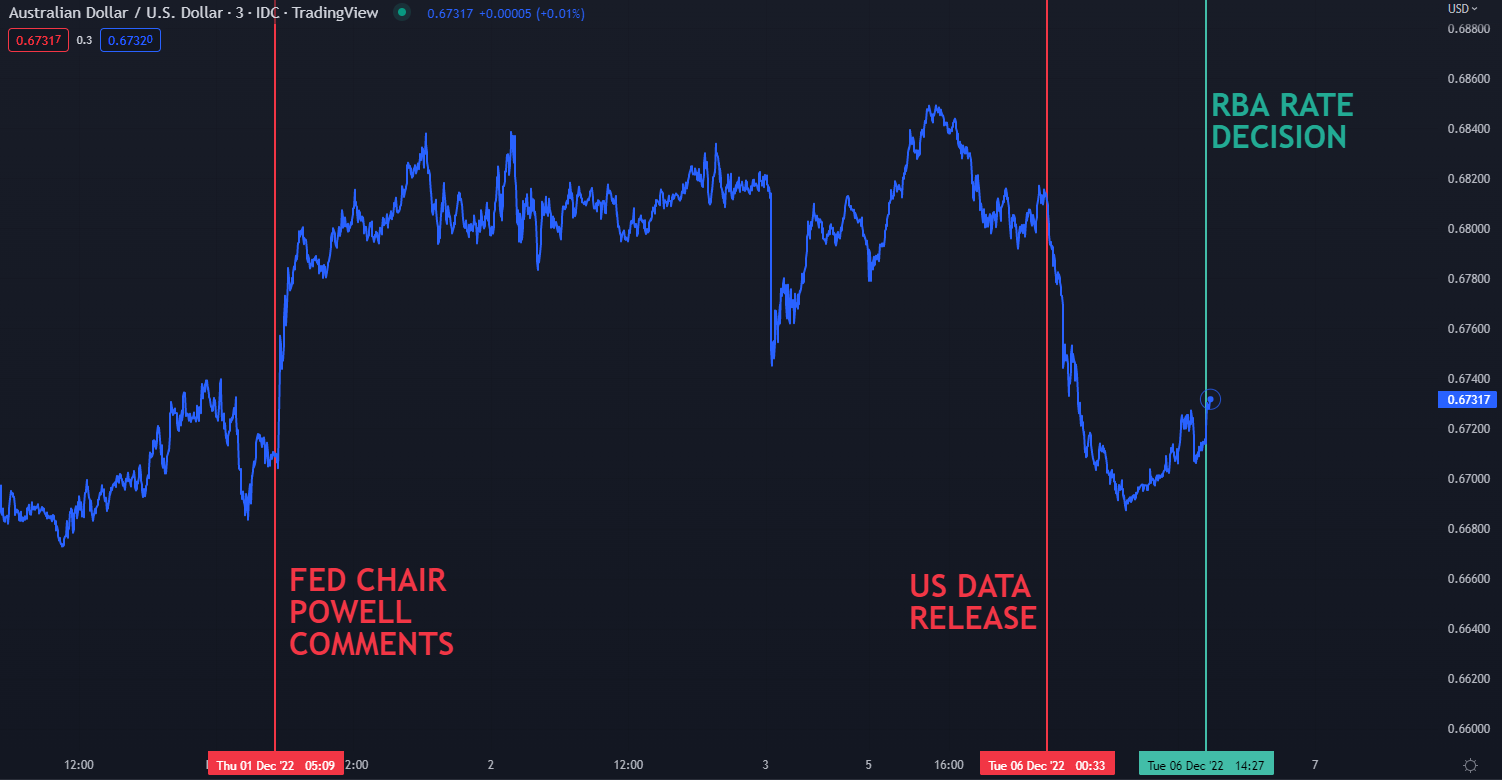
The Australian Dollar eventually kicked higher after the Reserve Bank of Australia (RBA) raised the cash rate target by 25 basis points (bps) as anticipated to 3.10% from 2.85%.

This brings the monetary policy tightening total for this cycle to 300 bps since May. Going into the meeting, the market was somewhat undecided with 16 bps priced in by the futures market. The majority of respondents to a Bloomberg survey forecast a 25-bps lift.

Some parts of the market were looking for a potential 15 bp rise to make a nice round figure of 3.00% for the cash rate. The RBA have previously indicated that they are not concerned about the rate being a round number.

The domestic backdrop to today’s move by the bank is somewhat muddied after mixed signals coming from inflation gauges.

For the first time, the Australian Bureau of Statistics (ABS) published a monthly CPI figure last week. There will be two such releases between the quarterly figures. These prints will cover 62-73% of the weighted quarterly basket. More details can be read here.

The official CPI reading for the RBA’s target band of 2-3% will remain as the quarterly number. The monthly CPI print from last Wednesday showed 6.9% year-on-year inflation in October, way below forecasts of 7.6%.

This is in contrast to the broader third quarter inflation read of 7.3% year-on-year to the end of October instead of 7.0% anticipated and 6.1% prior, an acceleration in price pressures.

An interesting component in today’s accompanying Monetary Policy Statement (MPS) was that the monthly CPI was cited and noted to be too high.

The bank maintained that they expect inflation to peak at 8% toward the end of this year. They also reiterated their somewhat sanguine view that current high inflation is temporary.

Today’s decision is the last by the RBA until February next year and the setting might have been impacted by the lengthy gap between meetings.

Three hours before the change in rates, the ABS released current account figures that revealed a AUD -2.3 billion deficit for the first time since the first quarter of 2019.

A healthy trade surplus has been offset by a record income deficit, that has been largely attributed to dividends paid by miners to offshore entities.

The Aussie Dollar has been swayed by international developments of late. The market reaction to Federal Reserve Chair Jerome Powell’s comments last week sent the currency higher.

Overnight, perceptions of the Fed getting serious about rate hikes saw a reversal of fortunes across many asset classes with AUD/USD tumbling in the process.

Looking ahead, The Federal Open Market Committee (FOMC) meeting on December 14th could be a crucial driver for AUD/USD. In the interim, it appears that Fed commentary might be the focus for market gyrations across several markets.

The full statement from the RBA can be read here.

AUD/USD CHART

image1.png


image1.png

Crude Oil Ponders Course as Markets Fear the Return of the Fed. Lower WTI?

Crude oil slipped lower in the US session overnight but has steadied through Asia today as markets consider the implications of strong US data.

The US Dollar gained after the ISM services index came in at 56.5 rather than the 54.4 anticipated for November. Factory orders and durable goods orders also beat expectations at 1.0% and 1.1% respectively for October.

The data appeared to remind markets that the US economy is running near full capacity and that if the Fed wants to get inflation back under control, the bank will need to tighten financial conditions more than previously thought.

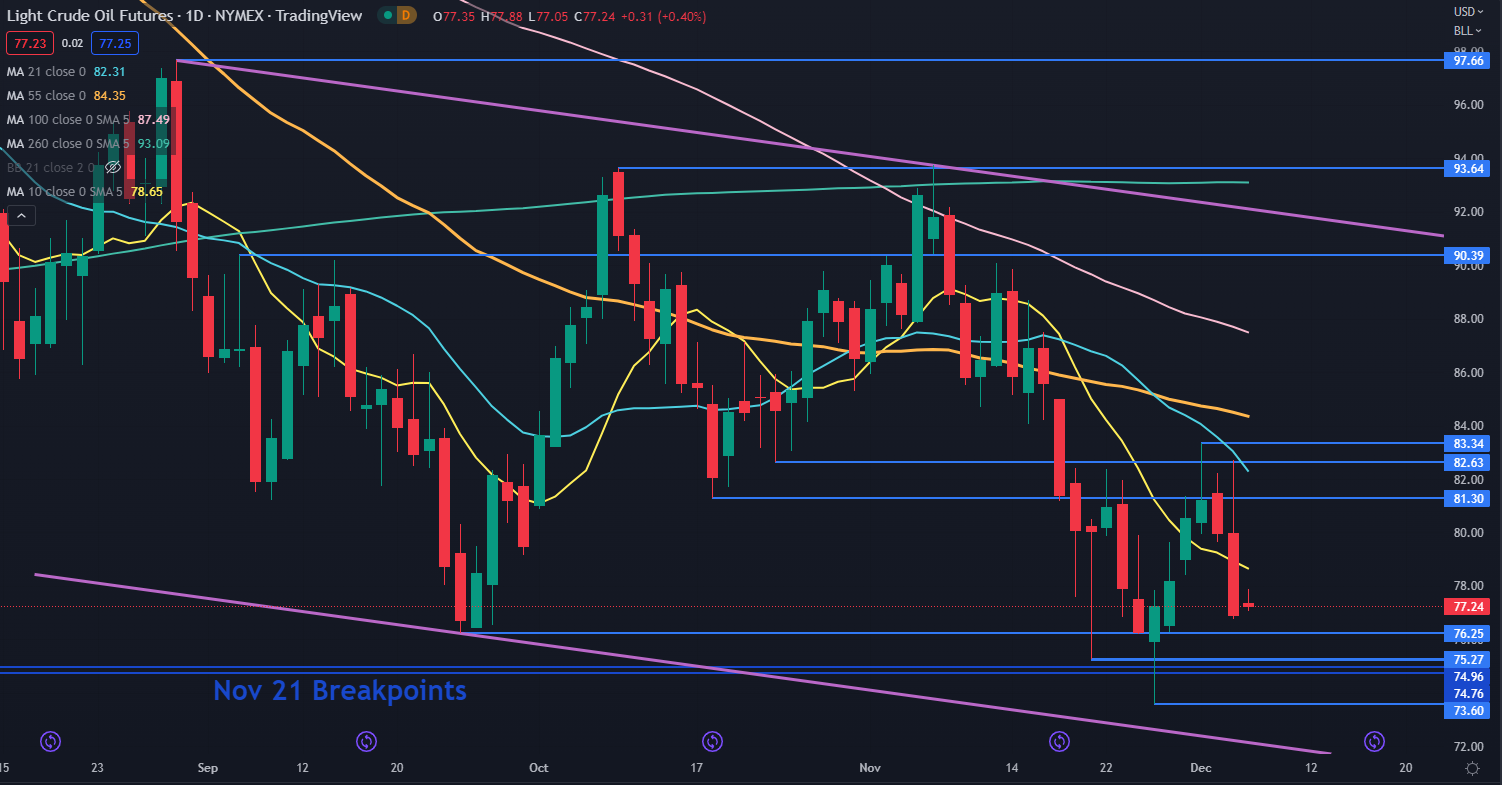
Crude oil was caught up in the melee and the WTI futures contract to a low of US$ 76.77 bbl while the Brent contract touched US$ 82.52 bbl. Both contracts recovered slightly into the close and have been steady so far today.

Treasury yields soared higher across the curve and the 2s 10s inverted beyond 80 basis points (bps) again.

Wall Street went lower on tightening fears with the Nasdaq leading the way, down -1.93% in the cash session.

Asian equity markets have been mixed with Japan’s Nikkei 225 and China’s CSI 300 showing small gains. Hong Kong’s Hang Seng index and Australia’s ASX 200 are in the red.

The RBA hiked rates by 25 basis points today to 3.10% as forecast, eventually underpinning the Aussie Dollar. The yield curve flattened with Australian Commonwealth Government Bonds (ACGB) bumping up in yield. The 3-year note added 6 bp to be near 3.10%.

Japanese Yen was hardest hit with USD/JPY trading above 137 again today. Gold is trading near US$ 1,770 at the time of going to print.

Looking ahead, after German factory orders, the US and Canada will see trade data.

The full economic calendar can be viewed here.

CRUDE OIL TECHNICAL ANALYSIS

The WTI contract broke below the 10-day simple moving average (SMA) in the last session to reclaim its position below all period SMAs. This may indicate that bearish momentum could evolve.

Support could be at the breakpoints of 76.25, 75.27, 74.96 and 74.76 or at the recent low of 73.60.

On the topside, resistance might be at the breakpoints and the recent high of 81.30, 82.63 and 83.34.

image1.png


UK service sector remains in downturn during November

The UK service sector registered another modest contraction of activity during November as levels of incoming new work continued to fall amid ongoing economic uncertainty and cost of living challenges weighing on discretionary spending. Cost pressures showed little signs of abating, with operating expenses again rising sharply, although pricing power was limited to some degree by rising competition and falling sales. Firms continue to hire additional staff as they sought to address skills shortages at their units, but confidence in the outlook remains historically subdued, despite improving noticeably since October.

image1.png

GBP/USD Catches its Breath as the Dollar and Risk Sentiment Remain the Driving Force

GBP/USD FUNDAMENTAL BACKDROP

Cable reached a high of 1.23420 against the greenback in Asian trade before the European open brought a modest dollar recovery pushing the pair back below the 1.2300 handle. The initial bounce in the Asian session could be attributed to news over the weekend regarding the relaxation of ‘Covid Zero’ protocols in China boosting overall sentiment.

Friday’s US NFP report failed to keep dollar bulls interested as gains made following the release were surrendered by the end of the US session. The jobs data on Friday may still be on the mind of investors as wages (average hourly earnings) continued to show growth in the US hinting that inflationary pressures remain a concern. Despite the increase in wages the probability of a 50bps hike by the Fed at its upcoming meeting continued to increase (80% today vs 76% pre-NFP). The only significant data out today is the ISM non-manufacturing PMI for November which could provide some support to the dollar should it beat estimates.

image1.png

For all market-moving economic releases and events, see the DailyFX Calendar

Cable on the other hand has limited high impact data releases this week while the economic outlook remains cloudy. The recent bounce has had more to do with dollar weakness and improving market sentiment than any significant changes to the UKs outlook moving forward. The recent inflation print out of the UK showed food prices continue to rise which could in theory dent sales around the festive season as households prioritize essentials purchases.

 From a technical perspective, GBP/USD remains in overbought territory while moves continue to be driven by the dollar index and broader sentiment. We remain above the 200-day MA which could provide support should we see a retracement. Given that the Federal Reserve and the Bank of England have entered their blackout periods and a lack of data from the UK there remains a possibility that the GBP/USD struggles to maintain its recent momentum. On the upside 1.2500 remains a key psychological barrier that could cap any further gains. A return of some dollar strength could bring support at the 1.2000 level into play.

GBP/USD Daily Chart – December 5, 2022

Chart, histogram  Description automatically generated

image1.png

EUR/USD Price Forecast: Fewer Risk Events Favors EURUSD Rise

European Gas Prices on the up?

The picture in Europe has been looking up for a while now as sentiment, while extremely low, has picked up, EU stocks and the DAX have largely outperformed their US counterparts and European gas prices have fallen at a time when the weather has proven to be rather mild. One thing to keep in mind is that colder weather is forecasted to be on the way, which tends to see a rise in the price of natural gas in the region particularly as the wind dies down.

This week we look ahead to EU GDP data which is expected to reveal a very modest 0.2% quarter on quarter improvement and a whole host of ECB speakers ahead of next week’s final interest rate meeting of the year. This morning

European Gas Prices (Dutch TTF Futures)

image1.pngSource: Investing.com, prepared by Richard Snow

Despite the rosier conditions thus far, something that hasn’t fared particularly well is real wage growth, which has witnessed a massive drop. In Germany, real wages have dropped 5% year on year. Reduced purchasing power has been partially alleviated by a drop in the dollar, meaning that all dollar denominated commodities like oil and gas drop to a degree. Real wages are expected to take a further hit as ECB officials expect inflation to peak in the first half of next year. This morning the ECB’s Makhlouf communicated a preference for 50 bps next week but couldn’t rule out a 75 bps hike.

image2.pngThe weekly EUR/USD chart reveals the nearby level of resistance at the 38.2% Fibonacci level where price action has already retreated from. Therefore, early signs of a potential pullback (recoil) towards 1.0450 emerges before the next advance. Longer-term resistance appears at 1.1000 but a lot depends in incoming inflation prints in the US and economic data, weather and gas prices in the eurozone.

EUR/USD Weekly Chart

image3.pngThe daily chart highlights 1.0805 as the next level of resistance, however, the RSI and MACD indicator are flashing signs of an overextended market. The RSI has not yet broken into overbought territory and so this is something to watch as price action develops. After the rather choppy rise in EUR/USD, it would not be unusual for prices to consolidate around the 1.0450 zone of support before assessing the likelihood of a bullish continuation.

EUR/USD Daily Chart

image4.png

Few Major Risk Events Ahead

Euro area GDP growth, US PPI and consumer sentiment dominate an otherwise quiet week, although, it is a week that sees the RBA and BoC decide on rate hikes. A reasonably lower PPI print certainly favors the current hopes that inflation has peaked, possibly adding fuel to the dollar selloff.

image5.png

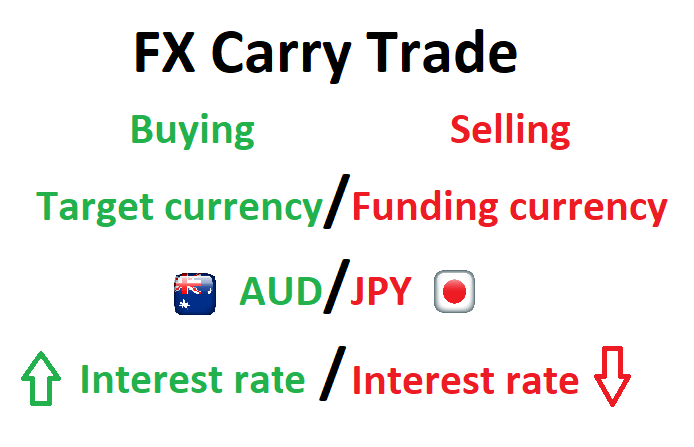
Currency carry trade infographic

Currency Carry Trade: What is it and how does it work?

A currency carry trade involves borrowing a low-yielding currency in order to buy a higher yielding currency in an attempt to profit from the interest rate differential. This is also known as “rollover” and forms an integral part of a carry trade strategy. Traders gravitate towards this strategy in the hope of collecting daily interest payments over and above any currency appreciation from the actual trade.

This article explains FX carry trades with the use of examples and presents a top carry trade strategy to use in your trading.

What is a currency carry trade and how does it work?

An FX carry trade involves borrowing a currency in a country that has a low interest rate (low yield) to fund the purchase of a currency in a country that has a high interest rate (high yield). Holding this position overnight will result in an interest payment being made to the trader based on the “positive carry” of the trade.

The lower yielding currency is referred to as the “funding currency” while the currency with the higher yield is referred to as the “target currency”.
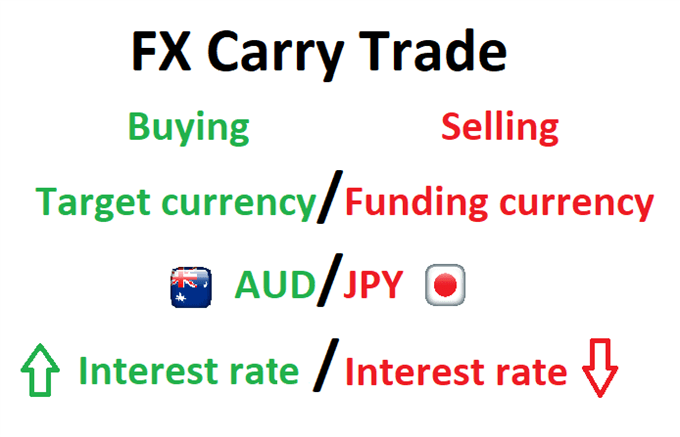
Currency carry trade infographic

Rollover

“Rollover” is the process whereby brokers extend the settlement date of open forex positions held past the daily cut-off time. The broker either debits or credits the account, based on the direction of the trade (long or short) and whether the interest rate differential is positive or negative. Since interest is quoted as an annual figure, these adjustments will be the daily adjusted rate.

Interest rates

Interest rates are set by a country’s central bank in accordance with the mandate of that country’s monetary policy – this will differ from country to country. A trader then earns interest on a position when they are long the currency in the pair with the higher interest rate. For example, if the Australian dollar offers 4% and the Japanese Yen has interest rates set at 0%, traders could look to buy (long) AUD/JPY to take advantage of the 4% net interest rate differential.

There are two main components to the FX carry trade:

1) Changes in interest rates

The main component of the carry trade is centered around the interest rate differential between the two traded currencies. Even if the exchange rate between the two currencies remains unchanged, the trader will profit from the overnight interest payment. However, over time, central banks deem it necessary to alter interest rates and this poses a potential risk to the carry trade strategy.

2) Exchange rate appreciation/depreciation

The other component of the carry trade strategy focuses on the exchange rate of the two currencies. A trader looks for the target currency to appreciate (increase in value) when long. When this happens the payoff to the trader includes the daily interest payment and any unrealised profit from the currency. However, the profit the trader sees, as a result of the target currency appreciating, will only be realised when the trader closes the trade.

It is possible for a trader to lose money when the target currency depreciates against the funding currency so that the capital depreciation wipes out the positive interest payments.

Currency carry trade example

Continuing with the example used above, if the Australian Official Cash Rate is currently at 4% and the Japanese Yen yields 0%, a trader may decide to take a long trade on AUD/JPY if the pair is likely to rise.
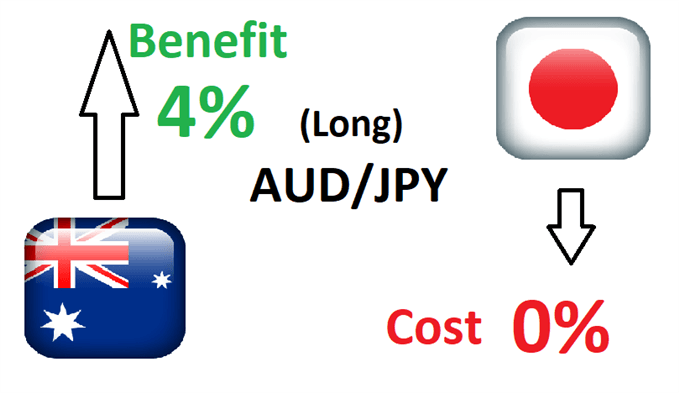
FX carry trade example using AUD/JPY

Traders looking to capitalise on the interest rate differential will essentially be borrowing Yen at the much lower rate and receiving the higher interest rate associated with the Australian dollar. In reality, retail traders will receive less than 4% as forex brokers usually apply a spread.

For a detailed example of how to calculate the approximate overnight interest charge/gain, read our article on understanding foreign exchange rollover.

The risks involved with carry trades

A currency carry trade, like most trading strategies, carries a degree of risk and therefore, requires the adoption of sound risk management. Risk management has become even more important since the 2008/09 global financial crisis which resulted in lower interest rates for developed nations, forcing carry traders to look to riskier, high yielding emerging markets currencies until interest rates normalize.

  • Exchange rate risk: Should the target currency weaken against the funding currency, traders that are long the pair will see the trade move against them but will still receive the daily interest.
  • Interest rate risk: If the country of the target currency reduces interest rates and the country behind the funding currency increases interest rates, this will reduce the positive net interest rate and is likely to reduce the profitability of the FX carry trade.

FX Carry trade strategy

Filtering FX carry trades in the direction of the trend is one such strategy employed by top traders. This is because the carry trade is a long term trade, and therefore, it’s useful to analyse markets that exhibit strong trends.

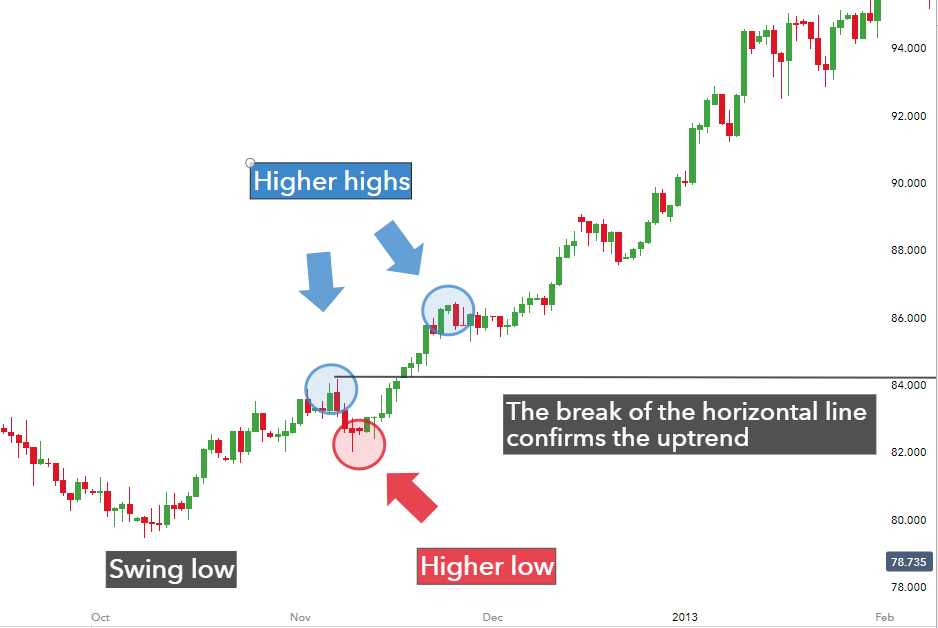
In an attempt to get into higher probability trades, traders should first look to confirm the uptrend which, in the below chart, is confirmed after the higher high and higher low.
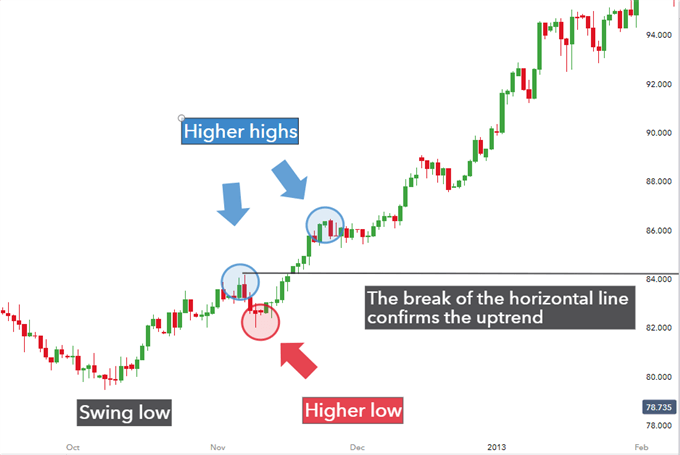
Trend bias in positive carry trade strategy

The figure depicts higher highs and higher lows whereby a break of the horizontal line (drawn at the first higher high) confirms the uptrend. Thereafter, traders can make use of multiple time frame analysis and indicators to spot ideal entry points to enter a long trade.

Conclusion

Currency carry trades present traders with two avenues to profit (exchange rate and interest rate differential) but it is essential to manage risk as losses are can arise when the pair moves against traders or the interest rate differential narrows.

For higher probability trades, traders should look for entry points in the direction of an uptrend and should protect downside risk by utilizing prudent risk management techniques.

image1.png

Gold Price Outlook – Looking to Build the Next Leg Higher?

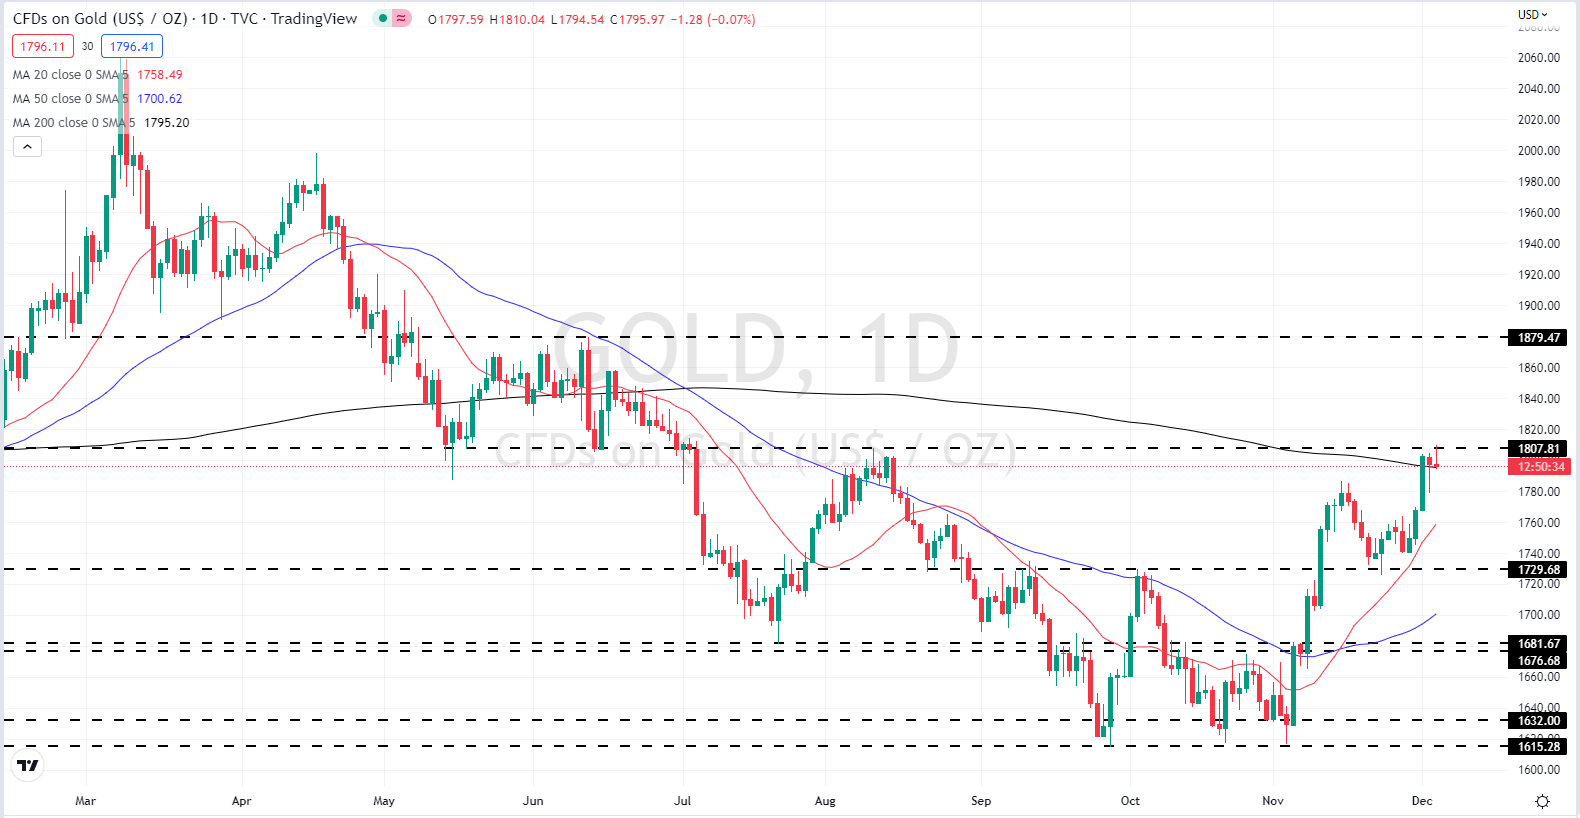
The ongoing US dollar sell-off, and fall in US Treasury yields, continues to boost the value of gold with the precious metal breaking above $1,800/oz. for the first time since early July. While the move higher was subsequently rejected, gold looks set to re-test this multi-month high and push even further ahead.

For all market-moving data releases and events, see the DailyFX Economic Calendar.

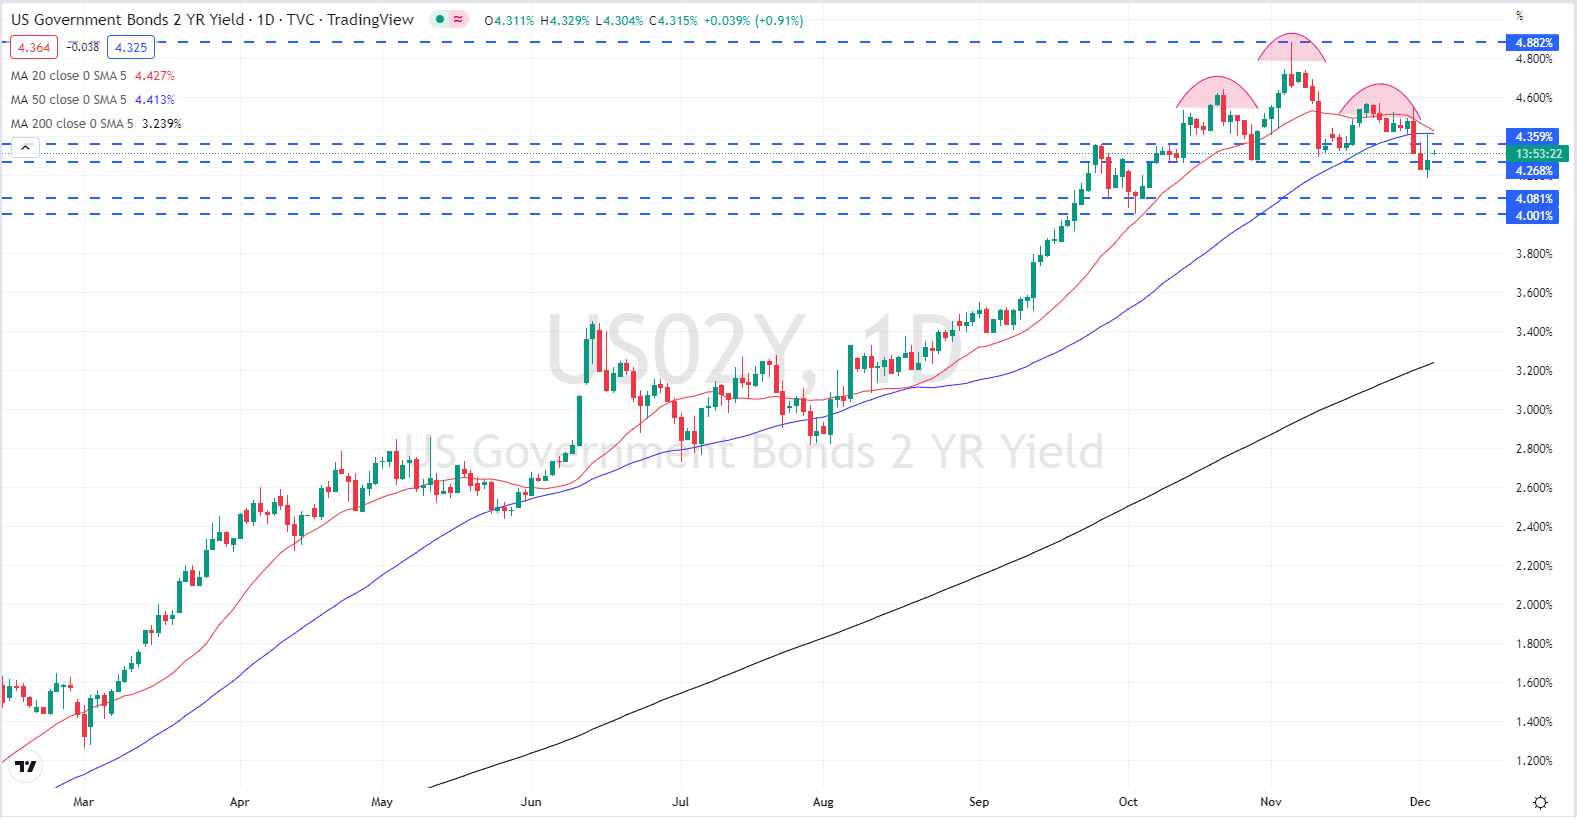
The short-term decline in the US dollar continues with the greenback giving back a chunk of this year’s gains against a host of other currencies. This USD sell-off has helped push the price of gold higher over the last few weeks. The recent shift in the Fed’s stance from repeated over-sized rate hikes to a more considered pace has seen short-term US Treasury yields, and the greenback, fall sharply, and further falls look likely. The interest-rate sensitive UST 2-year has made a classic head and shoulders pattern and with the neckline of the formation now under threat, a re-test of the 4% level is seen.

 US Treasury 2-Year Yield Chart – December 5, 2022

image1.png

With the US dollar coming under increasing pressure, the outlook for gold looks positive although a period of short-term consolidation looks set to play out. For the precious metal to forge further ahead it needs to cement its position above the 200-day moving average that currently sits at $1,795/oz. A break above this technical indicator, and resistance at $1,807/oz. would leave the June 13 lower high at $1,879/0z. the next objective. A period of consolidation around current levels may be seen before the next move higher.

Gold Daily Price Chart – December 5, 2022

image2.png

image1.png

Japanese Yen Strengthens Against US Dollar and Euro. Where to for EUR/USD and EUR/JPY?

USD/JPY TECHNICAL ANALYSIS

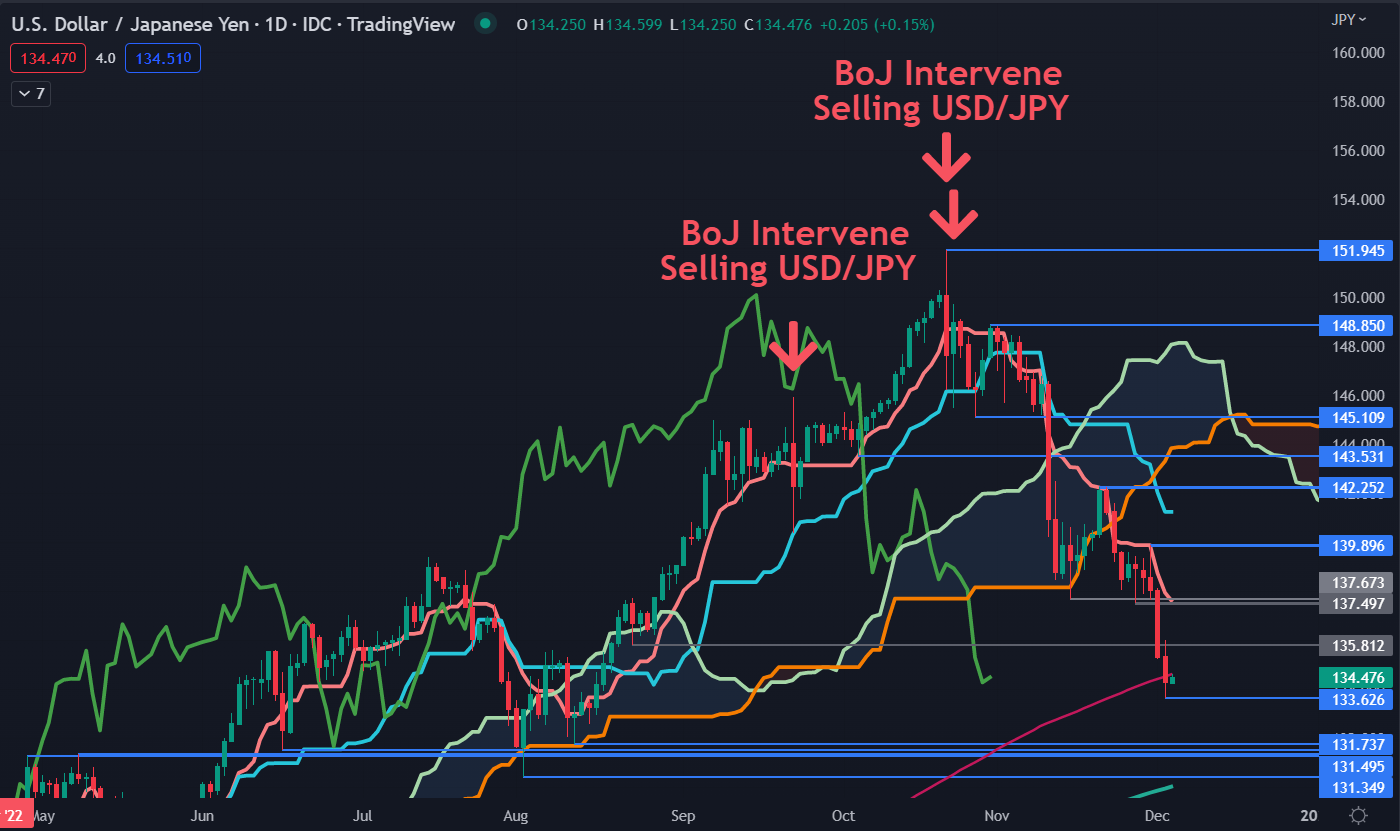
After breaking below the Ichimoku Cloud, USD/JPY bearishness unfolded as it pressed to a 3-month low on Friday at 133.63. That level might provide support in the near term.

Further down there is a cluster of previous lows and breakpoints that may provide support at 131.74, 131.50, 131.35, 131.25 and 130.40.

Under there, the 260-day Simple Moving Average (SMA) is currently at 130.00 and could be a level to watch.

The move lower on Friday also saw the price go below the 200-day SMA. It is now below all SMAs of less than 200-days and this may indicate that bearish momentum is possibly evolving.

Support could be at the previous lows of 137.67 and 135.81 or at the breakpoint of 135.57.

Previous support levels that have been broken might now offer breakpoint resistance at 135.81, 137.50 and 136.67.

Further up, resistance could be at the previous peaks of 139.90 and 142.25.

image1.png

EUR/JPY TECHNICAL ANALYSIS

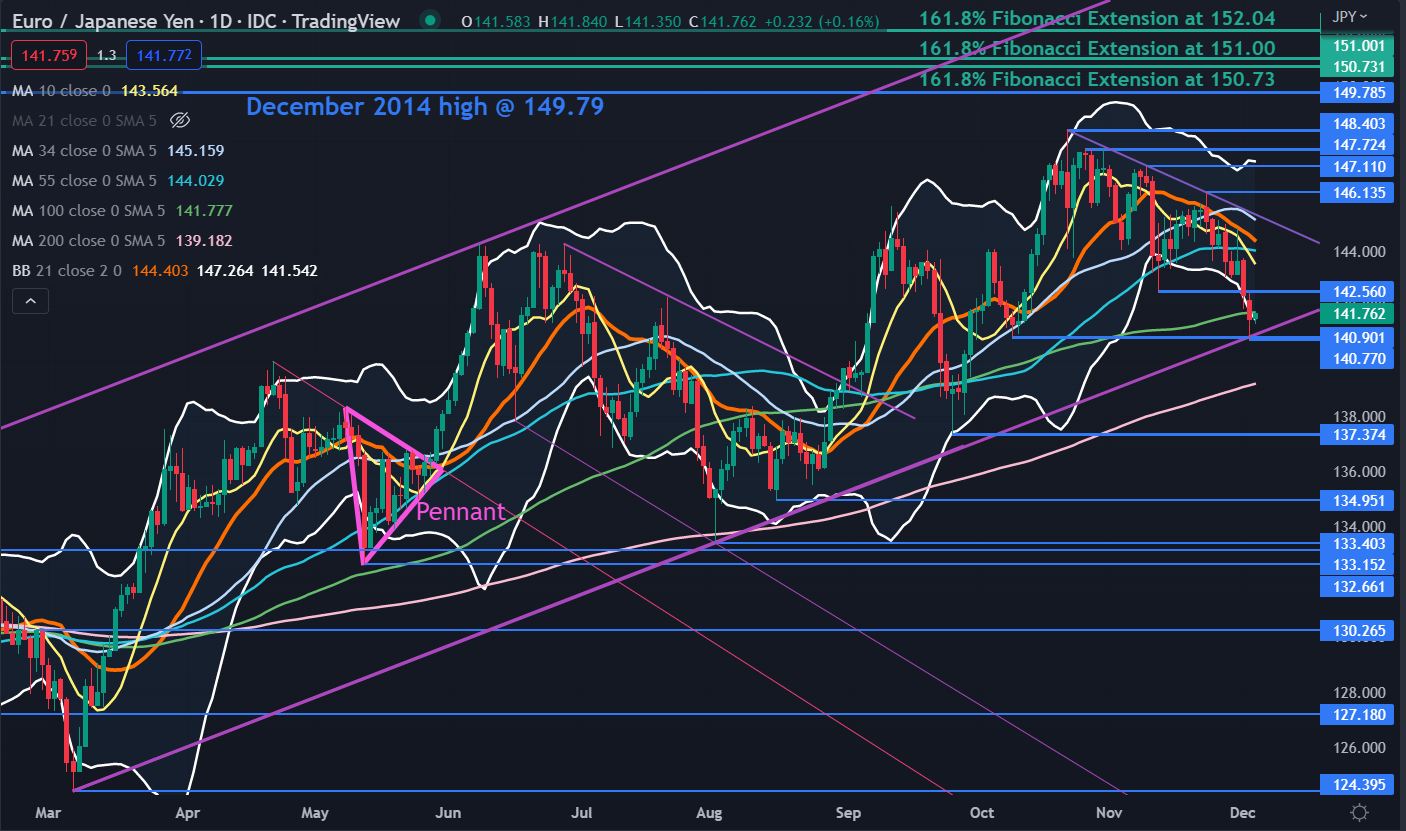
EUR/JPY tumbled to a 2-month low on Friday but was unable to sustain the move under a previous low at 140.90 when it touched 140.77. These levels might provide support.

That look lower was also unable to penetrate an ascending trend line and it too may provide support, currently intersecting at 141.00.

The close on Friday was at 141.53 which was below the lower band of the 21-day Simple Moving Average (SMA) based Bollinger Band at 141.92 at the time. A close back inside the band could signal a pause in bearishness or a potential reversal.

The price is currently below all SMAs 100-days or less but remains above the 200- and 260-days SMAs. This might indicate that short and medium-term momentum could be bearish but that underlying longer-term momentum is yet to confirm this.

Support may lie at the previous lows of 137.37, 134.95 and 133.40. On the topside, resistance might be offered at the breakpoint of 142.56 or the prior peaks at 146.14, 147.11, 147.72 and 148.40.

Resistance could also be offered at the December 2014 peak of 149.79. Beyond there, a series of Fibonacci Extension levels may offer resistance at 150.73, 151.00 and 152.04.

image2.png


You Think The US Labor Market Is Hot? Think Again

Quick reminder: from January 1st, getting access to this content (and much more!) will require a paid subscription.

The exclusive offer to get in by paying 9 months instead of 12 runs until December 10 (only 6 days left), and spots are limited.

If you find value in these macro strategy pieces, you are going to love the enhanced TMC products in 2023 – check out which subscription tier suits you the most and take advantage of this exclusive offer!

The Labor Market Holds The Key

Especially at turning points, looking beyond the main headlines in macro data can make the difference in understanding where do we really stand in the macro cycle.

The last US payroll report was tagged as very strong – but if you look deeper you realize the current state of the US labor market is far from ‘‘hot’’.

Job creation is clearly trending down, alternative real-time and forward-looking labor market indicators point to a sharp deterioration ahead and statistical inconsistencies are artificially boosting non-farm payrolls to the point the US government reached out to ask if I could help them look into it.

The labor market holds the key to the Fed reaction function in 2023, and hence it will be a crucial driver of asset classes performance – calling it right can make the difference for portfolios next year.

No OPEC+ oil shakeup as Russian price cap stirs uncertainty

. The Saudi-led OPEC oil cartel and allied producing countries, including Russia, are scheduled to decide how much oil to supply to the global economy amid weakening demand in China and uncertainty about the impact of new Western sanctions against Russia that could take significant amounts of oil off the market.

FRANKFURT, Germany (AP) — The Saudi-led OPEC oil cartel and allied producers including Russia did not change their targets for shipping oil to the global economy amid uncertainty about the impact of new Western sanctions against Russia that could take significant amounts of oil off the market.

The decision at a meeting of oil ministers Sunday comes a day ahead of the planned start of two measures aimed at hitting Russia’s oil earnings in response to its invasion of Ukraine. Those are: a European Union boycott of most Russian oil and a price cap of $60 per barrel on Russian exports imposed by the EU and the Group of Seven democracies.

It is not yet clear how much Russian oil the two sanctions measures could take off the global market, which would tighten supply and drive up prices. The world’s No. 2 oil producer has been able to reroute much, but not all, of its former Europe shipments to customers in India, China and Turkey.

The impact of the price cap is also up in the air because Russia has said it could simply halt deliveries to countries that observe the limit. But analysts say the country would likely also find ways to evade the cap for some shipments.

On the other side, oil has been trading at lower prices on fears that coronavirus outbreaks and China’s strict zero-COVID restrictions would reduce demand for fuel in one of the world’s major economies. Concerns about recessions in the U.S. and Europe also raise the prospect of lower demand for gasoline and other fuel made from crude.