China Economic Activity Plummets as Covid Cases Surge to Record

China’s economic activity contracted further in November amid a record Covid outbreak, with growth likely to remain weak and the central bank expected to add more stimulus to bolster the recovery.

The official manufacturing purchasing managers index fell to 48 this month, the National Bureau of Statistics said on Wednesday, the lowest reading since April and worse than an estimate of 49 in a Bloomberg survey of economists.

The non-manufacturing index, which measures activity in the construction and services sectors, declined to 46.7 from 48.7 in October, also lower than the consensus estimate of 48. A reading below 50 indicates contraction, while anything above suggests expansion.

The economy is suffering increasing damage and residents have taken to the streets to protest tighter Covid controls in several major cities recently. Economists expect growth to slow to around 3% this year, putting pressure on officials to step up stimulus to spur the recovery next year.

“Policymakers are working at full steam to create strong impetus for growth with stimulus packages,” said Bruce Pang, chief economist and head of research for Greater China at Jones Lang LaSalle Inc. He sees China’s economy as likely to return to a potential growth rate of over 5% “no earlier” than the second quarter of next year, assuming less disruptions from Covid outbreaks and curbs.

China’s benchmark CSI 300 Index of stocks rose 0.28% as of the mid-day break, led by energy and telecom service shares. The yuan traded onshore strengthened 0.18% to 7.1449 per dollar as of 11:31 a.m. local time, while the yield on 10-year government bonds was up 2 basis points at 2.91%.

Manufacturing PMI gauges measuring output, new orders, raw material inventories and employment all contracted in November at a faster pace than the month before. A sub-index measuring suppliers’ delivery times also fell further, a sign of supply disruptions.

What Bloomberg Economics Says…

Recovery will be slow as China works out ways to live with the virus, but each new sign of economic weakness is likely to nudge in the direction of loosening Covid Zero. Any new approach will need to strike a delicate balance: boosting economic activity without allowing an unmanageable spread of the virus.

— Chang Shu and David Qu

For the full report, click here.

Economic activity will likely continue to weaken in December and the first quarter of next year, according to Zhang Zhiwei, chief economist at Pinpoint Asset Management Ltd., adding that a reopening-fueled rebound seems set for the second half of 2023.

“At this early stage of reopening, more cities face rising number of Covid patients,” he said. “These cities have to impose restrictions to ‘flatten the curve.’ The economic cost is inevitable.”

As Covid outbreaks spread, more companies are seeing infections rise among their employees. About 53% of Chinese firms reported a Covid case in their workforce in November, according to a survey of more than 2,400 companies across the nation by China Beige Book International. That was the highest in data back through January last year.

About a quarter of China’s total gross domestic product is now affected by lockdowns, according to a recent estimate from Nomura Holdings Inc. That was higher than the firm’s previous peak recording of 21% in April, when the whole of Shanghai was shut down to curb Covid cases.

“In November, Covid outbreaks brought negative impact to some firms’ production and operation. Production activity slowed, and product orders declined,” Zhao Qinghe, a senior statistician at the NBS, said in a statement.

While the government has taken steps to help the economy recently — including lowering the amount of cash banks must hold in reserves and offering financing support to property developers — the policies aren’t likely to be enough to shore up household and business confidence.

Bloomberg Economics downgraded its GDP growth forecast for this year to 3% from 3.5%, and trimmed next year’s projection to 5.1% from 5.7%. The International Monetary Fund said Tuesday it may have to trim its forecast for China’s growth because of Covid restrictions and property sector turmoil. The IMF currently sees China’s GDP expanding 3.2% this year and 4.4% in 2023.

Several economists say the central bank could provide more stimulus in the coming months as the global outlook makes it somewhat more favorable for China to ease monetary policy.

Adjustments to the reserve requirement ratio and banks’ loan prime rate are “possible early next year,” said Zhou Hao, chief economist at Guotai Junan International Holdings Ltd.
U.S. yields rise ahead of Powell speech, November jobs data

NEW YORK, Nov 29 (Reuters) – U.S. Treasury yields rose on Tuesday as investors awaited comments this week by Federal Reserve Chairman Jerome Powell and labor market data for November that could reinforce expectations the U.S. central bank will slow its pace of hiking interest rates.

Powell will address the economy, inflation and labor on Wednesday at the Brookings Institution, while the non-farm payrolls report comes out Friday, with economists polled by Reuters expecting 200,000 jobs to have been added this month.

Investors also are waiting for data on U.S. gross domestic product for the third quarter, Chicago manufacturing numbers and factory activity based on the Institute for Supply Management.

“We haven’t gotten any new information, new economic data that would significantly alter the (market’s) path,” said Tom Simons, money market economist at Jefferies & Co.

The market has been slow to incorporate “extremely consistent” messaging from the Fed that it is not done hiking rates, which will be in smaller increments, but that once they get to the terminal rate it will stay there for a while, Simons said.

Fed funds futures have priced in a 63.5% chance of a 50-basis-point hike at the Fed’s policy meeting Dec. 13-14, with the terminal rate peaking at 5.007% next June and then falling to 4.644% in December 2023. FEDWATCH.

Markets believe “the Fed is going to be able to pivot toward a more neutral level of the federal funds more quickly than is likely to be the case,” Simons said.

The yield on 10-year Treasury notes US10YT=RRrose 5 basis points to 3.752%, while the two-year US2YT=RR yield, which typically moves in step with interest rate expectations, rose 1.5 basis points at 4.486%.

The yield curve measuring the gap between yields on two- and 10-year notes US2US10=RR remained deeply inverted at -73.6 basis points. The inversion, when yields on short-dated debt are higher than longer-dated debt, indicates a looming recession.

“The bond market has a pretty heavily inverted yield curve pricing in a pretty lengthy recession with an understanding the Fed isn’t going to be there right away to rescue the market if things slow down,” Simons said.

Investors sold Treasuries as they anticipate details about Amazon.com Inc’s AMZN.O multi-tranche corporate bond deal.

The deal features two-, three-, five-, seven- and 10-year notes. The initial price talk on the maturities is U.S. Treasuries plus 45 basis points (bps, 55 bps, 85 bps, 100 bps, and 115 bps, respectively.

Wall Street dealers typically look to lock in borrowing costs for corporate bonds they are underwriting. As part of that process, a dealer sells Treasuries as a hedge to lock in the borrowing cost on the bond issue before the deal is completed. Once the bond is sold, the dealer buys Treasuries to exit the “rate lock.”

“We are the low end of the range yields. When you see corporate supply as a factor, we tend to see a little sell-off,” said Subadra Rajappa, head of U.S. rates strategy, at Societe Generale in New York.

The yield on the 30-year Treasury bond US30YT=RR was up 5.5 basis points at 3.804%.

The breakeven rate on five-year U.S. Treasury Inflation-Protected Securities (TIPS) US5YTIP=RR was last at 2.358%.

The 10-year TIPS breakeven rate US10YTIP=RR was last at 2.267%, indicating the market sees inflation averaging about 2.3% a year for the next decade.

The U.S. dollar 5 years forward inflation-linked swap USIL5YF5Y=R was last at 2.465%. The swap is seen by some as a better gauge of inflation expectations due to possible distortions caused by the Fed’s quantitative easing.

Nov. 29 Tuesday 3:47 p.m. New York / 2047 GMT

EUR/USD closing in most bullish month in 12 years ahead of Eurozone inflation, Federal Reserve talk

EUR/USD remains pressured around 1.0330, after printing a two-day downtrend, as it prepares for the big day during early Wednesday in Asia. Even so, the major currency pair stays on the way to posting the most significant monthly run-up in 12 years as Federal Reserve’s (Fed) signals for easy rate hikes got appreciation, even if the latest hawkish Fed talks allowed the United States Treasury bond yields and the US Dollar to consolidate monthly losses.

United States Treasury bond yields, US Dollar lick their wounds

US 10-year Treasury bond yields ended Tuesday on a firmer footing, up six basis points (bps) to 3.748% by the end of the North American trading session. The same helped the US Dollar Index (DXY) to print a three-day uptrend around 106.80 even as statistics from the United States weren’t so upbeat. The reason could be linked to the hawkish comments supporting the US Federal Reserve’s steadily high-interest rates, even if a mild cut in the aggression is expected.

It’s worth noting, however, that the stated bond yields remain negative on a monthly basis, posting the first monthly loss in four, whereas the US Dollar Index stays on the way to printing the biggest monthly loss since September 2010.

That said, New York Federal Reserve Bank President John Williams and St. Louis Fed President James “Jim” Bullard were the latest supporters of higher rates. On the other hand, the US Conference Board (CB) Consumer Confidence Index dropped to 100.2 in November versus 102.2 prior (revised down from 102.5).

Optimism surrounding China contrasts with fears from Eurozone to weigh on EUR/USD

Easing tensions from China contrasts with looming economic fears from the Eurozone and challenge the EUR/USD buyers of late.

After witnessing a retreat in the daily Covid infections from a record high, Chinese authorities took a sigh of relief and announced multiple measures to ease the strict lockdown in the key areas.

Recently, Bloomberg reported the reopening of some city buildings in the greater Zhengzhou region, the home of a key iPhone plant. Earlier on Tuesday, the news broke that China’s Guangdong province will allow the close contacts of Covid cases to quarantine at home.

On the other hand, mixed statistics from Eurozone and comments from the officials failed to push back the chatters surrounding the bloc’s economic slowdown.

That said, the Euro area Economic Sentiment Indicator improved to 93.7 in November versus 93.5 expected and 92.7 prior (revised). However, the bloc’s Business Climate gauge eased to 0.54 from 0.74 previous readings while the Consumer Confidence reprinted -23.9 figures for the said month. Further, Germany’s preliminary inflation, as per the Harmonized Index of Consumer Prices (HICP) indicator, eased to 11.3% YoY while matching the market forecasts versus 11.6% prior. Additionally, inflation as measured by the Consumer Price Index (CPI), declined to 10% YoY during November from 10.4% previous readings. Following the data, Germany’s Economy Minister Robert Habeck said on Tuesday, “We will be and remain a strong land.”

It’s worth mentioning that the bloc is in consultation with the Group of Seven (G7) nations to announce a price cap on Russian Oil exports and teases another round of geopolitical tension with Moscow as Deputy Prime Minister Alexander Novak said on Tuesday that Russia wouldn’t supply Oil under price cap in any case. The same could amplify recession concerns in the bloc and can weigh on the regional currency even if the European Central Bank (ECB) officials appear hawkish. Recently, European Central Bank (ECB) Vice President Luis de Guindos anticipated a decline in headline inflation during the first half of the next year while speaking at a virtual event XIII Encuentro Financiero on Tuesday.

All eyes on Federal Reserve Chairman Jerome Powell

Although a lot is at stake and in the line, market players will pay more attention to the speech from Federal Reserve (Fed) Chairman Jerome Powell’s first public appearance since November Federal Open Market Committee (FOMC) meeting. The event should exert more downside pressure on the EUR/USD price if the Fed boss meets the hawkish expectations of the market.

Ahead of the meeting, Analysts at the ANZ said, “We expect Powell to reaffirm the Fed’s unwavering commitment to tackling inflation, the need for more measured rate rises taking account of increased two-way economic risks as policy becomes restrictive, and a degree of optimism that the Fed will be able to pull off a soft landing.”

Also important will be the preliminary inflation data from Eurozone. As per the Harmonized Index of Consumer Prices (HICP) indicator, the inflation in the bloc is likely to ease to 10.4% YoY versus 10.6% prior, which in turn could weigh on the EUR/USD. The reason could be linked to the impending recession fears and the European Central Bank’s (ECB) readiness to ease if needed, per the latest comments from the officials.

Other than Fed Chair Powell’s speech and Eurozone inflation, an early signal for Friday’s United States Nonfarm Payrolls (NFP), namely the ADP Employment Change for November, will also be closely watched by the EUR/USD traders. The private employment gauge will likely register downbeat figures of 200K versus 239K prior.

Furthermore, the second readings of the United States Gross Domestic Product (GDP) for the third quarter (Q3), expected to confirm 2.6% Annualized growth, will also be crucial for the EUR/USD pair if posting a change.

EUR/USD technical analysis

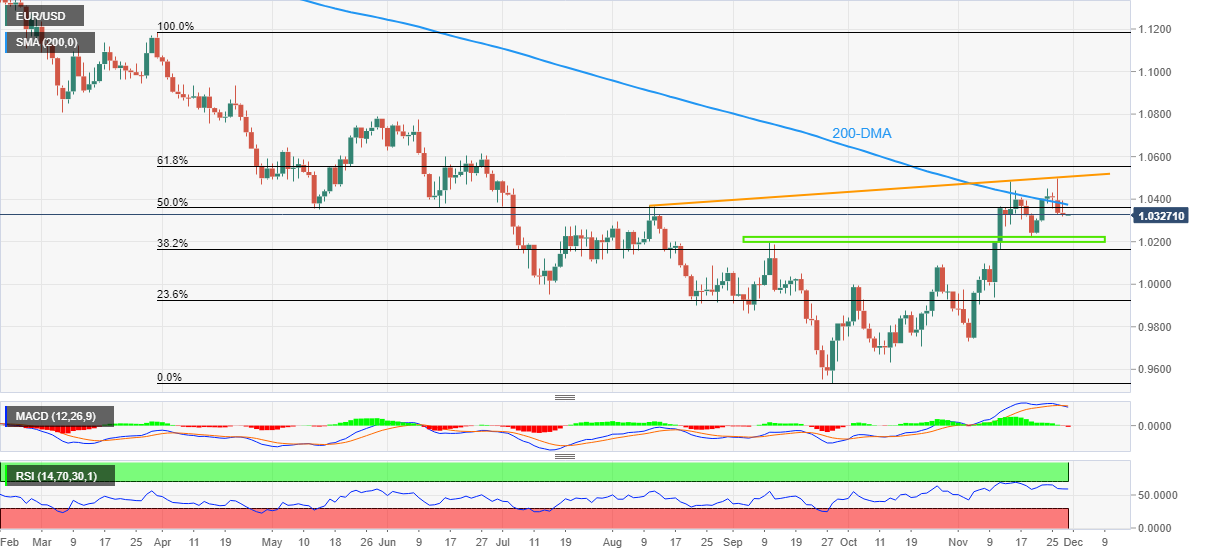
EUR/USD bulls faced rejection from a 3.5-month-old ascending resistance line and the 200-Day Moving Average (DMA).

The following pullback took clues from the Moving Average Convergence and Divergence (MACD) indicator and the Relative Strength Index (RSI) line, placed at 14.

The reason could be a bearish divergence on the RSI and an impending bear cross on the MACD. That said, the higher high on price joins the lower tops on RSI (14) to portray the bearish RSI divergence while the MACD line’s piercing of the signal line from below teases bear cross.

As a result, the EUR/USD bears are all set to approach an 11-week-old horizontal support area surrounding 1.0220-200. However, the quote’s further downside needs validation from the October peak near 1.0095 before directing the sellers toward July’s low of 0.9952.

Alternatively, the 200-DMA and an upward-sloping resistance line from August 10, respectively, near 1.0380 and 1.0510, could restrict the immediate upside of the EUR/USD pair.

Following that, the 61.8% Fibonacci retracement level of the EUR/USD’s south-run trajectory from late March to September 28, close to 1.0555, will precede the June 27 swing high near 1.0615 to challenge the pair buyers.

Overall, EUR/USD bulls run out of steam as traders await the key events.

EUR/USD: Daily chart

Extension of the Bilateral Local Currency Swap Agreement with the Monetary Authority of Singapore

To enhance the financial stability of Singapore and Japan, the Bank of Japan has decided to extend the bilateral local currency swap agreement with the Monetary Authority of Singapore to November 29, 2025, allowing for the exchange of local currencies between the two central banks of up to SGD 15 billion or JPY 1.1 trillion. By utilizing the swap agreement, the Bank of Japan would be prepared to provide liquidity in Singapore dollar in the event that Japanese financial institutions face unexpected difficulties in Singapore dollar settlements, and the Bank judges the liquidity provision tobe necessary for ensuring

NZD/USD Price Analysis: Bears lurking below 0.6200, eyes on trendline support

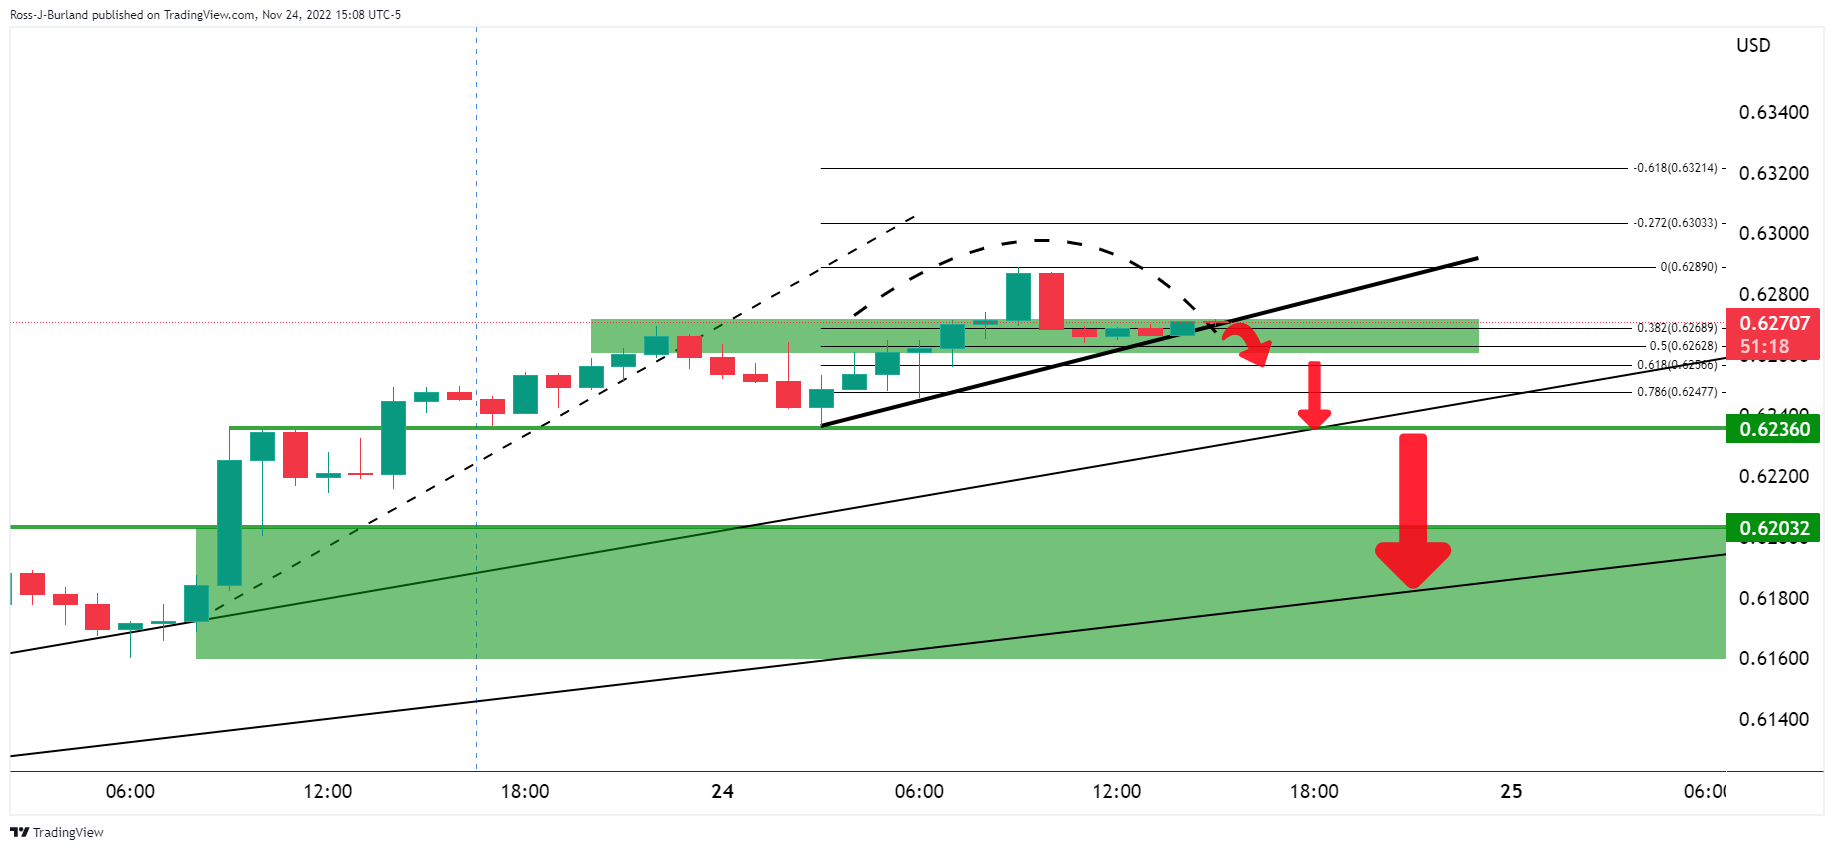
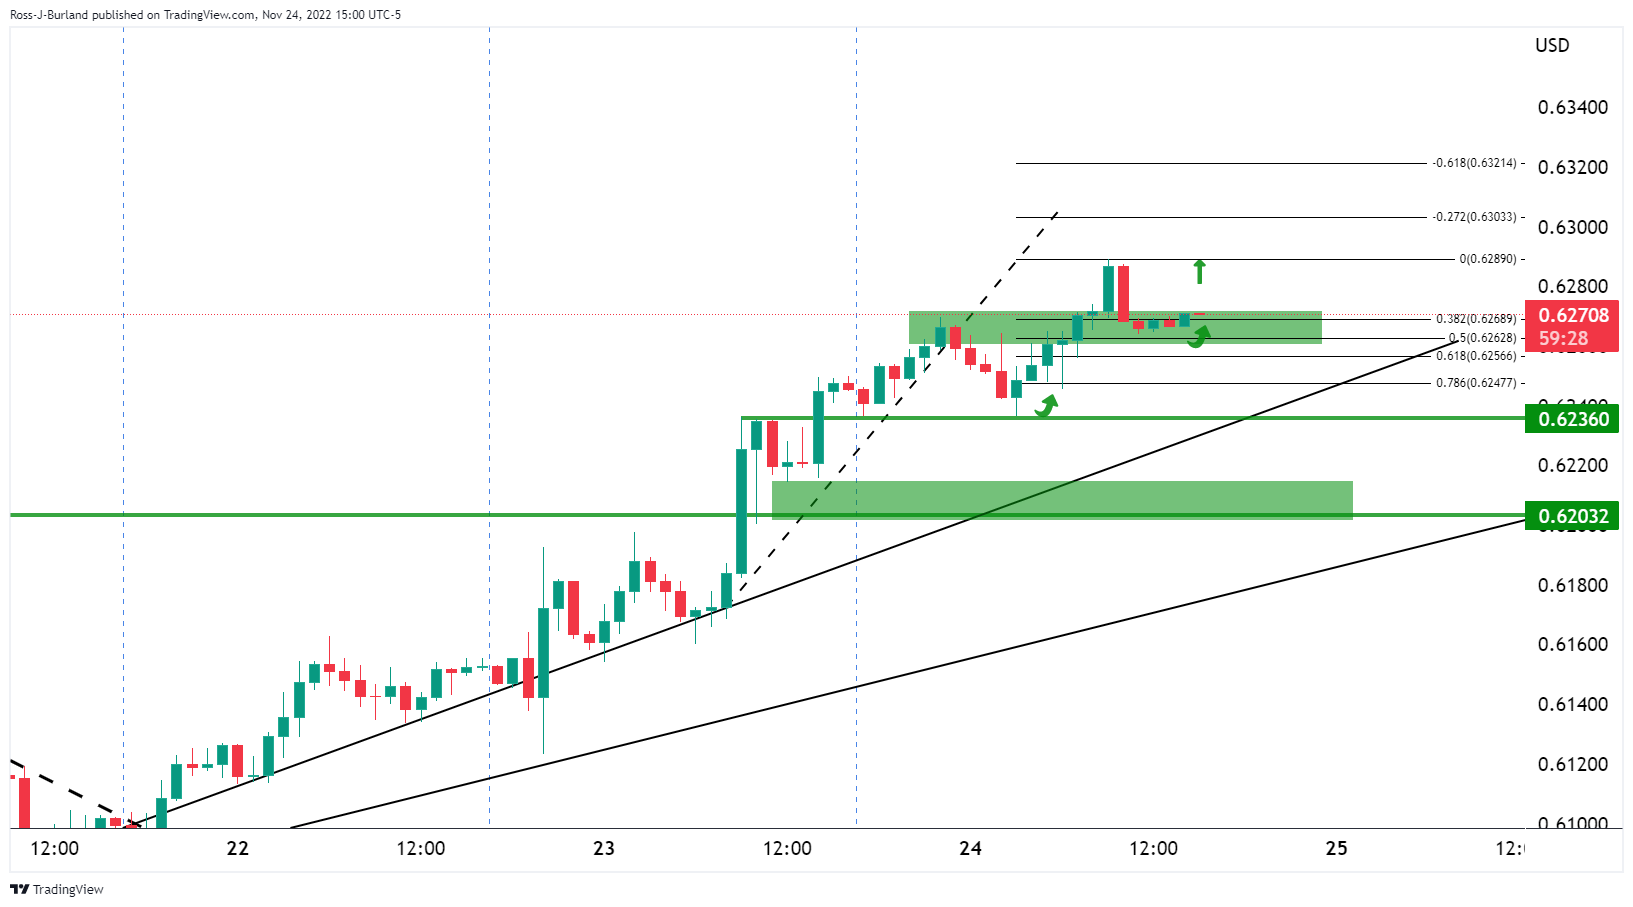
As per the prior analysis, NZD/USD Price Analysis: Bulls seek out 0.6300 while bears eye signs of distribution, the bears indeed moved in and distribution has been in play.

The tweezer top was highlighted as a dominant feature in the prior chart, a bearish candle stick combination pattern that showed sellers were in the market.

NZD/USD prior analysis

The price was now testing the next trendline support and a break there opened the risk of a move to the downside to test below 0.6250 and with eyes that were on 0.6236 as the prior lows and trendline before 0.6200:

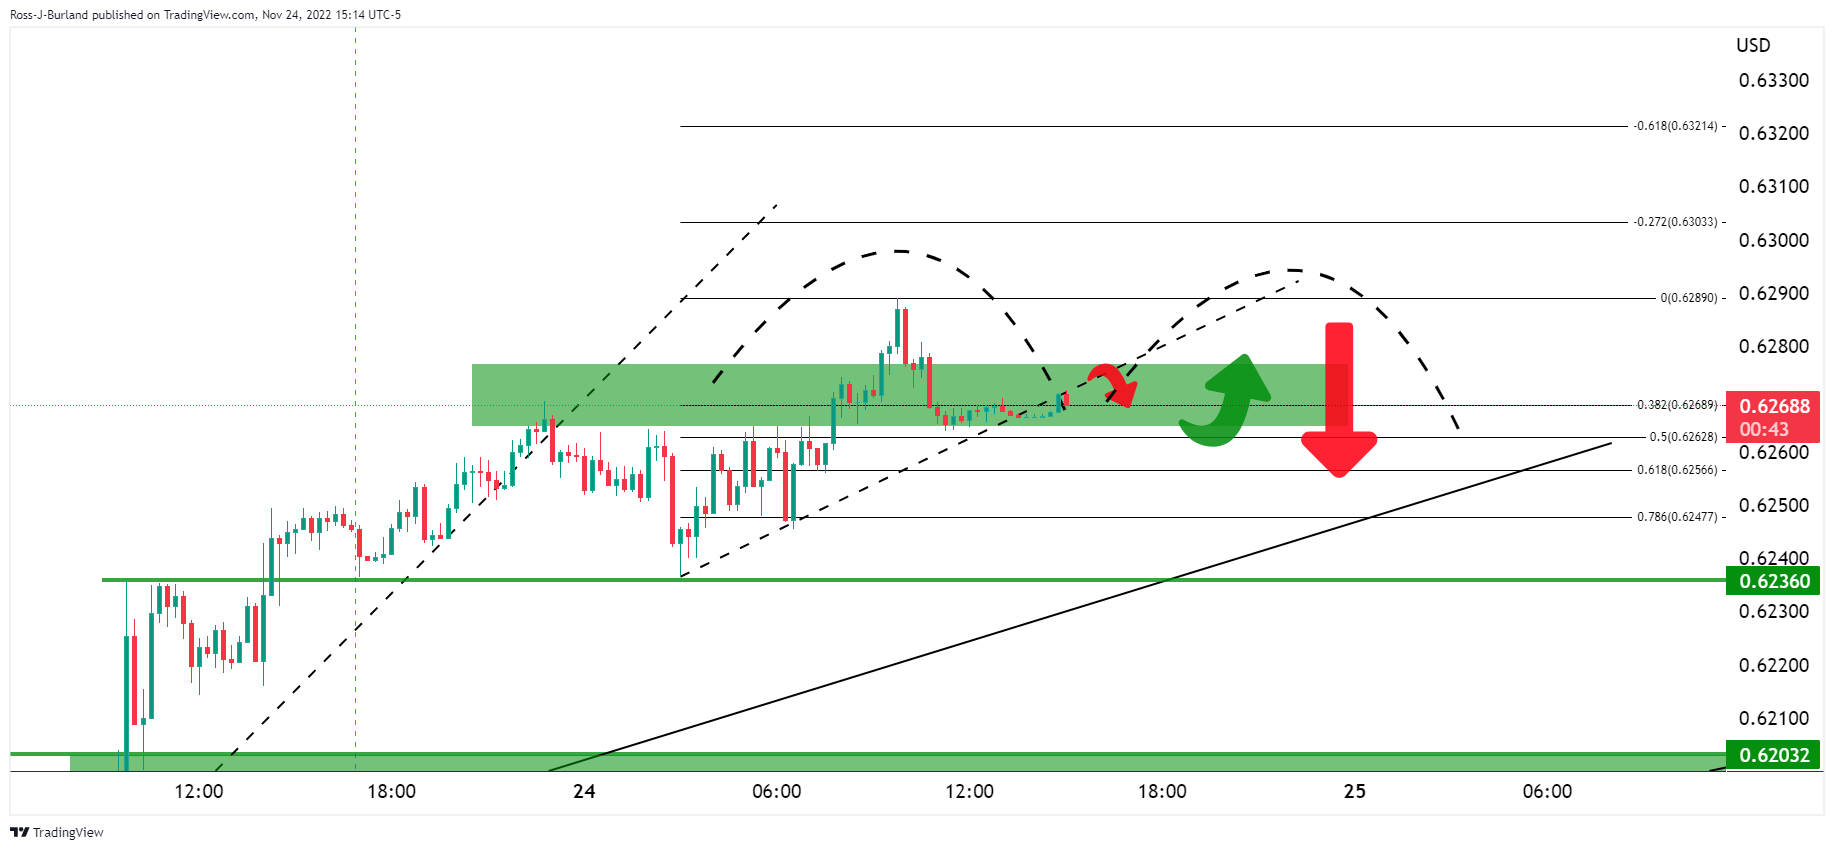
With that being said, it was explained that it would have been unusual for the market to simply melt without a revisit to the peak formation as distribution takes a while to play out, usually as per the following topping scenario shown on the 15-minute chart:

NZD/USD M15 chart

NZD/USD update

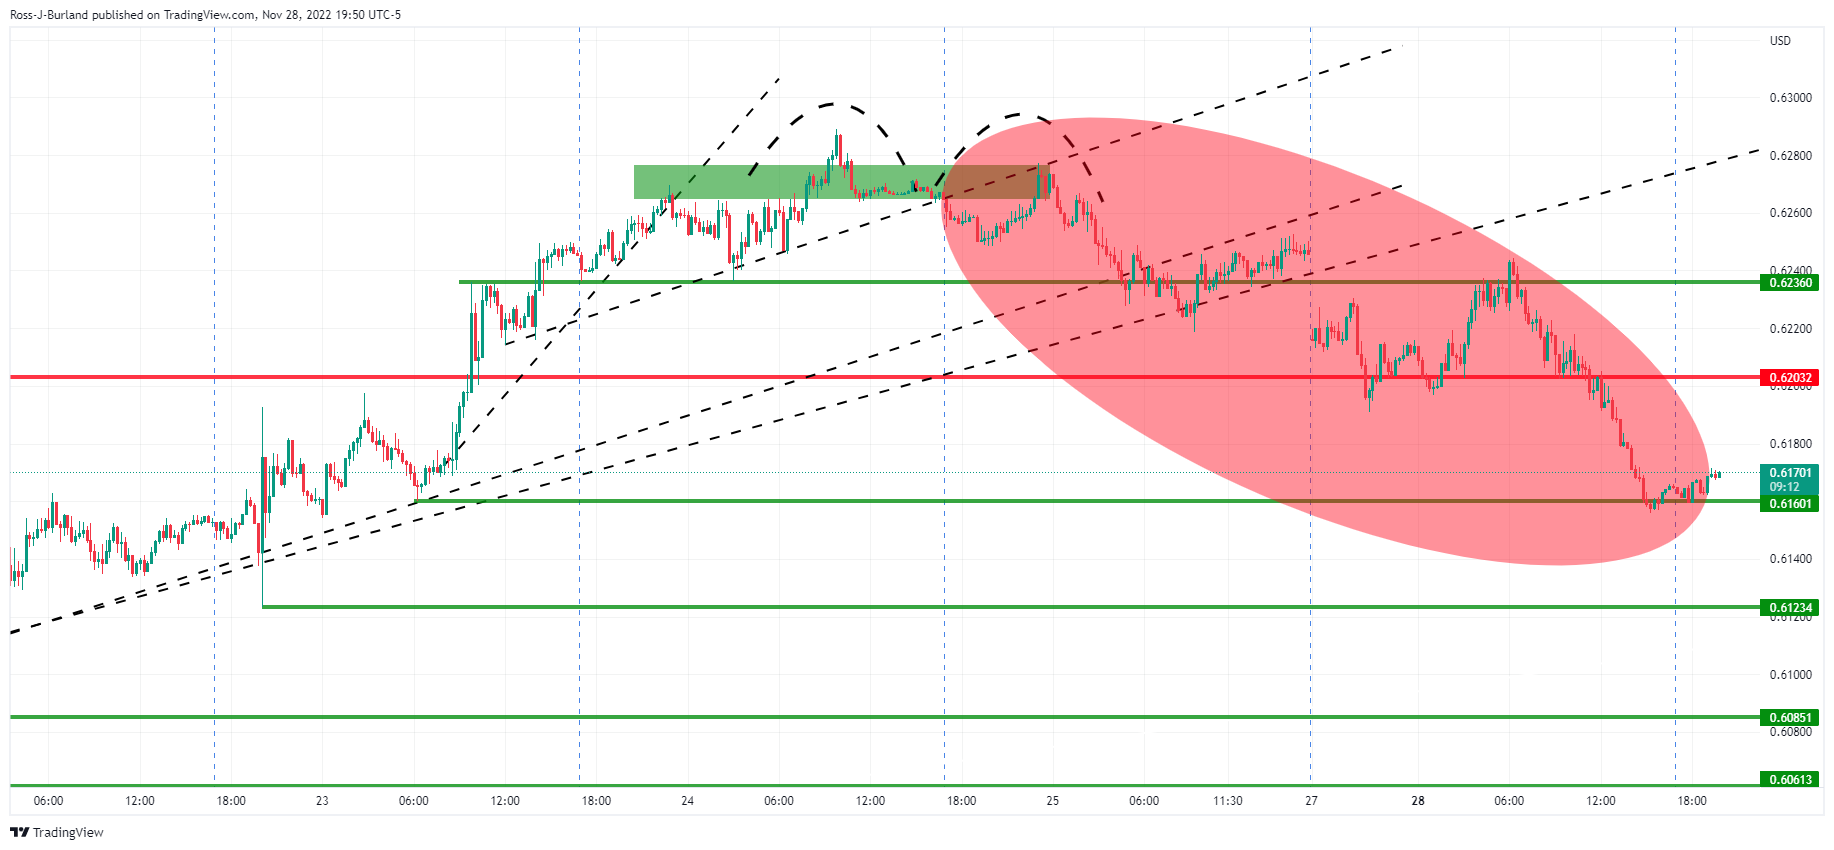
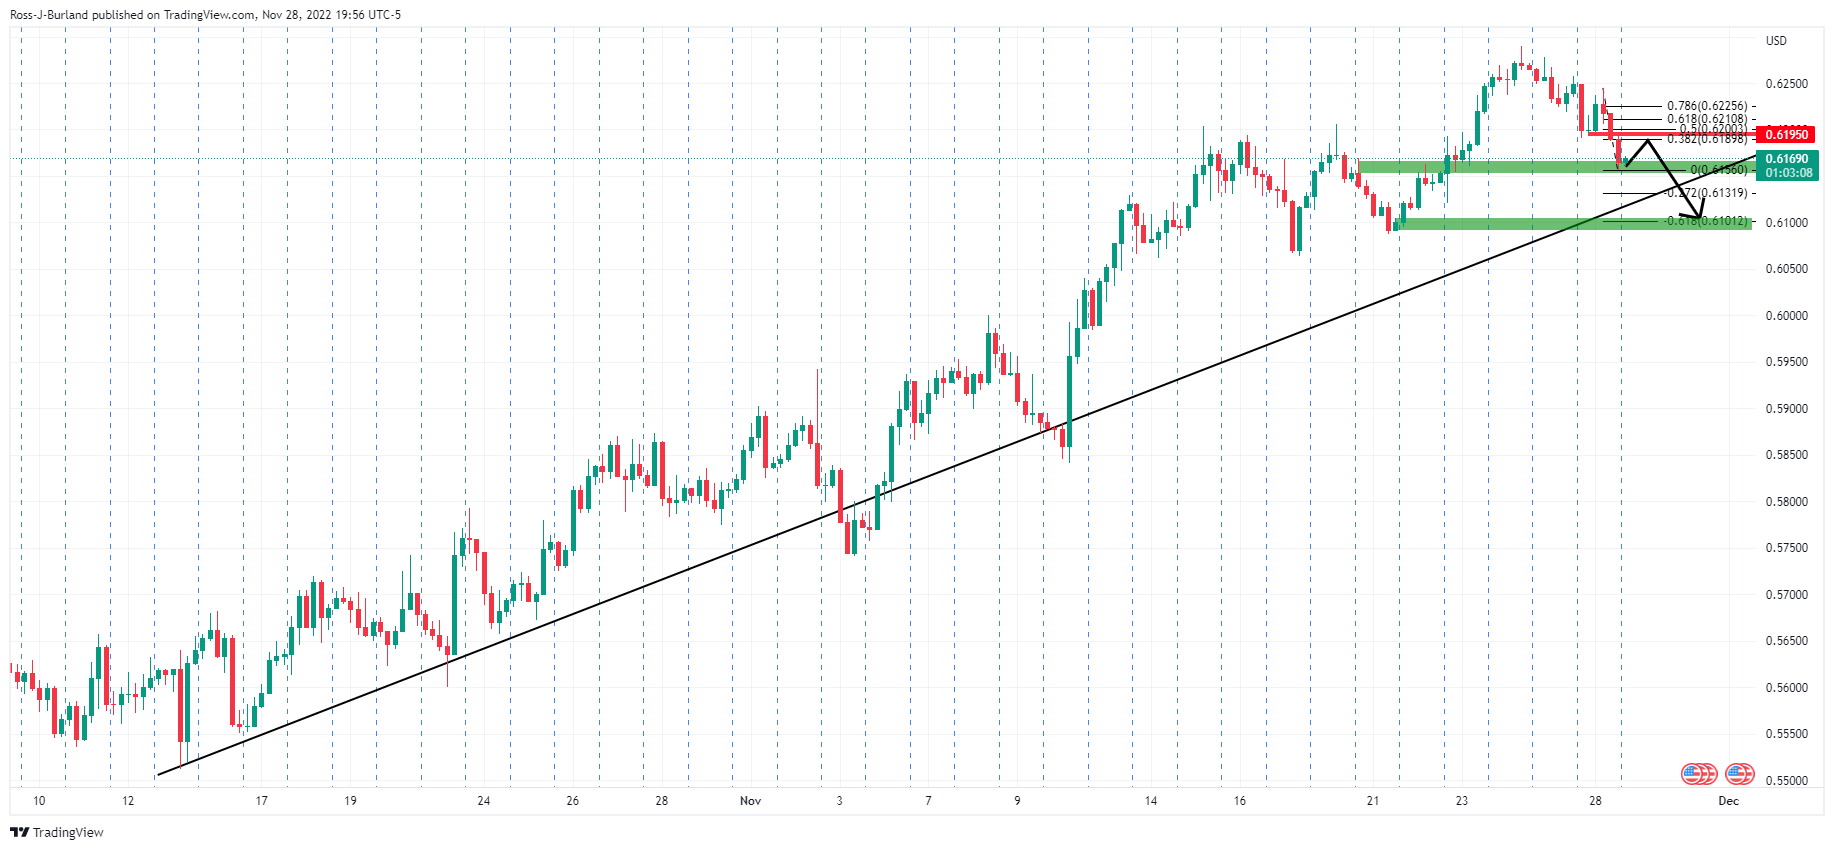
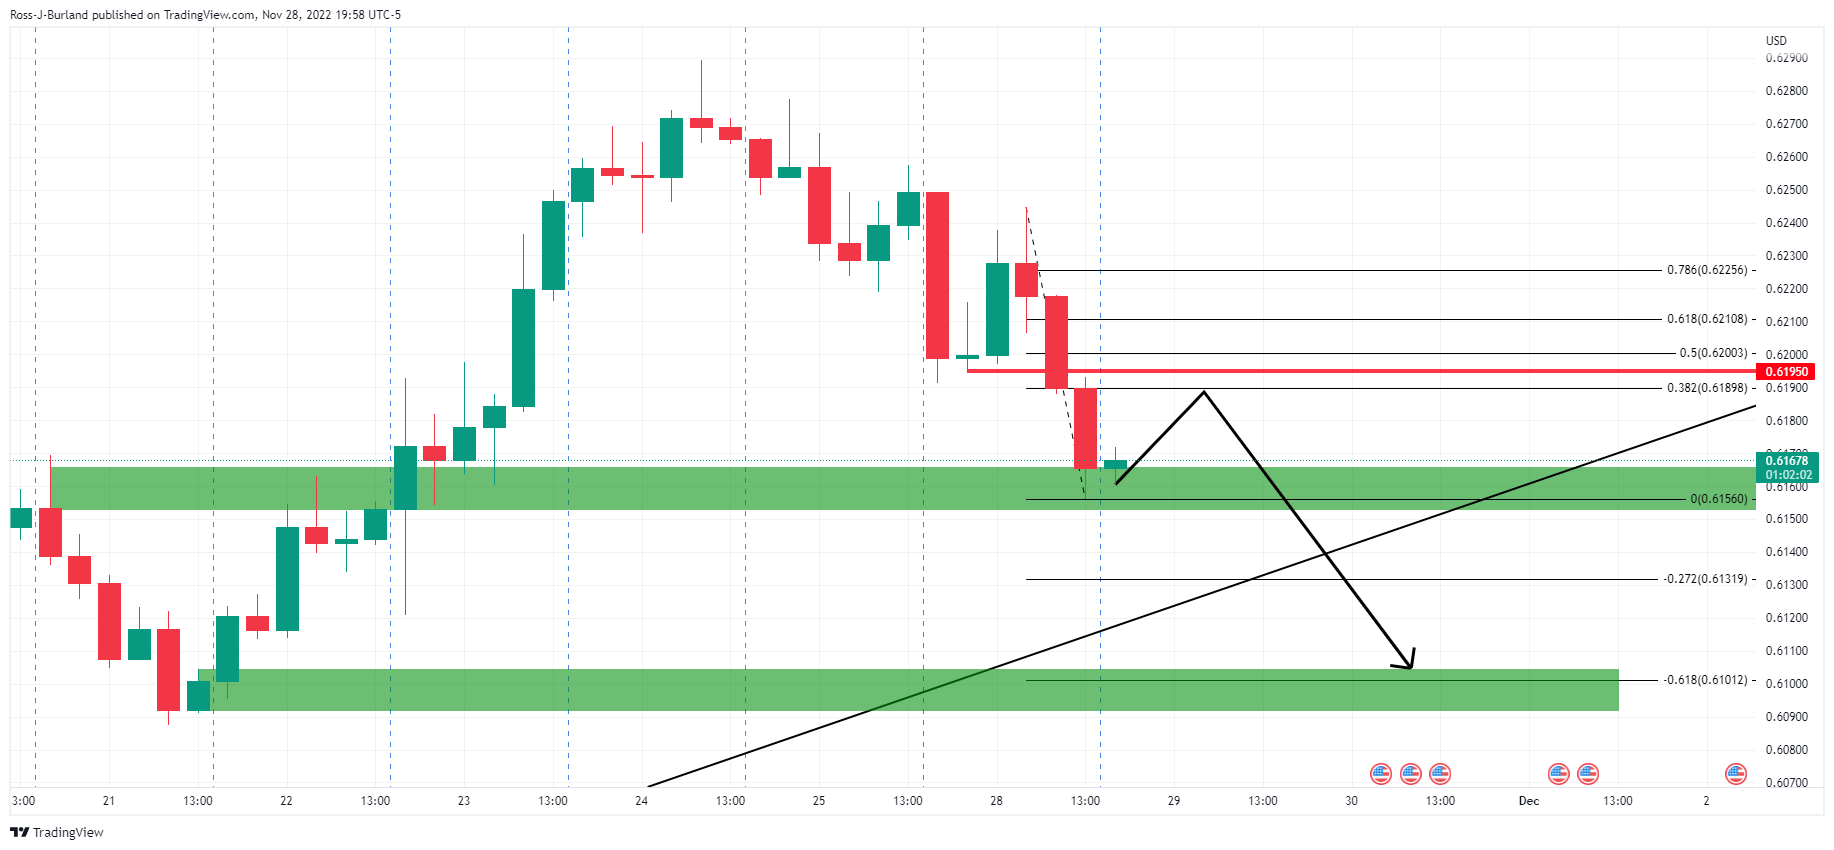
As can be seen, the price indeed returned the upside prior to the full breakdown into 0.6200 and then to the 0.6150s. Going forward a tougher challenge awaits the beats at trendline support:

Zoomed in, the current support near 0.6150 would be expected to hold and result in a meanwhile correction. So long as 0.6200 holds, 0.6100 will be eyed on a test of the trendline support.

All of the World’s Money and Markets in One Visualization (2022)

The era of easy money is now officially over. For 15 years, policymakers have tried to stimulate the global economy through money creation, zero interest-rate policies, and more recently, aggressive COVID fiscal stimulus. With capital at near-zero costs over this stretch, investors started to place more value on cash flows in the distant future. Assets inflated and balance sheets expanded, and money inevitably chased more speculative assets like NFTs, crypto, or unproven venture-backed startups. But the free money party has since ended, after persistent inflation prompted the sudden reversal of many of these

20221128 gbpusd daily bounce

GBP/USD: What’s with all that?

Just two months ago, GBP/USD was trading at its lowest level EVER, reaching a low print of 1.03565.  Today, the pair is trading near 1.1950!  A lot has happened in the last 2 months to bring the pair from the brink of collapse to today’s levels.  Many attributed the selloff to Liz Truss, or at least to her “mini-budget”, which would have left a gaping hole in the budget deficit.  Although this may have been the straw that broke the camel’s back, GBP/USD had been moving lower for months before the late September selloff.  GBP/USD had formed a Year-to-Date high on February 22nd at 1.4250!  The pair had been moving lower as it became apparent that the US Federal Reserve had to begin raising rates quickly. The board finally decided that rising inflation wasn’t transitory. On April 22nd, the pair crashed through 1.3000 and by mid-June the pair was trading 1.2000.  Once at 1.2000, GBP/USD continued lower in an orderly channel until Wednesday, September 21st.  The pair closed at 1.1235, below the bottom trendline of the channel.  Why had it been moving lower since 1.4200?

Source: Tradingview, Stone X
While inflation was flying high in the US, the Fed stepped up its pace of race hikes to 50bps in April.  By mid-June, the Fed was hiking 75bps at a clip.  Meanwhile, Bank of England was only hiking rates by 25bps at a time, as it was particularly concerned about driving the British economy into a recession.  It wasn’t until its last rate hike on November 3rd that the BOE finally hiked by 75bps to bring the cost of borrowing to 3%.  GBP/USD was moving lower due to interest rate differentials.  When the “mini-budget” proposal was presented, liquidity dried up in bonds, causing GBP/USD to collapse.  However, despite previously not raising rates aggressively enough, the BOE did save the UK bond market, which helped the Pound recover.  Now, with inflation at 11.1% YoY in the UK, and “only” 7.7% YoY in the US, its anticipated that the UK will have to hike rates higher and longer than in the US. However, there is also Prime Minister Sunak’s autumn budget which the markets still need to deal with:  Increased taxes and lower spending.  This may help with the BOE’s prediction of a recession coming down the pike.

20221128 gbpusd daily bounce

On daily timeframe, GBP/USD was on a mission to get to 1.2000.  The price rose in an ascending wedge formation and broke out above the top of the pattern.  Expectations are that price should break lower from an ascending wedge.  Will price continue lower from here?  Pullbacks are normal in an uptrend and a pullback to the 38.2% Fibonacci retracement level (at 1.1467) from the lows of September 26th to the highs of November 24th is not out of the question.  However, the pair must pass through support before that level.  The first support level is at the top trendline of the wedge near 1.1900.  If price breaks below there, the next level of support is at the top, downward sloping trendline from the long-term channel near 1.1650, then the bottom trendline of the wedge near 1.1550.  However, if price continues to move higher, resistance (previous highs) ahead of 1.3000 are 1.2293, 1.2660, and 1.2843.

So, if GBP/USD can move lower due to the Fed being more aggressive than the BOE, is the reverse true as well? Or is GBP/USD just having a bear market bounce?  Watch the key support levels to see if price holds.  If it does, then GBP/USD may be on its way towards 1.3000!

ECB Insight: Lagarde Unmistakably Hawkish; ‘It Would Surprise Me’ if Inflation Already at Its Peak

European Central Bank President Christine Lagarde on Monday showed herself from her hawkish side, making it considerably less clear whether the Governing Council would really temper its pace of rate hiking as soon as next month, but also raising the question of how bold forthcoming quantitative tightening decisions will turn out. Notwithstanding the relatively neutral tone of the prepared remarks she had just delivered at European Parliament, Lagarde said during the ensuing Q&A that ‘[h]eadline inflation, the one that we look at most, has hit its highest reading in October … core inflation as well has been very

China State Council press conference at 0700 GMT on COVID – rumours on ending COVID zero

I posted on this a while back: Here’s an interesting item that suggests China may soon dump the COVID zero policy. AUD, NZD, oil, China shares are all getting excited: AUD and NZD are moving higher as China reopening chatter spreads. I can confirm now that there is indeed a news conference being given by the Joint Prevention and Control Mechanism of the State Council in China at 3pm local time in Beijing. 0700 GMT. Update on Chinese stocks:  Hong Kong’s Hang Seng is up 3.7%. Shanghai Composite is up 2%.