Crude oil rose slightly in its latest intraday trading, in a desperate attempt to recover part of its previous losses, while also trying to ease some of its clear oversold conditions on the relative strength indicators, especially with the emergence of a positive crossover that may cautiously support further gains in the near term, if the key support at $89.00 holds. This support represented our latest price target.
Nevertheless, downside pressures remain in place and threaten to send the price lower again, amid the dominance of the short-term corrective bearish trend and continued negative pressure resulting from trading below EMA50, which reduces the chances of a near-term recovery.
Gold rose cautiously in its latest intraday trading, attempting to recover part of its previous losses, supported by positive signals emerging from the relative strength indicators. However, we note that these indicators have entered deeply overbought territory, signaling the potential loss of positive momentum and threatening the latest gains with a return of downside pressure.
This comes amid continued negative pressure resulting from the price trading below EMA50, which represents dynamic resistance that reinforces the dominance of the bearish trend in the short term, especially as the price moves along a trend line supporting this path.
The Australian dollar edged higher against a basket of global currencies in Asian trading on Tuesday, attempting to recover from a seven-week low against its US counterpart as buying from depressed levels picked up following the Reserve Bank of Australia’s decision to raise interest rates to their highest level since 2011.
In line with expectations, the Reserve Bank of Australia raised interest rates by 25 basis points to 4.60%, the highest level since October 2011, marking its fourth rate hike this year and bringing total increases to 100 basis points.
The Price
• AUD/USD rose 0.15% to $0.7029, from the day’s opening level of $0.7019, with a low of $0.7008.
• The Australian dollar ended Monday down 0.1% against the US dollar, resuming losses that paused on Friday during a recovery from a seven-week low of 70.04 US cents.
Reserve Bank of Australia
In line with expectations, the Reserve Bank of Australia’s monetary policy board decided on Tuesday to raise interest rates by 25 basis points to 4.60%, the highest level since October 2011.
RBA raises interest rates to 15-year high
The decision was unanimously approved by the Reserve Bank of Australia’s board, following three rate hikes since the beginning of the year aimed at slowing the economy and bringing elevated inflation under control.
The RBA stressed that inflation remains high and noted that some of the upside risks it identified in August have already begun to materialize.
The Australian central bank said the widening conflict in the Middle East has pushed global energy prices higher, with some of the increase in fuel costs passing through to the prices of other goods and services.
The RBA said further tightening in financial conditions was warranted, while keeping the door open to additional interest rate hikes if necessary. Future decisions will depend on incoming data and developments in the outlook and risks.
Australian interest rates
• Markets currently price the probability of a 25-basis-point rate hike by the Reserve Bank of Australia in November at around 50%.
• Investors are awaiting further Australian inflation, unemployment and wage data to reassess those expectations.
• Reserve Bank of Australia Governor Michele Bullock is due to speak shortly at a press conference on the latest monetary policy decisions and economic developments.
Australian dollar outlook
We expect the Australian dollar to remain in positive territory against its US counterpart, supported by the possibility of a fifth Australian interest rate hike this year.
The Australian dollar could strengthen more broadly if Bullock’s comments are more hawkish than markets currently expect, significantly boosting expectations for another interest rate hike in November.
The USDJPY price rose in its recent intraday trading following the consolidation of the key support level at 157.00, which provided positive momentum that helped the pair achieve these gains. The price remains supported by EMA50, which reinforces the chances of extending those gains in the near term, especially as it moves along a short-term ascending corrective trend line, increasing the potential for a rise, alongside positive signals emerging from the relative strength indicators.
Silver price continued to decline in its recent intraday trading, breaking below the current support level at $61.00, confirming the continued dominance of selling forces over price action. This comes amid the dominance of the short-term corrective downtrend, with continued negative pressure resulting from trading below EMA50, which acts as dynamic resistance and limits its chances of recovery in the near term.
On the other hand, the relative strength indicators have started to show positive signals after reaching deeply oversold levels, which may help curb the pace of the consecutive losses, amid the continued negative pressures surrounding the price.
The GBPUSD price declined in its recent intraday trading after the stability of the current resistance level at 1.3280, alongside the formation of a bearish divergence on the relative strength indicators after reaching deeply overbought levels and beginning to produce negative signals, which has intensified the negative pressures.
This comes amid continued negative pressure resulting from trading below EMA50, which is acting as dynamic resistance and reinforcing the dominance and stability of the main short-term downtrend.
The EURUSD price declined in its recent intraday trading, amid continued negative pressure resulting from its trading below EMA50, which acts as dynamic resistance and reinforces the dominance of the main short-term bearish trend, as the price moves along a descending trend line supporting this path, increasing the selling pressure surrounding it.
On the other hand, positive signals are emerging from the relative strength indicators, but they have yet to be reflected in the price performance, signaling that the negative pressures remain strong and continue to dominate its intraday movements.
The crude oil price rose in its recent intraday trading, attempting to recover, but it continues to move along a short-term corrective descending trend line, which limits the chances of a full recovery in the near term, especially with continued negative pressure resulting from trading below EMA50, intensifying the bearish pressures.
In addition, these movements come amid negative signals from the relative strength indicators after reaching deeply overbought levels, increasing the likelihood of a decline in the coming period.
The gold price continues to record consecutive losses in its recent intraday trading, amid continued negative pressure resulting from trading below EMA50, which acts as dynamic resistance and reinforces the dominance of the short-term corrective downtrend, especially as the price moves along a descending trend line supporting this path.
On the other hand, the relative strength indicators have started to show positive signals after reaching deeply oversold levels, which may curb the pace of the decline as the price needs to unwind some of these oversold conditions. This could help it attempt to recover part of its previous losses.
The Federal Reserve (Fed) and the Bank of Japan (BoJ) have just done something remarkably similar. Both central banks raised interest rates by 25 basis points (bps) last week, both are confronting inflation risks, and both signal that future decisions will depend on incoming economic data.
On paper, the two decisions appear to tell the same story: Monetary policy is becoming tighter on both sides of the Pacific. Markets, however, rarely trade on the headline alone.
What investors believe will happen next can matter much more than what a central bank has just done. And once the market reaction following the two decisions is brought into the picture, the apparent similarity between the Fed and the BoJ begins to disappear.
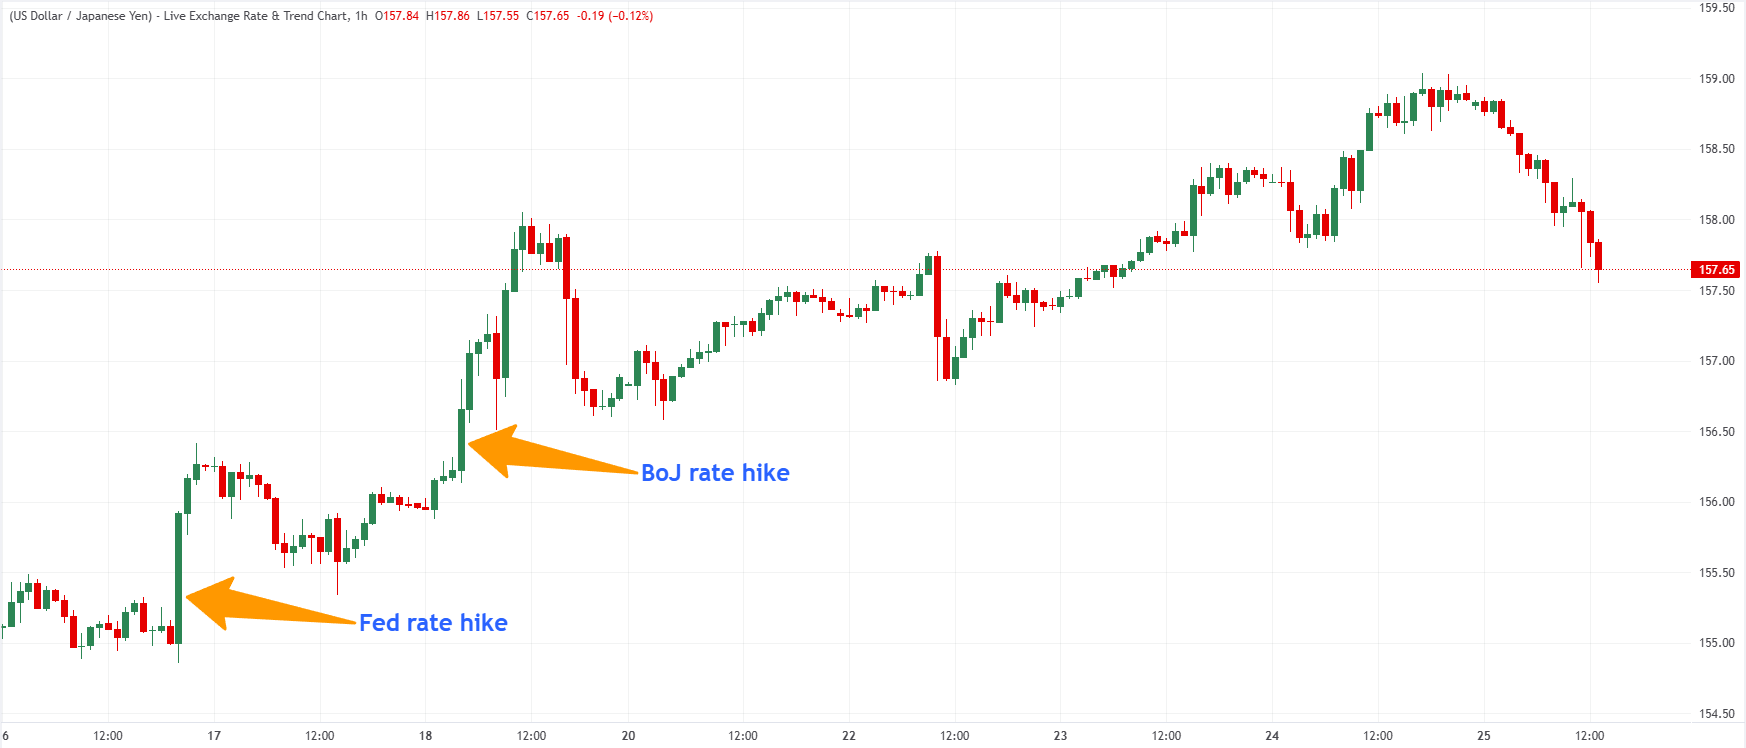
The USD/JPY chart makes that divergence difficult to miss.
The USD/JPY chart reveals which rate hike markets believe
The Fed raised interest rates by 25 bps on Wednesday, September 16, taking its target range to 3.75%-4.00%. Two days later, on Friday, September 18, the BoJ followed with its own 25-basis-point increase, lifting its policy rate to 1.25%, the highest level in 31 years.
However, USD/JPY rose after the two central-bank decisions, clearly indicating how investors interpreted them.
A rising USD/JPY means that the US Dollar (USD) is appreciating against the Japanese Yen (JPY), and that the JPY is weakening. In other words, even though both central banks tightened policy by the same 25 bps, the currency market treated the two decisions very differently.
That reaction is particularly striking on the Japanese side. The BoJ raised its policy rate to 1.25%, its highest level in 31 years. Higher interest rates would normally be expected to make a currency more attractive by increasing returns on assets denominated in that currency. Yet the Japanese Yen weakened after the decision.
The explanation lies less in the rate hike itself than in what accompanied it.
The BoJ approved the increase by a 7-2 vote, with board members Toichiro Asada and Ayano Sato opposing the move. Governor Kazuo Ueda also provided no clear timetable for another increase, leaving investors uncertain about how quickly the central bank is prepared to continue normalizing monetary policy.
Ray Attrill, head of FX strategy at National Australia Bank, told Reuters that the BoJ had “clearly underwhelmed versus expectations,” noting that the two dissenting votes raised additional questions about the strength of the central bank’s tightening consensus.
The market, therefore, received a rate hike, but not necessarily the promise of a forceful hiking cycle.
The Fed delivered the same hike but a very different signal
The Fed also raised interest rates by 25 bps, taking the fed funds rate target range to 3.75%-4.00%. The size of the move was identical to the BoJ’s. The message surrounding it was not.
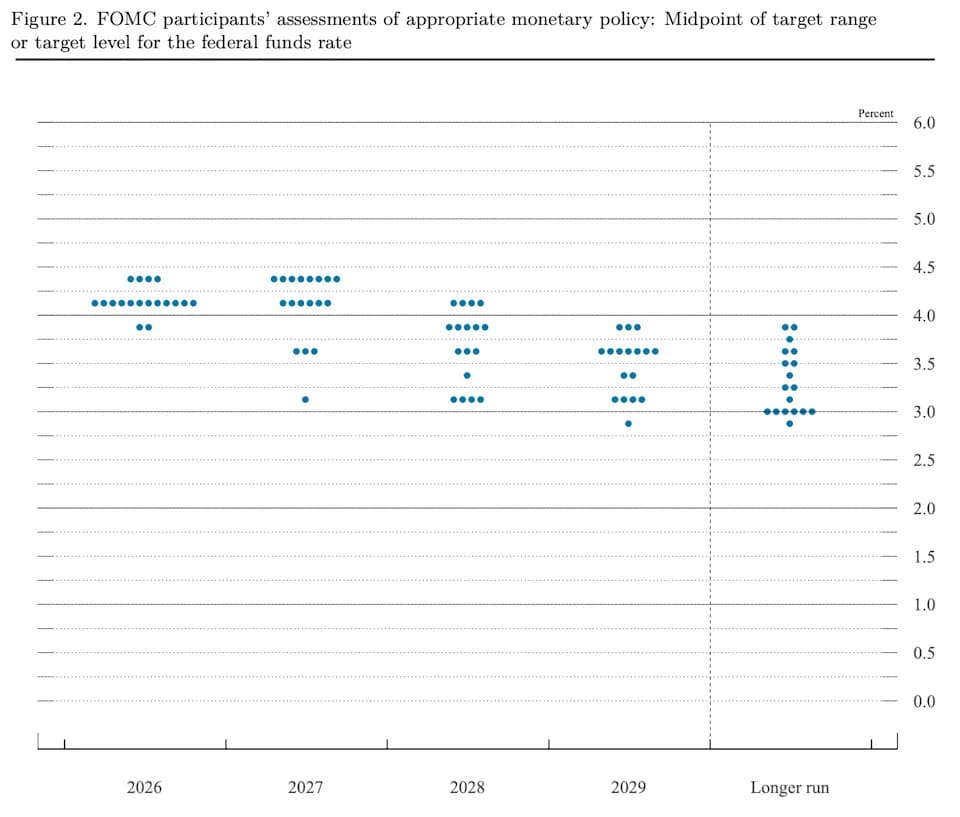
Sixteen of the Fed’s 18 policymakers expect at least one additional 25 bps increase before the end of the year. Updated projections put the policy rate at 4.10% at the end of 2026, compared with 3.80% in the previous projections. For investors, that changed the meaning of the hike.









 Chat now!