US Dollar Treads Water Post Jobs and Ahead of CPI. Where to for the DXY Index?

US Dollar Treads Water Post Jobs and Ahead of CPI. Where to for the DXY Index?

The US Dollar’s vulnerability has continued to start this week after sliding lower to close out last week. This is despite 253k non-farm US jobs being added in April, well above the 160k forecast and the revised 165k prior. The unemployment rate came in at 3.4% last month, the lowest level since 1969.

High beta risk assets such as the Aussie Dollar have seen modest gains so far today while EUR/USD and GBP/USD remain near the highs of 2023.

APAC equity indices are mostly higher after solid gains seen on Wall Street last Friday. Japan was the exception, returning after an extended holiday period and sinking into the red.

Futures markets are pointing toward a slightly soft start to the North American cash session at the time of going to print.

Treasury yields are mostly unchanged across the curve after ticking higher on Friday, mostly in the short end with the 2-year bond back above 3.92% after visiting 3.56% last month.

Crude oil and gold are both slightly higher with the WTI futures contract above US$ 71.50 bbl while the Brent contract is near US$75.50 bbl. Spot gold remains above US$ 2,020.

Looking ahead this week, the focus will be on US CPI and PPI on Wednesday and Thursday respectively after last week’s 25 basis point hike by the Fed.

The Australian government will be delivering its annual budget on Tuesday night local time when increases in the taxing of liquified natural gas (LNG) exports are expected.

After Germany’s industrial production data today, US wholesale inventory figures will be released. The full economic calendar can be viewed here.

DXY (USD) INDEX TECHNICAL ANALYSIS

The DXY index is nearing the bottom end of the range after failing to overcome a descending trend line to the topside last week.

Support may lie among the recent lows in at 100.79 -101.13 area ahead of the April 2022 low at 99.57.

On the topside, resistance might be at the prior peaks of 102.40, 102.81 and 103.06. The 55-and 100-day simple moving averages (SMA) are currently near the latter two highs and may lend resistance.

image1.png


Bitcoin & Ethereum Price Action: Is the Rally Over?

Bitcoin & Ethereum Price Action: Is the Rally Over?

Bitcoin and Ethereum’s rise may have stalled recently, but the uptrend is far from over.

BITCOIN

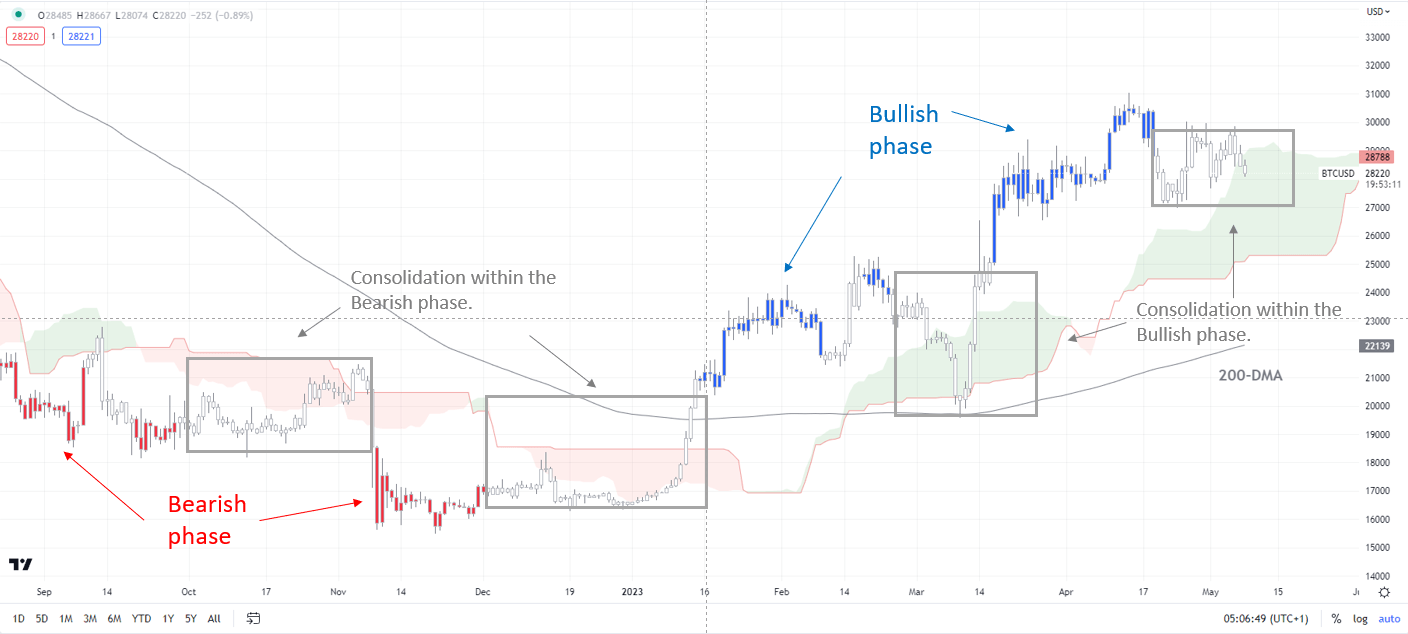
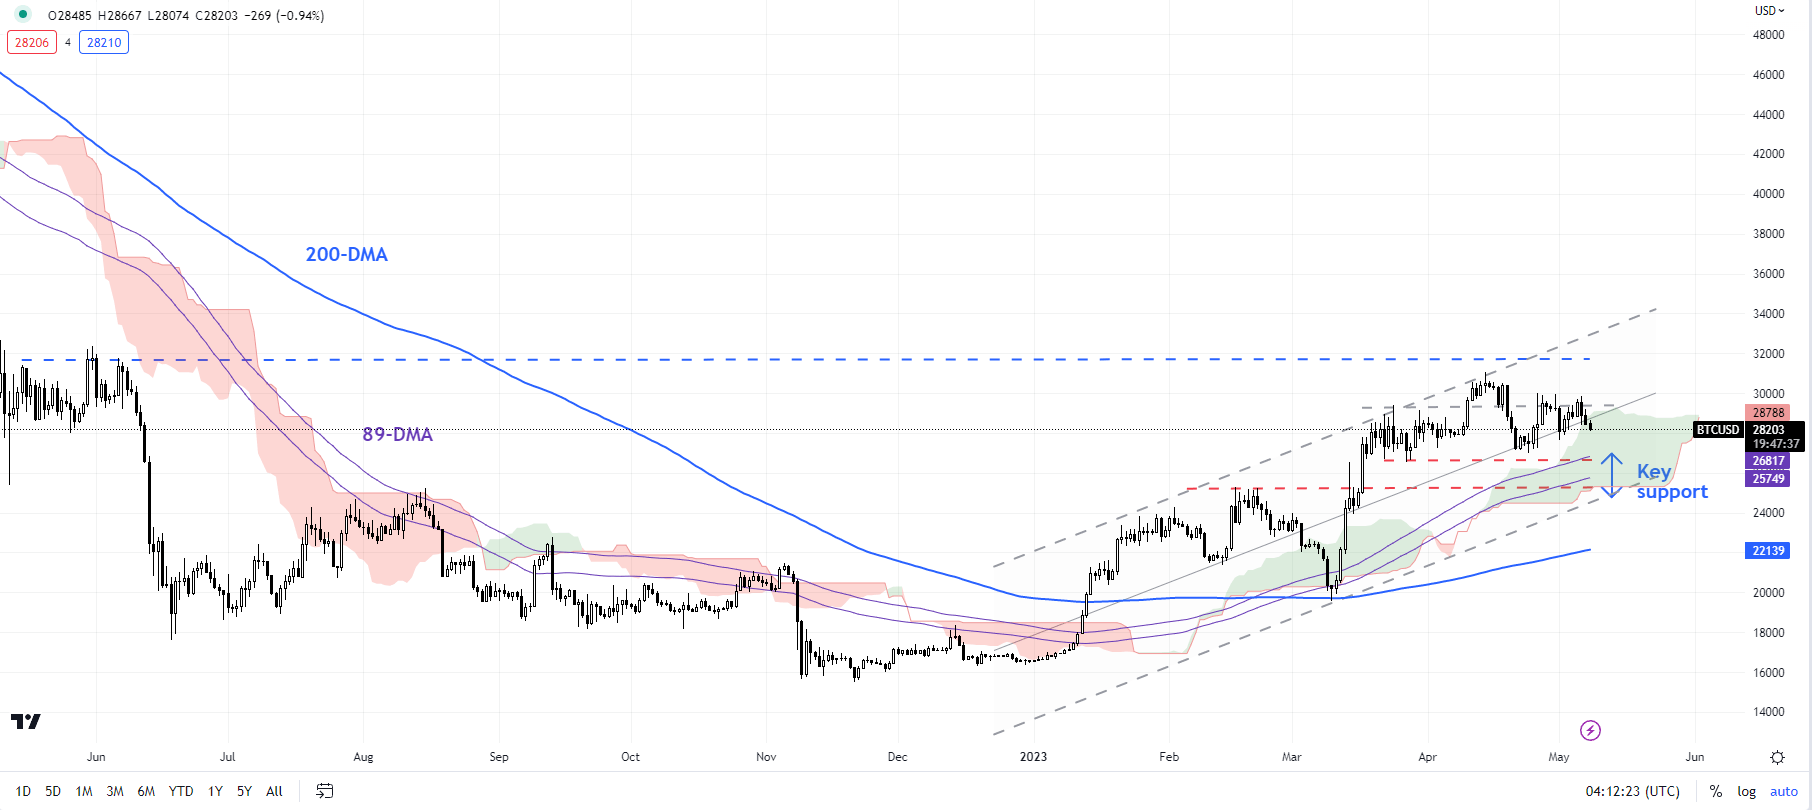
After hitting a 10-month high in April, Bitcoin’s rally has paused. Attempts to rise past the psychological 30000 mark in recent weeks have been unsuccessful, with the result that BTC/USD looks set to drift lower toward an immediate cushion at the end-March low of 26525. Any break below 26525 could open the door toward 25300-26000 (including the 89-day moving average and February 2023 high).

BTC/USD Daily Chart

image1.pngNote: In the above colour-coded chart, Blue candles represent a Bullish phase. Red candles represent a Bearish phase. Grey candles serve as Consolidation phases (within a Bullish or a Bearish phase), but sometimes they tend to form at the end of a trend. Note: Candle colors are not predictive – they merely state what the current trend is. Indeed, the candle color can change in the next bar. False patterns can occur around the 200-period moving average, or around a support/resistance and/or in sideways/choppy market. The author does not guarantee the accuracy of the information. Past performance is not indicative of future performance. Users of the information do so at their own risk.

Earlier last month, BTC/USD retreated from near key resistance area: the May 2022 high of 32375, and an uptrend line from January, coinciding with the 89-week moving average — a risk highlighted early April. See “Bitcoin Crosses the Key $30000 Mark: Will it Sustain?”, published April 11.

BTC/USD Daily Chart

image2.pngStill, the broader trend remains up on the daily charts – a trend that has been prevalent since January – see “Bitcoin Technical Outlook: BTC/USD Turns Bullish”, published January 18.Having said that, for the uptrend to resume, BTC/USD needs to clear the April high of 31065. Such a break could pave the way toward the January 2022 low of 32950.

ETHEREUM

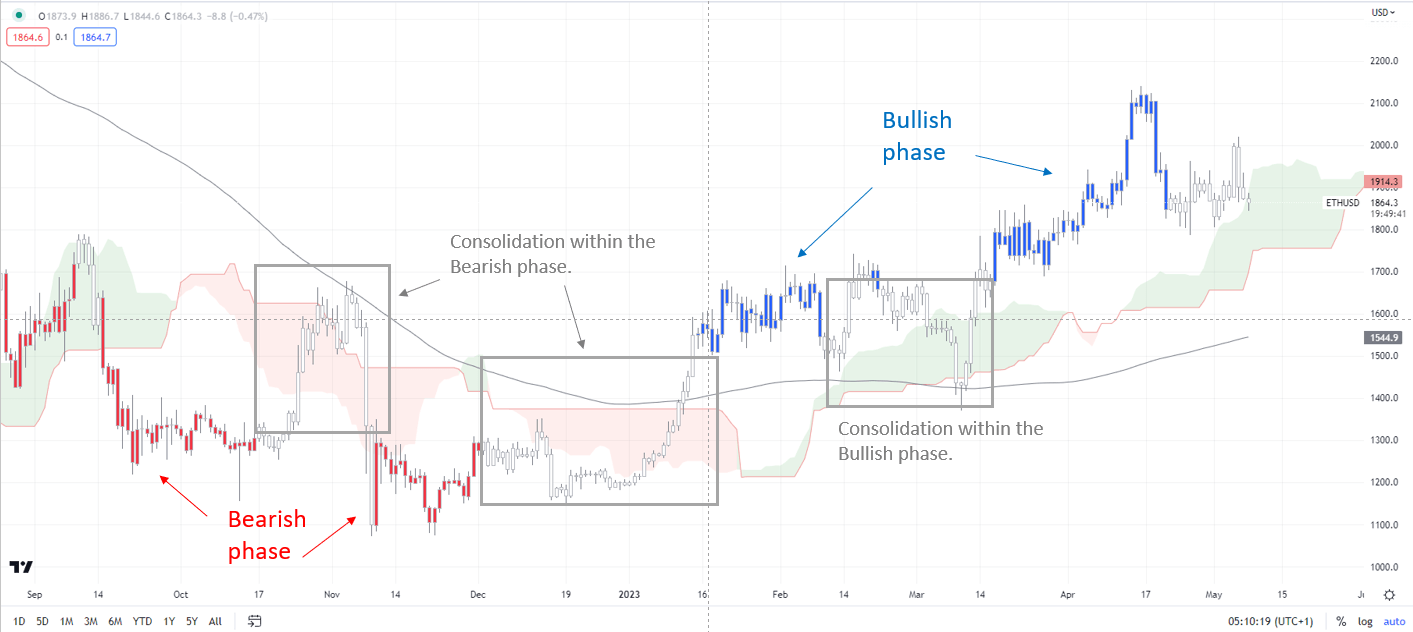
The failed attempt last week to clear an immediate hurdle at the end-April high of 1965 suggests the balance of risks remains tilted sideways to slightly down for ETH/USD.

ETH/USD Daily Chart

image3.pngNote: In the above colour-coded chart, Blue candles represent a Bullish phase. Red candles represent a Bearish phase. Grey candles serve as Consolidation phases (within a Bullish or a Bearish phase), but sometimes they tend to form at the end of a trend. Note: Candle colors are not predictive – they merely state what the current trend is. Indeed, the candle color can change in the next bar. False patterns can occur around the 200-period moving average, or around a support/resistance and/or in sideways/choppy market. The author does not guarantee the accuracy of the information. Past performance is not indicative of future performance. Users of the information do so at their own risk.

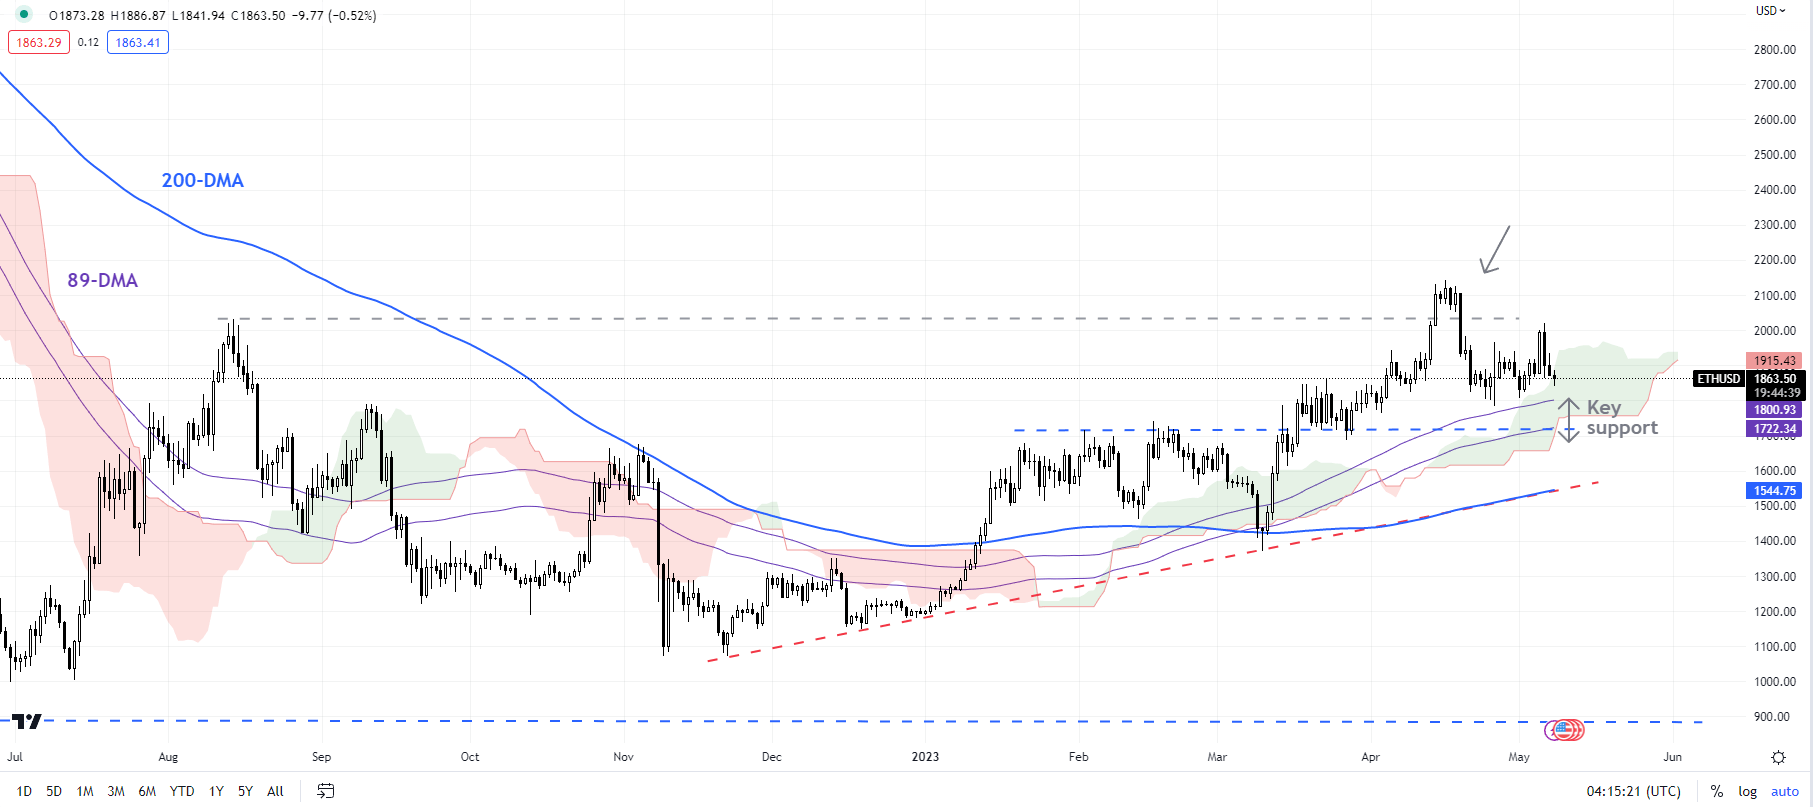
Ethereum hit a near one-year high last month but failed to clear a tough hurdle on the 89-week moving average, coinciding with the August high of 2030. Immediate support is at the end-April low of 1787. A lower break could expose the downside toward the February highs of 1710-1740.

ETH/USD Daily Chart

image4.pngBeyond the short term, the broader trend remains up for ETH/USD, as the colour-coded candlestick charts based on trending/momentum indicators show. A crack above the April high of 2142 could open the way toward 2400 (the 38.2% retracement of the 2021-2022 slide).

Swiss Franc Price Outlook: Banking Woes Support CHF Bid

Swiss Franc Price Outlook: Banking Woes Support CHF Bid

Swiss Franc’s Safe-Haven Appeal Drives Currency Appreciation

The Swiss Franc has emerged as one of the top performers against the US dollar in 2023 as declining rate expectations in the US and safe-haven appeal of the franc influence the fundamental landscape. The franc has appreciated around 4.4% against the dollar in 2023 thus far, with the trend likely to continue should the US receive softer fundamental data – possibly starting this week with the NFP print and next week with the latest CPI data.

Adding to the bullish CHF outlook is its safe-haven appeal amidst the recent flare up in the US banking sector as two more potentially troubled lenders have emerged after JP Morgan absorbed First Republic Bank. The domino effect has led to massive declines in the respective share prices of PacWest Bancorp and Western Alliance, in a week filled with volatility.

Global currencies versus the USD, performance year-to-date

image1.png

USD/CHF Technical Levels and Considerations

SNB Chairman Thomas Jordan maintained a hawkish stance towards both inflation and interest rates at a speaking engagement on monetary policy, stating that the former is too high, and the latter could still rise. Market implied rate expectations edged slightly higher in the aftermath with markets currently entertaining another 44 basis points worth of hikes – suggesting the terminal rate could emerge at 2%.

The daily USD/CHF chart reveals the overall bear trend as lower lows and lower highs remain the order of the day. Today, thus far there appears to be a temporary reprieve as the dollar recovers from prior sessions of intense selling. The pullback finds resistance at the 20 simple moving average (green line) which has acted as dynamic support throughout the rapid decline. Support comes in at the zone around 0.8850 followed by the swing low of 0.8820 and 0.8760.

USD/CHF Daily Chart

image2.png

The earlier mentioned level of support can be seen on the weekly chart, which corresponded to the area of support that appeared in late 2020 and early 2021.

USD/CHF Weekly Chart

image3.png

Source: TradingView, prepared by Richard Snow

Later this afternoon, we will have a better idea of the US labour market via the NFP print. The earlier indication of private payrolls (ADP) revealed a sizeable beat to the upside but with correlations between the two data sets we will have to wait and see how many jobs were added in the month of April.

image4.png

Volume of retail trade down by 1.2% in the euro area and by 1.1% in the EU

Volume of retail trade down by 1.2% in the euro area and by 1.1% in the EU

In March 2023, the seasonally adjusted volume of retail trade decreased by 1.2% in the euro area and by 1.1% in the EU, compared with February 2023, according to estimates from Eurostat, the statistical office of the European Union. In February 2023, the retail trade volume decreased by 0.2% in the euro area and by 0.3% in the EU. In March 2023 compared with March 2022, the calendar adjusted retail sales index decreased by 3.8% in the euro area and by 4.1% in the EU. In the euro area in March 2023, compared with February 2023, the volume of retail trade decreased by 1.4% for food, drinks and tobacco and by 1.1%

Australia-UK free trade agreement to take effect within weeks, relaxing visa rules and scrapping tariffs

Australia-UK free trade agreement to take effect within weeks, relaxing visa rules and scrapping tariffs

A historic free trade agreement between Australia and the United Kingdom is set to be in place by the end of the month following years of negotiations.

The deal, which relaxes trade and visa arrangements between the two countries, was agreed more than a year ago.

Now having worked its way through both the Australian and British parliaments, Prime Minister Anthony Albanese says it will take effect within weeks.

“It will be in place by May 31,” he told the ABC in London.

“It has completed its parliamentary processes [in Britain] and of course we completed our parliamentary process at the end of last year.

“What it will mean, put simply, is more access to the market here [in the UK] for our goods and services.

“So for beef, for our sheep products, for our seafood, for other of our products, it will mean much greater access to the British market.”

The deal with Australia was the first free trade agreement struck by the UK after its exit from the European Union.

Under the agreement, there will be no tariffs on more than 99 per cent of Australian exports to the UK, and tariff quotas will be eliminated within a decade.

The UK government initially faced some resistance to the deal from its agricultural sector, concerned about what cheaper Australian imports might mean for British farmers.

Mr Albanese said the deal would also make it easier for Australians to live and work in the United Kingdom, and for British citizens to do the same in Australia.

Rules for working holiday visas will change, with Australians able to apply for the visas up to the age of 35, instead of 30, and stay for three years instead of two.

“That will provide for better career opportunities than just casual work if you can go into a workplace for three years,” he said.

“There are obvious benefits where people can get that experience here in the British economy and then I hope go back to Australia and make a greater contribution as a result of that experience.”

Talks continue on deal with EU

Ursula von der Leyen gestures as she speaks during a news conference

Negotiations are continuing between Australia and the European Union on a separate free trade agreement.

The deal would be substantially larger than the UK deal, providing access to a market of 450 million people, and a GDP of $20 trillion.

Mr Albanese said he expected to meet with EU representatives during his current visit to London for the coronation of King Charles.

“The European agreement is a very important one, I will be having discussions while I’m here,” he said.

“Tomorrow afternoon [European Commission President] Ursula von der Leyen will be present, I’ll be having a pull-aside with her about the EU Free Trade Agreement.

“We’re continuing to work very hard because we want that to come into effect as soon as possible as well.”

He indicated the completion of the UK FTA process would allow the government to focus its attention on the EU deal, and said he spoke with German Chancellor Olaf Scholz about the deal last week.

An invitation has also been issued to EU leaders to visit Australia in coming months.

USDCAD hovers near 1.3500 after the pullback from 1.3640

USDCAD hovers near 1.3500 after the pullback from 1.3640

USDCAD is diving beneath the 1.3500 psychological mark and the 20-day simple moving average (SMA) after failing to jump above the 1.3640 resistance. The MACD is moving sideways near its trigger and zero lines, while the RSI is falling beneath the neutral threshold of 50. In the long-term view, the market has been still holding within a descending triangle since October 2022.

Any more losses could meet an immediate key level near the 200-day SMA at 1.3450, ahead of the 1.3300 pscyhological mark. Beneath this, the price may hit the lower boundary of the triangle at 1.3260 and the 1.3225 support. Steeper downside pressures may shift the outlook to bearish.

On the flip side, a successful rise above 1.3640 could surge towards the downtrend line at 1.3750 before the bulls take the pair until the 1.3800 handle and the 1.3860 barrier, changing the current bearish situation to neutral.

To sum up, USDCAD is easing in the short-term and the broader outlook remains bearish as the price is trading within the bearish pattern. 

UK construction output rises again in April, despite fastest fall in housing activity since May 2020

UK construction output rises again in April, despite fastest fall in housing activity since May 2020

UK construction companies remained in expansion mode during April, but the latest survey data indicated uneven growth across the sector. Rising volumes of commercial work and civil engineering activity helped to offset the steepest decline in residential construction output since May 2020. Meanwhile, supply conditions improved to the greatest extent since September 2009, reflecting an upturn in materials availability and fewer instances of transport delays. Input price pressures also eased in April, with the rate of cost inflation the lowest for almost two-and-a-half years. At 51.1 in April, the headline seasonally

EUR/USD: Some softer US activity or price data to unlock a break of 1.1100 – ING

EUR/USD: Some softer US activity or price data to unlock a break of 1.1100 – ING

Economists at ING see potential for a break past 1.1100 in the EUR/USD pair.

EUR/USD to find some good demand near 1.0900

“In addition to what should clearly be supportive interest rate trends for EUR/USD this year should be much lower energy prices which have delivered a vast improvement in the euro’s terms of trade. This is a complete reversal of conditions that were weighing on EUR/USD in the third quarter of last year.”

“We suspect EUR/USD finds some good demand near 1.0900 now and we are just waiting for some softer US activity or price data to unlock a break of 1.1100.”

Silver Price Analysis: XAG/USD bulls have the upper hand near $26.00, 13-month top

Silver Price Analysis: XAG/USD bulls have the upper hand near $26.00, 13-month top

Silver enters a bullish consolidation phase and oscillates in a narrow trading band around the $26.00 round-figure mark, just below its highest level since April 2022 touched earlier this Friday.

From a technical perspective, the recent repeated rebounds from the $25.50-$25.40 strong horizontal resistance breakpoint, now turned support, and the subsequent move up favours bullish traders. That said, the Relative Strength Index (RSI) on the daily chart is already flashing overbought conditions, making it prudent to wait for some near-term consolidation or a modest pullback before positioning for any further appreciating move.

Nevertheless, the XAG/USD seems poised to prolong its upward trajectory witnessed over the past three sessions and surpass an intermediate hurdle near the $26.25-$26.30 region. The momentum could eventually get extended towards testing the March 2022 swing high, just ahead of the $27.00 round-figure mark.

On the flip side, any meaningful pullback now seems to find decent support near the $25.65-$25.60 region. Any subsequent fall towards the $25.00 psychological mark could still be seen as a buying opportunity and remain limited near the $24.50-$24.40 resistance-turned-support. A convincing break below the latter will negate the positive outlook and make the XAG/USD vulnerable to weaken further below the $24.00 mark.

The next relevant support is pegged near the $23.35-$23.30 confluence, comprising the 50-day and the 100-day Simple Moving Averages (SMAs), below which the XAG/USD could slide to the $23.00 round-figure mark.

Silver daily chart

fxsoriginal

Key levels to watch

Gold Prices Rise as Markets Focus on Fed Rate Cut Bets and Regional Bank Woes

Gold Prices Rise as Markets Focus on Fed Rate Cut Bets and Regional Bank Woes

Risk Appetite Deteriorates After the Fed

Gold prices aimed cautiously higher over the past 24 hours in what was a relatively volatile intraday trading session. XAU/USD briefly touched its highest in over a year in the immediate aftermath of Wednesday’s Federal Reserve monetary policy announcement. But, since then, prices came down. Instead of capturing a gain of almost 2%, gold gained 0.35%.

After raising interest by 25 basis points, the central bank hinted at a pause in its tightening cycle. Then, Chair Jerome Powell tried to pour cold water on rate cut bets this year. But, his press conference ultimately fell on deaf ears. By the end of the day, the markets doubled down on near-term rate cut bets. As of Thursday, overnight index swaps are now pricing in about a 50% probability of a rate cut in July.

US regional bank woes remained a lingering source of financial instability. In the aftermath of First Republic being picked up by JP Morgan and the Fed monetary policy announcement, PacWest Bancorp announced that it was exploring a sale after being clobbered by shareholders. The stock is down over 93% since the most recent top in late 2021.

Meanwhile, near-term US inflation expectations continue to dwindle. In the chart below, the 2-year breakeven rate has fallen to about 2%, the lowest since January 2021. The 5-year rate is also heading in a similar direction, though not as quickly. Expectations of looser US monetary policy are thus fueling a rally in gold as the US Dollar and Treasury yields weaken.

US Inflation Expectations

US Inflation Expectations

Gold Technical Analysis

Gold has left behind a Shooting Star candlestick pattern. Meanwhile, negative RSI divergence is showing that upside momentum is fading. This is as prices were unable to pierce through 2022 highs (2050 – 2070). As such, this has reinforced the latter as key resistance. A turn lower could open the door to a near-term reversal, placing the focus on the 20-day Simple Moving Average (SMA).

XAU/USD Daily Chart

XAU/USD Daily Chart