US Dollar Crunched Post Fed Hike as Oil and Gold Rip Apart. New DXY Index Low?

US Dollar Crunched Post Fed Hike as Oil and Gold Rip Apart. New DXY Index Low?

The US Dollar remains under the pump today after sliding into the New York close after the Federal Open Market Committee (FOMC) raised its target rate by 25 basis points to 5-5.25% yesterday

The weakness appeared to evolve out of perceptions that the Fed is done hiking with the interest rate market now pricing a cut in rates for the third quarter.

This is despite reassurance from Fed Chair Jerome Powell that each meeting going forward will be data-dependent and require ongoing assessment.

The March meeting statement read, “The Committee anticipates that some additional policy firming may be appropriate,” before going on to cite factors that will be weighed in decision-making.

The May meeting statement changed this passage to, “In determining the extent to which additional policy firming may be appropriate.”

It seems that the market is anticipating a recession, hence an impending easing of monetary conditions. If the slowdown does unfold that way but inflation persists well above the Fed’s 2% target, this could lay a rocky road ahead for the US economy.

The fallout of the FOMC meeting saw Treasury yields sink, helping to undermine the US Dollar. The largest losses were seen against the perceived haven currencies of the Suisse and Yen.

USD/CHF made a 15-month low near 0.8800 while the DXY (USD) index continues to languish near 2-year lows.

The Aussie and Kiwi Dollars are firmer after both currencies saw solid economic data. NZ building permits were up 7% month-on-month in March. Australia’s burgeoning trade surplus came in at AUD 15.27 billion for the month of March, the second-highest reading on record.

Wall Street finished its cash session lower, but futures are pointing toward a steady start today. APAC equity indices are mixed with Chinese markets open for the first time this week, but Japan remains closed.

On the opening to the Asian session, crude oil was smashed lower while gold roared higher at the same time. Both markets have since back to levels near where they were at the open.

WTI crude made a 17-month low at US$ 63.34 bbl which was more than 7% lower from the New York close just moments prior. The high in the front month COMEX gold futures contract fell just short of an all-time high, trading at 2,085.4 an ounce.

The full economic calendar can be viewed here.

DXY(USD) INDEX TECHNICAL ANALYSIS

The DXY index remains within a descending trend channel and below all period daily simple moving averages (SMA) which may suggest that bearish momentum might be unfolding.

Support could be at previous lows of 100.82, 100.79, 99.57 and 99.42. On the topside, resistance might be at the prior peaks of 102.40, 102.81 and 103.06. The latter is also near the 55- and 100-day SMAs, which may lend resistance.

image1.png


EUR/USD clings to gains above 1.1000, eyes on US data and Fed

EUR/USD clings to gains above 1.1000, eyes on US data and Fed

EUR/USD has gathered recovery momentum and climbed above 1.1000 early Wednesday following Tuesday’s volatile action. Investors await ADP private sector employment and ISM Services PMI data from the US ahead of the Federal Reserve’s policy announcements.

EUR/USD has gathered bullish momentum and advanced beyond 1.1000 after having declined to the 1.0950 area on Tuesday. As investors wait for the US Federal Reserve (Fed) to announce its policy decisions later in the day, the pair’s near-term technical outlook points to a bullish tilt.

EUR/USD stayed under bearish pressure and extended its slide after breaking below 1.0000 on Tuesday. Following Wall Street’s opening bell, however, investors started to seek refuge amid resurfacing fears over bank contagion in the wake of First Republic Bank’s collapse. In turn, US Treasury bond yields fell sharply and the US Dollar (USD) lost footing, allowing the pair to stage a late rebound.

The Fed is forecast to raise its policy rate by 25 basis points (bps) to the range of 5-5.25% but markets are increasingly convinced that the US central bank could pause its tightening cycle.

According to the CME Group FedWatch Tool, there is virtually no chance that the Fed will raise its policy rate again in June. Furthermore, the probability of the Fed cutting its policy rate by 25 bps at least once by September is now nearly 80%.

In case the Fed outright says that they will pause rate hikes to assess the situation, this would suggest that they are very concerned about the banking situation. Although the latest data unveiled that inflation in the US remains sticky, the Fed is under a lot of pressure to address the tightening in financing conditions. In that scenario, the USD is likely to stay under pressure.

On the other hand, the Fed could leave the door open for additional rate hikes and downplay the banking woes. Although such an approach could help the USD gather strength with the initial reaction, investors could see that as potentially deepening the financial crisis. In turn, another leg lower in the US T-bond yields could limit the USD’s potential gains.

At this point, it’s difficult to spot a scenario that could trigger a rally in the USD. Even if the Fed were to sound hawkish, investors are unlikely to be convinced that the banking situation will just get better by itself. Nevertheless, FOMC Chairman Jerome Powell’s comments could ramp up volatility in the late American session and it might be risky to stick to a position before the dust settles.

EUR/USD returned within the long-term ascending regression channel and closed the last four-hour candles above the 20-period and the 50-period Simple Moving Averages (SMA) on the four-hour chart, reflecting a buildup of bullish momentum. Additionally, the Relative Strength Index (RSI) indicator on the same chart is back above 50 after having spent the last couple of trading days below that level.

On the upside, 1.1050 (static level) aligns as interim resistance ahead of 1.1070 (end-point of the uptrend, mid-point of the ascending channel) and 1.1100 (psychological level, static level).

1.1000/1.0990 (psychological level, 100-period SMA) could be seen as the first support. A four-hour close below that area could discourage buyers and open the door for additional losses toward 1.0950 (Fibonacci 23.6% retracement) and 1.0920 (200-period SMA).

Canadian Dollar Weakens with Crude Oil Prices as Traders Turn Sour Before the Fed

Canadian Dollar Weakens with Crude Oil Prices as Traders Turn Sour Before the Fed

Canadian Dollar Sinks Alongside Crude Oil Prices as Sentiment Sours

The Canadian Dollar was one of the worst-performing major currencies over the past 24 hours. Weakness in the Loonie followed a similarly dismal day for crude oil prices, with WTI sinking about 5.6% on Tuesday. That was the worst performance for the commodity over 24 hours since July 12th. Oil has fully reversed gains on surprise cuts from OPEC+ from weeks ago and then some.

Generally speaking, it was a risk-averse 24 hours across global financial markets. Pessimism picked up pace during the Wall Street trading session. By the end of the day, the Nasdaq 100, S&P 500 and Dow Jones fell -0.92%, -1.17% and -1.11%, respectively. Meanwhile, the VIX market ‘fear gauge’ soared over 10 percent (although most gains were reversed before the end of Wall Street trade).

Fears of slowing global growth likely drove market price action. For one thing, a couple of regional bank stocks plunged in the aftermath of First Republic Bank being rescued by JPMorgan. Meanwhile, a key labor market gauge continued heading in the wrong direction. There are now about 1.64 jobs in the US per unemployed person, the lowest since the end of 2021. Still, it remains historically elevated.

Oil is a key Canadian export. As such, the direction of the commodity often plays a key role in local monetary policy. As such, the Canadian Dollar was pressured lower by multiple fundamental forces: slowing growth prospects (especially potential trading demand with the US) and prospects of future revenue from crude oil.

Looking ahead, Wednesday’s Asia-Pacific trading session could continue in the footsteps of Wall Street. A further deterioration in market sentiment may continue pressuring crude oil, and potentially the Loonie, sending USD/CAD higher. Markets are also nervously awaiting the Federal Reserve interest rate decision, due in less than 24 hours.

Canadian Dollar Technical Analysis

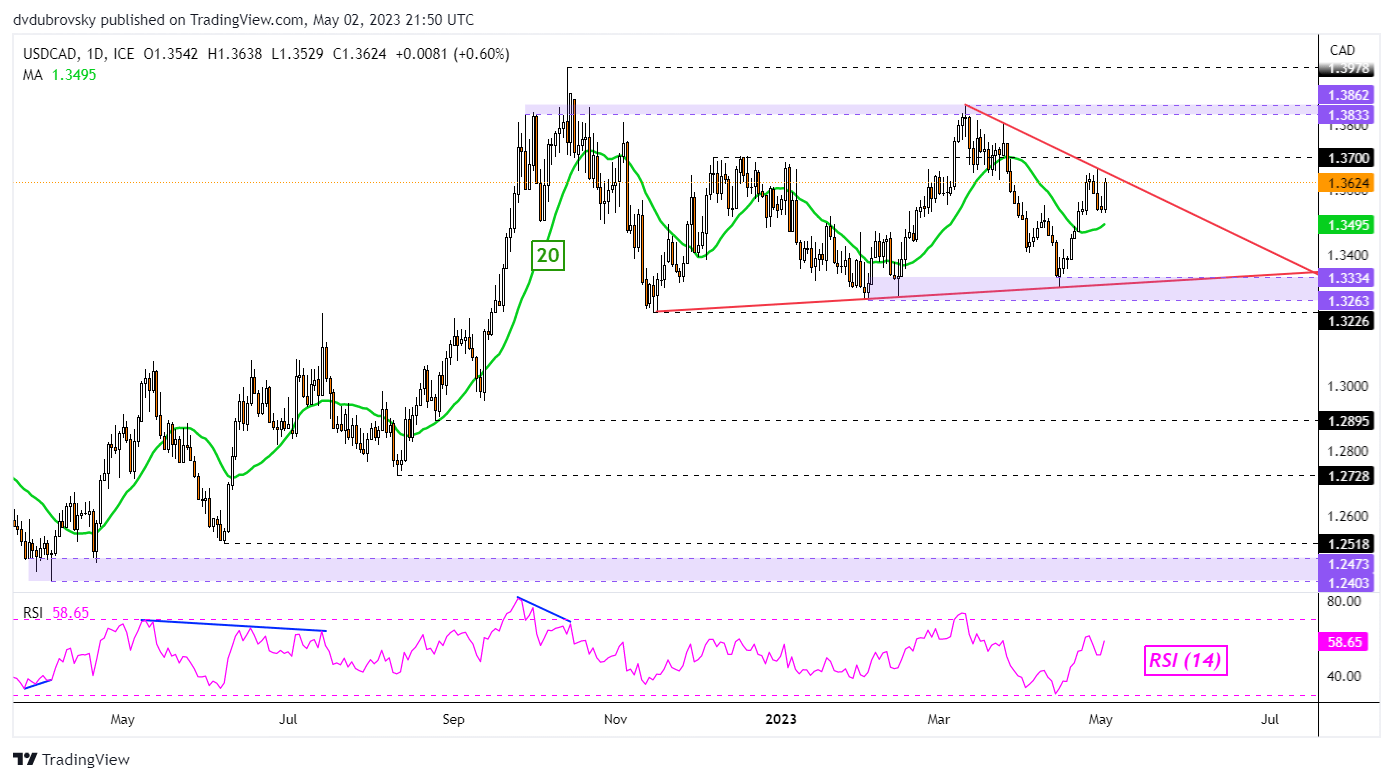
On the daily chart, USD/CAD turned back higher towards the near-term falling trendline from March. This could maintain the downward focus. But prices also remain above the 20-day Simple Moving Average (SMA). The latter is starting to slope upward, meaning that a key breakout could be seen in this pair relatively soon. Extending higher exposes the 1.3833 – 1.3862 resistance zone. If not, turning lower places the focus on the 1.3263 – 1.3334 range.

USD/CAD Daily Chart

USD/CAD Daily Chart


Gold Price Holds the High Ground as Treasury Yields Retreat. Where to for XAU/USD?

Gold Price Holds the High Ground as Treasury Yields Retreat. Where to for XAU/USD?

Gold broke higher in the overnight session, racing above US$ 2,000 an ounce with risk sentiment sinking which saw Treasuries go higher on lower yields.

Wall Street finished down after regional banks faced scrutiny by the market despite the embattled First Republic Bank finding a home with JP Morgan at the start of the week. The KBW bank index which includes several leading regional banks, went 4.47% lower on Tuesday.

All the while the unresolved US debt ceiling issue continues to swirl and with these growing concerns for the macroeconomic environment, gold and Treasuries caught a bid.

Treasury yields were lower across the curve with the 2-year note slipping 18 basis points, trading back below 4%. At the New York close nominal 10-year Treasury yields were down 14 basis points, while real yields for the same tenor were down 11 bp.

The real yield is the nominal yield less the market-priced inflation rate derived from Treasury inflation- protected securities (TIPS).

The implication is that inflation expectations were little changed but the returns for supposed risk-free assets like US government debt were sort after. The perceived haven status of the yellow metal also appeared to benefit from the market’s mood.

The US Dollar has had a choppy week so far as traders weigh the potential impact of today’s Federal Open Market Committee (FOMC) meeting.

While the market is anticipating a 25 bp hike, the focus will be on the post-meeting presser for guidance on the Fed’s stance going forward.

GOLD TECHNICAL ANALYSIS

Gold remains within an ascending trend channel and has been caught in a relatively narrow range of 1969 – 2049 for five weeks.

A bullish Triple Moving Average (TMA) formation requires the price to be above the short-term Simple Moving Average (SMA), the latter to be above the medium-term SMA and the medium-term SMA to be above the long-term SMA. All SMAs also need to have a positive gradient.

Looking at any combination of 10-, 34-, 55-, 100- and 200-day SMAs, the criteria for a TMA have been met.

To the topside, there is a Double Top created by the all-time high of 2075 in April 2020 and the failed attempt to break above it in March 2022 when a peak of 2070 was made.

On the downside, the 1885 – 1895 area appears to be a key support zone. Within it lies the 100-day SMA, a previous low, a breakpoint and an ascending trend line.

image1.png


US Dollar Action Ahead of Fed Rate Decision: EUR/USD, GBP/USD, AUD/USD

US Dollar Action Ahead of Fed Rate Decision: EUR/USD, GBP/USD, AUD/USD

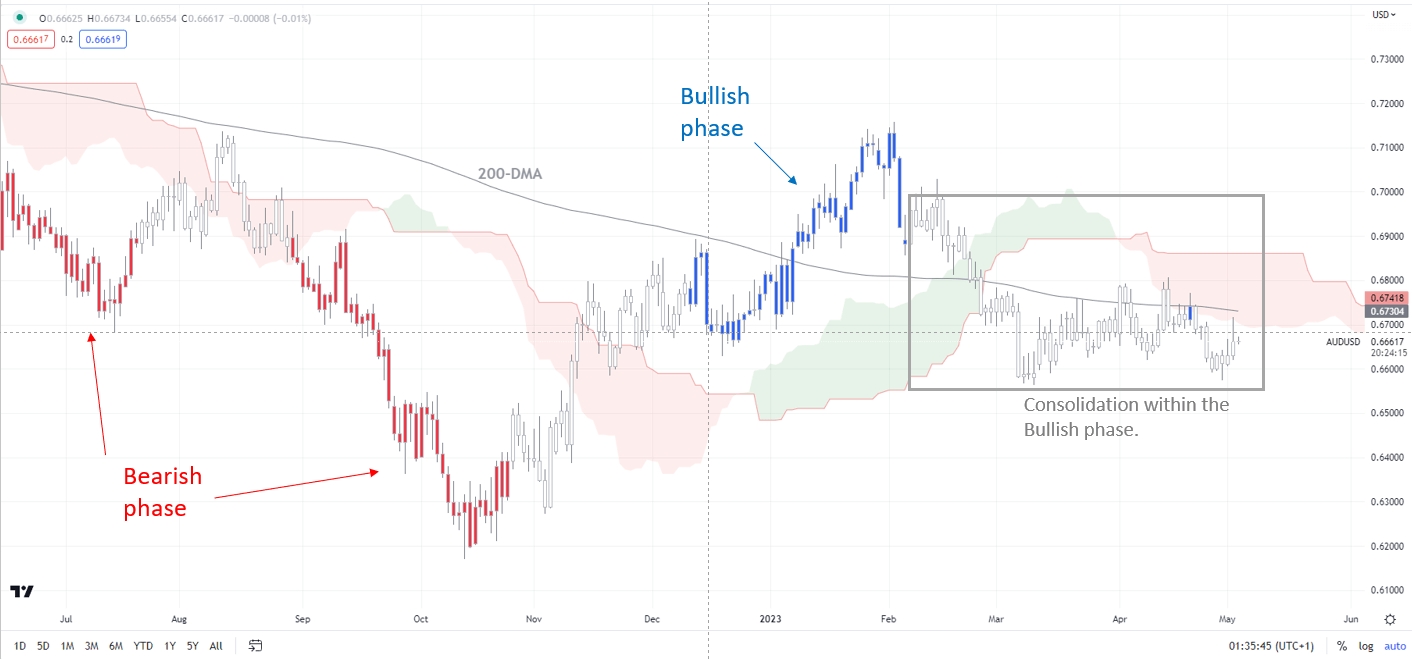
The US dollar’s trend broadly remains down ahead of the US Federal Reserve’s interest rate decision However, the slide appears to be losing some steam, leaving open the possibility of a minor rebound in the short term.

The Fed is widely expected to raise interest rates by 25 basis points today (rate decision due 1800 GMT). The key focus will be on its guidance on the path of monetary policy – particularly, whether it plans to pause or raise rates further in June. Core measures of inflation appear to be in a cooling phase, but still way above the Fed’s 2% target.

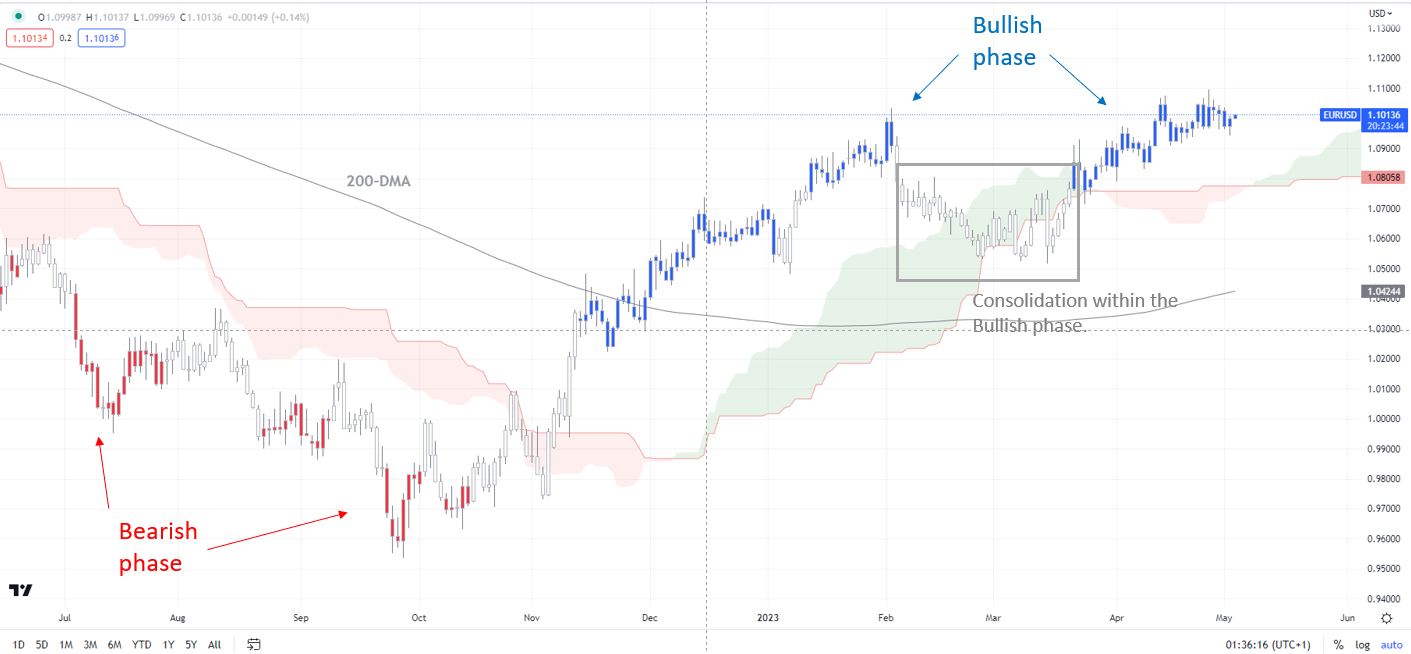
EUR/USD Daily Chart

image1.png

Note: In the above colour-coded chart, Blue candles represent a Bullish phase. Red candles represent a Bearish phase. Grey candles serve as Consolidation phases (within a Bullish or a Bearish phase), but sometimes they tend to form at the end of a trend. Note: Candle colors are not predictive – they merely state what the current trend is. Indeed, the candle color can change in the next bar. False patterns can occur around the 200-period moving average, or around a support/resistance and/or in sideways/choppy market. The author does not guarantee the accuracy of the information. Past performance is not indicative of future performance. Users of the information do so at their own risk.

With the market pricing in roughly 50 basis points of rate cuts by the end of the year, any signal from the Fed contrary to the market’s expectations could lead to a rebound in the USD. Meanwhile, US macro data have been underwhelming since late March – the US Economic Surprise Index is at its lowest level since early February.

EUR: Minor signs of fatigue

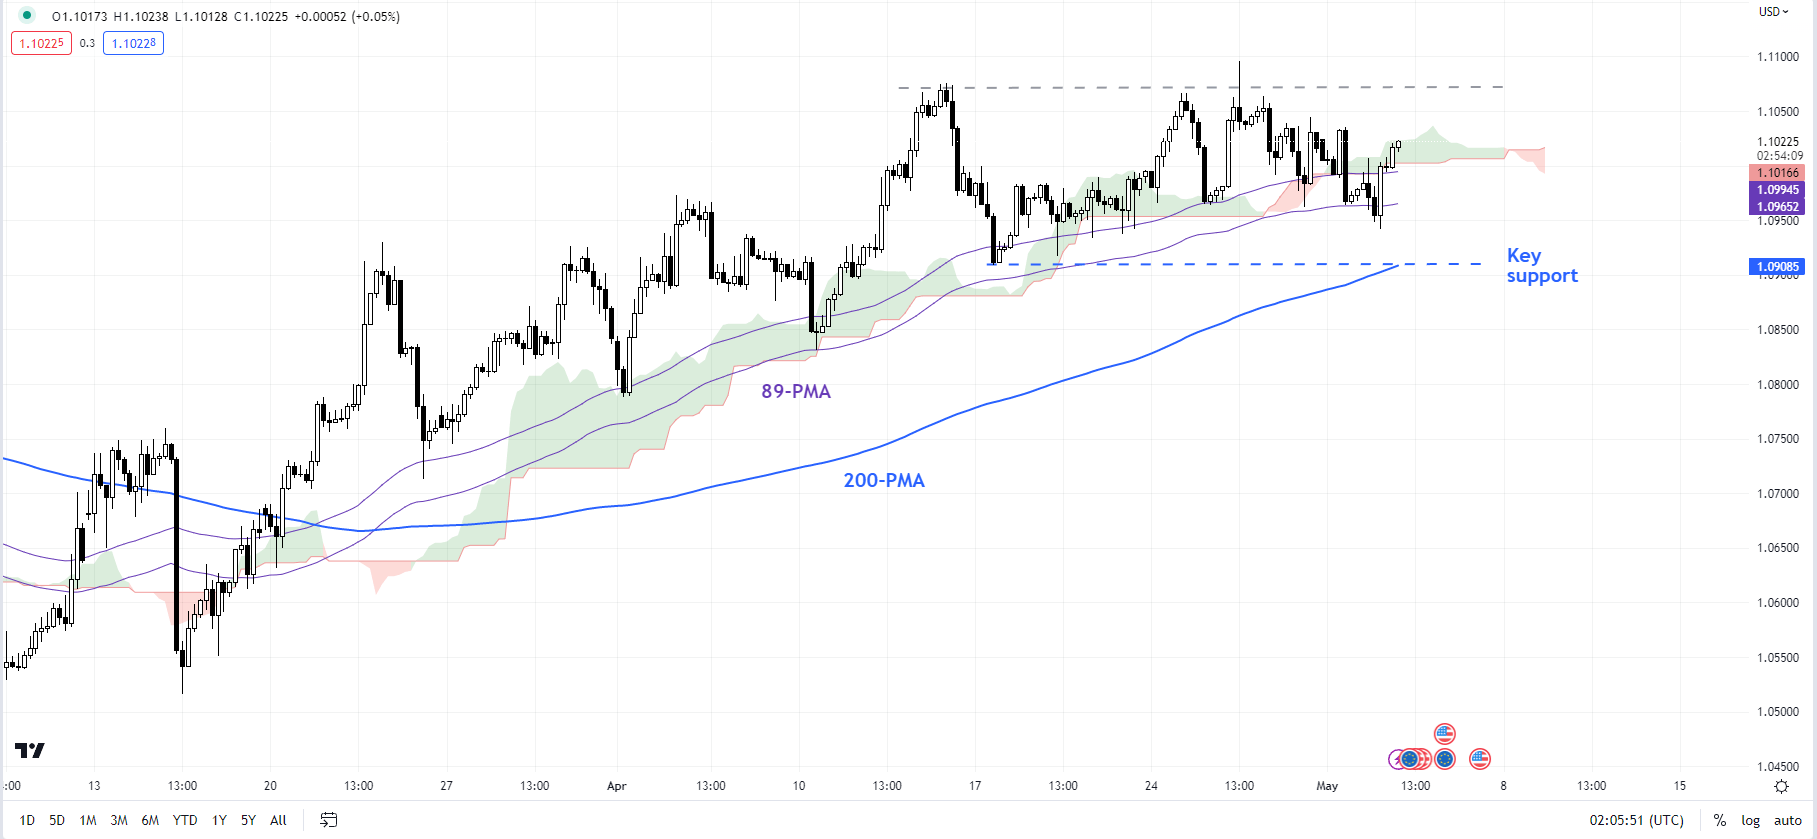
On technical charts, the upward momentum in EUR/USD has slowed somewhat giving an impression of fatigue in the rally. Any break below immediate support at the mid-April low of 1.0900 would indicate that the upward pressure had faded a bit in the short term. Stronger support is around 1.0700-1.0725, including the 89-day moving average, and the lower edge of the Ichimoku channel on the daily charts.

EUR/USD 240-minute Chart

image2.png

EUR/USD’s broader trend remains up on the daily charts as colour-coded candlestick charts based on trending/momentum indicators show. For more discussion, see previous updateson April 10,April 13, and April 25. On the upside, a decisive break above the February high of 1.1035 could pave the way toward 1.1700 — the price objective of the double bottom pattern (the January and March lows).

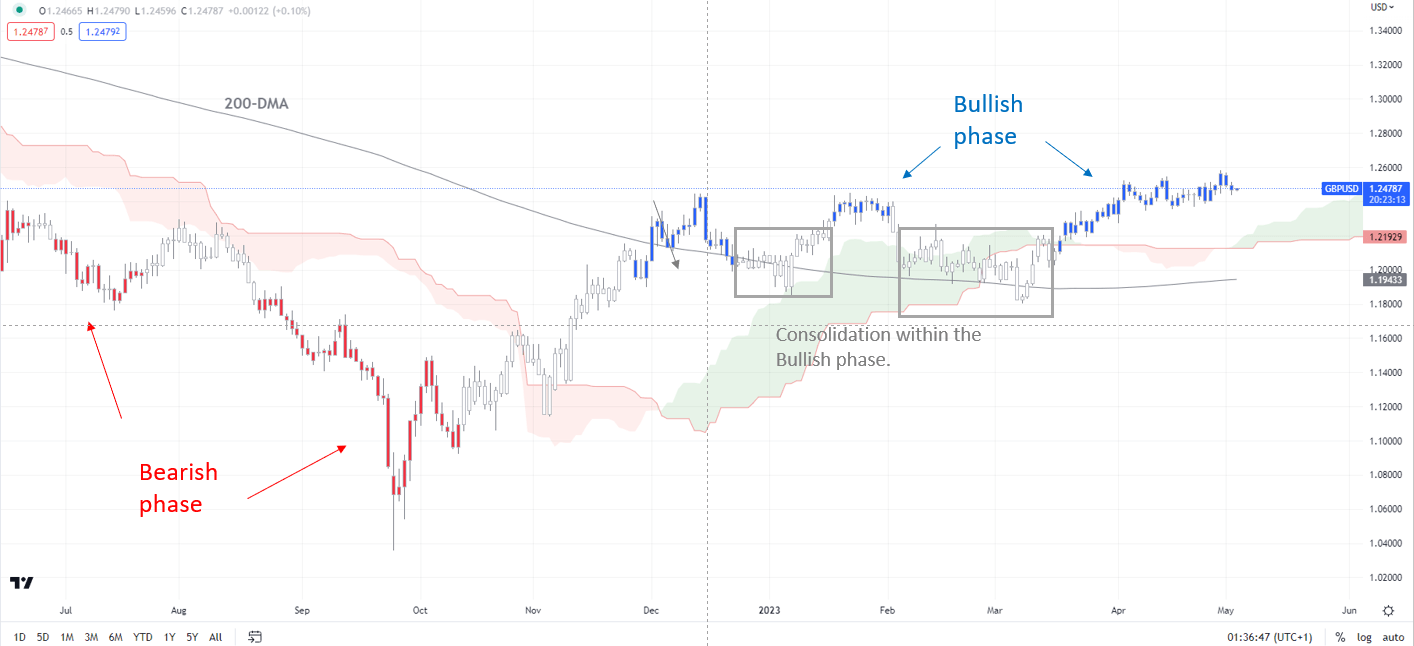
GBP/USD Daily Chart

image3.png

GBP/USD: Consolidation could continue a bit further

As highlighted in the previous update, GBP/USD’s broader trend is up on the daily charts, as shown by the colour-coded candlestick charts based on trend/momentum indicators. However, despite repeated attempts in recent weeks, GBP/USD hasn’t been able to decisively clear above the top end of a sideways channel since the end of 2022 at about 1.2450. Any break below immediate support at the April 17 low of 1.2350. Any break below could pave the way toward 1.2150-1.2200.

AUD/USD Daily Chart

image4.png

AUD/USD: Lacking meaningful upward momentum

AUD/USD’s rebound in recent weeks has been capped around the 200-day moving average, roughly coinciding with the early-April high of 0.6795. Moreover, the two attempts to rebound in April ran out of steam around 38.2% retracement of the February-March decline – for a reversal of the weakness since January, AUD/USD would need to retrace at least more than 50%. Until then, the path of least resistance remains sideways to down. SeeApril 25andApril 27updates. On the downside, below the March low of 0.6550, the next support is 0.6385.

USD/JPY Price Forecast: Japanese Yen Set for Safe Haven vs FOMC Battle

USD/JPY Price Forecast: Japanese Yen Set for Safe Haven vs FOMC Battle

JAPANESE YEN FUNDAMENTAL BACKDROP

The Japanese Yen received some much needed support both yesterday and today from risk aversion in financial markets as recessionary fears grow. Although important market influencers like the JP Morgan CEO Jamie Dimon stated that he believes the crisis is nearing its end, market participants shrugged off this sentiment in favor of a more cautious approach and preference for safe-haven assets including the Yen.

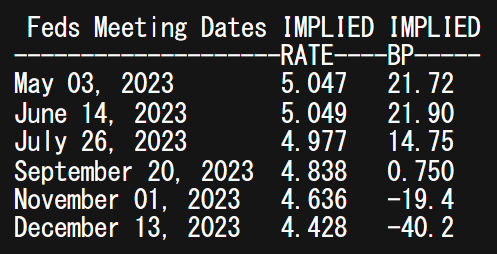
US regional banking shares plummeted yesterday allowing for possible confusion for the FOMC in their decision making later this evening; however, I do not believe this will trump money market pricing. Currently, the implied Fed funds futures (see table below) remains firmly skewed towards a 25bps interest rate hike, sending the lending rate to its highest level since 2007.

FEDERAL RESERVE INTEREST RATE PROBABILITIES

image1.png

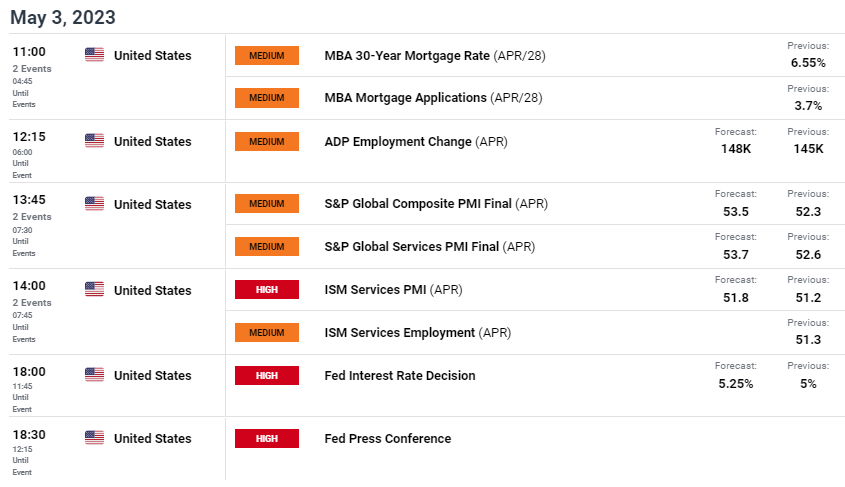
The rest of the day is littered with US economic data that’s expected to provide short-term volatility throughout, with no Japanese specific data to speak of. Some valuable data inputs include the ADP employment change figure as well as the ISM services PMI print (always a high impact event considering the US is primarily a services driven economy). Overall, it is unlikely these singular releases will not change the Fed’s decision but will give markets an indication as to the state of the US economy going forward.

ECONOMIC CALENDAR

image2.png

TECHNICAL ANALYSIS

USD/JPY DAILY CHART

image3.png

Chart prepared by Warren Venketas, IG

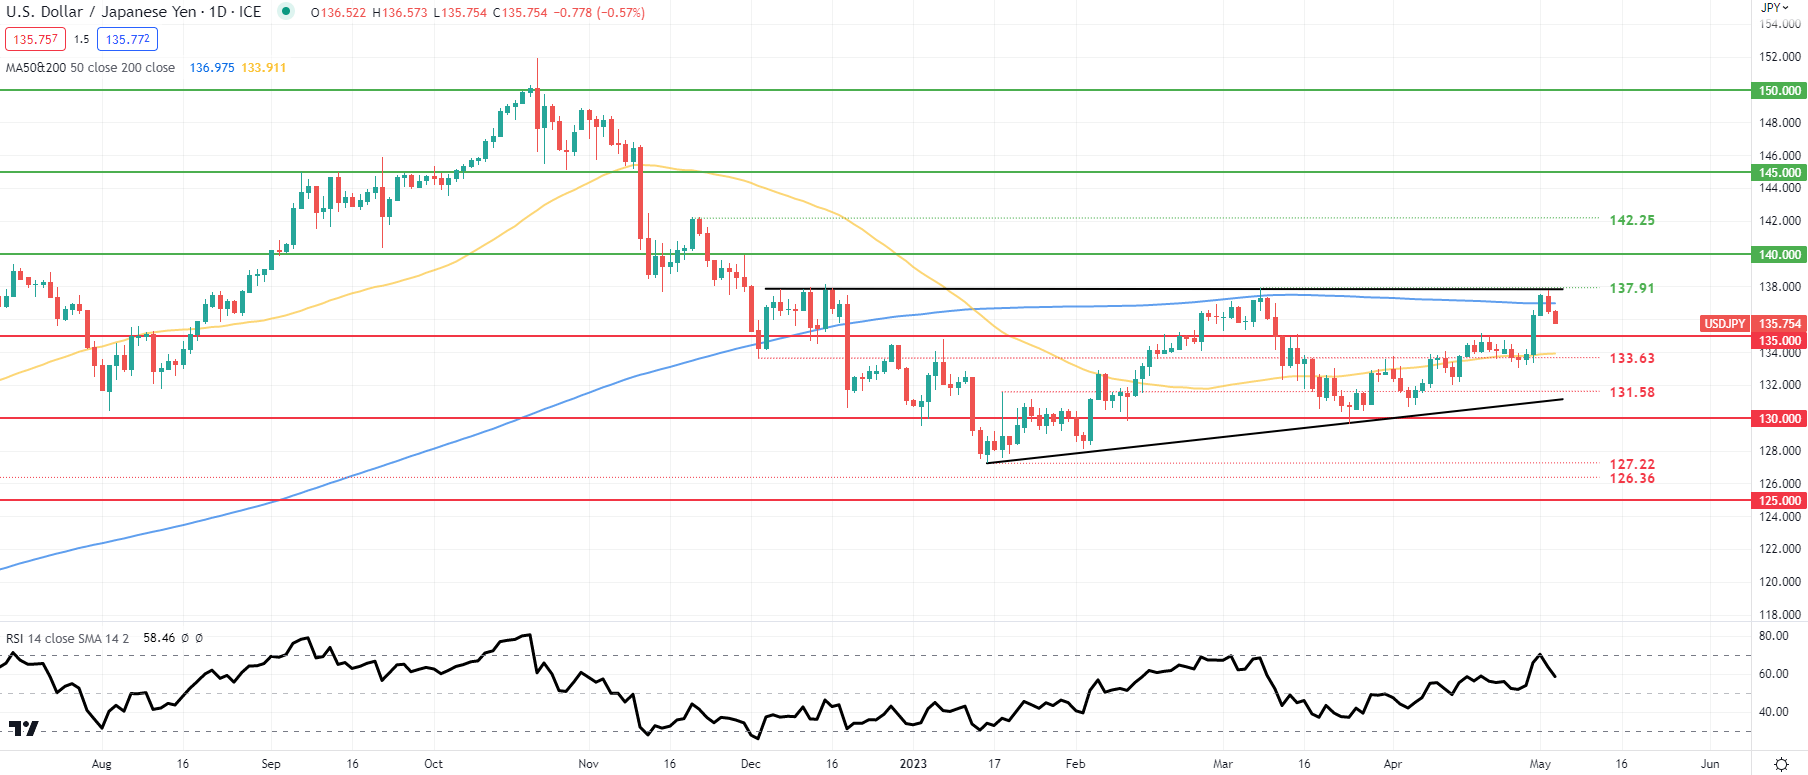
The daily USD/JPY chart shows price action respective of the medium-term ascending triangle pattern (black). Bears have defended triangle support which coincides with the 200-day moving average (blue) and the 137.91 March swing high. The Relative Strength Index (RSI) has also come off overbought levels and may suggest a dovish slant to today’s data from a technical standpoint, possibly exposing the 135.00 psychological support handle once more. Any downside move could be invalidated by a triangle resistance breakout and confirmation candle close thereby leaving the door open for another run up to 140.00 and beyond, last seen at the backend of 2022.

Crude Oil Price Punished Ahead of Fed on Recession Fears. Will WTI Push Lower?

Crude Oil Price Punished Ahead of Fed on Recession Fears. Will WTI Push Lower?

Crude oil tanked in the North American session yesterday but has steadied so far through Asian trade with the US Dollar broadly weakening going into Wednesday.

The WTI futures contract remains under US$ 72 bbl while the Brent contract has a handle of US$ 75 bbl.

Risk assets went out of favour while gold and Treasuries went higher as the mood darkened on fears that there might be more US banks with weak balance sheets.

Recession fears appear to be swirling after weak US jobs and factory orders data ahead of the Fed’s rate decision later today.

Gold is eyeing off US% 2,020 an ounce while the yield on the benchmark 2-year Treasury note is back under 4%.

Regional banks bore the brunt of the woes with PacWest Bancorp and Western Alliance Bancorp finishing down -27.8% and 15.1 % respectively.

The Dow Jones, S&P 500 and Nasdaq saw losses of more the 1% in the cash session, but they have steadied so far today.

Following on from the Wall Street lead, APAC equity markets that were open today are all lower. Mainland China and Japan are on holiday among others.

Sentiment was further undermined by an activist investor, Hindenburg, releasing a report questioning the financial integrity of Icahn Enterprises that knocked its share price 20% lower.

After notable declines in the oil-linked Canadian Dollar and Norwegian Krone yesterday, all G-10 currencies are slightly firmer to varying degrees against the US Dollar today.

The Federal Reserve will be centre stage today, but the full economic calendar can be viewed here.

WTI CRUDE OIL TECHNICAL ANALYSIS

After filling in the gap created by the OPEC+ output cut announcement, WTI has continued lower. The price is below all period daily Simple Moving Averages (SMA) which may suggest that bearish momentum is evolving.

Support could be at the 78.6% Fibonacci Retracement level of the move from 64.36 to 83.53 at 68.46. Further down, support may lie at the previous lows of

On the topside, resistance could be at the nearby breakpoints in the 72.25 – 72.46 area, ahead of 73.93.

image1.png


Australian Dollar Price Setup: EUR/AUD, GBP/AUD, AUD/JPY

Australian Dollar Price Setup: EUR/AUD, GBP/AUD, AUD/JPY

The Australian dollar has rebounded against some of its peers as the Reserve Bank of Australia unexpectedly raised interest the cash rate by 25 basis points at its meeting on Tuesday. Is this a sign that AUD is gearing up for a larger retracement? Probably not yet.

AUD has risen across the board against its G10 peers since Friday ahead of the RBA’s interest rate decision – a possibility highlighted in the previous update. See “Australian Dollar Price Action: AUD/USD, EUR/AUD, AUD/JPY, GBP/AUD”, published April 27.

RBA raised the benchmark rate to 3.85% on Tuesday from 3.6% and kept the door open for more rate hikes to tame price pressures. “Looking forward, some further tightening of monetary policy may be required to ensure that inflation returns to target in a reasonable timeframe,” RBA Governor Philip Lowe said.

Data released last month showed Australia’s CPI rose to 7% on-year in the January-March quarter, Vs 6.9% expected, from 7.8% in the previous quarter. Price pressures eased in March to 6.3% on-year Vs 6.5% expected, down from 6.8% in February, but well above the central bank’s target band of 2%-3%. Markets are now pricing in around roughly an equal chance of another 25-basis points hike by August.

On technical charts, while conditions for a relief in AUD’s slide against it peers are getting in place, on its own, the recent price action isn’t enough to suggest that the worst for AUD is over, especially against EUR and GBP.

EUR/AUD Daily Chart

image1.png

EUR/AUD – Retreats from a key barrier

EUR/AUD has pulled back from a tough hurdle at the October 2020 high of 1.6825, roughly coinciding with the upper edge of a rising channel from mid-2022. Interestingly, market diversity, as measured by fractal dimensions, appears to be low as EUR/AUD hit a multi-month high last month. Fractal dimensions measure the distribution of diversity. When the measure hits the lower bound, typically 1.25-1.30 depending on the market, it indicates extremely low diversity as market participants bet in the same direction, raising the odds of a price reversal. For EUR/AUD, the 65-day fractal dimension fell below the threshold of 1.27, very close to the red flag lower threshold of 1.25. (See chart.)

EUR/AUD Daily Chart

image2.png

To be sure, the retreat in recent days isn’t enough to conclude that the uptrend is over. Indeed, the cross continues to be guided by a rising channel from early 2023. Only a break below converged support at 1.58-1.61, including the 89-day moving average and the lower edge of the Ichimoku cloud on the daily charts, would raise the odds of a larger (downward) correction.

GBP/AUD Daily Chart

image3.png

GBP/AUD: Overbought conditions as the cross nears a cap

GBP/AUD is showing some signs of exhaustion as it nears a stiff barrier on a horizontal trendline from 2021, at about 1.9150. Market diversity in GBP/AUD appears to be low – hit the lower threshold of 1.25 last week, flashing a red flag. Having said that, the trend remains bullish despite the brief retreat in recent days. Only a break below 1.8100-1.8250 area would raise the risk of a deeper retreat.

GBP/AUD Daily Chart

image4.png

AUD/JPY: Well within the range

A shooting star candlestick pattern on the daily candlestick charts at solid resistance on the 200-day moving average isn’t an encouraging sign for bulls. Still, AUD/JPY remains well within the well-established range of 86.00-93.00. For the upward momentum to sustain, the cross would need to crack the February high of 93.00.

AUD/USD Daily Chart

image5.png


Japanese Yen Price Action Update: EUR/JPY, USD/JPY. AUD/JPY

Japanese Yen Price Action Update: EUR/JPY, USD/JPY. AUD/JPY

JAPANESE YEN BACKDROP

The Japanese Yen has struggled since last week’s Bank of Japan (BoJ) meeting which struck a dovish tone with the promise of conducting a review of its monetary policy. Improving sentiment following positive US earnings and rising rate hike expectations has seen the Yens safe haven appeal take a knock.

There has been an increase in expectations around rate hikes and global central banks maintaining a higher rate for longer is in complete contrast to the current BoJ policy. This has partly contributed the Yens struggles over the past week with this morning’s pivot by the Reserve Bank of Australia (RBA) which surprised markets by resuming its hiking cycle with Governor Lowe stating that the Board has a strong consensus to hike rates. The ECB and Fed meetings are due this week with inflation remaining a particular issue in many developed nations.

Given the inflation conundrum further hikes are expected particularly by the ECB and BoE in 2023 with Australia now seen reaching a peak rate of around 4%. Should we see this divergence continue for the rest of Q2 without any change by the BoJ the Yen could be in for a bumpy ride. A recent poll by economists, however, sees the Yield Cuve Control policy being changed as early as June which in my humble opinion may be a bit too optimistic. Inflation data out of Japan will be key as well for the BoJ decisions moving forward as intimated already by the new Governor Kazuo Ueda.

RISK EVENTS IN THE WEEK AHEAD

There is a host of risk events for the week ahead particularly out of Europe and US which could further impact overall sentiment as well as Yen pairs. EURJPY, USDJPY and AUDJPY face their biggest tests as data continues to filter through.

They Key Risk Events to Keep an Eye on:

image1.pngGraphical user interface, text, application  Description automatically generated

PRICE ACTION AND POTENTIAL SETUPS

EURJPY

EUR/JPY Daily Chart

image3.png

Source: TradingView, prepared by Zain Vawda

EURJPY has continued its rally of late since bouncing off the ascending trendline from the March 24 lows. The trendline provided since significant support which propelled the Euro to a 15 year high against the to trade above the 150.00 psychological level.

EURJPY does appear slightly overextended following the recent rally with the RSI now in overbought conditions as well. Price action has also printed a fresh high which could hint at some form of reversal or retracement is the short-term. A break below the 150.00 psychological level could see the previous swing high serves as support around the 148.60 handle. A break below the 148.60 support area the trendline comes into a play.

As the battle of the Central Banks rage on a key driver for EURJPY this week will be the ECB meeting. A hawkish rhetoric by ECB President Lagarde or a 50bps hike may push the Yen further into the doldrums with acceptance above the 150.00 handle key for immediate continuation.

USDJPY

USD/JPY Daily Chart

Chart  Description automatically generated

Source: TradingView, prepared by Zain Vawda

From a technical perspective, the daily chart for USD/JPY broke the channel it had been stuck in yesterday since the early days of April.

A break and daily candle close above the Ascending channel on Friday hinted a huge continuation could potentially arise. Yesterday saw USDJPY test the 200-day MA which failed to affect the pair as well by closing above for the first time since December 22. The RSI here is also hinting at overbought conditions for the pair supported by the recent higher high print on the daily chart and could see USDJPY retest the 200-day MA before attempting a retest of the channel breakout. Key support levels to keep in mind 137.00, 135.00 and 133.00 with a daily candle close below the 133.00 invalidating any bullish setup.

AUDJPY

AUD/JPY Daily Chart

image5.png

Source: TradingView, prepared by Zain Vawda

The AUDJPY setup form last week’s article was the best without a doubt rallying over 400-odd pips from its lower high print around the 88.00 mark. This level lined up perfectly with the preferred entry area (61.8-78.6 discussed in last week’s outlook) using the Fib Retracement Tool.

AUDJPY has been on a staircase higher since bottoming out on March 24. The move since has been a clear indication of price action at work as we have consistently printed higher highs and lows on our way to trade around the 92.00 handle. Similar to EURJPY and USDJPY the main concern here is that the RSI is now in overbought territory as well while we have significant resistance around the 92.00 handle and above that at the 93.00 handle.

Following the recent rally on YEN pairs it might be smart to keep a short-term outlook for the rest of the week. Strong bullish trends remain in play, but a retracement may be imminent across Yen pairs.

Gold Price (XAU/USD), Silver Price (XAG/USD): Attention Now Turns to the Federal Reserve

Gold Price (XAU/USD), Silver Price (XAG/USD): Attention Now Turns to the Federal Reserve

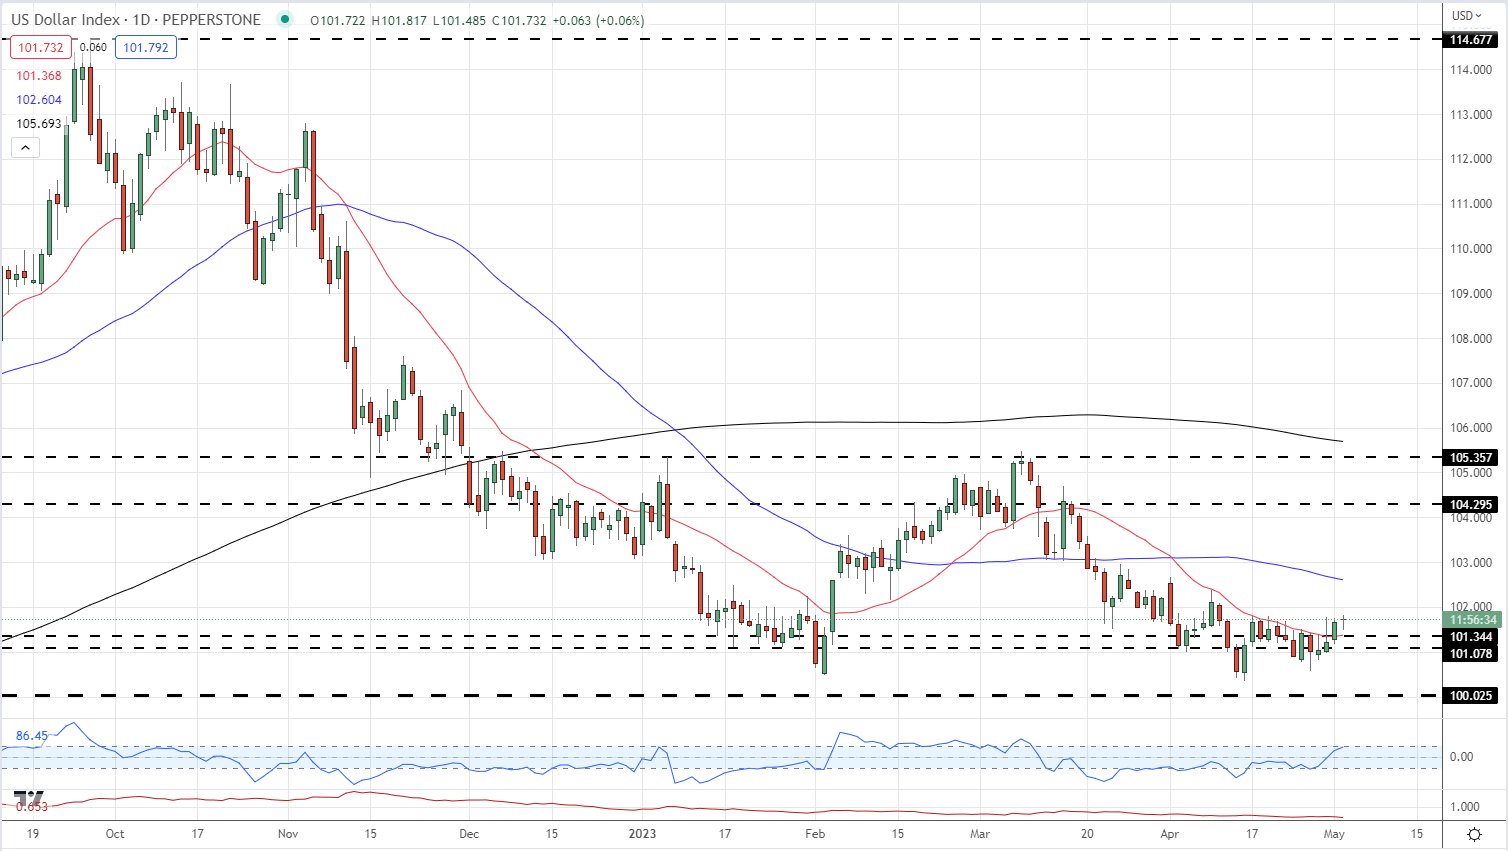
A range of asset classes are on hold today as the market waits for the latest Federal Reserve monetary policy decision, expected at 19:00 UK on Wednesday. The market fully expects and has priced in, a 25 basis point rate hike to 500-525. The press conference, 30 minutes after the decision, will be closely watched by the market for any sign that the US central bank is thinking about the pausing the rate-hiking cycle. The market has recently priced in a slightly hawkish outcome at tomorrow’s FOMC meeting and that has weighed on the short-term outlook of gold and silver. Short-term US bond yields moved higher last week, lending support to the US dollar. The greenback has been under selling pressure for months but it looks to have found support around the 100.50-101.00 area ahead of tomorrow’s meeting. The greenback is pushing further higher today and sits at levels last seen two weeks ago.

US Dollar Index – Daily Chart

image1.png

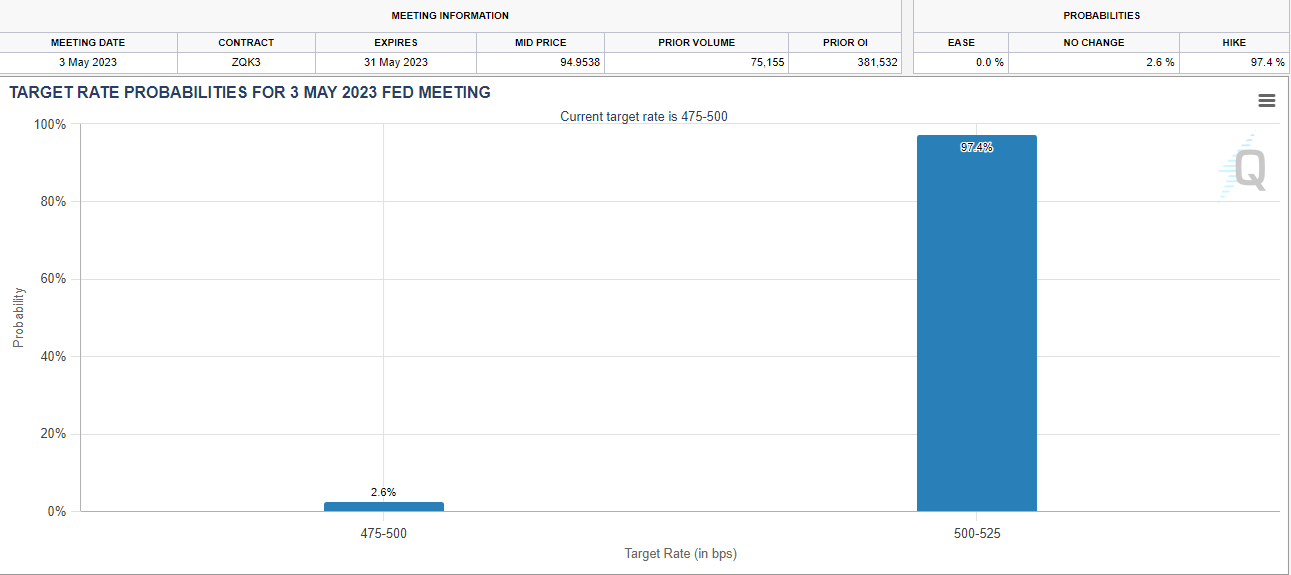
The CME Fed Funds probabilities now show a 97.4% chance of a 25bp rate hike on Wednesday evening.

image2.png

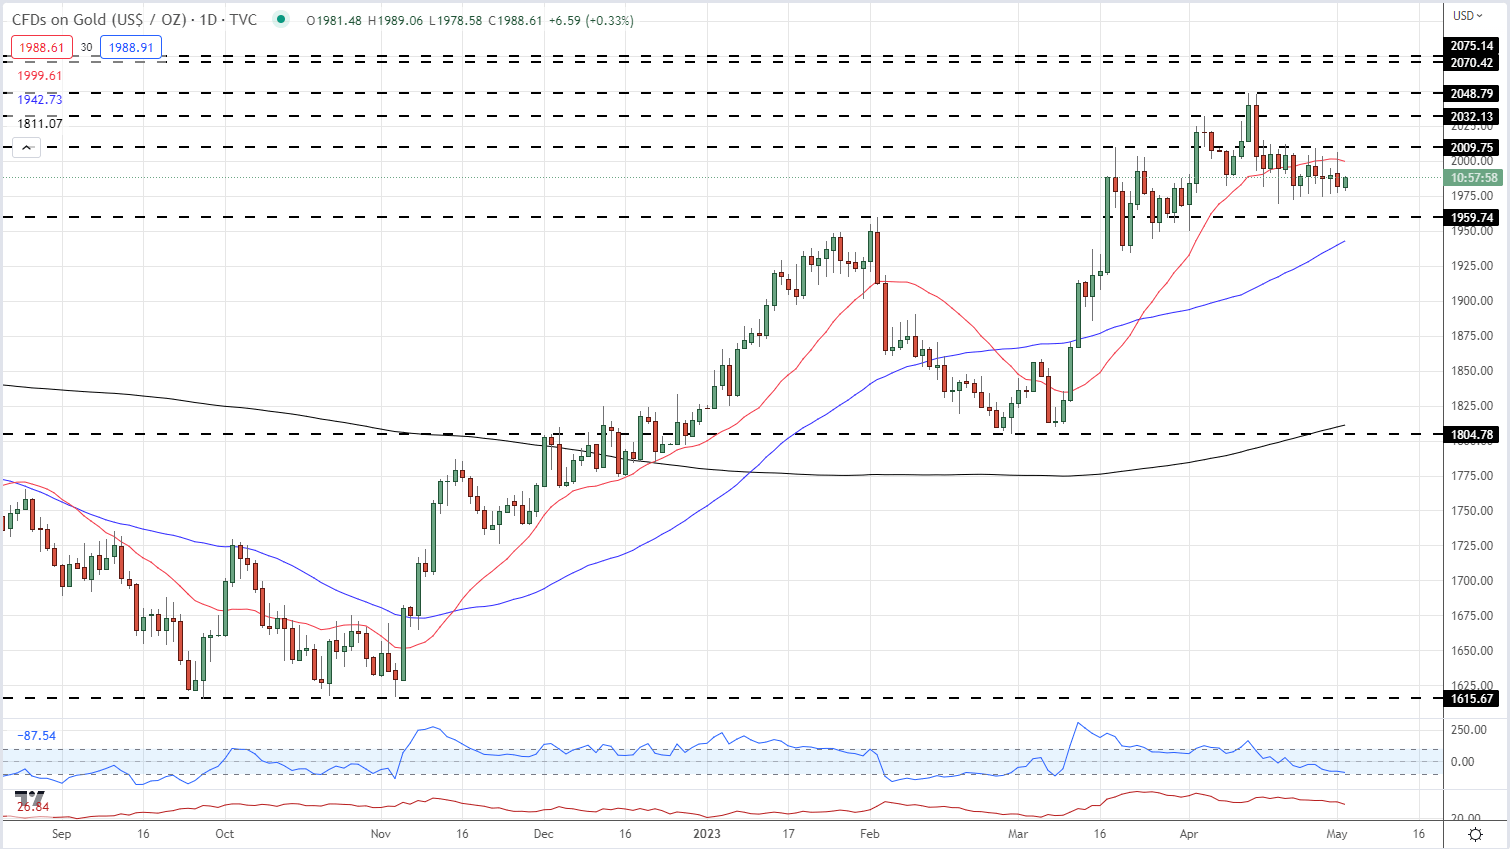
Against this backdrop of a slightly firmer US dollar and thoughts that the Federal Reserve may not roll back on interest rates as soon as previously thought, gold has come under pressure and is struggling to regain the $2,000/oz. marker. Short-term support starts around $1,970/oz. with $2,009/oz. the first line of resistance. Gold’s short-term future will be set out by Fed chair Powell tomorrow.

Gold Price Daily Chart – May 2, 2023

image3.png