Gold Q2 2023 Technical Forecast: Uncertainty Lies Ahead for XAU/USD

Gold Q2 2023 Technical Forecast: Uncertainty Lies Ahead for XAU/USD

The fundamental backdrop for gold as we head into Q2 of 2023 may be shifting by way of a less hawkish Federal Reserve. That being said, calling a dovish Fed may be too early to call with other economic factors creating a push/pull effect for the US central back, thus making their job that much harder to achieve price stability.

XAU/USD TECHNICAL ANALYSIS

SPOT GOLD WEEKLY CHART
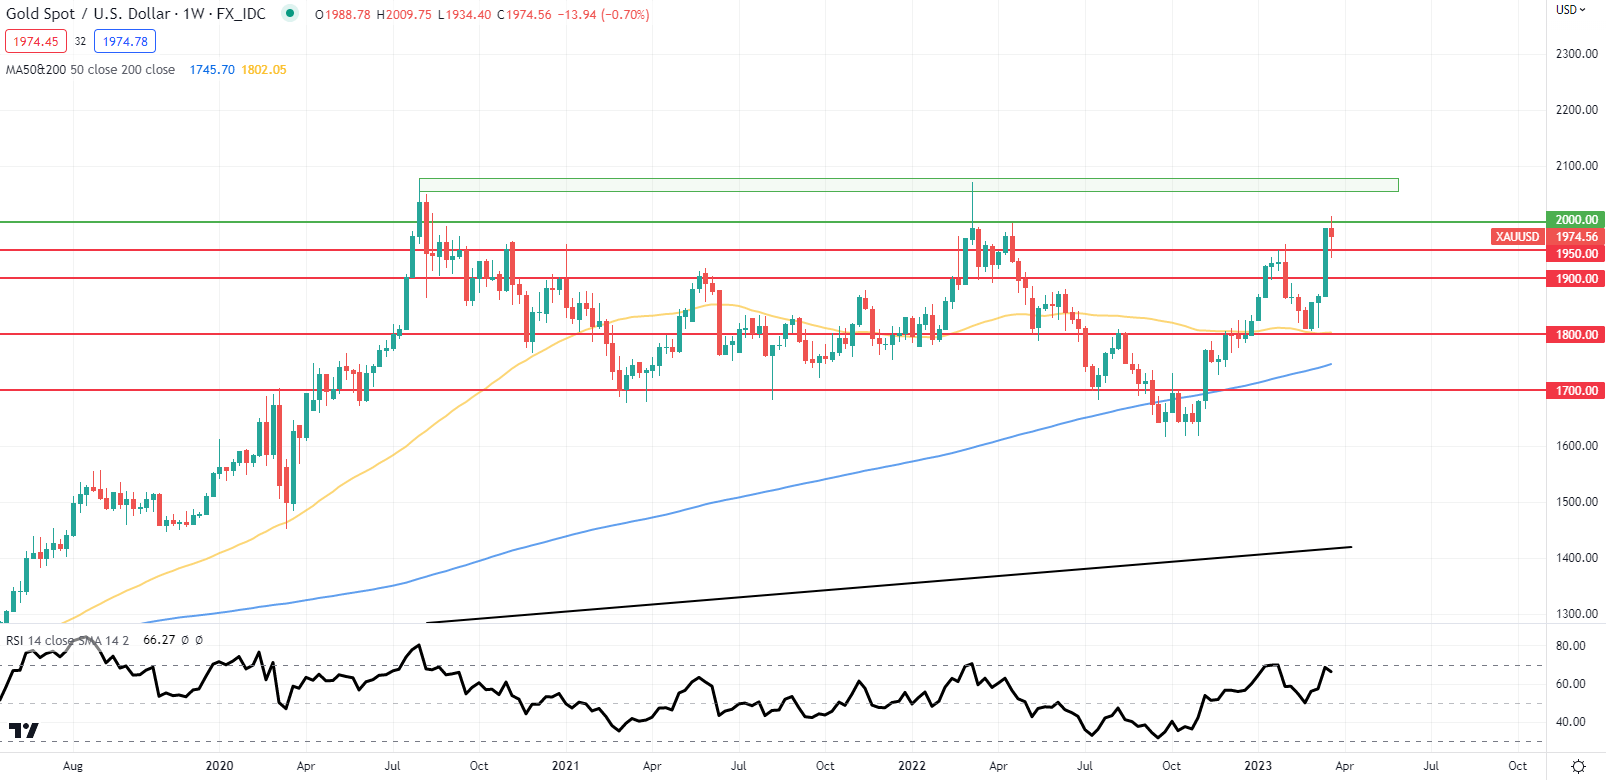
image1.png

Chart prepared by Warren Venketas, IG

Looking at the longer-term weekly chart for gold, the 1950.00 resistance handle (now support) has been breached for the second time this year. With more conviction this tie round, a rally up towards the 2070 2075 zone (green) is not unlikely. If we look at the Relative Strength Index (RSI), there are signs of bearish divergence and could indicate a possible move lower as price action and the RSI extend their opposing travels. Although an initial move higher is on the cards, by the end of Q2 there may well be a pullback towards 1950 and beyond. The 50-day (yellow) and 200-day (blue) moving averages are quietly converging and may form a death cross in due course, once again exposing XAU/USD to further downside.

SPOT GOLD DAILY CHART
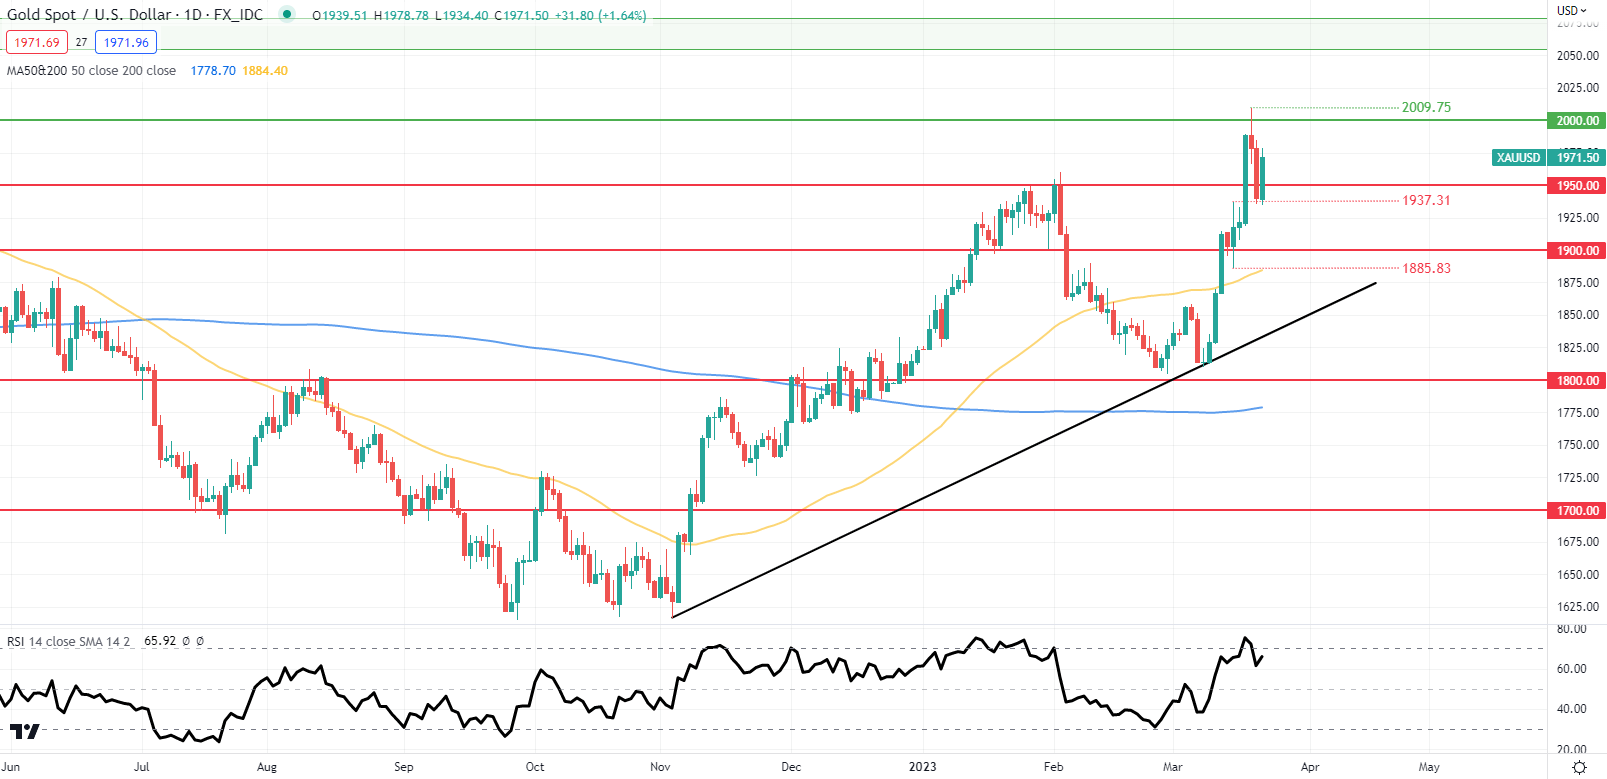
image2.png

Chart prepared by Warren Venketas, IG

Focusing in on the daily chart above, the short-term bias remains firmly in favor of gold bears with the RSI in overbought territory. The difficulty lies in forecasting over a 3 month period and with so much impactful economic data to come, the long-term outlook can be blurry. Revising the technical analysis above periodically will ensure a fresh look as and when new data hits the market, giving a more accurate viewpoint. My personal view should see gold persist between the 1900 – 2100 zones leaving Q3 with the potential to move the needle in a more significant manner.

Key resistance levels:

-2070.00 – 2075.00

-2009.75

-2000.00

Key support levels:

-1950.00

-1937.31

-1900.00

-1885.83/50-day SMA

-Trendline support

IRS warns of deadline to claim $1.5B in 2019 tax refunds: These states are owed the most

IRS warns of deadline to claim $1.5B in 2019 tax refunds: These states are owed the most

The Internal Revenue Service estimates that there is almost $1.5 billion in unclaimed refunds from tax year 2019, but the deadline to secure that money is nearing.

Taxpayers have until July 17 to submit a tax return and get the money they are owed. The IRS said in a news release that the average median refund for that year is $893.

“The 2019 tax returns came due during the pandemic, and many people may have overlooked or forgotten about these refunds,” said IRS Commissioner Danny Werfel. “We want taxpayers to claim these refunds, but time is running out. People face a July 17 deadline to file their returns. We recommend taxpayers start soon to make sure they don’t miss out.”

The three years allotted for filing a tax return and collecting a refund were extended past the April tax deadline because of the COVID-19 pandemic. Any funds that aren’t claimed by the deadline will belong to the U.S. Treasury.

“The three year limit by itself isn’t anything new, but the IRS deadline has extra importance this year because tax year 2019 returns were filed right as the pandemic hit and shut down tax offices,” tax attorney Adam Brewer told Nexstar. “I suspect the IRS owes money to taxpayers in two camps – those that were so impacted by the pandemic that they never filed and those that filed paper returns that were never processed by the IRS. No matter what side you find yourself on, file a return by the deadline, send it certified so you can confirm it was received, and be persistent if you don’t hear back from the IRS.”

This year the IRS broke out the data to show which states have the highest potential refunds awaiting taxpayers:

The IRS also reminded taxpayers that they may have missed out on certain credits that they would have received had they filed, such as the Earned Income Tax Credit, which can be worth as much as $6,557. The credit is designed to aid individuals and families with income below a certain level.

“With the pandemic taking place when the 2019 tax returns were originally due, people faced extremely unusual situations. People may have simply forgotten about tax refunds with the deadline that year postponed all the way into July,” Werfel said. “We frequently see students, part-time workers and others with little income overlook filing a tax return and never realize they may be owed a refund. We encourage people to review their records and start gathering records now, so they don’t run the risk of missing the July deadline.”

US CPI, Fed Minutes to Weigh on US dollar: What’s Next For EUR/USD, GBP/USD, USD/JPY?

US CPI, Fed Minutes to Weigh on US dollar: What’s Next For EUR/USD, GBP/USD, USD/JPY?

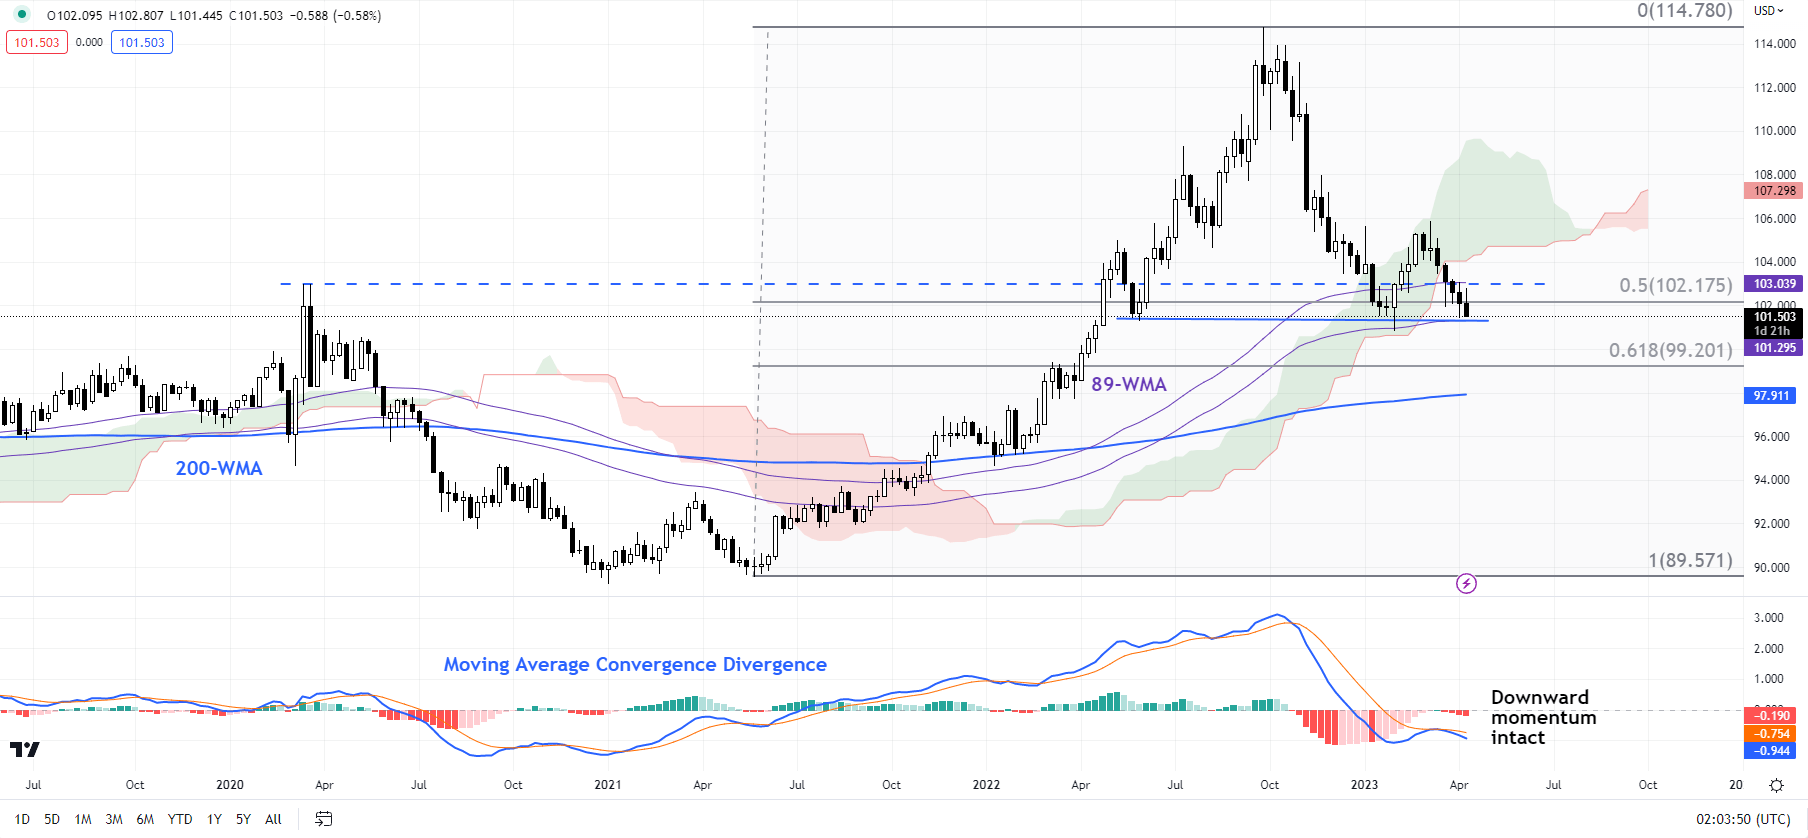
Softening US price pressures could weigh on the US dollar even as the US Federal Reserve expects a recession this year as a fallout from the turmoil in the banking sector.

US CPI rose 0.1% on-month in March, down from a 0.4% increase in February, and 5.0% on-year last month compared with 6.0% in February. However, price pressures are not sufficiently weak, said Richmond Fed President Thomas Barkin, suggesting the Fed could proceed with one more hike in May. Barkin’s remarks were echoed by San Francisco Fed President Mary Daly on Wednesday that the Fed has “more work to do”.

US Dollar Index (DXY Index) Weekly Chart

image1.png

Chart Created Using TradingView

Furthermore, minutes from the FOMC meeting in March showed several policymakers considered pausing interest rate increases, but concluded high inflation needed to be tackled, even after a forecast from Fed staff showed that banking sector stress would tip the economy into a mild recession. Interest rate markets are pricing in about a 68% chance that the Fed will raise rates by an additional 25 basis points at its May 2-3 meeting, according to CME’s FedWatch tool.

EUR/USD Daily Chart

image2.png

Chart Created Using TradingView

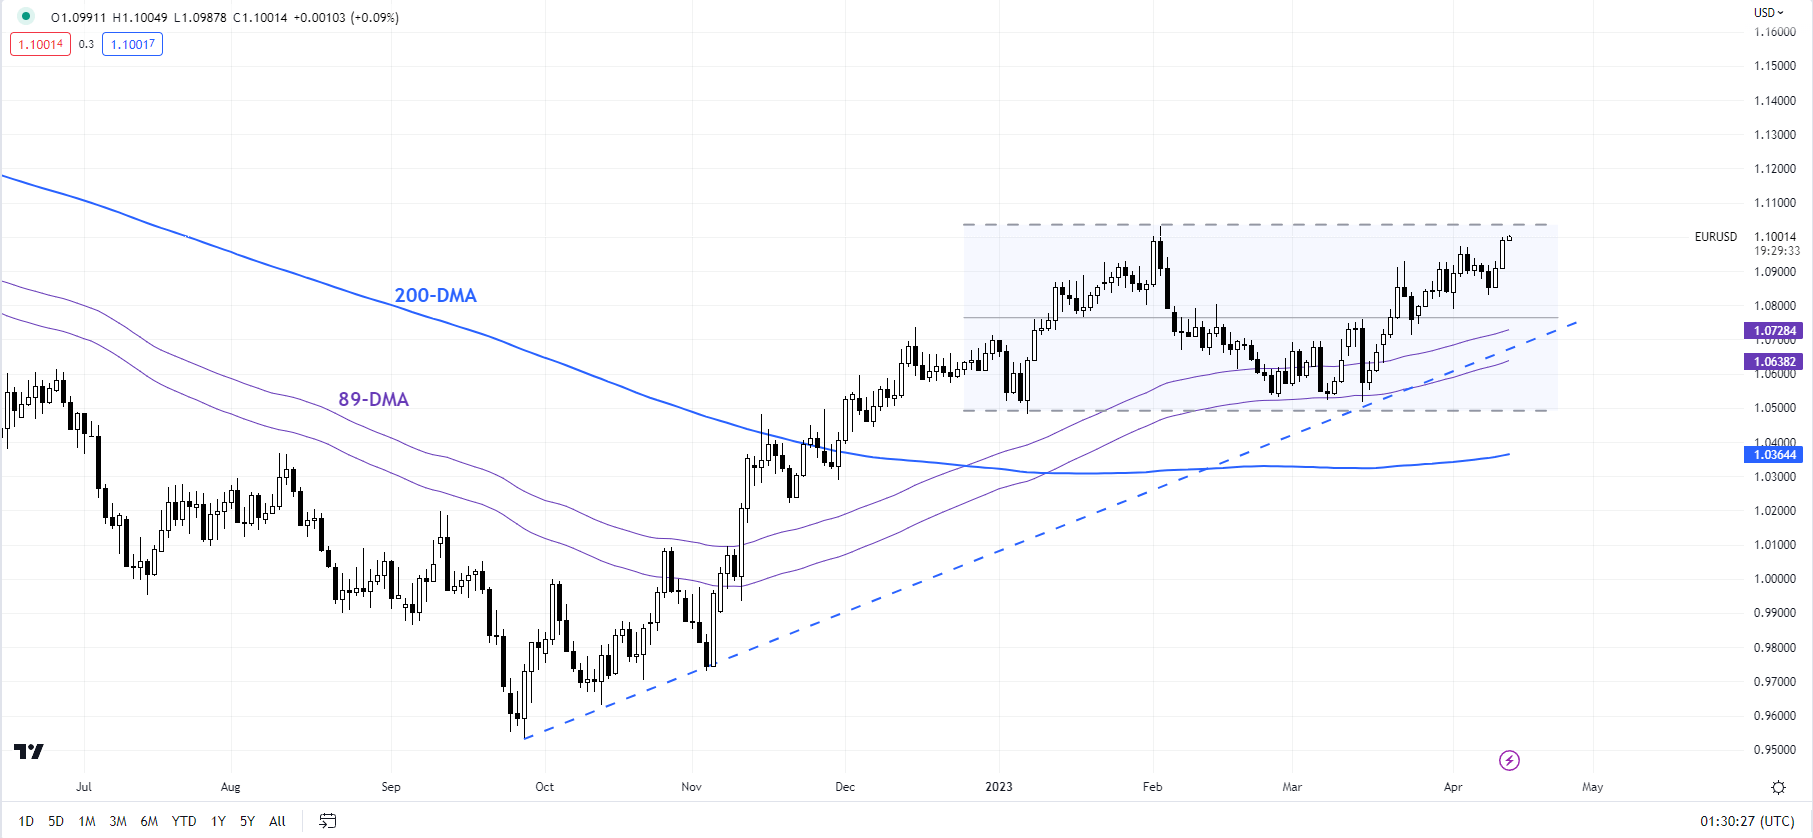
EUR: Flirts with key resistance at 1.10

Upward momentum is improving as EUR/USD tests a vital ceiling at the February high of 1.1035 – the ‘two-steps-forward-one-step-backward’ nature of the price action since late March is a sign of how important the resistance is. A break above the barrier could initially open the door toward the 200-week moving average (now at about 1.1200). As highlighted in the previous update, EUR/USD’s trend remains up after it in March held key support at the January low of 1.0480.

GBP/USD Daily Chart

image3.png

Chart Created Using TradingView

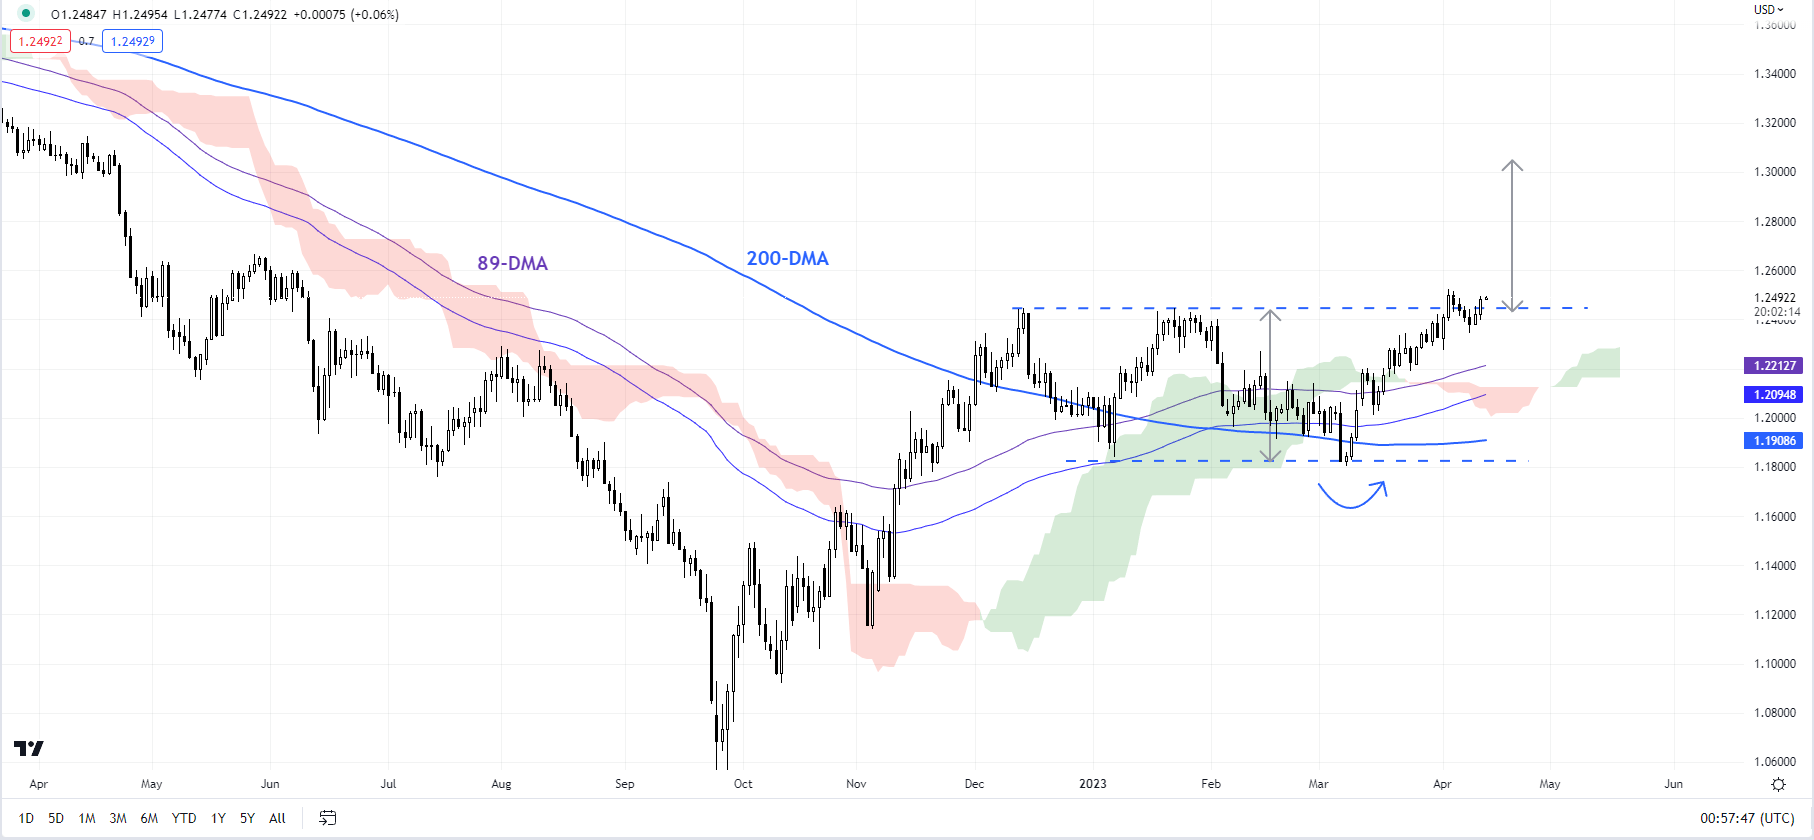
GBP: Slowly but surely

GBP/USD is once again flirting with the December high of 1.2450. A decisive break above the resistance would trigger a breakout from the sideway channel since December. The width of the channel would point to a move toward 1.3000. As the previous update highlighted, GBP/USD’s trend remains up following the rebound in March from a crucial floor at the January low of 1.1840, coinciding with the 200-day moving average.

USD/JPY Daily Chart

image4.png

Chart Created Using TradingView

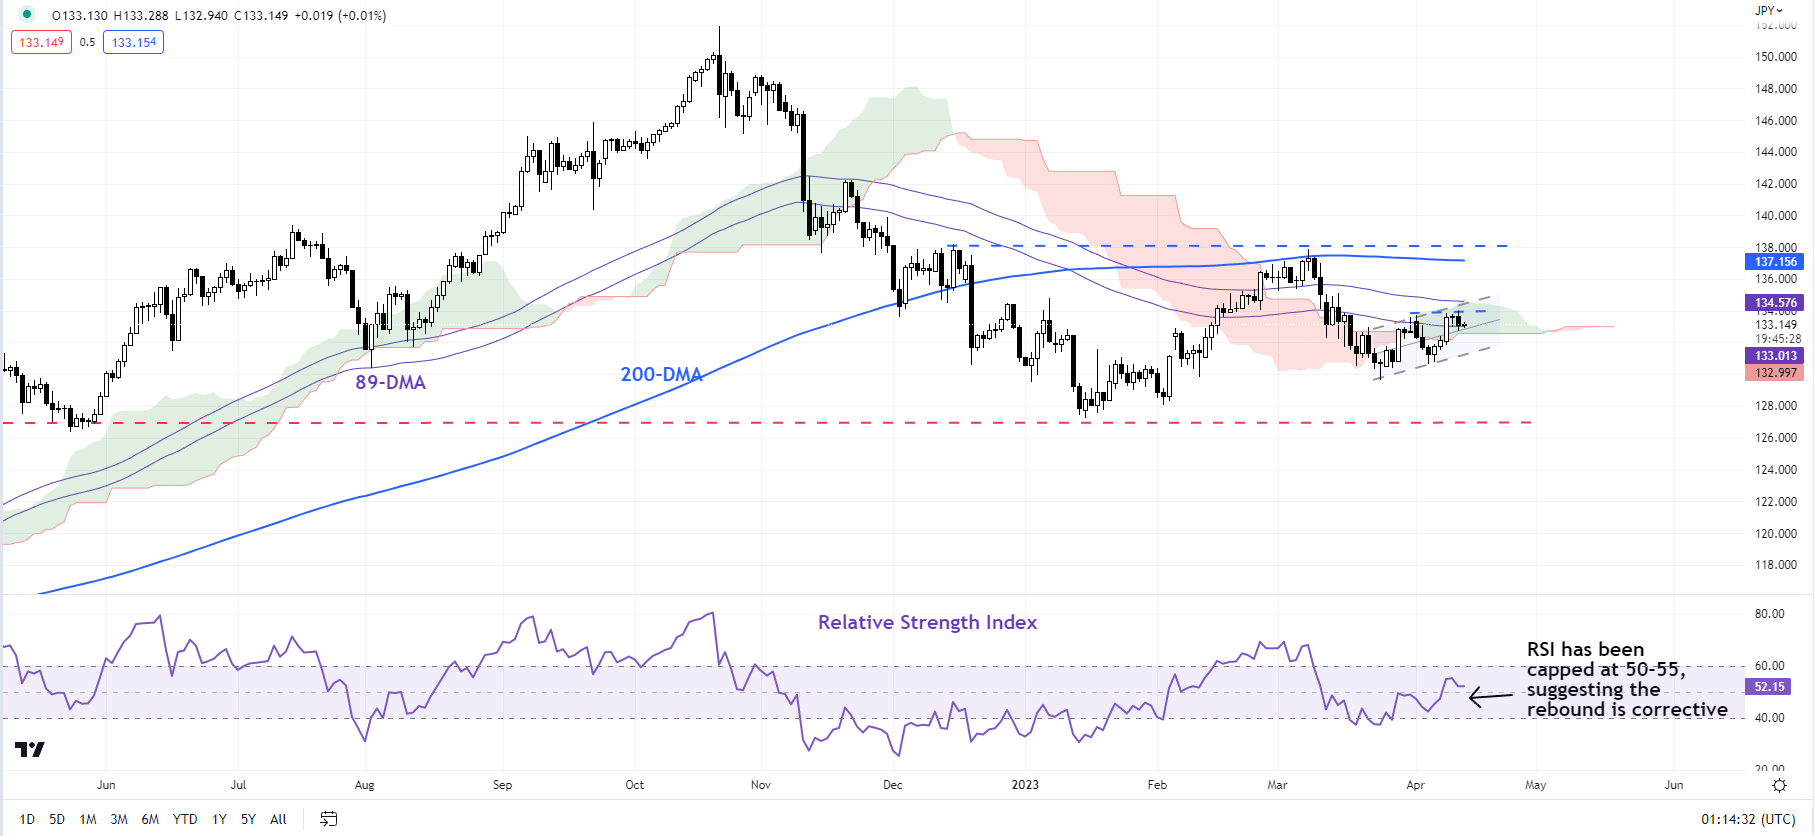
USD/JPY: Struggles to extend gains

In recent days, USD/JPY has struggled to clear a tough hurdle at the April 3 high of 133.75, coinciding with the 89-day moving average and the upper edge of the Ichimoku cloud on the daily charts. Since the consolidation that began in late March, the 14-day Relative Strength Index (RSI) continues to be capped at 50-55 – corrective rebounds tend to run out of steam at 50-55 levels of the RSI. Still, a decisive cross above 133.75 would confirm that the immediate downward pressure had faded for now, raising the prospect of a broad range of 129-138.

British Pound Latest – GBP/USD Moves Higher on Mixed GDP Data, US Dollar Weakness

British Pound Latest – GBP/USD Moves Higher on Mixed GDP Data, US Dollar Weakness

The UK economy stood still in February as industrial action in various areas of the services sector contributed to UK growth flatlining. The latest Office for National Statistics (ONS) monthly GDP data showed no growth in February with the services sector falling by 0.1% compared to a revised higher 0.7% growth in January. According to the ONS, ‘the largest contributions to the fall in services output in February 2023 came from education and public administration and defence: compulsory social security, industrial action took place in both of these industries in February 2023’.

image1.png

According to the ONS, monthly GDP is now estimated to be 0.3% above its pre-coronavirus levels in February 2020.

image2.png

GBP/USD is getting a small lift from today’s UK data and from a marginally weaker US dollar. The greenback fell yesterday after US headline inflation fell for the ninth month in a row to 5%, vs expectations of 5.2%. While inflation slowly falls, the US economy may enter a mild recession, according to yesterday’s FOMC minutes. According to the report, the recent banking crisis may push the economy into a mild recession later in the year due to tighter bank lending conditions. While this will slowdown economic activity, it will also weigh on inflation.

GBP/USD is now testing 1.2500 again and a break higher will see 1.2525 come into play. Above here May 27, 2022 swing high at 1.2667 becomes the next level of interest. Initial support is seen at 1.2448, a prior level of resistance, before the 20-day moving average at 1.2355.

GBP/USD Daily Price Chart – April 13, 2023

image3.png

Retail Sentiment is Mixed

Retail trader data show 39.60% of traders are net-long with the ratio of traders short to long at 1.53 to 1.The number of traders net-long is 12.06% lower than yesterday and 4.17% higher than last week, while the number of traders net-short is 10.30% higher than yesterday and 3.66% lower than last week.

We typically take a contrarian view to crowd sentiment, and the fact traders are net-short suggests GBP/USD prices may continue to rise. Positioning is more net-short than yesterday but less net-short from last week. The combination of current sentiment and recent changes gives us a further mixed GBP/USD trading bias.

Gold Price Eyes New Highs as US Dollar Wilts on Soft CPI. Will XAU/USD Rally?

Gold Price Eyes New Highs as US Dollar Wilts on Soft CPI. Will XAU/USD Rally?

The gold price fell just short of a 1-year peak overnight after the US Dollar weakened post US CPI data and the release of the Federal Open Market Committee (FOMC) meeting minutes.

To recap, US CPI was a touch below forecasts at 5.0% year-on-year to the end of March rather than the 5.1% anticipated and 6.0% previously.

Treasury yields eased across the curve as a result, with the 2-year bond slipping the most, finishing around 6 basis points lower, trading below 4.0%. It had traded above 5.0% in March.

Fed meeting minutes showed that the bank further retreated from the overtly hawkish stance that they have had until recently. While the tilt is for less aggressive tightening, it has mostly been perceived as still hawkish, just to a lesser degree. The banks’ internal researchers see a mild recession toward the end of 2023.

The minutes also revealed that the 25 bp hike at the March gathering was unanimous but that various board members had postulated both a pause and a 50 bp lift in the target rate. Interest rate markets are leaning toward a 25 bp rise at the next meeting in early May.

All of this served to undermine the US Dollar going into the New York close.

Overnight, San Francisco Federal Reserve Bank President Mary Daly and the Richmond branch President Thomas Barkin sang from the same song sheet. Both officials’ rhetoric leans toward monetary policy remaining tight for now.

The Aussie Dollar has been the big mover so far today after it was boosted following the unemployment rate there remaining near 50-year lows. It was 3.5% in March which was below estimates of 3.6% and 3.5% previously.

53.0k Australian jobs were added in the month, which was notably above the 20k anticipated and 64.6k previously.

Chinese trade data surprised to the upside with a surplus of USD 88.19 billion instead of the USD 40.00 billion anticipated.

Despite this, APAC equity indices are generally slightly softer after Wall Street chalked up small losses.

Silver made a fresh 12-month peak today at USD 25.66 a Troy ounce. Gold is also eyeing last week’s peak of USD 2,032 per ounce.

Crude oil made a 5-month high overnight and continues to trade near those levels. The WTI futures contract is near US$ 83 bbl while the Brent contract is a touch above US$ 87 bbl.

Looking ahead, the US will see job data and PPI numbers.

The full economic calendar can be viewed here.

GOLD TECHNICAL ANALYSIS

Gold traded at 2,028 overnight, just shy of the 12-month peak seen last week at 2,032 and these levels might offer resistance.

Since making a Triple Bottom between September and November last year, gold has had a stellar run to trade over 2,000 again.

A bullish triple moving average (TMA) formation requires the price to be above the short-term SMA, the latter to be above the medium-term SMA and the medium-term SMA to be above the long-term SMA. All SMAs also need to have a positive gradient.

After the recent price action, any combination of the 10-, 21-, 55-, 100- and 200-day Simple Moving Averages (SMA) meet the criteria for a bullish TMA.

On the downside, support may lie at the recent lows of 1,950, 1,935 and 1,885 as well as the breakpoint at 1,890.

image1.png


Bullish Break in Crude Oil After US CPI; Can it Rise Toward $90?

Bullish Break in Crude Oil After US CPI; Can it Rise Toward $90?

Upward momentum in crude oil is improving following the breakout from a week-long sideways range as softening US price pressures bolstered the view that the Federal Reserve is nearing a pause in its hiking cycle. Still, oil must deal with one more hurdle before it turns unambiguously bullish.

US CPI rose 0.1% on-month in March, down from a 0.4% increase in February, and 5.0% on-year last month compared with 6.0% in February, cementing expectations that US interest rates are peaking, and weighing on the US dollar. Markets expect the Fed to hike one more time in May, before cutting rates to around 4.35% by the end of the year.

Crude Oil Daily Chart

image1.png

Key focus is now on monthly reports from OPEC and International Energy Agency (IEA) due today and tomorrow respectively, which could shed light on oil demand and supply conditions. IEA’s executive director Fatih Birol said on Wednesday global oil market could see tightness in H2-2023, which could push oil prices higher.

Crude Oil Monthly Chart

image2.png

Chart Created by Manish Jaradi Using TradingView

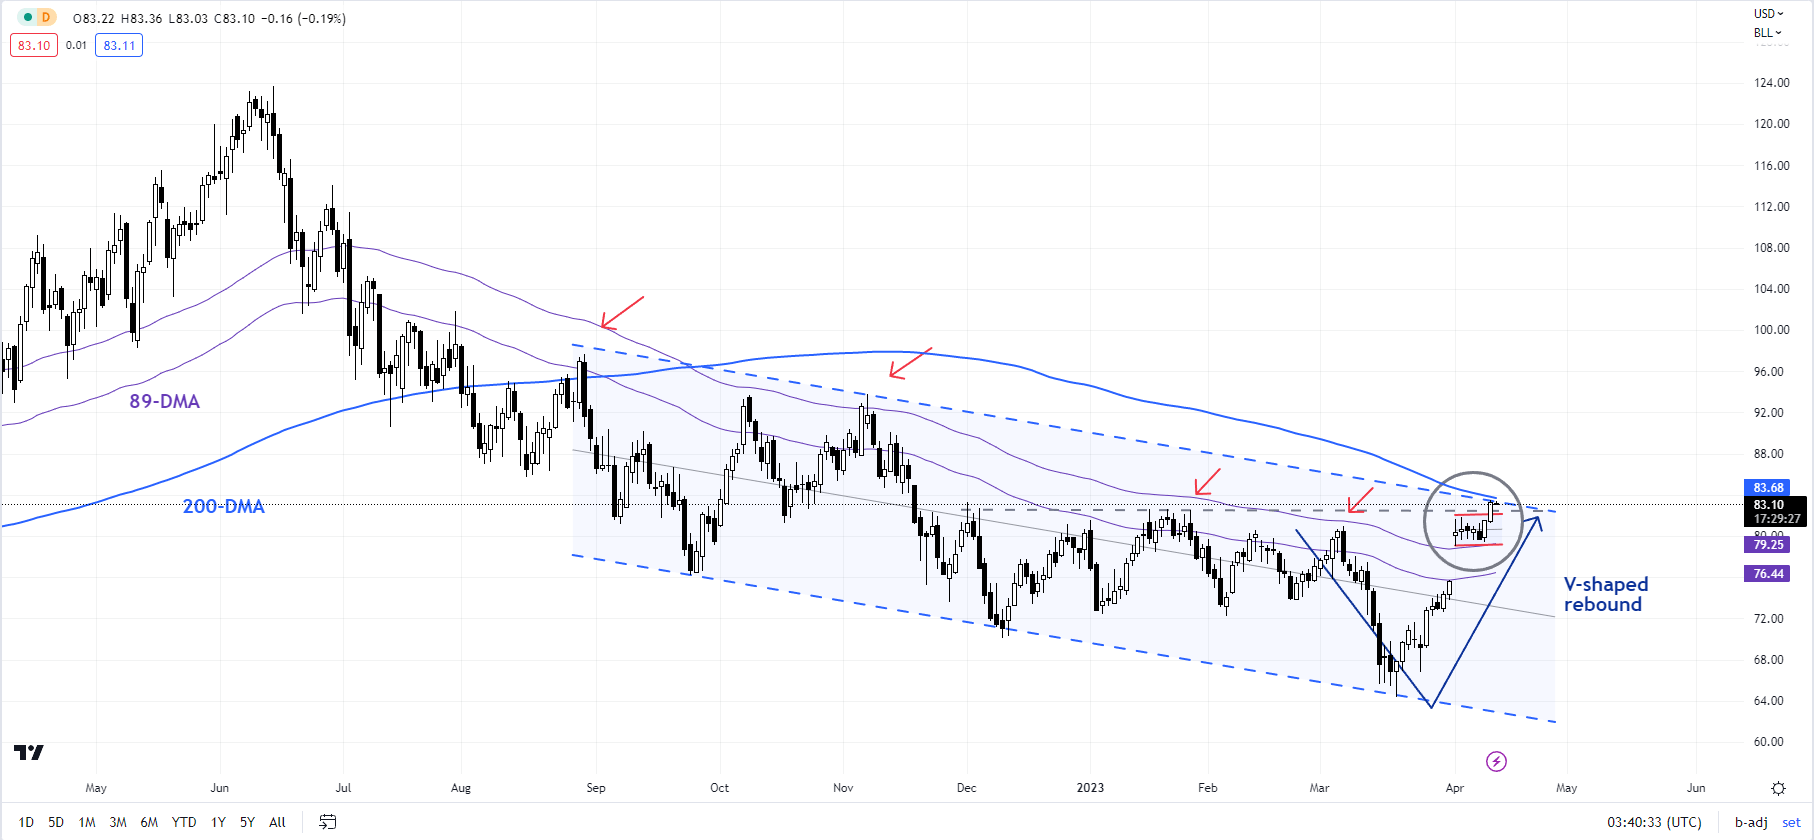
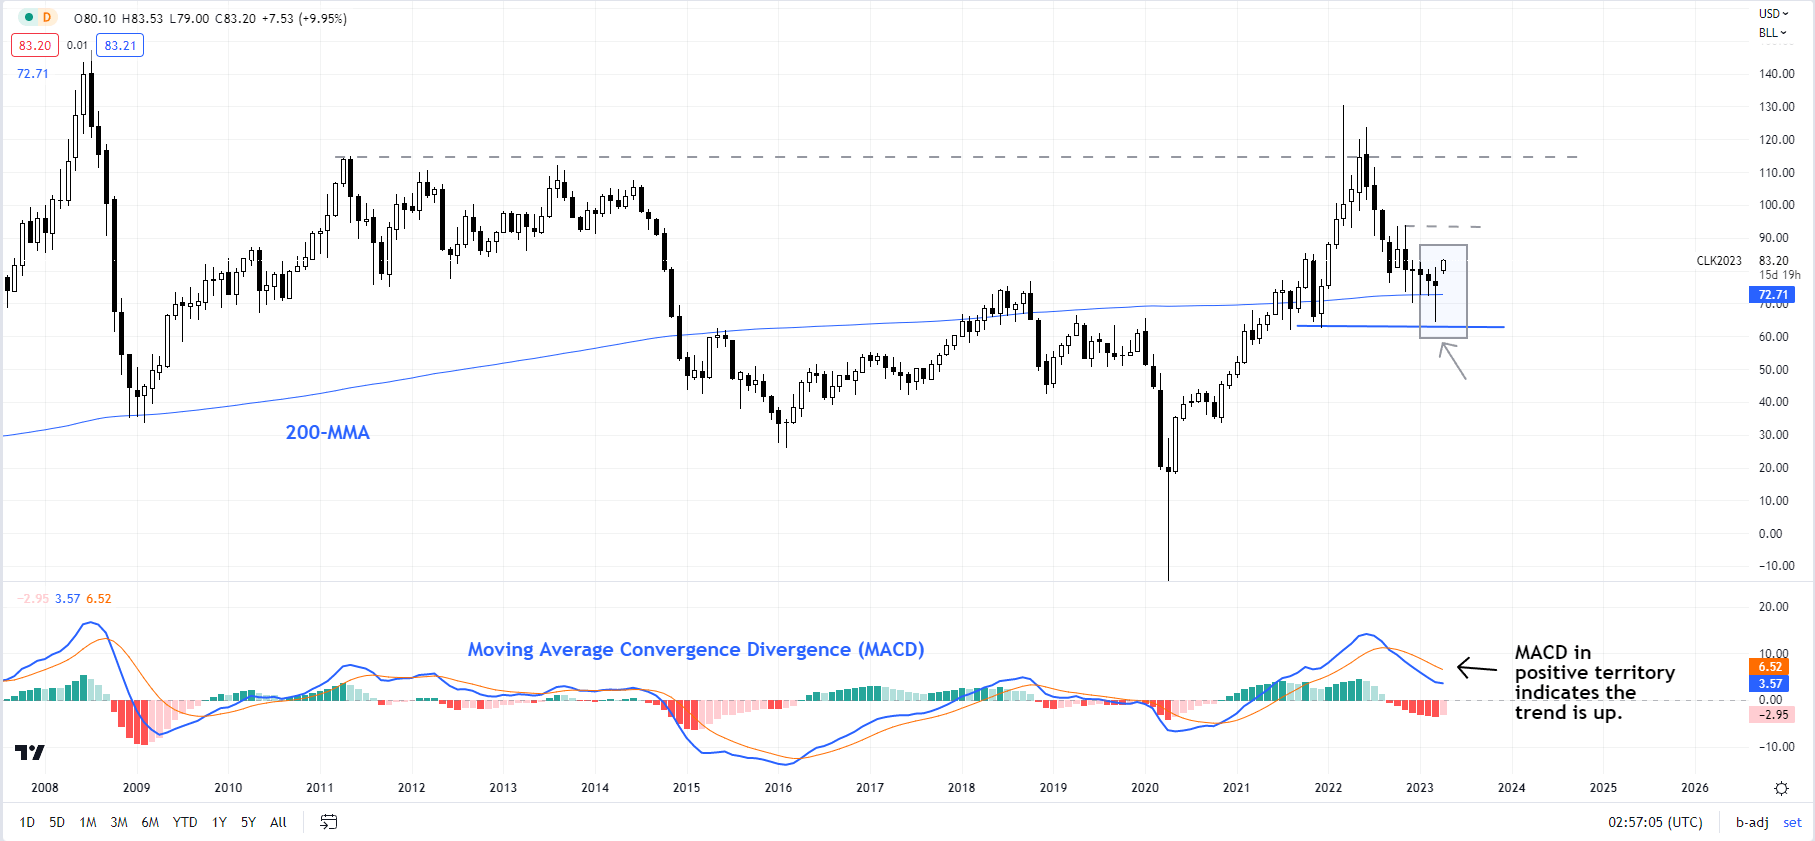
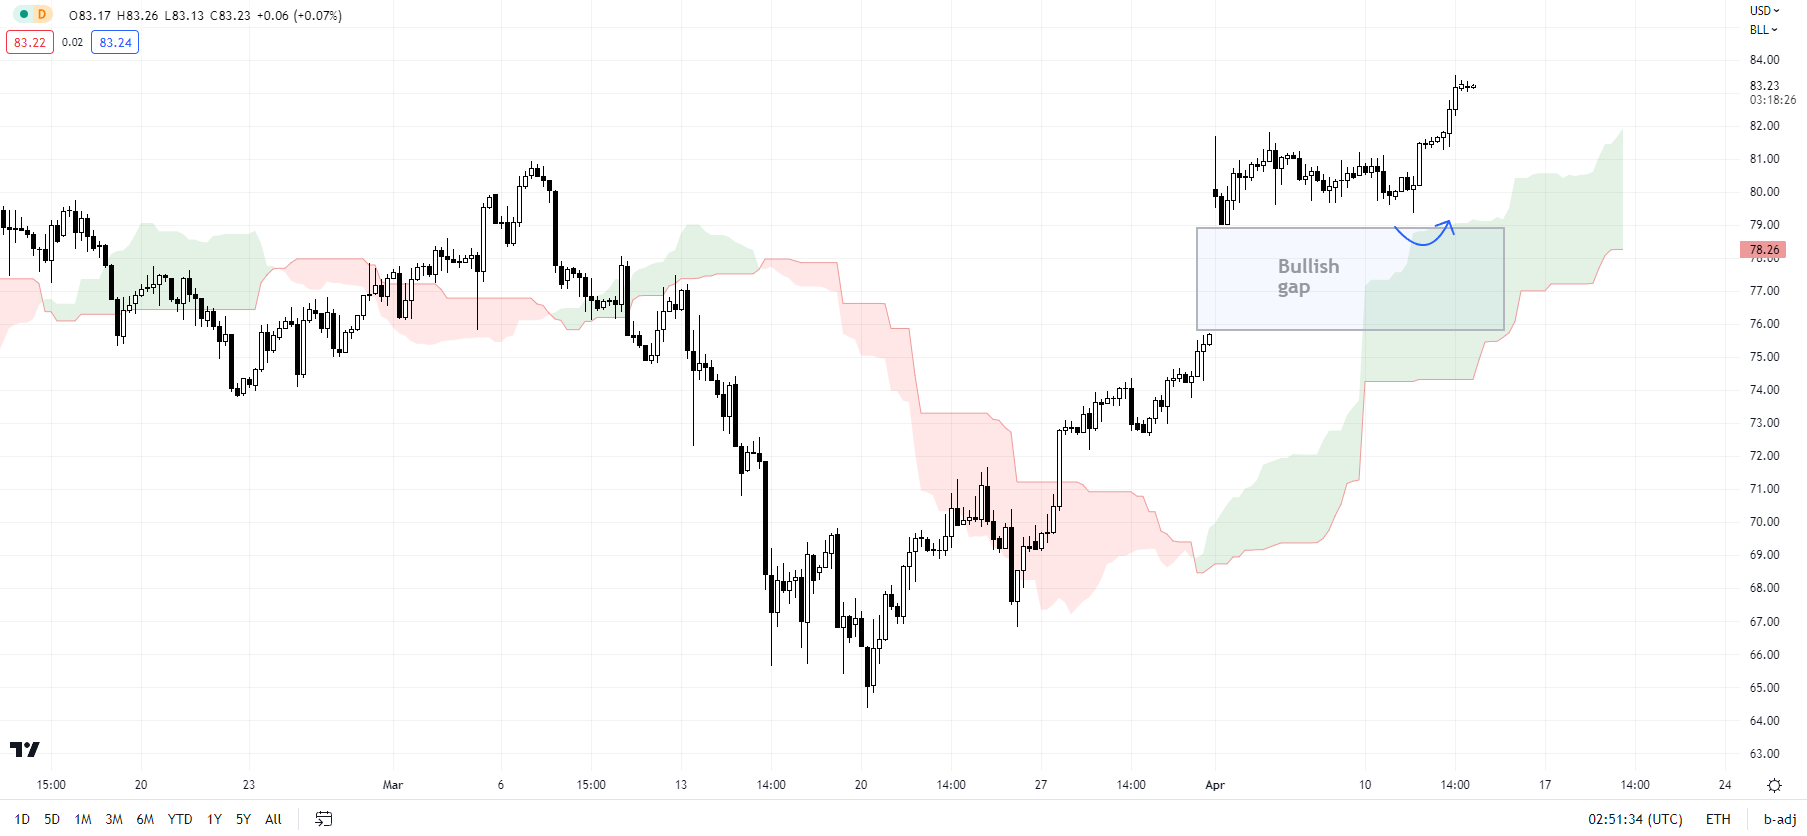
On technical charts, crude oil this week held above a key floor at the upper edge of last weekend’s gap (at about 79.00), reaffirming the near-term bullish bias. Subsequent, it broke out of the week-long narrow range and crossed above fairly strong resistance on the 89-day moving average (rallies since late 2022 have been capped at the moving average).

Crude Oil 240-minute Chart

image3.png

Chart Created by Manish Jaradi Using TradingView

It is now testing the 82.50-84.00 area, including the 200-day moving average and the January high. Oil’s rise above the March high of 81.00 on the monthly charts and the 89-day moving average has raised the odds of a move above 82.50-84.00. Such a break would imply that the ten-month-long downward pressure had faded, exposing the upside toward the November high of 93.75.

British Pound (GBP/USD) Forecast Led by US CPI, FOMC Minutes and Gov Bailey

British Pound (GBP/USD) Forecast Led by US CPI, FOMC Minutes and Gov Bailey

GBP/USD FUNDAMENTAL BACKDROP

The pound is tracking marginally higher this Wednesday morning ahead of three key potential economic drivers (refer to economic calendar below). The first being US CPI that has been dominating global market headlines and could set the tone short-term. Following on from last week’s strong US Non-Farm Payroll (NFP) report, elevated inflation figures today could sustain a more hawkish narrative going forward and limit GBP upside. The second high impact event stems from the FOMC minutes which is unlikely to have as much bearing on the market as the CPI report but it will interesting to understand the thinking behind the decision to hike interest rates in such a tumultuous period during the height of the recent banking crisis. I will be looking out for any mention of rate cuts in the second half of this year which may bring some relief for the pound.

GBP/USD ECONOMIC CALENDAR

image1.png

From a UK perspective, Governor Bailey is scheduled to speak in Washington today with markets keenly awaiting on guidance for the BOE’s upcoming meeting – currently favored for a 25bps hike (see table below). Taking into account other major central banks have paused their hiking cycle, there is a chance that the BOE may follow suit considering the UK’s large financial sector and weak economic growth forecast by the IMF yesterday.

The BOE’s Monetary Policy Committee (MPC) has also just added a new external member for a three year period beginning on the 5th of July 2023. Megan Greene has replaced the BOE’s most dovish member Silvana Trenreyro and will add an interesting dynamic to the committee.

BANK OF ENGLAND INTEREST RATE PROBABILITIES

image2.png

TECHNICAL ANALYSIS

GBP/USD DAILY CHART

image3.png

Technically, price action on the daily GBP/USD chart shows a Relative Strength Index (RSI), hovering near overbought territory. In the event of a CPI miss, I cannot see cable maintaining levels above 1.2500 for very long. The pair continues to trade within an upward trending channel (black) and a break below channel support could spark a sell-off below the 1.2400 psychological level and beyond.

Key resistance levels:

  • 1.2667
  • 1.2500

Key support levels:

  • 1.2400/channel support
  • 1.2345

MIXED IG CLIENT SENTIMENT

IG Client Sentiment Data (IGCS) shows retail traders are currently SHORT on GBP/USD, with 55% of traders currently holding short positions (as of this writing). At DailyFX we typically take a contrarian view to crowd sentiment; however, due to recent changes in long and short positioning we arrive at a short-term cautious disposition.

Gold Price Forecast: Key Confluence Area in Sight Ahead of US CPI Data

Gold Price Forecast: Key Confluence Area in Sight Ahead of US CPI Data

Gold (XAU/USD) FUNDAMENTAL BACKDROP

The Gold price has rallied higher in Asian trade with a session high of $2020.87 before surrendering some of those gains following the European open (trading at $2011.00 at the time of writing). The question of the sustainability of such a move however remains on the mind of market participants in what could prove to be a pivotal day for the precious metal.

Gold found support at the pennant breakout on Monday before bouncing yesterday on the back of a weaker US dollar which snapped a four-day winning streak. Market sentiment overall has been relatively muted following the weekend as key US data events lie ahead.

Comments from Federal Reserve policymakers failed to provide any clarity with rather mixed and vague commentary. Minneapolis Fed President Kashkari said he sees inflation down to around 3% in 2023 while John Williams of New York said he feels the Fed need to do more to combat inflation. Interesting comments given the expected forecast for Core CPI which is expected to indicate a slight uptick in March.

An interesting day and week ahead for the precious metal as price approaches a key inflection point around the $2033.00 level (most recent swing high). The US inflation print due out later comes hot on the heels of labor market data which remained robust. A rise in inflation today or a significant miss of the forecast print of 5.2% could result in a fresh push to the downside for the precious metal while a sign that inflation continues to soften may serve as a catalyst for a retest of the 2022 high around the $2070.00 handle. In a manner of speaking, it is clearly make or break time for the precious metal.

image1.png

For all market-moving economic releases and events, see the DailyFX Calendar

TECHNICAL OUTLOOK AND FINAL THOUGHTS

Form a technical perspective, Gold has seen a lovely break, retest and continuation of the pennant pattern as we approach the recent swing highs around the $2033.00 level. The vertical distance between the upper and lower trendline is around $80 which puts potential upside targets around the 2022 high of $2070.00 which has yet to be reached. (Read: How to Trade Triangle and Pennant Formations).

The technicals appear to be in favor of further upside and a potential test of that 2022 high but faces a host of challenges. Some key resistance levels and of course the US inflation data release which could have a material impact on the USD index and thus gold prices moving forward.

Resistance Levels:

  • 2033.00
  • 2050.00
  • 2070.00

Support Levels:

  • 2003.00
  • 1983.00
  • 1950.00

Gold (XAU/USD) Daily Chart – April 12, 2023

image2.png

US inflation continues to fall, things are moving in the right direction for the Fed – Commerzbank

US inflation continues to fall, things are moving in the right direction for the Fed – Commerzbank

US inflation declines to 5%. From the perspective of the Fed, the data thus point in the right direction, economists at Commerzbank report.

The March report shows declining inflationary pressure

“US inflation continued to fall significantly in March, from 6.0% to 5.0%. Not only did volatile energy prices fall noticeably, but there was also some slowing in the important shelter category.”

“The March inflation report should calm the Fed’s nerves somewhat. Most price categories show an easing of price pressures, and this is even the case for rents. Moreover, a further decline in rent inflation can be expected in the coming months.”

“The Fed is now likely to focus its attention more on supporting the emerging positive trend. A more aggressive approach is probably no longer necessary in view of the progress made. The Fed nears its interest rate peak; we expect only two more rate hikes of 25 bps each.”

Euro Latest: EUR/USD In Limbo Ahead of the Latest US Inflation Release

Euro Latest: EUR/USD In Limbo Ahead of the Latest US Inflation Release

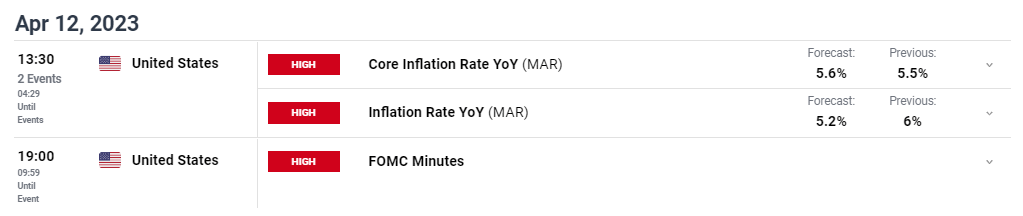
The US Bureau of Labor Statistics (BLS) inflation report, scheduled to be released at 12:30 GMT, is expected to show a mixed set of inflation statistics for March. The headline inflation rate is seen falling from 6% in February to 5.2% in March, while the core reading – headline minus energy and food – is seen ticking 0.1% higher to 5.6%.

image1.png

Later in the session, the minutes of the March 22 Federal Reserve policy meeting will be released. At this meeting, the Fed hiked rates by 25 basis points to a target rate of 4.75% to 5%, in line with market expectations, but pared back its prevailing hawkish language. The Fed noted that if risks emerged that could impede them from hitting their goals, ‘The Committee would be prepared to adjust the stance of monetary policy as appropriate….’ While still reaffirming their commitment to reducing inflation to target, the Fed’s tone was lighter than in past press releases and maybe a hint towards the central bank taking a more cautious approach to hiking rates. Today’s FOMC minutes will give the market greater clarity on the central bank’s current thinking.

NewsLetter

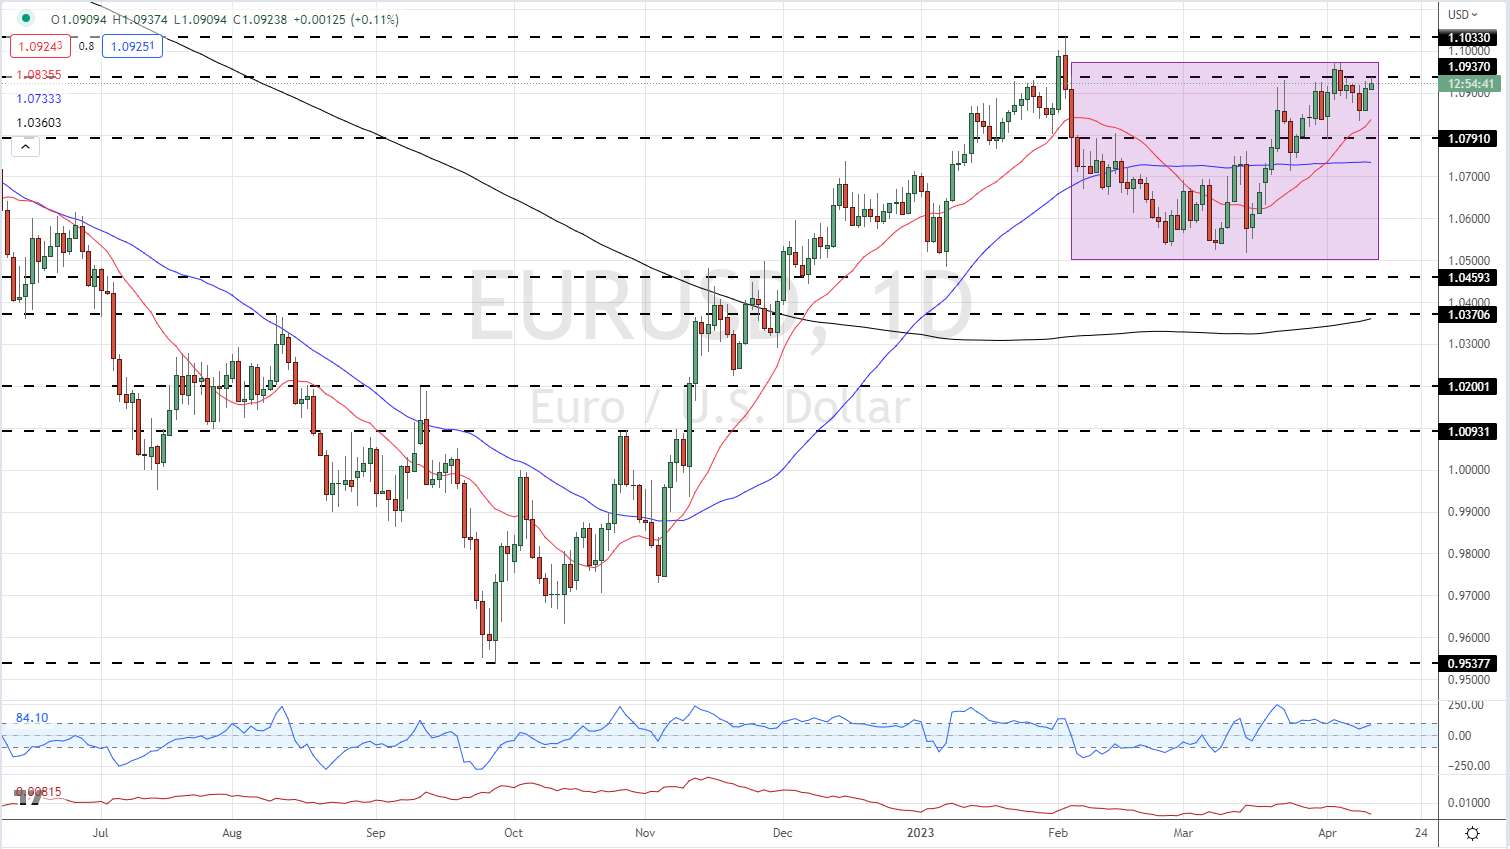
There is little in the way of Euro Area economic news today to steer the single currency and that leaves EUR/USD at the bidding of the US dollar. The pair are currently trapped in a tight range today – 1.0909/1.0937 – and little is expected to happen ahead of the US inflation release. The daily EUR/USD chart does show a few positive signals and suggests that a retest of the recent multi-month high at 1.1033 may occur unless the greenback picks up a strong bid. All three moving averages are supportive of a move higher, while a basic cup and handle continuation pattern has been formed over the past two months.

Trading with the Cup and Handle Pattern

EUR/USD Daily Price Chart – April 12, 2023

image2.png

Retail Traders Remain Short EUR/USD

Retail trader data show 38.86% of traders are net-long with the ratio of traders short to long at 1.57 to 1.The number of traders net-long is 13.46% lower than yesterday and 18.23% higher than last week, while the number of traders net-short is 20.69% higher than yesterday and 5.83% lower than last week.

We typically take a contrarian view to crowd sentiment, and the fact traders are net-short suggests EUR/USD prices may continue to rise. Positioning is more net-short than yesterday but less net-short from last week. The combination of current sentiment and recent changes gives us a further mixed EUR/USD trading bias.