Dollar Breaks But S&P 500 Can’t Overcome 200-Day Average After CPI, Bank Earnings Ahead

Dollar Breaks But S&P 500 Can’t Overcome 200-Day Average After CPI, Bank Earnings Ahead

The US consumer price index (CPI) release this past session did not disappoint in its ability to generate volatility. However, its contribution to clear trend development was certainly uneven. On the one hand, the Dollar absorbed a clear hit that would extend the productivity of its bearish slide these past months. Alternatively, the supposed benefits of weaker inflation allowing the Federal Reserve to ease off the pressure on financial markets didn’t translate into a material follow through on a multi-day advance for the S&P 500. The same fundamental scenarios promoted through this backdrop exist and the data did facilitate that particular thread of speculation, but perhaps the market priced in much of the good will ahead of time. If that is the case, we simply waiting for the next big ticket update around which the markets can cater to their enthusiasm. Otherwise, we could be reaching a point of balance where the recognition of the Fed’s cap in hawkish policy accurately reflects the potential for the underlying bullish appetite. If we realize the latter scenario, it could be a bigger fundamental shift where ‘bad news’ generates more traction.


As we continue to evaluate the market’s interpretation of key developments going forward and assessing the prioritization of underlying theme, I am keeping close tabs on evolution of views via the chart. This past session was a very volatile but ultimately unproductive day for the major US indices. The Dow Jones Industrial Average posted the best performance of the major three with a 0.6 percent gain on a much smaller daily swing. The S&P 500 on the other hand was much more volatile and registered the smallest advance with a 0.3 percent move. Notably, the volatility intraday has left us with large ‘wicks’ which reflect indecision and all while failing very clearly to overtake the 200-day simple moving average (even the fundamental purists tend to know where that level is) and the trendline resistance that stretches back to the 2021 record high. This position and a heightened state of anxiety could make a ‘speculative meal’ out of almost any meaningful event risk, but the upcoming bank earnings are particularly hearty.

Chart of the S&P 500 with Volume, 50 and 200-Day SMAs and ‘Wicks’ (Daily)

image1.png

Before moving onto the next immediate fundamental spark ahead as is often the want of a market with a very short attention span, we should consider the deeper implications to this just-released inflation report. While the 6.5 percent headline reading is certainly another big step down in the annual reading’s retreat from four-decade highs, the measure is still very high. The Federal Reserve’s target is for a steady, 2 percent level of annual inflation which will take some time until we return. In the meantime, the risk that another unexpected flare up in inflation through external forces pushes the world to embedded price growth (say uncontrolled wage growth), could create an economic situation that is extremely difficult to navigate through. The Fed and others have committed to stay the course and fend off that threat which is something the markets dispute and aren’t pricing in. It is possible of course that the central bank will be forced to abandon its plan, but that wouldn’t be owing to a softening of inflation in line with expectations. It would come from a problematic collapse in economic activity – and that is not a bullish outcome for markets.

Chart of US Headline CPI YoY, US 2-Year Treasury Yield and 2-10 Yield Spread (Daily)
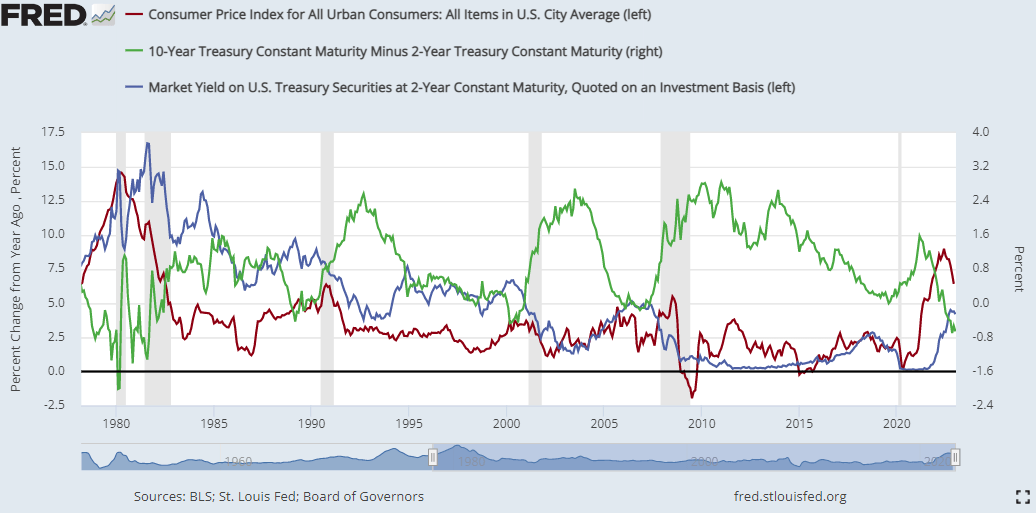
image2.png

Chart Created on St Louis Federal Reserve Economic Database

Where the S&P 500’s course is more a factor of broader sentiment trends and the market’s overall prioritization of abstract fundamental themes, the picture for the US Dollar is more immediate and nuanced on the point of relative interest rates. The Greenback mounted an enormous rally up through last year with serious help from its advanced and aggressive monetary policy regime alongside the benefit of a relative health economic forecast (while many peers were suffering larger downgrades). We have passed the period of expanding ‘premium’ behind the Dollar’s position, and the balance that is seen coming through yield and growth potential with peers has clearly deflated the currency. At a certain point, the markets will find a sense of balance in the value relative to the plateau we have reached in differentials. This past session, the US 2-Year Treasury yield dropped below its 100-day simple moving average for the first time in 375 trading days. Yet, it is still at 4.13 percent. That is higher than many of its counterparts, and the course for the US generally tends to echo the rest of the world. In other words, if the Fed is close to leveling out (and certainly if forced to cut), it is likely peers like the BOE, ECB and RBA will follow suit. That would maintain the yield differential while also bolstering the Dollar’s safe haven case. Nevertheless, we haven’t hit that threshold yet considering the DXY dropped this past session after the CPI to take out the previous high from the March 2020 ‘pandemic panic’ peak.

Chart of DXY Dollar Index with 50 and 100-Day SMAs and US 2-Year Yield (Daily)

image3.png

Heading into the final trading day of the week, I will be looking for some sense of resolution for the S&P 500 at that 200-day SMA and with the Dollar seemingly on the action side of a breakdown. There are a few high profile fundamental updates due, but I will focus on two. The University of Michigan consumer confidence survey for January comes with inflation expectations but it will more importantly cater to assessing economic potential. That said, equity markets have a tendency to place earnings above official economic figures like GDP as a reflection of foundational health. Let’s see what kind of mood this data mix can inspire.

Top Macro Economic Event Risk For Friday and Next Week
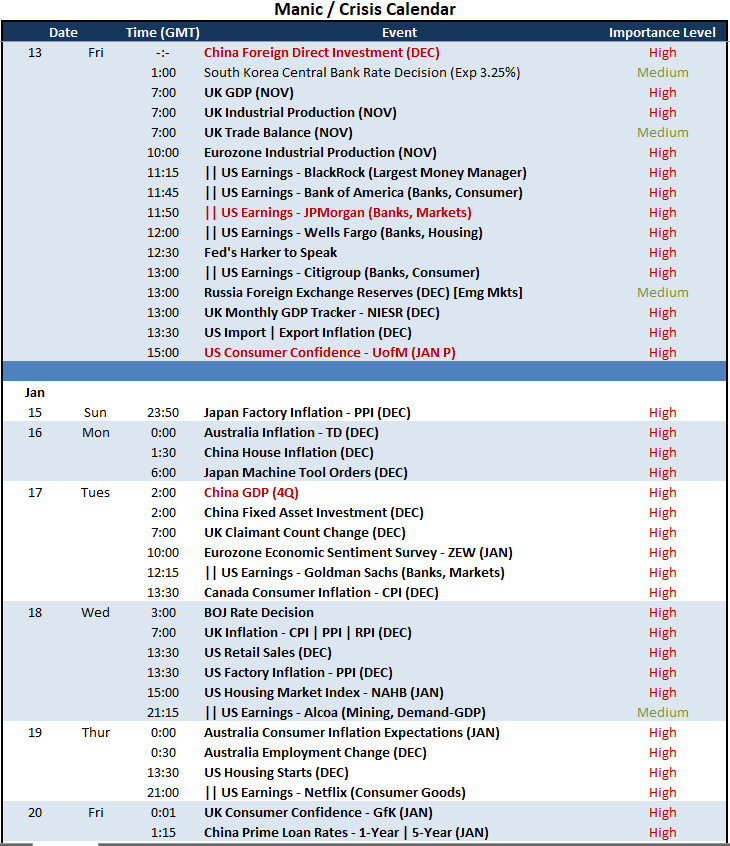
image4.png


gold

Gold Prices Break Higher After US CPI Sank US Dollar, Where to for XAU/USD?

Asia-Pacific Market Briefing – US CPI Report Boosts Gold Prices as USD Sinks

Gold prices roared higher on Thursday in the aftermath of December’s US inflation report. Headline CPI crossed the wires at 6.5 percent y/y, which was in line with expectations and down from November’s 7.1% result. There seemed to be rising expectations of a lower-than-anticipated outcome being priced in by markets. But, as expected, this was an unlikely scenario.

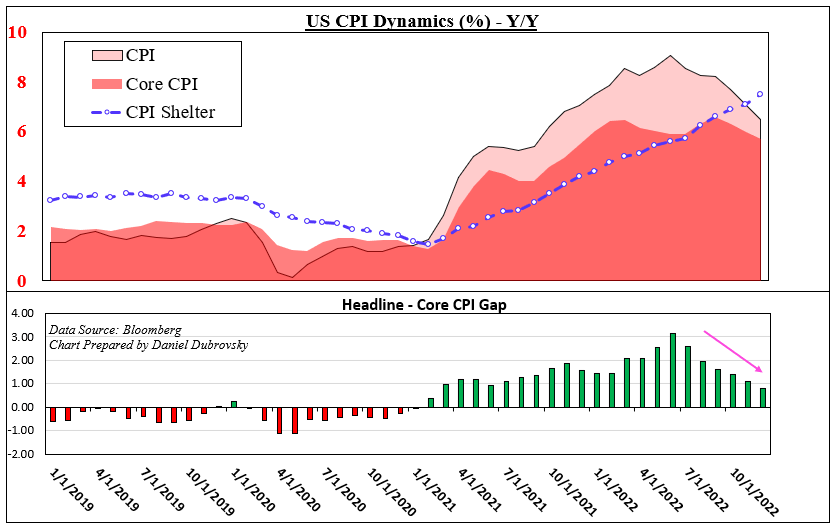
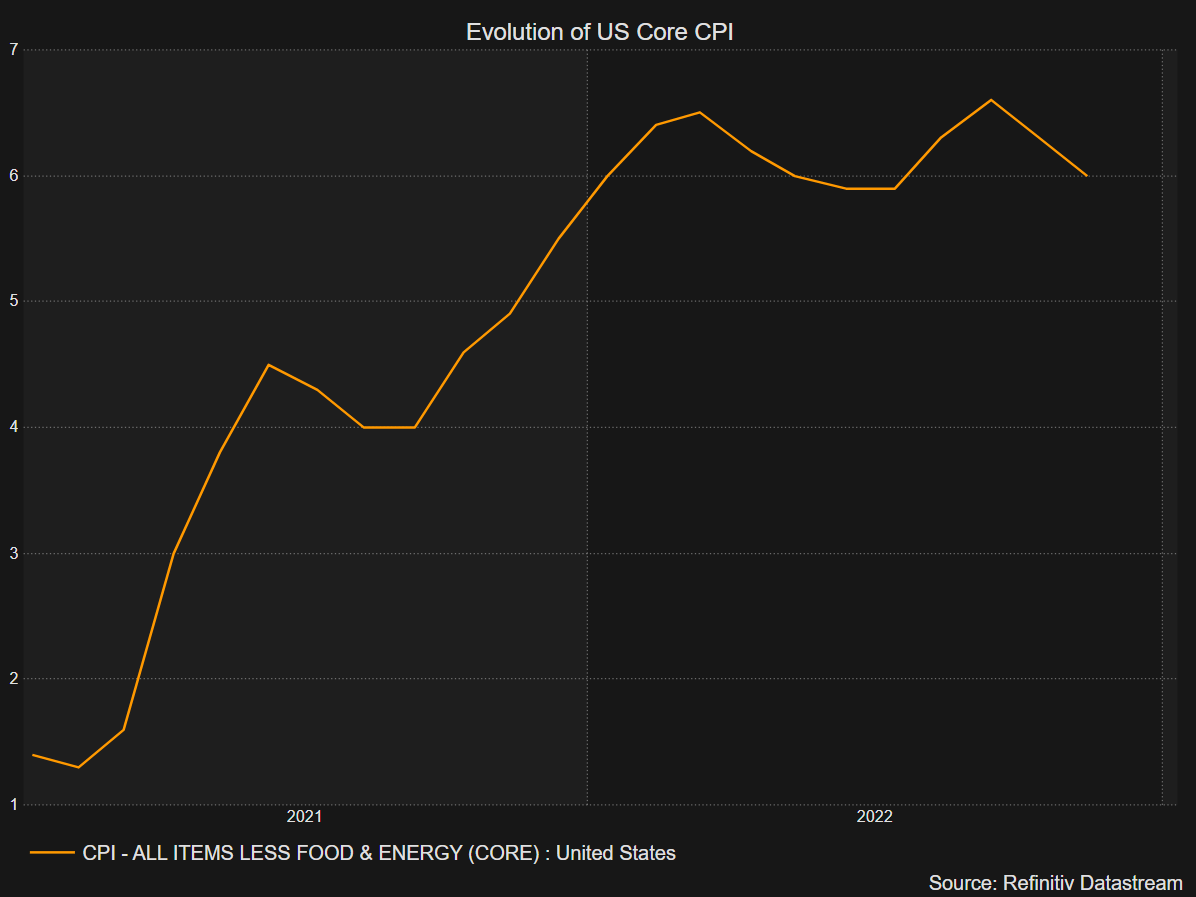
Meanwhile, the core rate clocked in at 5.7%, which was also as expected and down from 6.0% prior. Looking at the chart below, we can see that the gap between headline and core continues to shrink. At 0.8 percentage points, it is now the smallest since February 2021. Meanwhile, the shelter component clocked in at 7.5% y/y! This means housing is outperforming both headline and core CPI.

But, that is as expected due to the lag impact of housing as it slowly makes its way into official statistics. Peak shelter might occur between March and April. While energy prices continue to weaken, food has been sticky. The latter clocked in at 10.4% y/y. An ongoing egg shortage is also not helping. So, what were the key takeaways from a market perspective and precious metals?

Well, markets are slowly taking away expectations of a further 2 rate hikes over the next couple of Federal Reserve policy meetings. This meant Treasury yields turned lower and the US Dollar weakened. Anti-fiat gold thus capitalized on this dynamic and may continue doing so in the near term. Silver also aimed higher, but XAG/USD has been unable to find a meaningful upside breakout.

Looking ahead to Friday’s Asia-Pacific trading session, gold may continue pushing higher. The economic docket is fairly quiet, leaving risk appetite as the key driver. Wall Street did finish in the green on Thursday, opening the door to a rosy session for indices like the ASX 200, Nikkei 225 and Hang Seng Index. That may bode ill for the haven-linked US Dollar.

A Closer Look at Inflation

A Closer Look at Inflation

Gold Technical Analysis

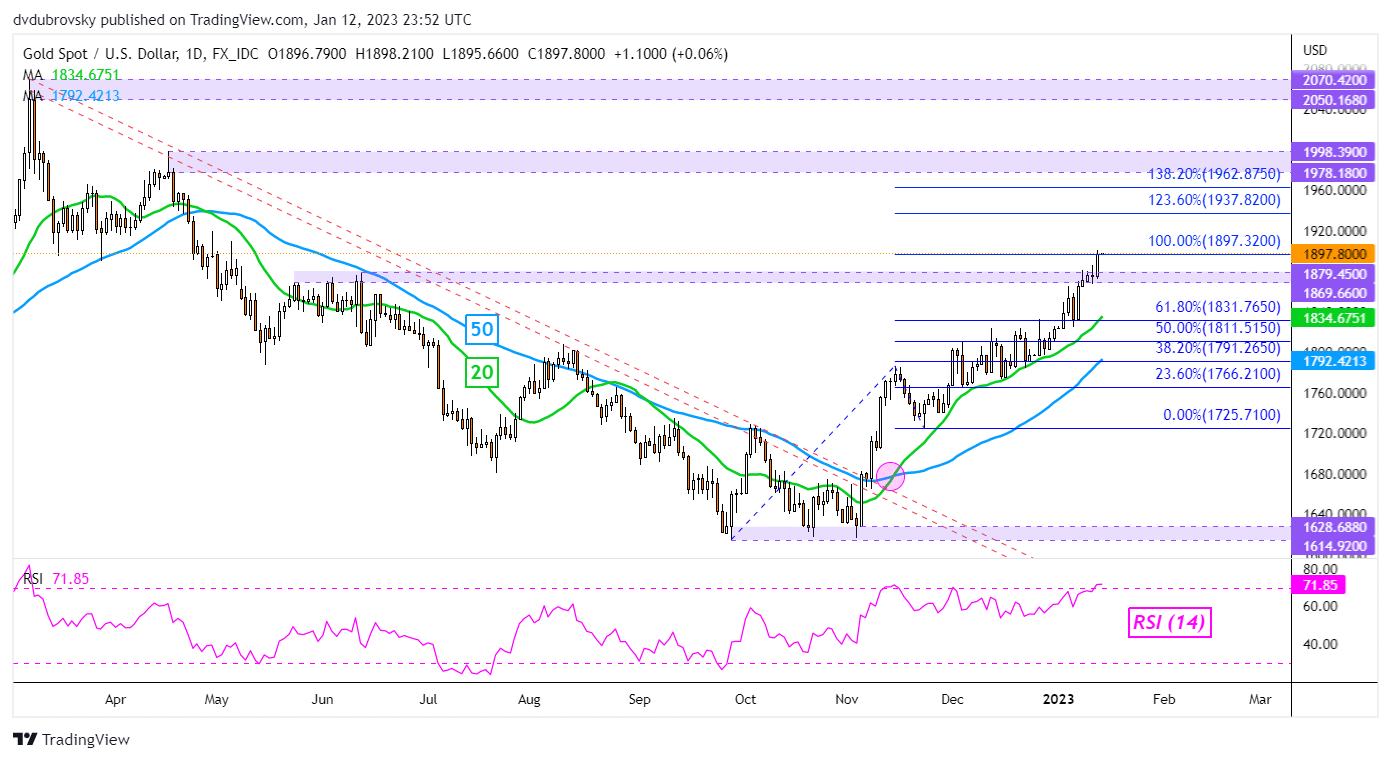
On the daily chart, gold finally broke above the 1869 – 1879 resistance zone. Prices stopped right on the 100% Fibonacci extension level at 1897. This has also exposed April highs, which make for a key zone of resistance between 1978 and 1998. Negative RSI divergence is also no longer present, showing that upside momentum is picking up. Putting all of this together, gold might be aiming higher ahead.

XAU/USD Chart

XAU/USD Chart


Learn to Take Losses Like a Winner

Learn to Take Losses Like a Winner

Nobody likes to be a loser, but taking losses well is required in order to be a winner. Just ask some of the most prolific hedge fund managers of all time. George Soros once said (I’m paraphrasing), it isn’t about being right, it’s about how much you make when you are right versus how much you lose when you are wrong.

Soros’ extremely successful disciple, Stanley Druckenmiller, once said in an interview that he estimates he is right about 60% of the time. This means he is wrong 40% of the time. Paul Tudor Jones, another billionaire macro legend, once said he is wrong about as often as he is right, but he also echoed Soros by saying that what matters the most is how much he makes on his winners when right versus how big the losses are when wrong.

That means that some of the most successful hedge fund managers in the world are wrong, a lot. And they don’t care because it is part of the game and not what really matters most. What they care about is managing the risk on their ideas and seeking asymmetry between their winning and losing ideas.

Accepting losing is of course easier said than done given it is human nature to dislike losing, so for many taking losses frequently can be a jagged pill to swallow. But you should embrace it, actually, because it is just part of the game and what will keep you in the game in the long run. Furthermore, the faster an idea hits its stop the faster you can move onto the next potential winner.

Not all losses are created equally. What should raise red flags is when you are constantly taking losses, or taking outsized losses relative to your wins. A loss could be a function of market conditions not conducive to your trading style/strategy, or it could be something deeper that implies you are not consistently following your trading rules.

When suffering a losing period (drawdown) take a close look at what you are doing. Examine your trade log, go through your journal, see if you are following your trading plan or deviating. If deviating, then you need to figure out what you need to do to get back on track. This is when losing isn’t acceptable, because it is self-inflicted.

However, if you are following your plan it could be a function of a market not conducive to your strategy, and while you should be flexible to adapting to market conditions, a solid time-proven strategy over multiple cycles should still come out ahead. The key here is to be consistent and seeing the strategy through the ups and downs.

Summary:

  • The very best in the business understand that taking losses is part of the game and don’t focus on being right all the time
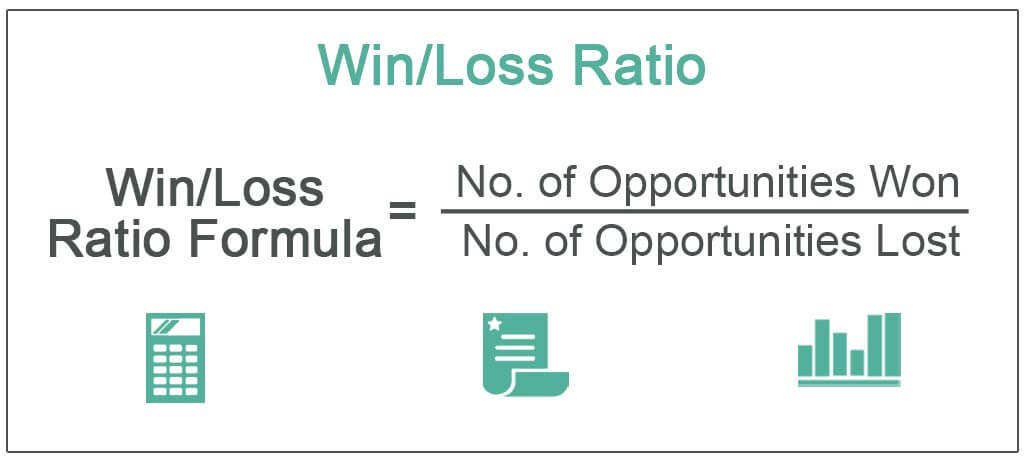
  • What matters most is managing the risk on winning ideas versus losing ideas and coming out ahead with asymmetrical win/loss ratios
  • Not all losses are created equally, though; you need to understand when losing is a function of market conditions and when it is a function of deviating away from your trading plan

Resources for Forex Traders

Whether you are a new or experienced trader, we have several resources available to help you; indicator for tracking trader sentiment, quarterly trading forecasts, analytical and educational webinars held daily, trading guides to help you improve trading performance, and one specifically for those who are new to forex.

Japanese Yen Technical Outlook: USD/JPY Nears Key Support

Japanese Yen Technical Outlook: USD/JPY Nears Key Support

USD/JPY SHORT-TERM TECHNICAL FORECAST – NEUTRAL

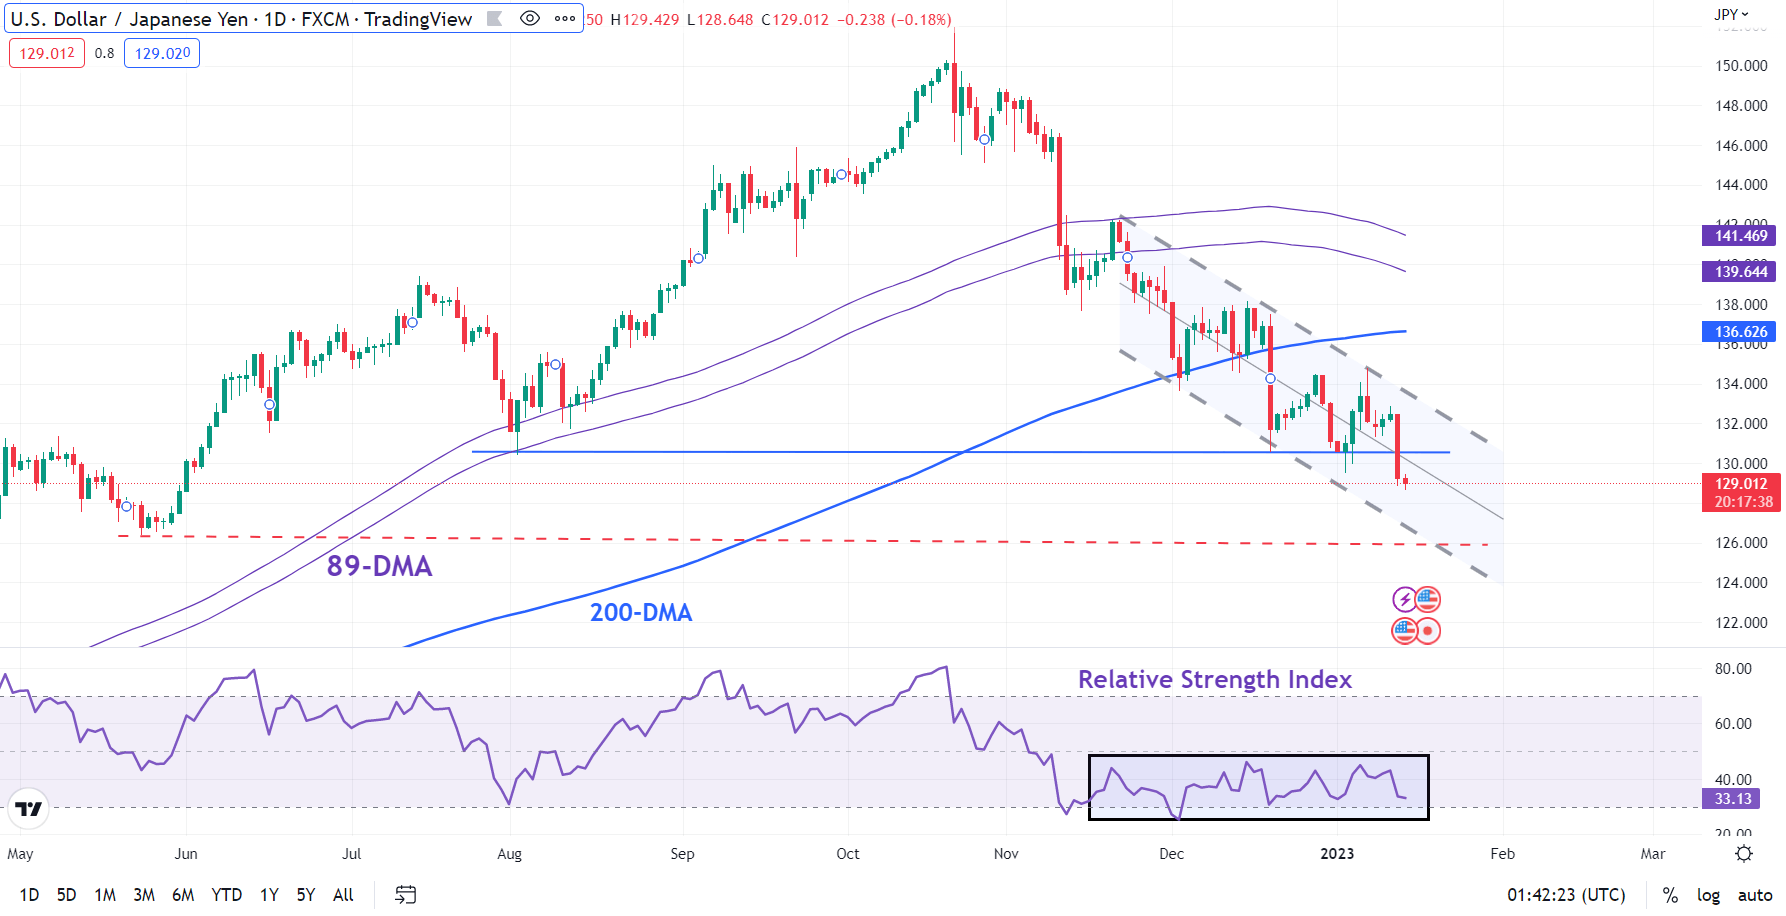
The fall to a 6-1/2-month low on Thursday confirms that downward momentum in USD/JPY remains intact for now. However, the slide appears to be losing steam as the pair approaches key support.

USD/JPY fell sharply after data showed US inflation was cooling, boosting hopes that the US Federal Reserve will be less aggressive in hiking interest rates going forward. The Japanese yen was also supported by a report that the Bank of Japan will review the side effects of its monetary easing at next week’s policy meeting and may take additional steps to correct the distortions in the yield curve.

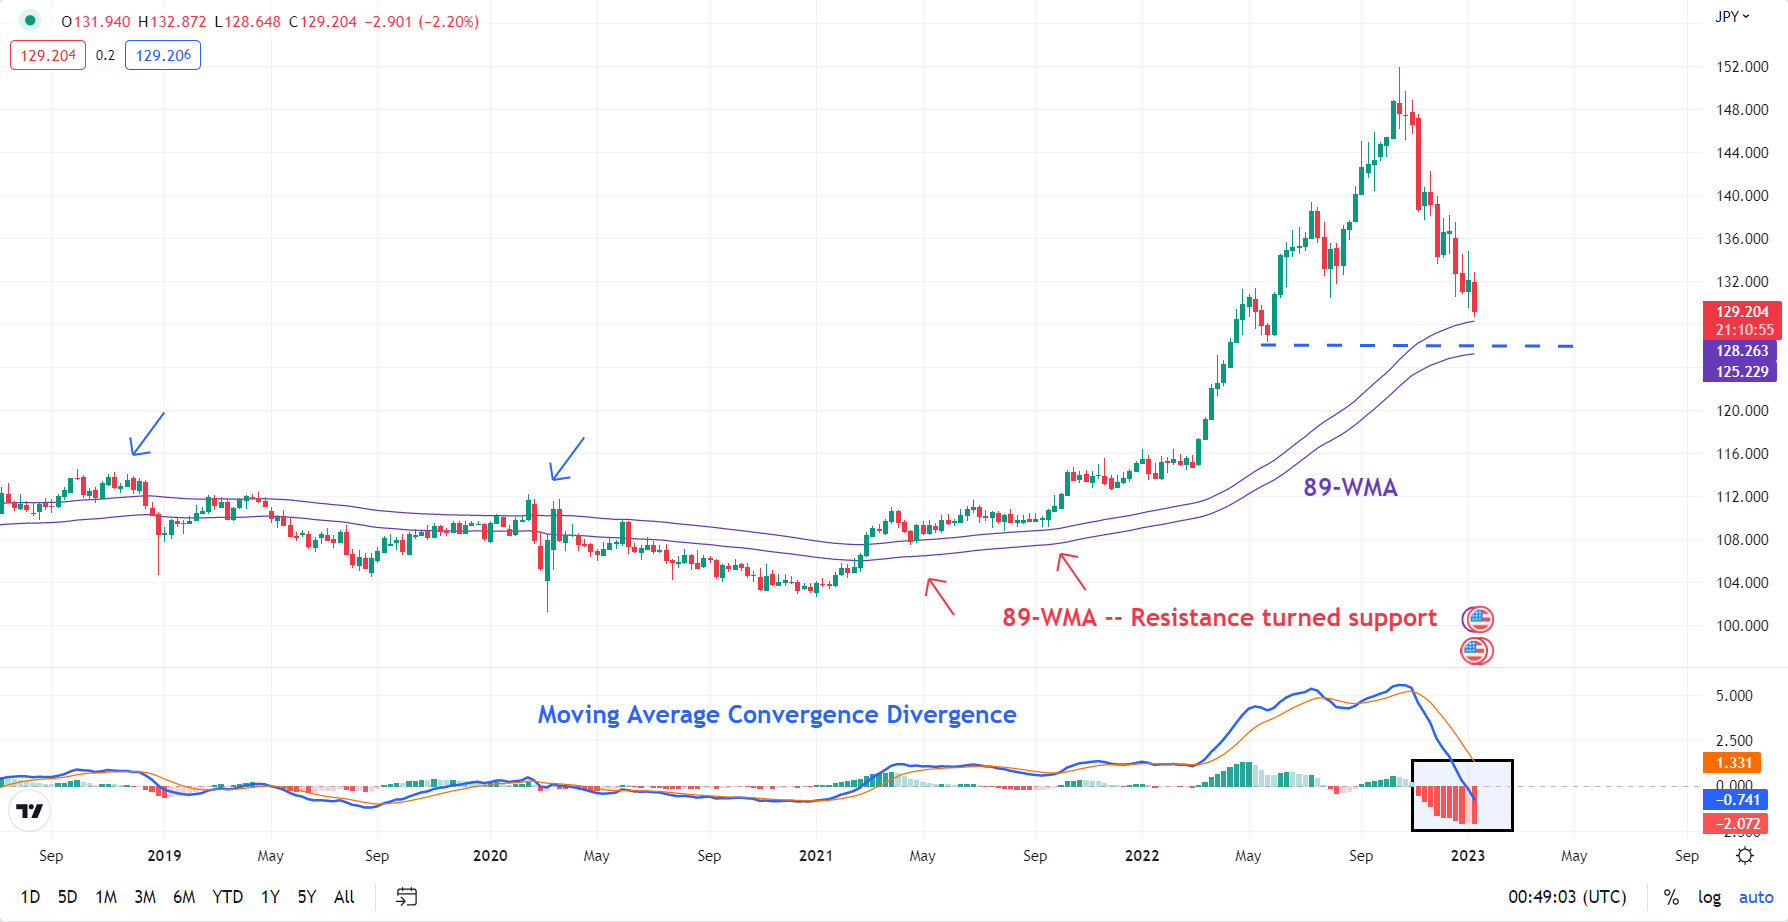
On technical charts, the fresh multi-month low registered on Thursday is a sign that the trend remains bearish for USD/JPY, which has already fallen 15% from a 32-year high of 151.95 hit in October. On higher timeframe charts, including the weekly chart, momentum continues to be down (see Weekly chart).

USD/JPY Weekly Chart

image1.png

Having said that, the losses in recent weeks have occurred on slower momentum. That is, fresh price lows haven’t been accompanied by fresh lows in momentum, suggesting that the slide is losing steam (see Daily chart). This comes as USD/JPY is approaching quite a strong support area, including, the 89-week moving average, roughly coinciding with the May 2022 low of 126.30.

USD/JPY Daily Chart

image2.png

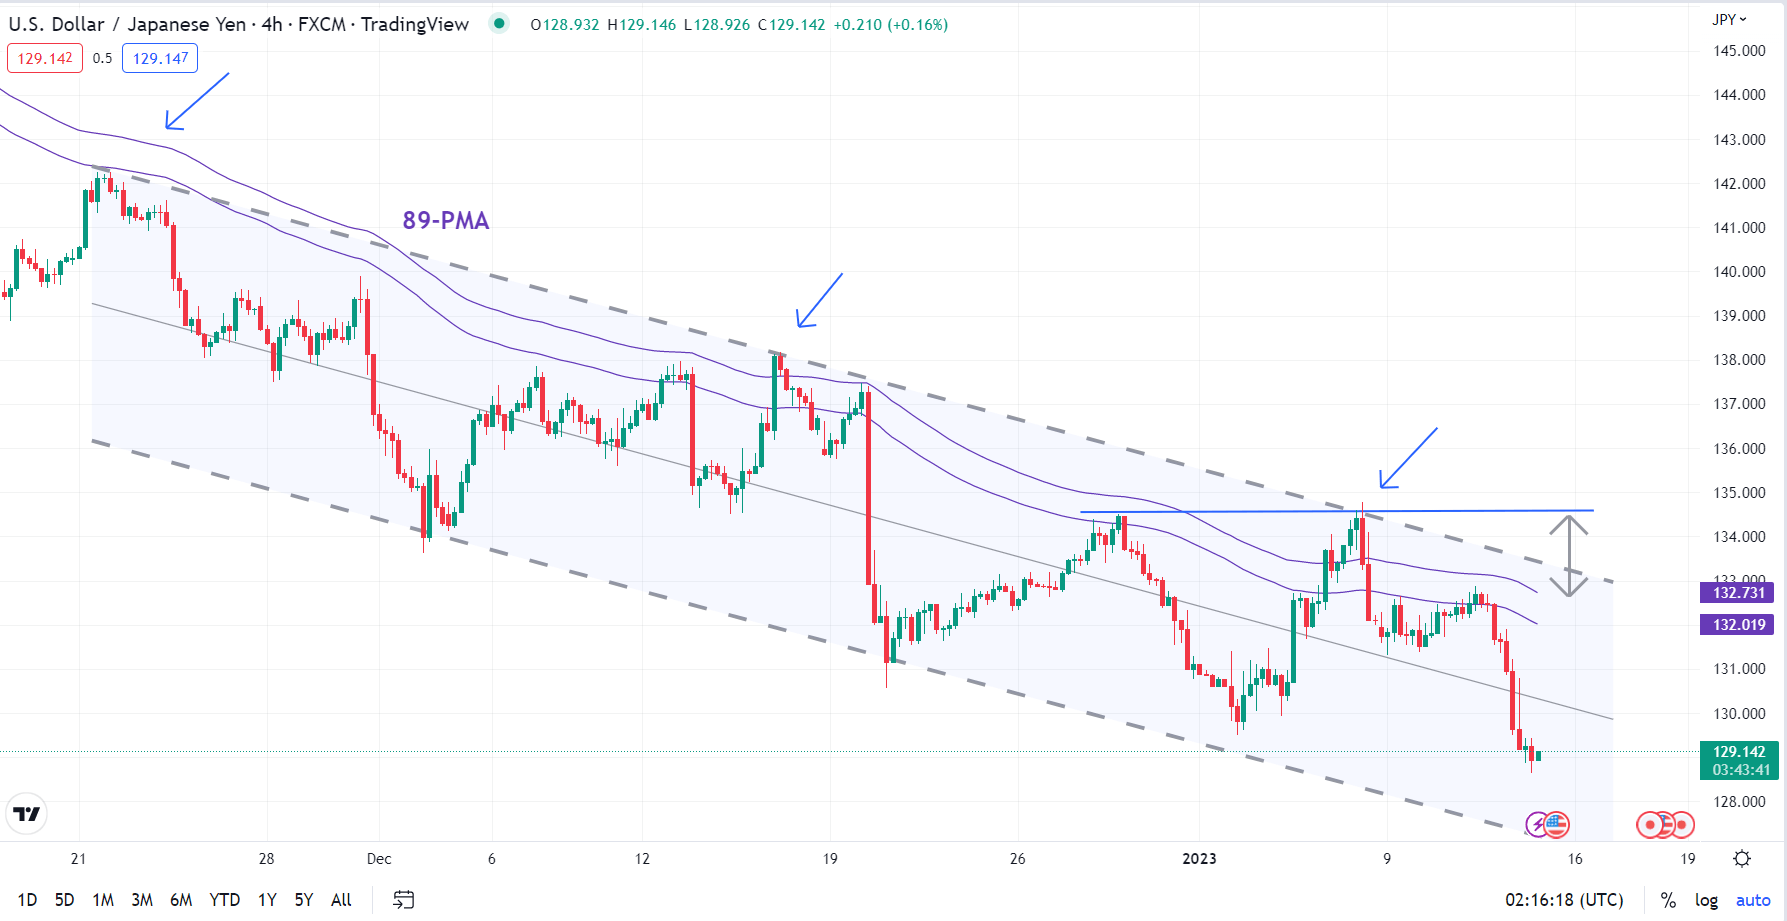
On its own, slowing downward momentum on shorter timeframe charts wouldn’t necessarily imply an imminent reversal of the downtrend, unless accompanied by the break of resistance. In this regard, the 132.80-134.80 area is of significance. This includes the 89-period moving average on the 4-hour chart (which has capped corrective rebounds in recent weeks), the upper edge of a downtrend channel since November, and last week’s high.

USD/JPY 240-minutes Chart

image3.png


Euro Continues to Surge as the US Dollar Wilts Post US CPI. Higher EUR/USD?

Euro Continues to Surge as the US Dollar Wilts Post US CPI. Higher EUR/USD?

EUR/USD charged to its highest level since April last year in the aftermath of US CPI hitting forecasts across the various measures. A headline read of 6.5% year-on-year to the end of December was a deceleration but still a long way above the Fed’s 2% target.


The US Dollar was weaker across the board in the immediate wake of the inflation data and EUR/USD had another run at the peak in Asian trading.


The data led to a perception that the Fed might not need to be as hawkish as they have previously stated. A Bloomberg survey of economists is expecting the Fed to hike the target rate by 25 basis points on the 1st of February. Future and swaps markets are now pricing 25 bp rather than hedging against a potential 50 bp lift.


Nonetheless, St. Louis Federal Reserve Bank President James Bullard reiterated his hawkish stance in comments overnight where he said that rates should get above 5% expeditiously.


The broader weakness in the greenback manifested itself intensely in USD/JPY after the Bank of Japan indicated that they will be doing a review of the effectiveness of their ultra-loose monetary policy. The market is pricing further tightening from the central bank.


An increase in risk appetite saw the commodity and growth-linked currencies find support with the Aussie Dollar and Norwegian Krone the biggest beneficiaries.


The upbeat tone was aided by China’s trade balance beating estimates at US$ 78.1 billion for the month of December. APAC equities were all higher with the exception of Japan due to concerns about the outlook for the monetary policy there.


In amongst the excitement, crude oil steadied on higher ground with the WTI futures contract above US$ 78 bbl while the Brent contract is a touch under US$ 84 bbl. Similarly, gold is near its overnight high trading just below US$ 1,900.


Coming up today, after UK industrial production numbers, the University of Michigan consumer sentiment gauge will be the focus for markets.

EUR/USD TECHNICAL ANALYSIS


EUR/USD has raced above the upper band of the 21-day Simple Moving Average (SMA) based Bollinger Band to make a high of 1.0868 today.


This might indicate the beginning of a new trend. A close back inside the band might signal a pause in bullishness or a potential reversal.


Resistance could be at the April 2022 peak and breakpoint of 1.0936 and 1.0945. On the downside, support may lie at the breakpoints of 1.0787 and 1.0777 or at the prior lows of 1.0483 and 1.0443.


image1.png


CPI Breaking News: US Headline CPI 6.5%, Core at 5.7% – In line with Estimates

CPI Breaking News: US Headline CPI 6.5%, Core at 5.7% – In line with Estimates

Food prices rose 0.3% in December while the energy index declined 4.5%, as energy and gas prices continue to drop at the pumps. The biggest contributor to the index, shelter, contributed 0.8% to the overall monthly change from November.

“The index for gasoline was by far the largest contributor to the monthly all items decrease, more than offsetting increases in shelter indexes“ – BLS

Market Response and a Case for a Fed Pause?

Positioning heading into the CPI report suggested markets expected another leg lower on the inflation front. S&P500 futures rose in anticipation while the benchmark for USD strength, the US dollar index, consolidated around the March 2020 high of 103 after a spate of heavy losses at the back of last year continuing into 2023.

For a long time now, stubbornly high US shelter data had resulted in a drag for prior inflation prints given its large weighting (32.77% of the reading) and lagging nature. More real time rent/housing data, however, points to these readings trending lower in months to come.

Towards the end of 2022, Jerome Powell highlighted US inflation ex-shelter as a better gauge of inflation.

With inflation coming down and financial conditions remaining tight, market expectations for next month’s interest rate setting meeting remain largely in favor of a 25 bps hike (77%). With core goods dropping and concerns on Wall Street about a likely recession, we may just see a change in tone form the Fed on February the 1st.

US Core CPI (Inflation Minus Volatile Food and Energy Prices)


image2.png

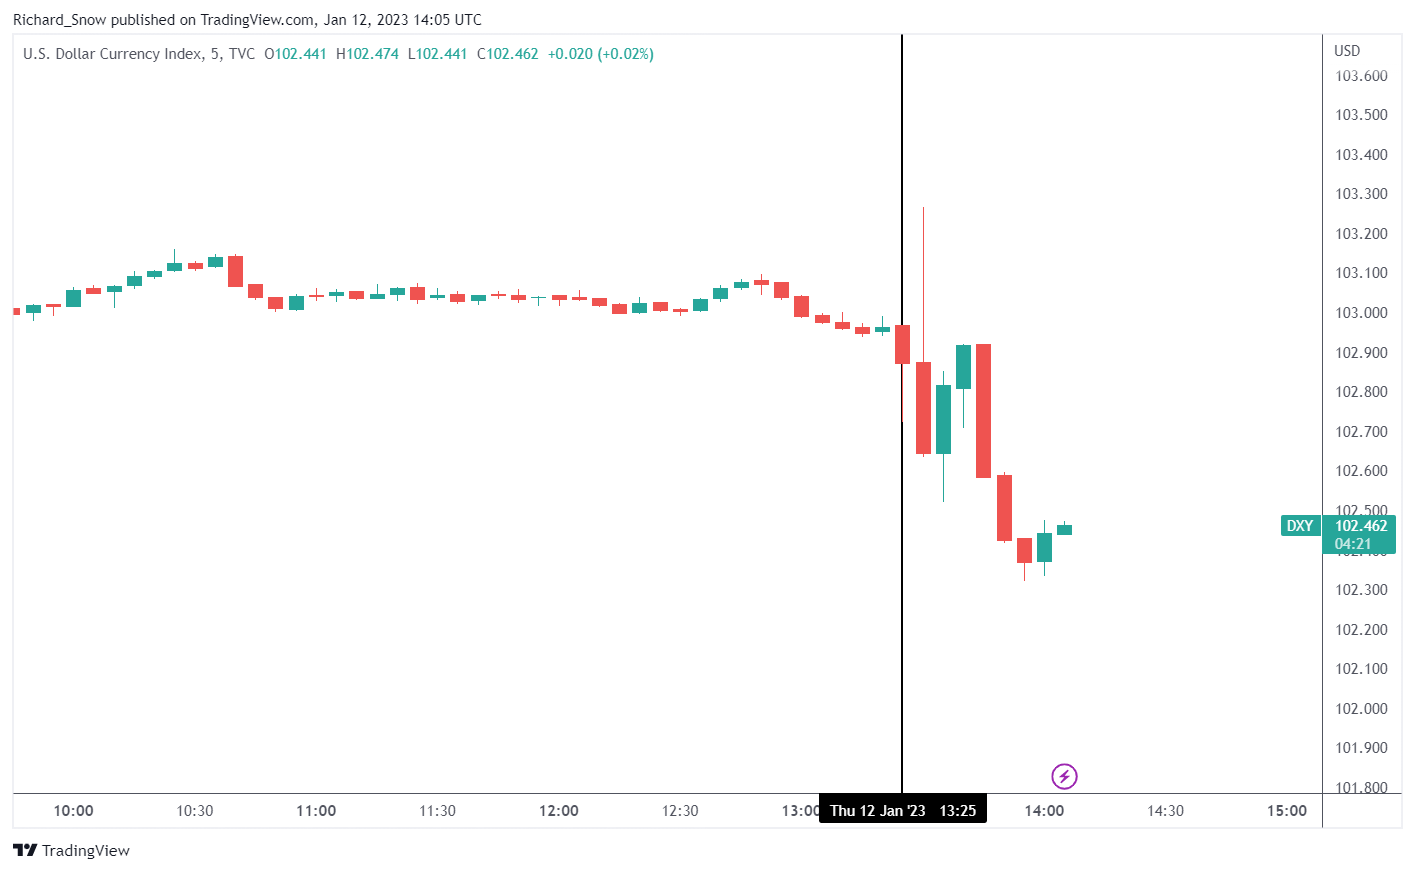
US Dollar Basket (DXY) 5 Mins Chart

The dollar witnessed an initial spike higher but proceeded to move lower in line with the recent trend of dollar selling. Higher market conviction about a Fed pause remains dollar negative in the absence of external shocks that prompt a dash for liquidity.

Source: Tradingview, prepared by Richard Snow


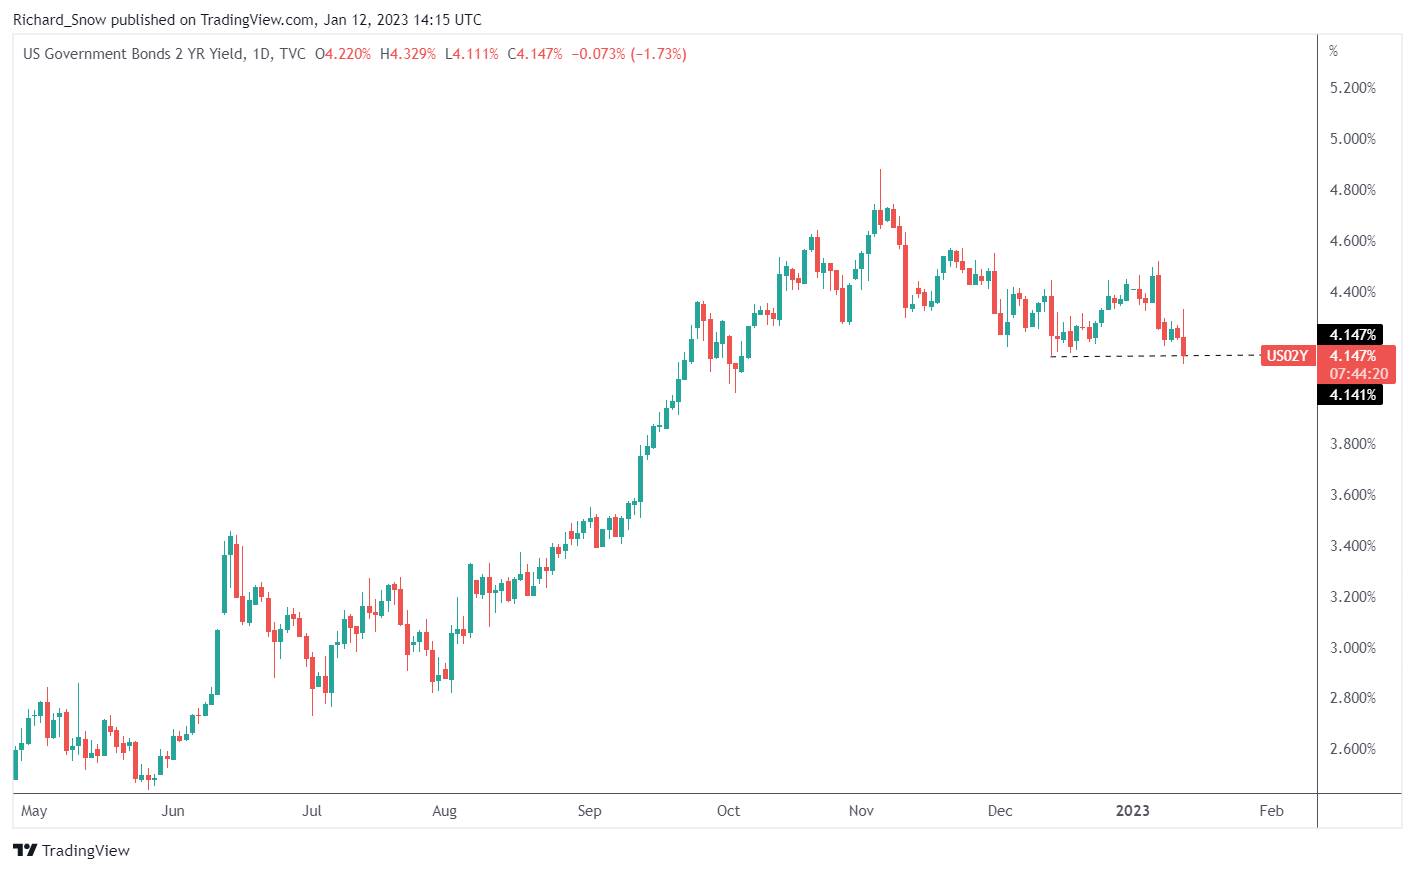
US 2 Year Yields Daily Chart

The 2 year treasury yield eased after the data. The 2 year yield most closely tracks the Fed’s medium term time frame and hence, tends to react to sudden changes in interest rate expectations. The 10 year yield trades lower too.

Source: Tradingview, prepared by Richard Snow


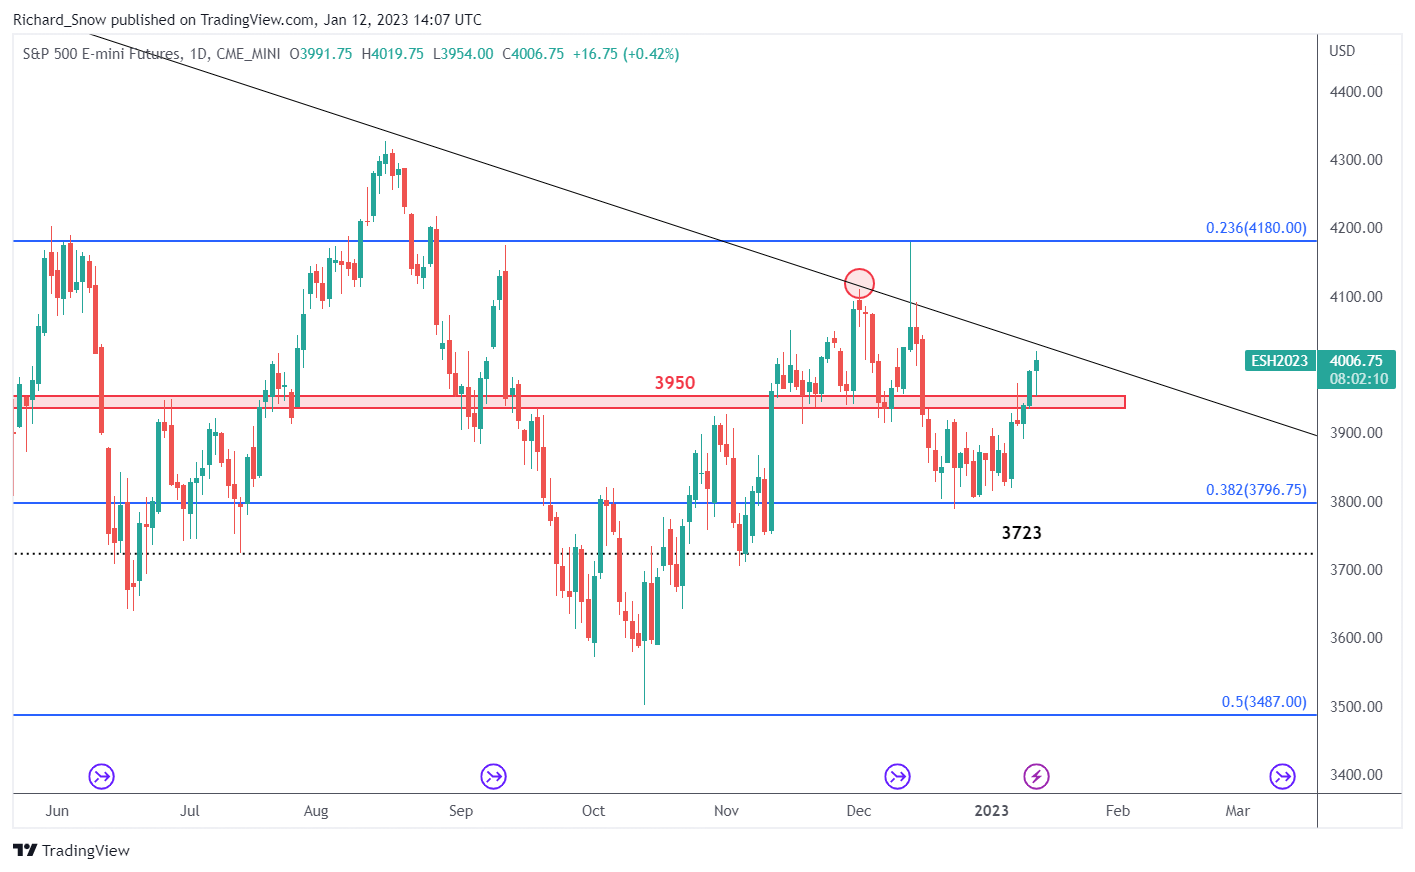
S&P500 Futures (ES1!) Daily Chart

Us equities are poised for another test of the major trendline resistance after surging past the psychologically important 4000 mark. The outlook on the index is troublesome though as recession concerns and lower expected corporate earnings are expected to roll in starting tomorrow with large US banks.

USD/CNH Technical Outlook: Trend Remains Down

USD/CNH Technical Outlook: Trend Remains Down

USD/CNH TECHNICAL FORECAST –BEARISH

Accelerating downward momentum raises the likelihood of a further fall in USD/CNH. However, deeply oversold conditions point to a short-term pause before the resumption of the downtrend.

USD/CNH, down over 8% since October, last month fell below key support on a horizontal trendline from early October that came in at 7.01, triggering a bearish head & shoulders pattern (the left shoulder at the September high, the head at the October high, and the right shoulder at the November high), pointing to a decline toward 6.65.

USD/CNH Daily Chart

USD/CNH TECHNICAL FORECAST –BEARISH

Accelerating downward momentum raises the likelihood of a further fall in USD/CNH. However, deeply oversold conditions point to a short-term pause before the resumption of the downtrend.


USD/CNH, down over 8% since October, last month fell below key support on a horizontal trendline from early October that came in at 7.01, triggering a bearish head & shoulders pattern (the left shoulder at the September high, the head at the October high, and the right shoulder at the November high), pointing to a decline toward 6.65.


USD/CNH Daily Chart


image1.png

Chart Created Using TradingView

Cracks in the USD/CNH rally became evident after the pair in November failed to clear major resistance on a slightly upward-sloping channel from 2018, slightly above the 2019 high of 7.20, first highlighted in early November. The subsequent break of key support levels confirmed that the uptrend was beginning to reverse (see previous update). Extreme low readings of the 14-day Relative Strength Index (RSI) reaffirm that the trend has turned down (see Daily chart).


USD/CNH Monthly Chart


image2.png

Chart Created Using TradingView


While the broader trend remains down, USD/CNH is looking deeply oversold, raising the chances of a short-term pause in the slide/minor rebound (see the Monthly chart). On the Weekly chart, USD/CNH is approaching quite strong support on the 89-week moving average and the 200-week moving average. Previous corrections in recent years have been truncated around the 89-week moving average, and instances, where the moving average was broken, were followed by major trend reversals.

USD/CNH Weekly Chart


image3.png

Cracks in the USD/CNH rally became evident after the pair in November failed to clear major resistance on a slightly upward-sloping channel from 2018, slightly above the 2019 high of 7.20, first highlighted in early November. The subsequent break of key support levels confirmed that the uptrend was beginning to reverse (see previous update). Extreme low readings of the 14-day Relative Strength Index (RSI) reaffirm that the trend has turned down (see Daily chart).

USD/CNH Monthly Chart

image2.png

While the broader trend remains down, USD/CNH is looking deeply oversold, raising the chances of a short-term pause in the slide/minor rebound (see the Monthly chart). On the Weekly chart, USD/CNH is approaching quite strong support on the 89-week moving average and the 200-week moving average. Previous corrections in recent years have been truncated around the 89-week moving average, and instances, where the moving average was broken, were followed by major trend reversals.

USD/CNH Weekly Chart

image3.png


Growth Versus Value Stocks: How Interest Rates Affect Valuations

Growth Versus Value Stocks: How Interest Rates Affect Valuations

When the Federal Reserve adjusts its monetary policy stance by either raising or lowering borrowing costs, the investment landscape changes, becoming more friendly or more hostile to the equity market. In this article, we will discuss how valuations and performance of value and growth stocks tend to be affected by rising and falling interest rates, but before we get to that, some context and definitions need to be established.

GROWTH STOCKS

Growth companies are often unprofitable and have speculative prospects, but investors are willing to pay a premium to own them because they have an innovative business/product that has the potential to deliver above-average returns over a long-term horizon, although there are no guarantees. They are riskier and therefore more volatile than the market in general, but their share prices usually rise faster than typical stocks because of their strong earnings growth outlook. Often, these high-flyers focus on increasing future revenue at the expense of delaying profitability, reinvesting their earnings into product research and expansion, so they do not frequently distribute capital to shareholders through dividends or buybacks.

VALUE STOCKS

Value stocks sit on the opposite spectrum. These are mature companies with a well-established business, solid balance sheets, proven history of financial performance and steadier but low growth over time. Despite their high quality and solid fundamentals, they have fallen out of favor and lost their “WOW” factor, so they trade a discount to the market and appeared undervalued based on various financial metrics such as price/earnings, price/book, cash flows, etc. Value companies typically pay dividends, offer lower volatility, and carry less risk than the market, but their share prices rarely experience explosive upward movements similar to those seen in the growth universe.

It is clear from the above introduction that different stocks have different characteristics; they are not created equal, so they will be affected by changes in monetary policy in dissimilar ways, but to try to gauge the possible impact, it is first necessary to understand a little about valuations. Very simplistically, the value of a company can be thought of as the present value of expected earnings.

By buying Apple’s shares, for example, a long-term investor has acquired an ownership claim in the company’s profits over time. To assign an intrinsic value to the perpetual cash flows associated with the business’ operations, analysts first forecast earnings growth and then discount the sum of the projected income stream to today’s dollars using a discount rate, usually a risk-free rate such as the 10-year U.S. Treasury yield. This is where interest rates play a huge role in equity investing.

CONCLUSIONS

The tables above show that higher discount rates produce lower equity values, but the effects vary across investment styles. In general, however, growth companies will be more sensitive to rising interest rates because of the nature and path of their cash flows: little in their early stages, large later in their life cycle.

Going back to the two hypothetical examples, growth company ZZZ lost 21.3% of its value when the discount rate used went from 0.25% to 3.0%. In real life, the less attractive valuation will likely coincide with a steep drop in the company’s stock price. Company XYZ was also affected by the change in the rate environment, but its present worth only fell by 14.3%, suggesting that companies with value characteristics may fare better when monetary policy becomes more restrictive.

Focusing on real life examples, the charts below are composed of two panels. The upper panel shows the ratio between IWD (iShares Russell 1000 Value) and IWF (iShares Russell 1000 Growth), and the lower panel displays the U.S. 10-year yield by itself.

Chart 1 is from January 2020 to May 2020. During this period, when the 10-year yield dropped from about 1.89% to 0.66%, the IWD/IWF ratio declined roughly 19%, pointing to strong growth outperformance.

CHART 1 – IWD/IWF RATIO VS US 10-YEAR YIELD (JANUARY 2020-MAY 2020)

IWD/IWF ratio

CHART 2 – IWD/IWF RATIO VS US 10-YEAR YIELD (JANUARY 2022-MAY 2022)

IWD IWF ratio versus 10 year yield

US Dollar (DXY) Treading Water as US CPI Data Nears, Volatility Subdued for Now

US Dollar (DXY) Treading Water as US CPI Data Nears, Volatility Subdued for Now

A range of financial markets remain risk-on ahead of the latest US inflation report which is expected to show price pressures turning further lower. This bullish market outlook remains at odds with the Federal Reserve’s ongoing rhetoric that rates will need to stay higher for longer to quell runaway inflation. While the US central bank sees the terminal Fed Funds rate around 5.1%, suggesting at least another 75 basis points of rate hikes, the market is pricing in 50 basis points of future hikes (2x25bps) before the Fed stops tightening monetary policy. The recent US dollar weakness suggests that the markets are not only questioning the Fed’s outlook, but they are also starting to ignore it. According to the latest CME FedWatch Tool, there is currently a 79% probability of a 25bp rate hike at the next FOMC meeting.

The risk going into today’s data release is that markets have become overly optimistic that inflation will fall by more than expected. Any disappointment today will leave a range of risk markets vulnerable to a sharp move lower, while inline numbers will leave further upside limited.


image1.png

For all market-moving data releases and economic events see the real-time DailyFX Calendar.

While the short-term risk of a USD rebound is in play, the longer-term technical outlook for the greenback remains pointed to the downside. The US dollar index (DXY) is just a handful of pips above making a fresh multi-month low, while the current price is now below all three moving averages, a bearish technical backdrop. Add into the mix the recent 50-day/200-day ‘death cross’, and little technical support ahead of the May 30 swing-low at 100.96, and the longer-term US dollar outlook remains bearish.


US Dollar (DXY) Daily Price Chart – January 12, 2023


image2.png

Chart via TradingView

Bitcoin Technical Outlook: Still Looking For The Bullish Break

Bitcoin Technical Outlook: Still Looking For The Bullish Break

BITCOIN SHORT-TERM TECHNICAL OUTLOOK – NEUTRAL

After lackluster trading over the past few weeks, Bitcoin appears to be gaining some traction. However, it would be too soon to conclude that the tide has changed for cryptocurrencies.

BTC/USD has traded within a narrow range since mid-December, holding around crucial support at the December 7 low of 16690, highlighted in the previous update. The hold above the support keeps alive the view of a broader base-building in cryptocurrencies, that is, scenario 1 pointed out in mid-November. Having said that, the hold above a support area wouldn’t necessarily imply bullishness. That’s because BTC/USD has seen similar bouts of strength in recent months which weren’t sustained.

image1.png

In particular, the 89-day moving average has been a significant barrier since mid-2022, coinciding with another ceiling at the mid-December high of 18370. Until the barrier is cleared, the path of least resistance remains sideways to down for BTC/USD. A decisive break above could pave the way initially toward the 200-day moving average, potentially toward the 5 November high of 21470.

BTC/USD Weekly Chart

Chart Created Using TradingView

On the downside, 16200-16700 continues to be a strong cushion. Any break below would confirm that the upward pressure had faded, raising the odds of a broad range of 15500-18500 developing in the interim. Furthermore, a decisive break below the November low of 15480 could pave the way toward the 2019 high of 13895.