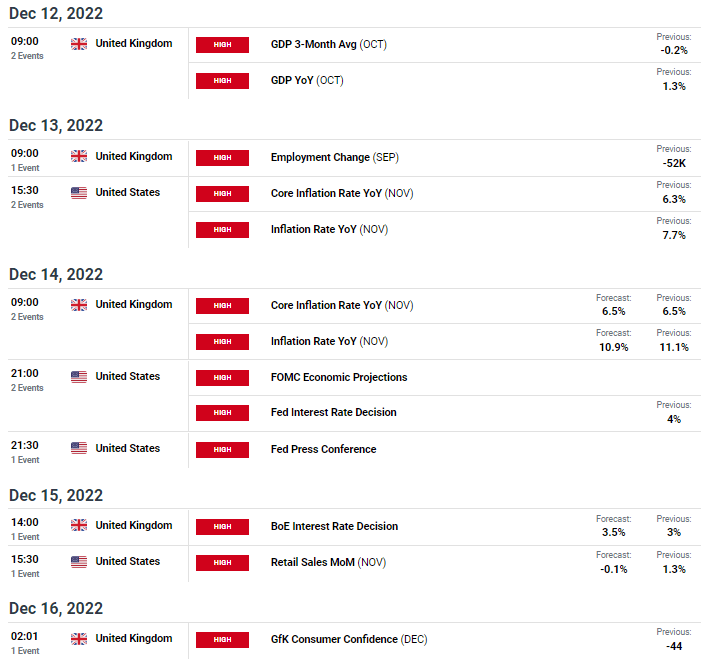
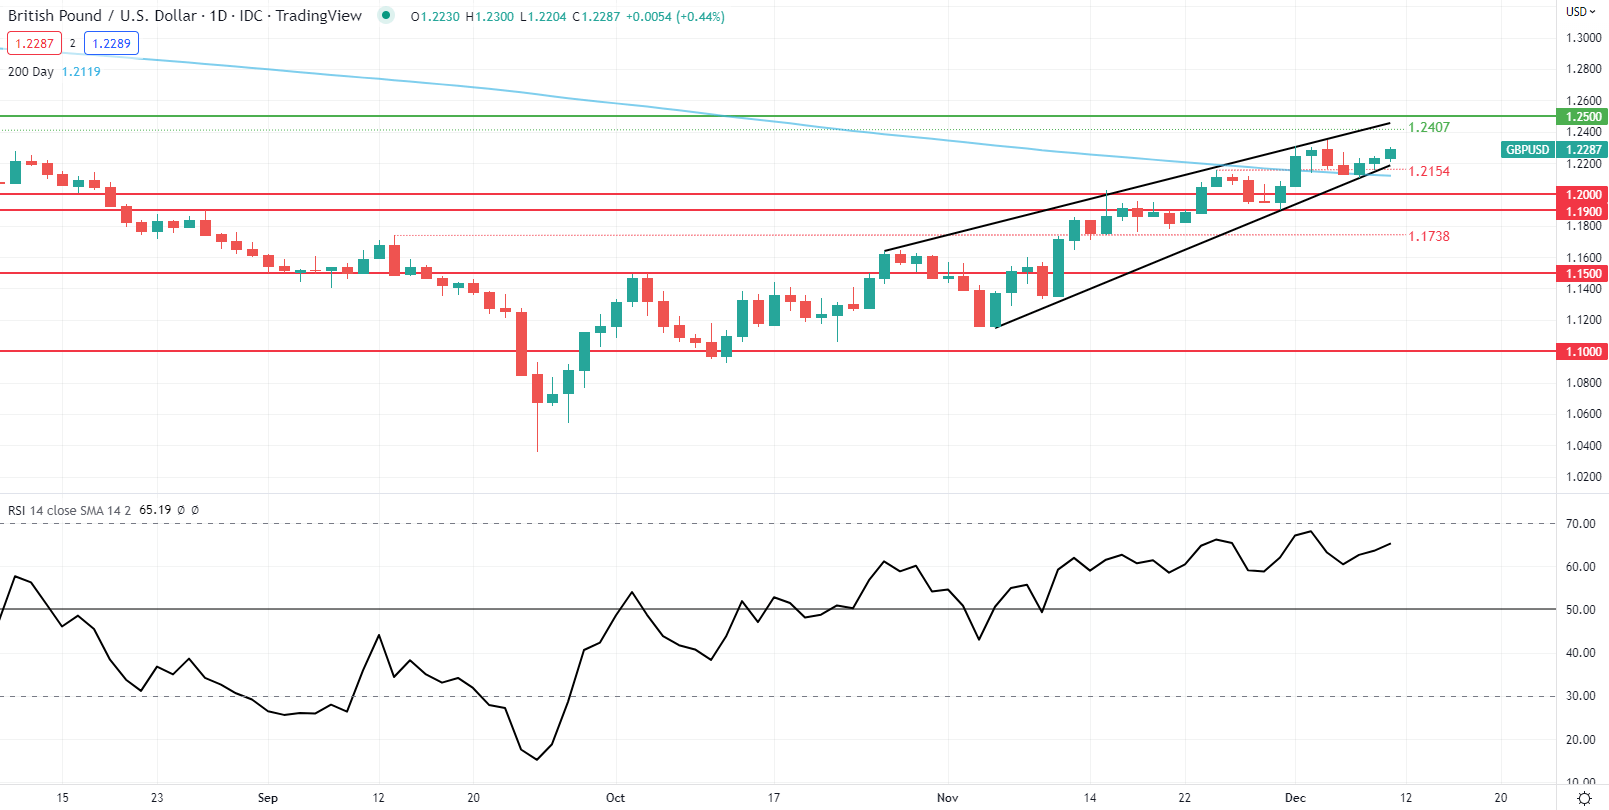
The British pound heads into a central bank fueled week relatively stout after the USD failed to capitalize on better than expected economic data (PPI and Michigan consumer sentiment) last Friday. This comes after robust labor data (NFP) and strong ISM services PMI data. It seems as if markets are holding off on this data in preparation for the plethora of data points scheduled next week – see economic calendar below. While there is much in the way of UK centric data, the U.S. core inflation read and Federal Reserveinterest rate decision will likely be the focal point for global markets. The Fed has been divided by the aforementioned positive data and contrasting softer inflation without the guidance from Fed officials during this FOMC blackout period.
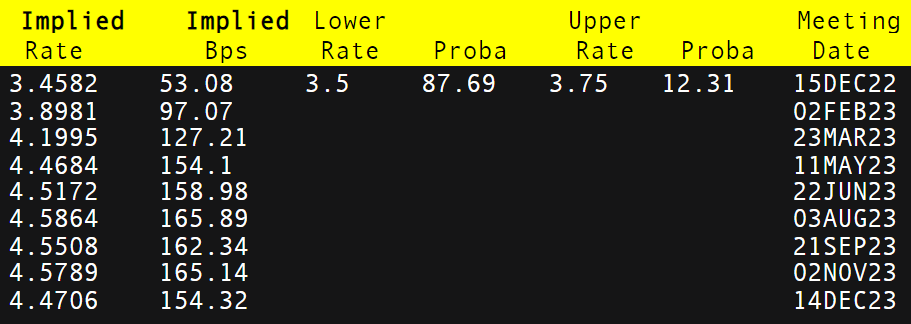
From a UK perspective, housing prices have been exhibiting a decline due to tightening monetary policy and with fiscal policy in line with the Bank of England (BoE), next week’s rate decision is likely to remain at the 50bps mark. Currently, money markets are in agreement with this conjecture with an almost 88% probability (refer to table below). The same is true for the Fed which leaves little in the way of a surprising announcement by either central bank. The Fed press conference will be take center stage with markets awaiting Fed Chair Jerome Powell’s statement. His prior statement mentioned moderating future rate hikes and was naturally taken in a dovish manner. The U.S. core inflation read could change this rhetoric should it beat estimates, highlighting inflationary pressures in the region and the need for tight monetary policies.
Gold Trades Cautiously While Silver Bulls March On
Gold and silver have been trading higher over recent weeks as the US Dollar surrenders a portion of its recent gains.
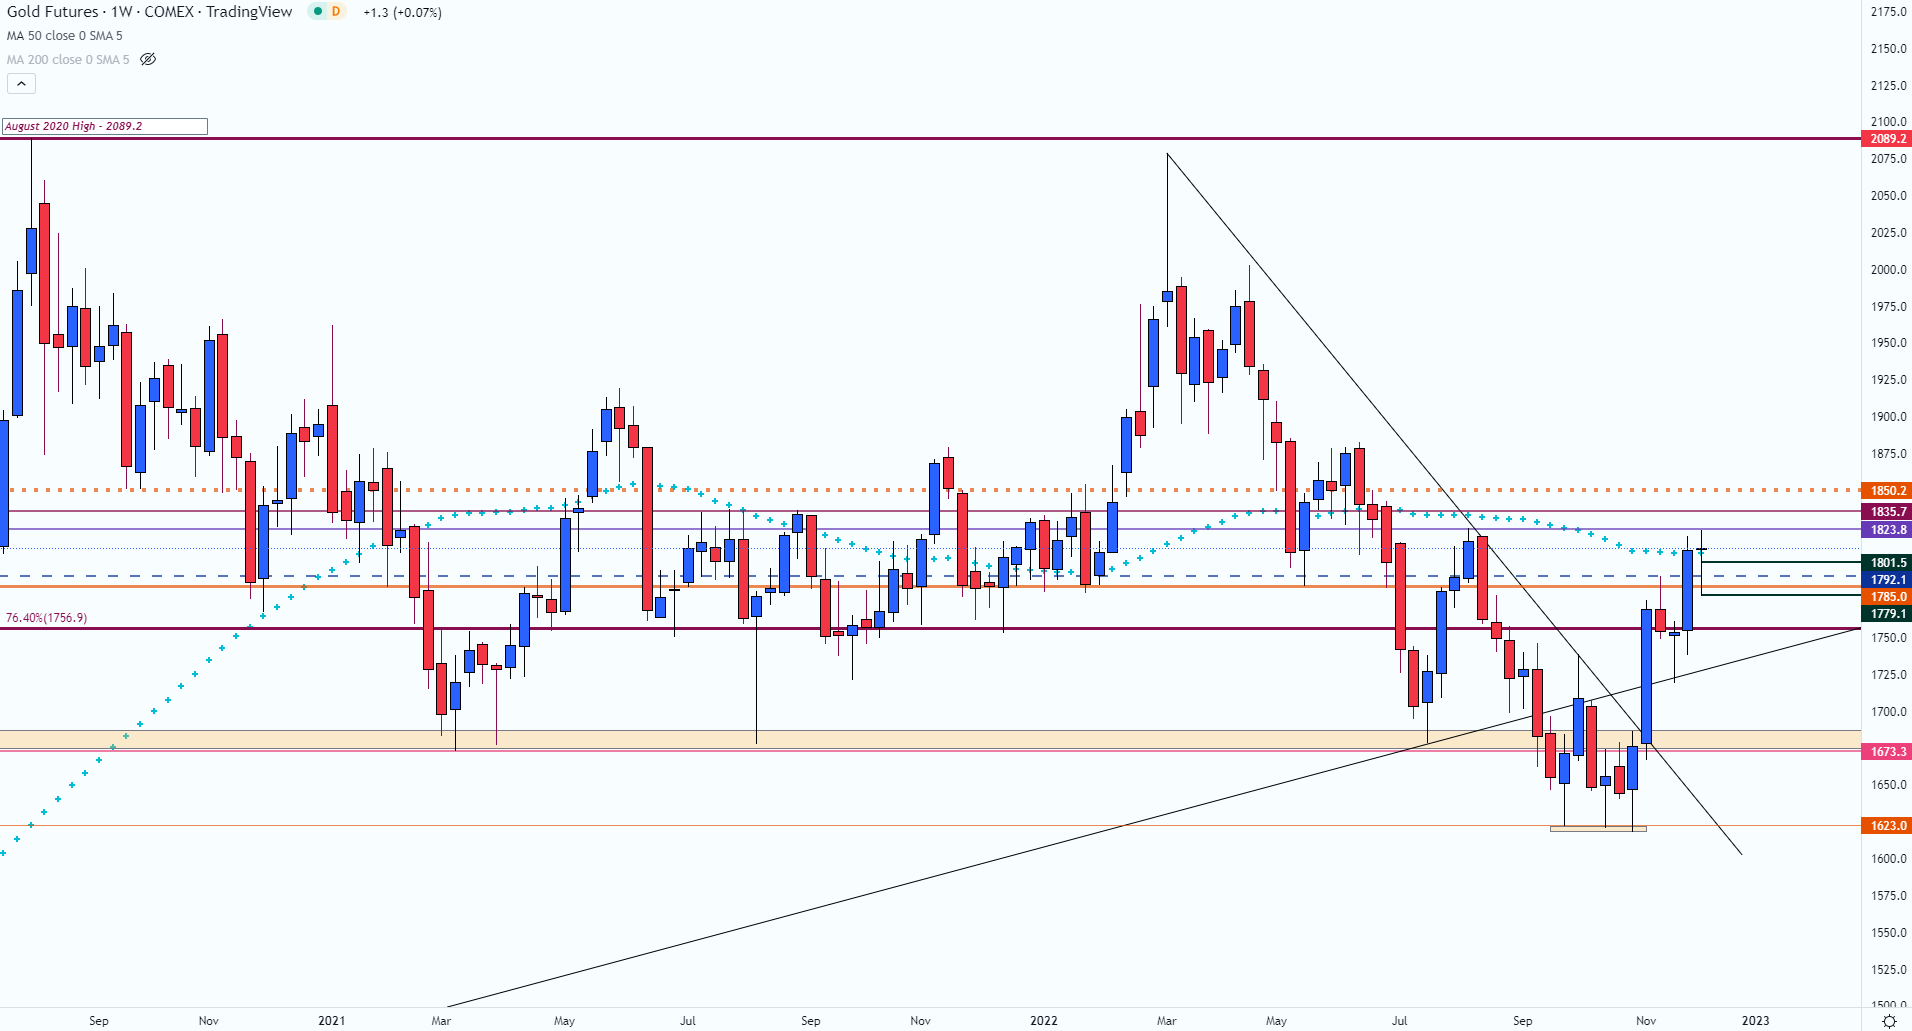
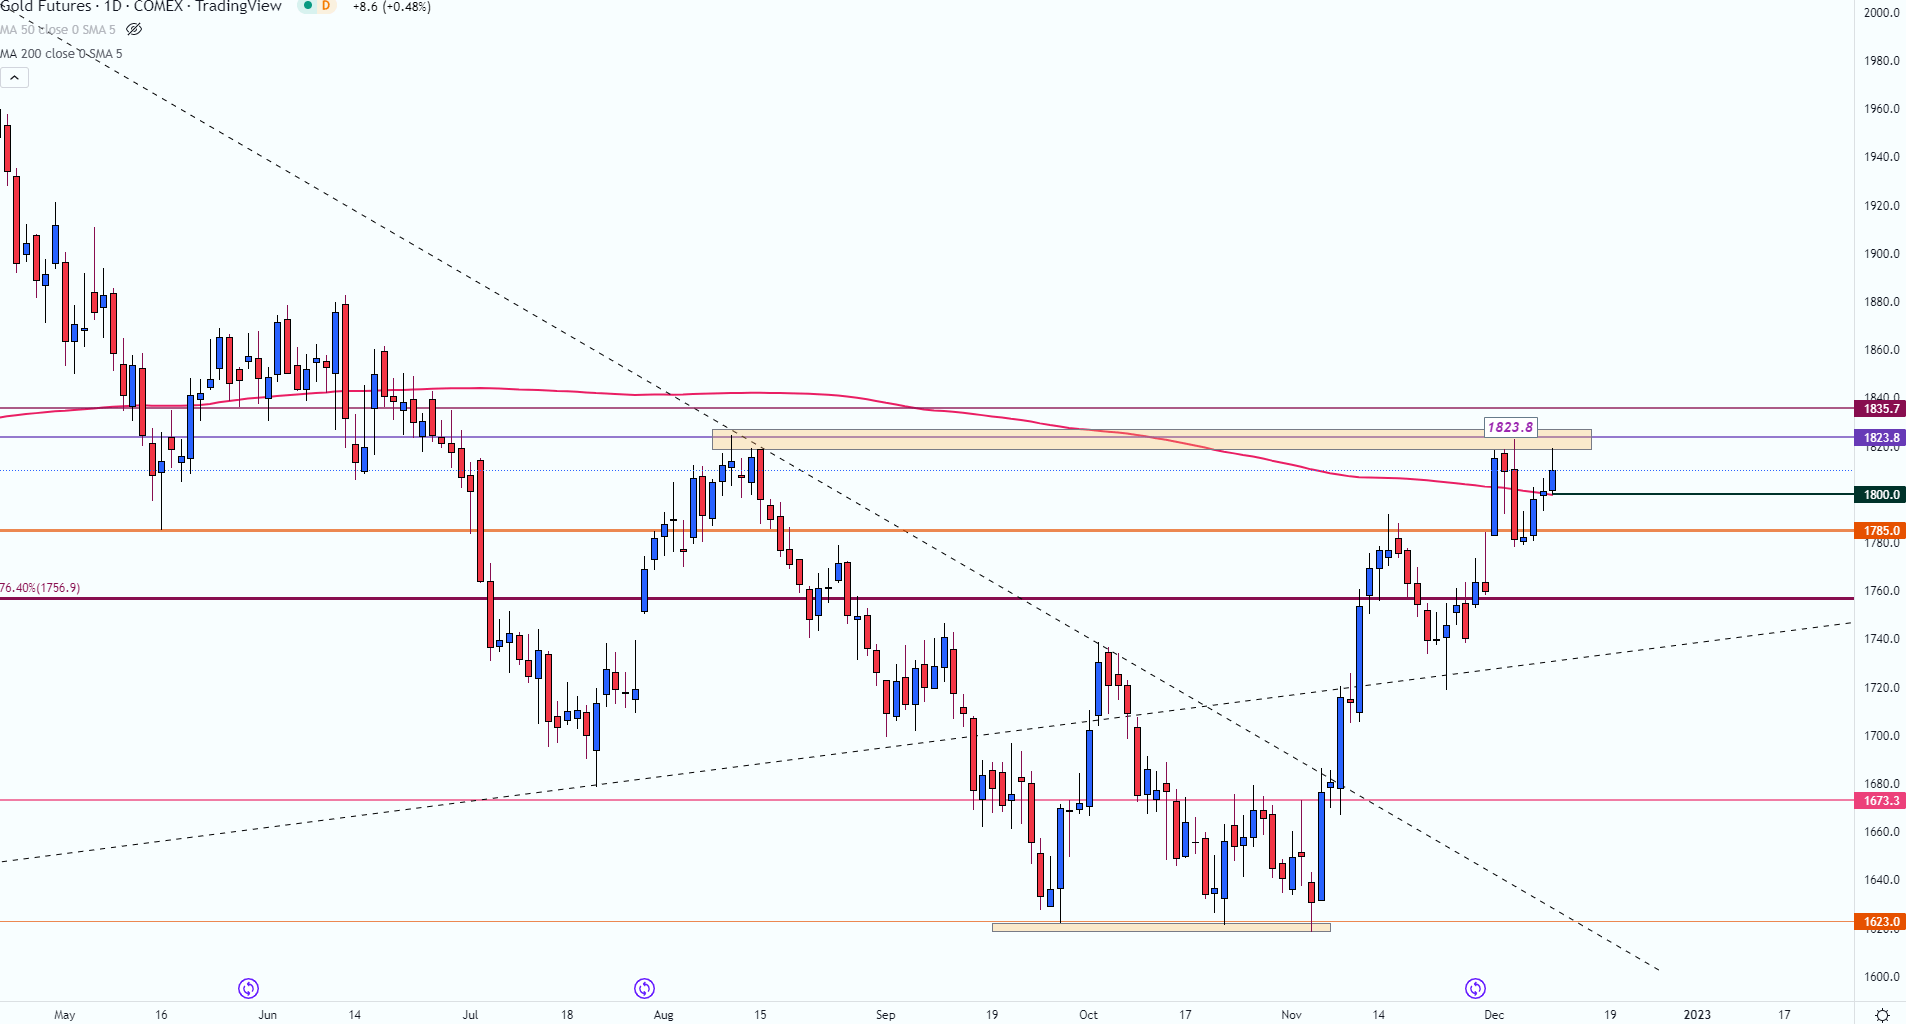
With XAU/USD currently trading above the key psychological level of 1800, this week’s price action remained subdued. As fundamental intensity eased and technical levels took centerstage, gold prices failed to gain traction, ending the week flat.
While the formation of a doji candle on the weekly chart forms around the 50-week MA (moving average) at 1807, next week’s event risk could drive the short-term move.
After rising to a high of 2078.8 in March, the Federal Reserve announced its first 75 basis point rate hike, supporting Dollar strength. With the hawkish narrative triggering a seven-month decline, XAU/USD fell into a tight zone of support between 1623 – 1618.
As this range helped cap the September – November lows, a rejection of the candlewicks highlights the importance of this zone. However, with the resurgence of bullish momentum driving price action above prior trendline resistance, prices continued to climb before peaking at 1823.8.
XAU/USD Daily Chart
With body of the daily candle resting above 1800, this level coincides with the 200-day MA (moving average). As investors prepare for another FOMC, BoE (Bank of England) and ECB (European Central Bank) rate decision, inflation and sentiment data could fuel a move in either direction.
If recession fears ease and the Dollar gains ground, XAU/USD could fall below 1800 while the weekly low provides additional support around 1780. An increase in bearish momentum below this level could pave the way for a retest of 1760 and a move towards trendline support around 1720.
GoldMixed
Data provided by
Change in
Longs
Shorts
OI
Daily
-7%
4%
-4%
Weekly
3%
2%
3%
What does it mean for price action?
Get My Guide Silver (XAG/USD) Technical Analysis
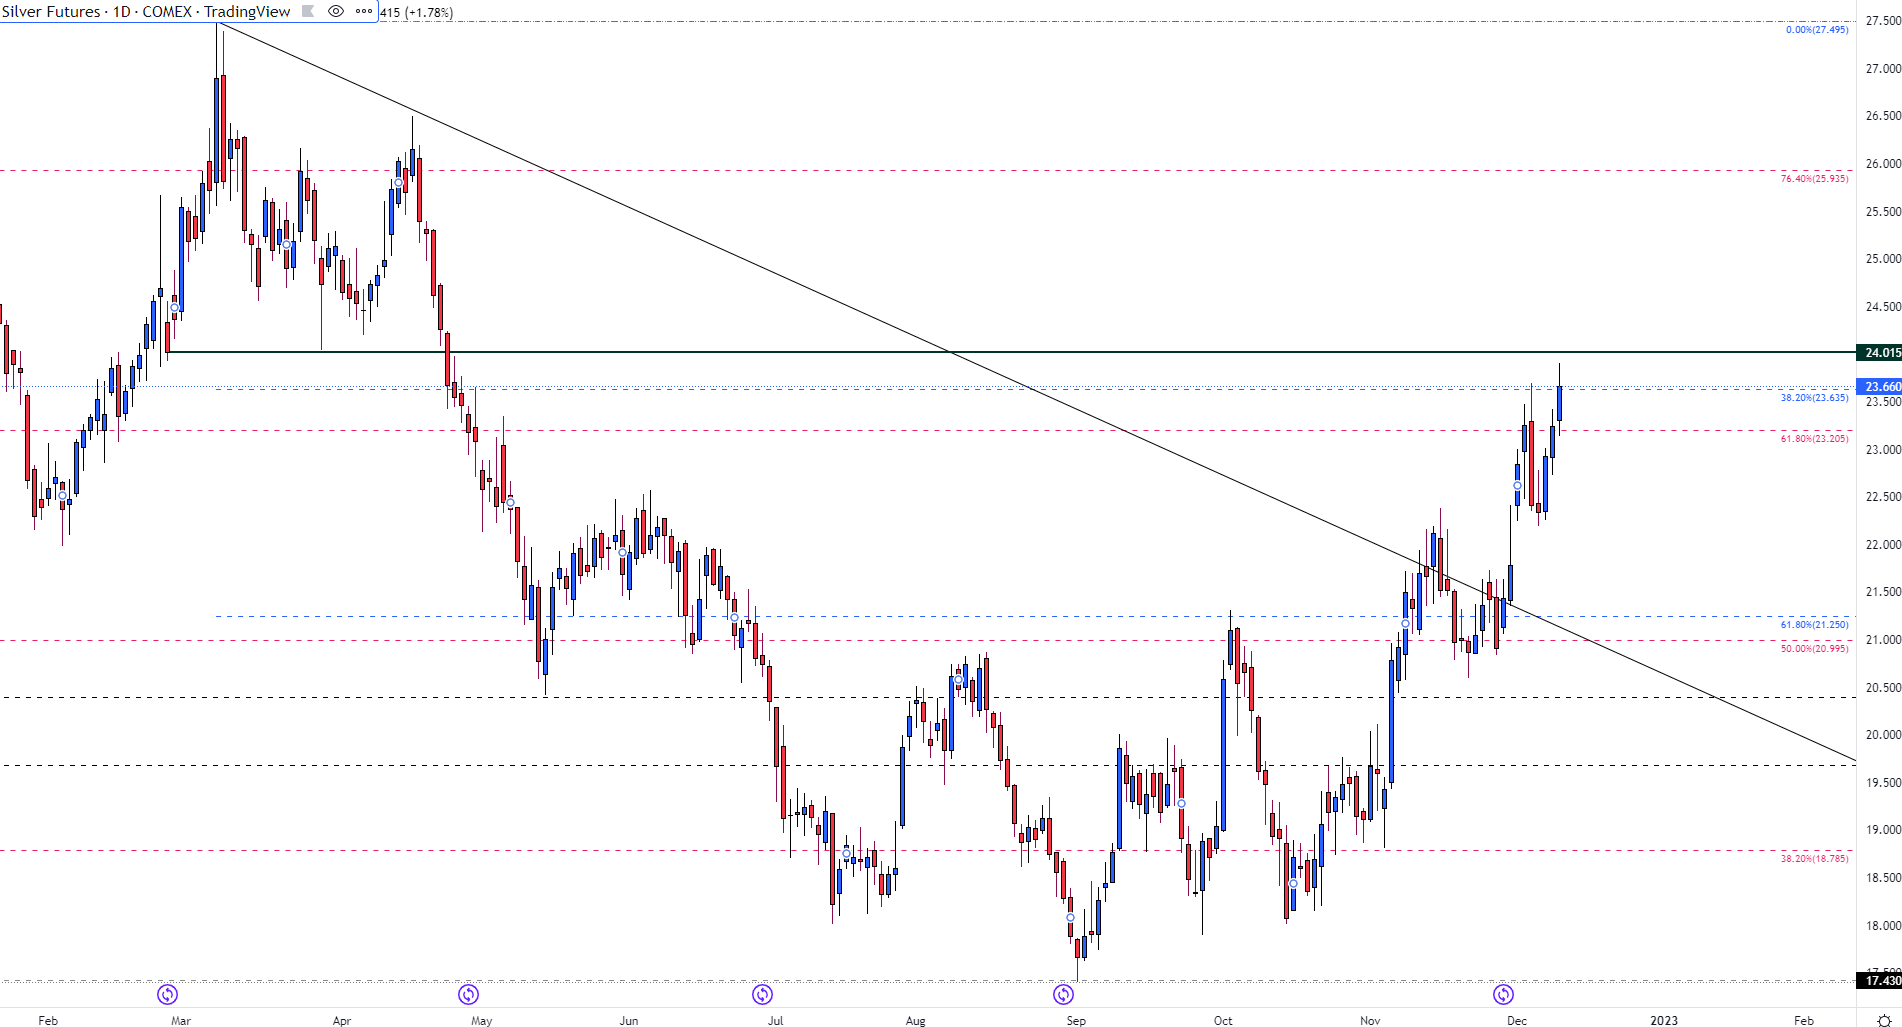
As Silver prices aim to break through Fibonacci resistance of the 2021 – 2022 move at 23.635, a hold above this level could drive XAG/USD back to the next big zone of resistance at 24.00 and towards 25.00. With the 23.00 and 22.00 psychological levels holding as support, a move lower could fuel bearish momentum back towards 21,25.
Brent crude oil remains under pressure despite trading marginally higher this Friday. Crude oil fundamentals including both API and EIA weekly crude inventory numbers showing bigger declines than expected have not been enough to overcome global recessionary fears. In addition, the Keystone pipeline in the U.S. has been shut down due to the largest crude oil spills in roughly ten years. Crude oil’s pushback today is largely attributed to this hit to supply however, the worsening COVID situation in China is hampering hopes for a positive China re-open whereby demand for crude should theoretically increase. The EU’s G7 price cap on Russian oil is yet another uncertainty in the crude oil equation with Russia not showing signs of clarity around their response function just yet. While they have stated that they will not accept the price cap, supply cuts have not yet been actioned which could give crude a boost.
Trade Smarter – Sign up for the DailyFX Newsletter
Receive timely and compelling market commentary from the DailyFX team
Subscribe to Newsletter
This leaves the global slowdown rhetoric at the forefront of price limitations for crude oil and with further interest rate hikes scheduled for next week, the impact on consumer demand and economic growth will be negatively affected.
From a USD perspective, PPI and Michigan consumer sentiment will be key ahead of next week’s Federal Reserve interest rate decision because of the recent FOMC blackout period whereby Fed officials are unable to provide input. As of now, the Fed is being divided into dovish and hawkish camps, with doves receiving support from softening inflation while hawks more recently garnered provisions from a tight labor market (NFP beat) and more recently the ISM services print. The depressed greenback may be looking to turnaround post FOMC which could weigh on crude oil despite December being an historically weaker month for the dollar.
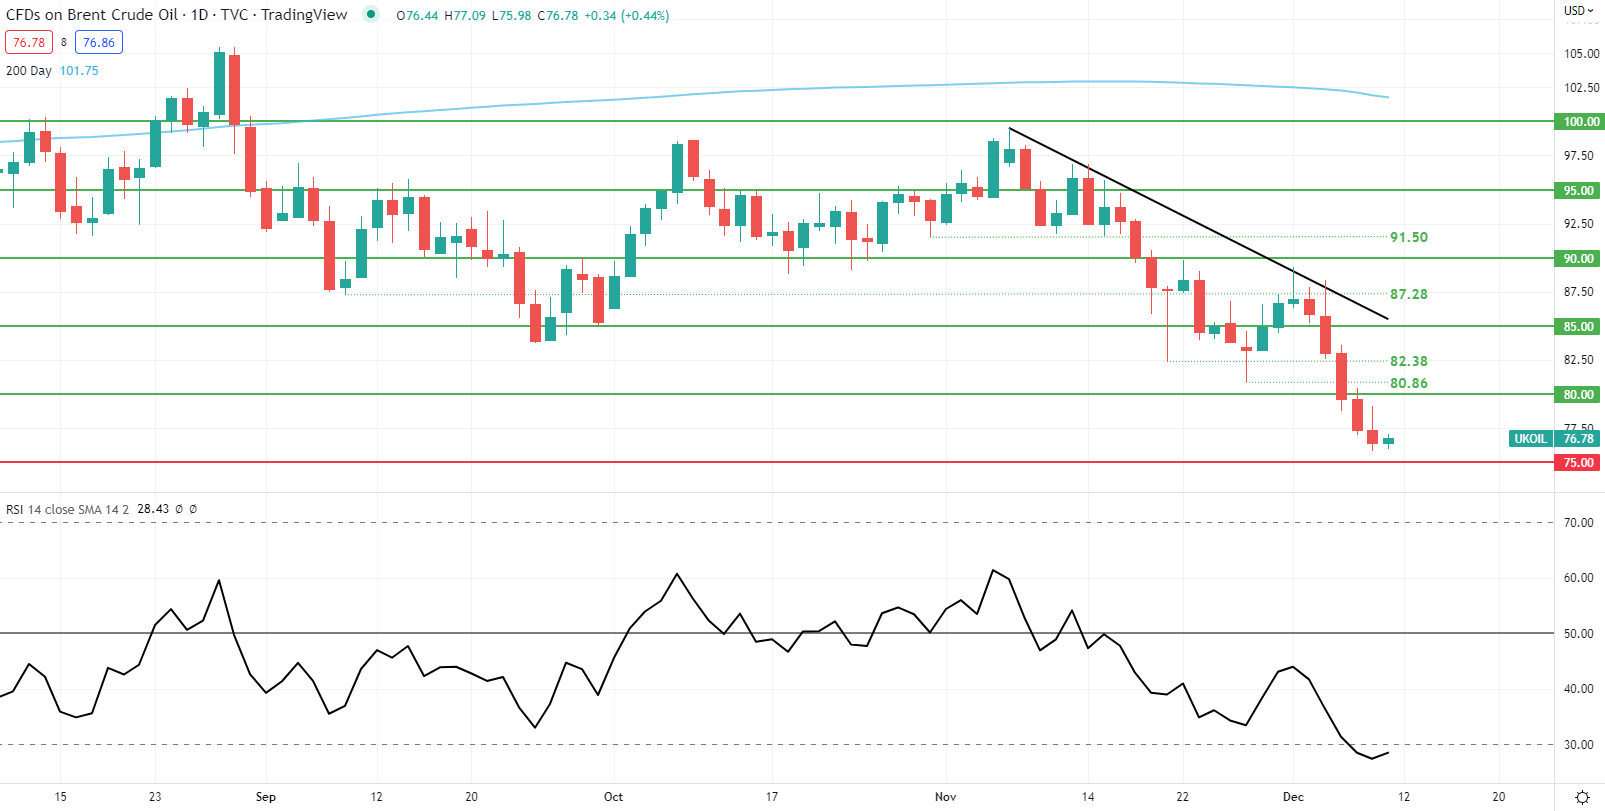
Daily Brent crude price action shows the 75.00 psychological support handle coming under pressure however, the Relative Strength Index (RSI) may suggest slowing bearish momentum with the RSI currently in oversold territory. This could give bulls some hope particularly if U.S. economic data misses forecasts giving crude oil a boost from the weaker greenback.
Compete for the main prize of the year – Hyundai Tucson, or win one of three travel packages worth $5,000 or of seven MacBooks Pro, plus get extra money incentive prizes each month!
Take part in a flagship affiliate contest for the partners from Nigeria, earn the highest partner’s commission, and win fantastic prizes! Registration: https://bit.ly/3iDhap5 Attract new referrals, compete with other LiteFinance affiliates from Nigeria, win gorgeous prizes every month and a Hyundai Tucson, a trip to the LiteFinance office or a MacBook Pro by the end of the contest. For more information, call: 08166635848
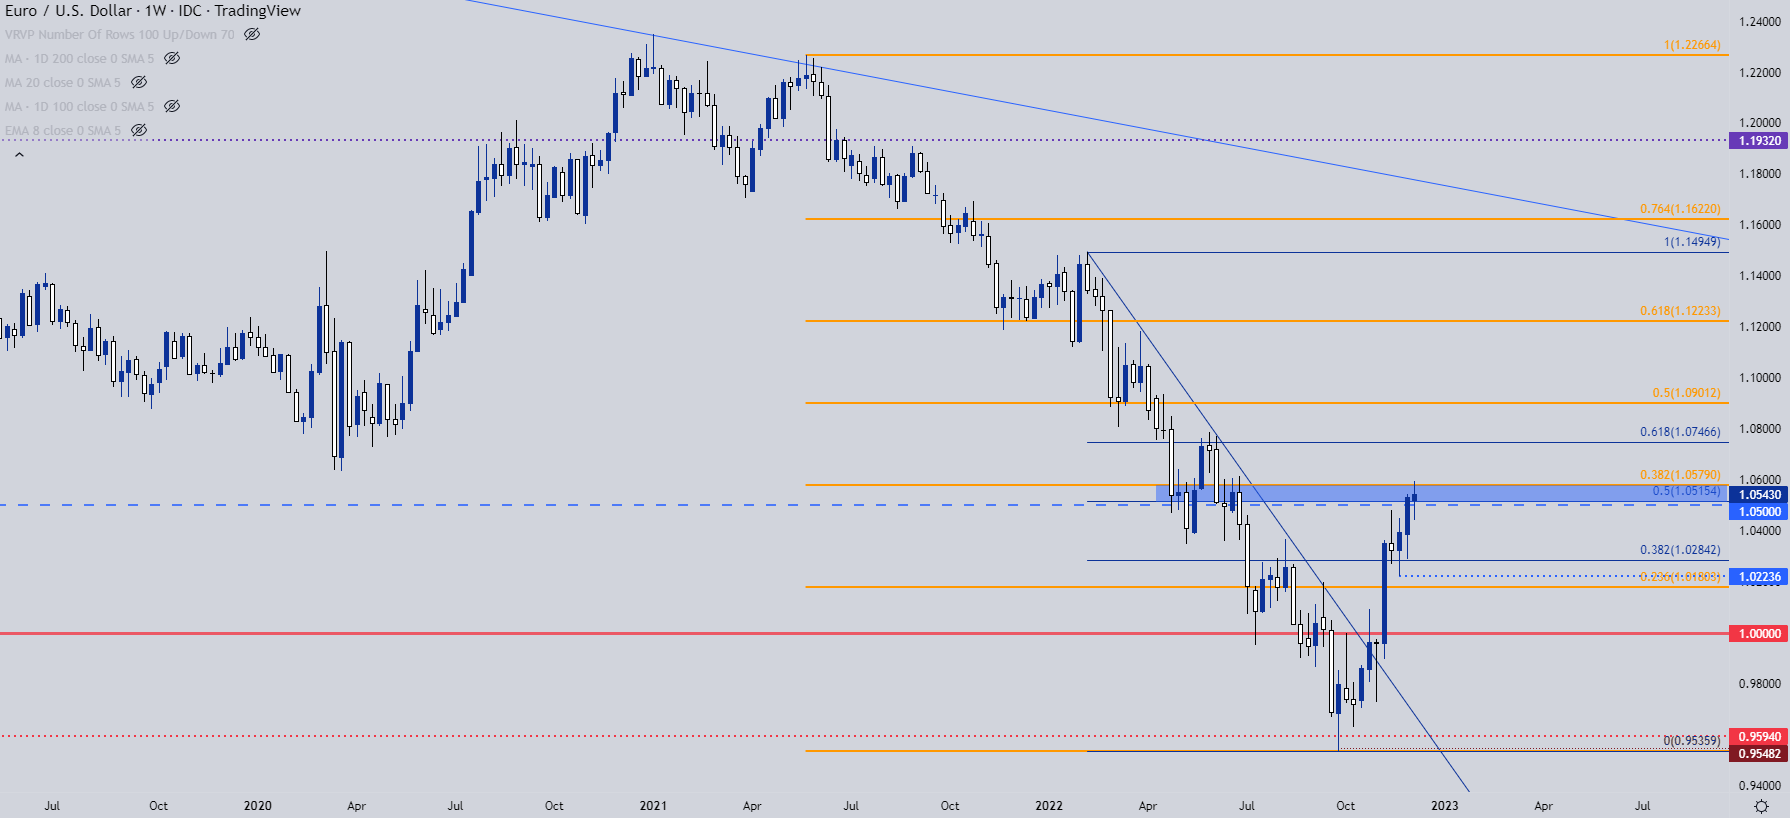
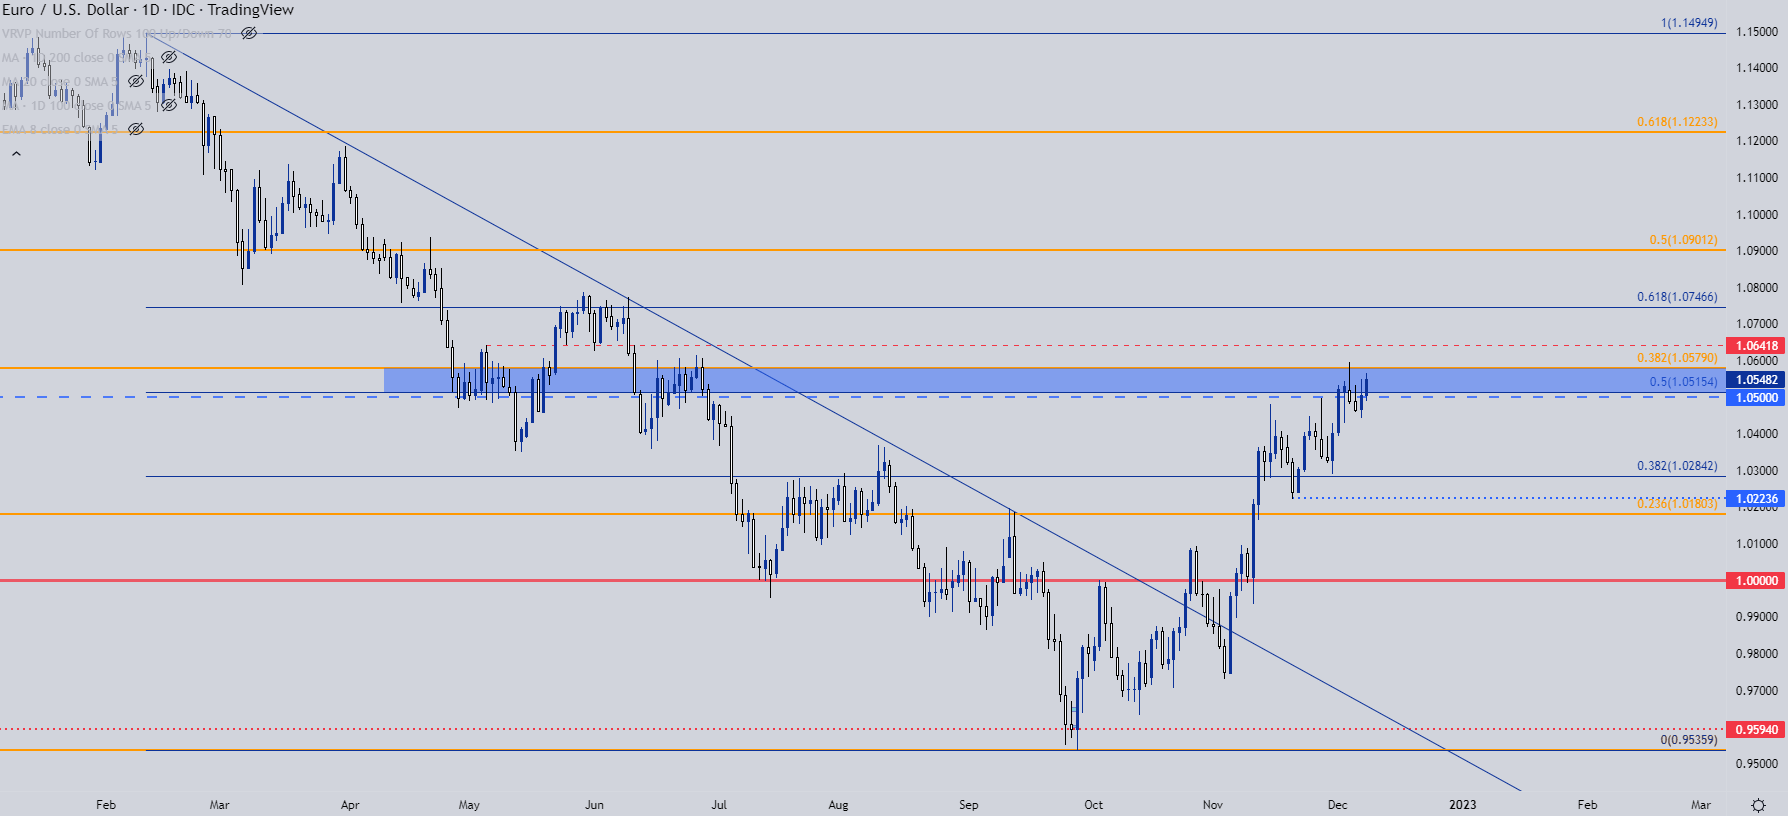
To open the week, EUR/USD tested a breakout beyond a key Fibonacci level at 1.0579. It snapped back pretty soon after, and this synced with a support bounce in the USD from one of its own Fibonacci levels. Initially this gave the appearance of trend potential, and the Monday session offered some run on both of those themes with even a bit of continuation on Tuesday. Yesterday, however, saw both themes pull back, with USD selling-off and EUR/USD pushing back above the 1.0500 level. This gives the appearance of anticipation for next week’s rather voluminous Central Bank outlay. Pertinent to EUR/USD, we’re hearing from the Fed (on Wed) and the European Central Bank (on Thurs). After that, we have but a couple of weeks until the end of the year so that drive on next week’s economic calendar is looking quite opportunistic for trend and breakout traders.
At this point, the weekly bar of EUR/USD is looking indecisive and is working as a doji. Given the blistering pace of gains from the September low, a doji at a key spot of resistance could be of interest for swing traders, but we have to confirm that first with this week’s close. And for that we have to get through some US data tomorrow with the release of PPI data at 8:30 AM followed by Consumer Sentiment at 10 AM (both times Eastern).
EUR/USD Weekly Price Chart
EUR/USD
From the daily chart, we can see a key zone that’s in-play to hold the highs at the moment. There’s confluence between two Fibonacci levels of note, as the 50% mark of the Feb-Sept major move plots at 1.0515 and the 38.2% retracement of the longer-term sell-off, spanning from May of 2021 down to the September low rests at 1.0579. That was the level that was tested through on Monday before the short-term reversal showed up.
From the daily there are still up-trending tendencies and only early signs that a top may be in. What would be needed next is a lower-high, inside of the Monday high, combined with a lower-low, which could be sought below the Wednesday swing at 1.0450.
The alternative case would be an episode of capitulation, which could show in the event of a fresh high being met with intense selling pressure, thereby opening the door for reversal scenarios.
EUR/USD Daily Chart
EUR/JPY
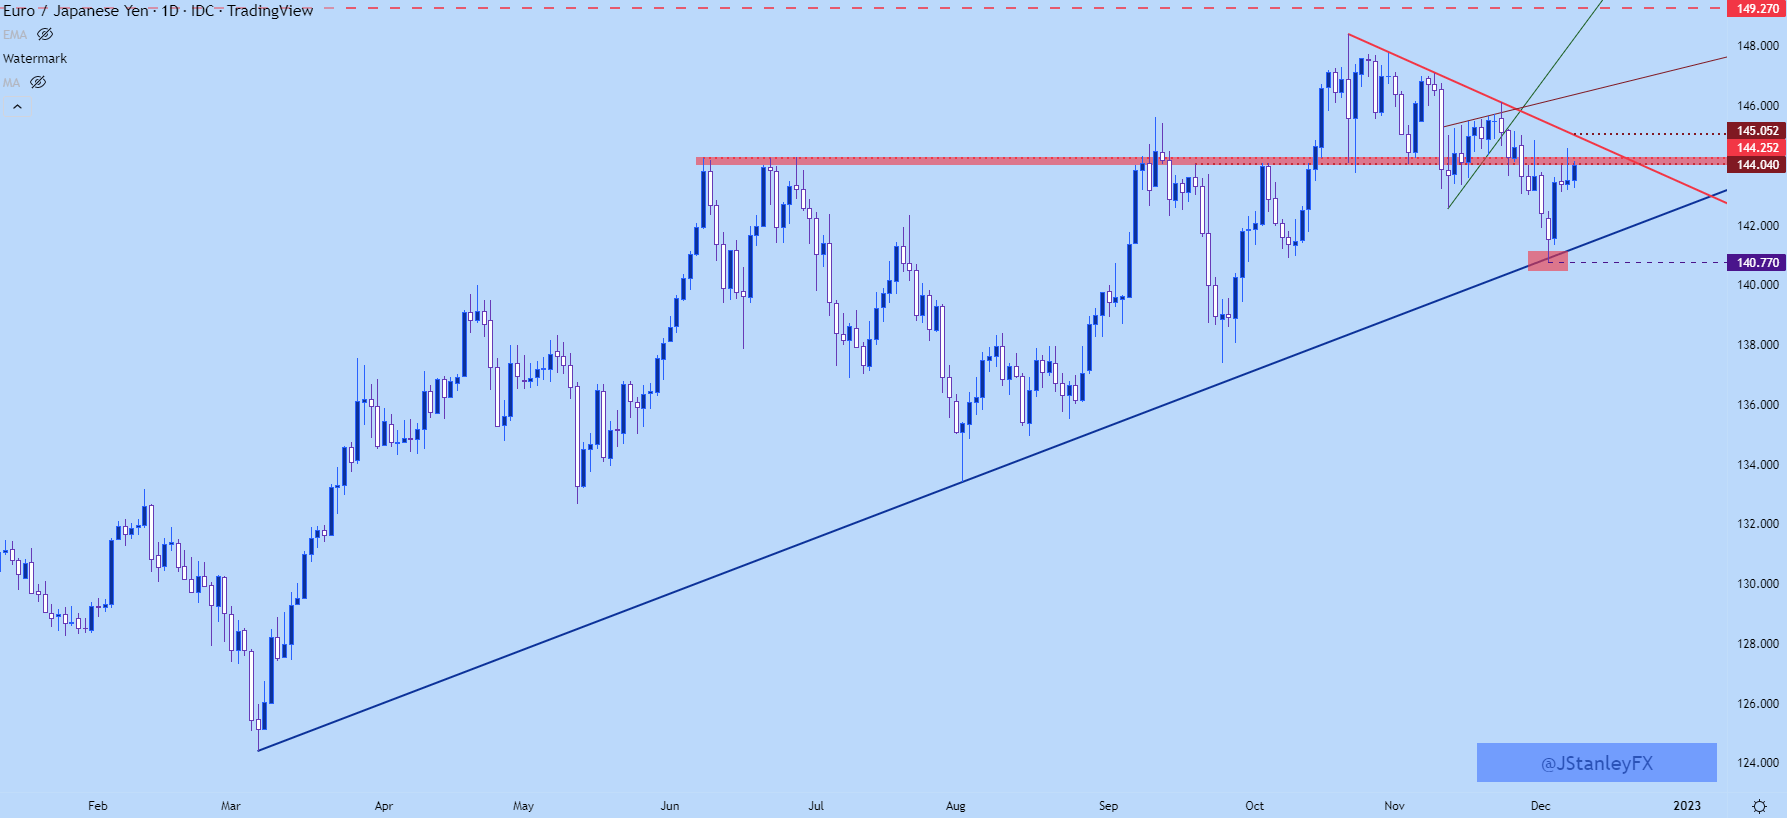
For Euro bears, there may be a more attractive setup elsewhere. EUR/JPY could be one of those candidates. Even as USD weakness has hung around, JPY strength has continued to show and in EUR/JPY, this led to a break of a rising wedge formation two weeks ago. Rising wedges are often tracked for bearish reversals, and that led into a push down to fresh monthly lows.
Bears then ran it down to trendline support with a low being set at 140.77 on Friday. Since then prices have bounced, and we’re now testing a familiar area of resistance-turned-support around the 144 handle. And just above, there’s another spot of resistance, as taken from a bearish trendline connecting a group of recent lower-highs in the pair. This currently projects to around the 145 level.
EUR/JPY Daily Chart
EUR/JPY Shorter-Term
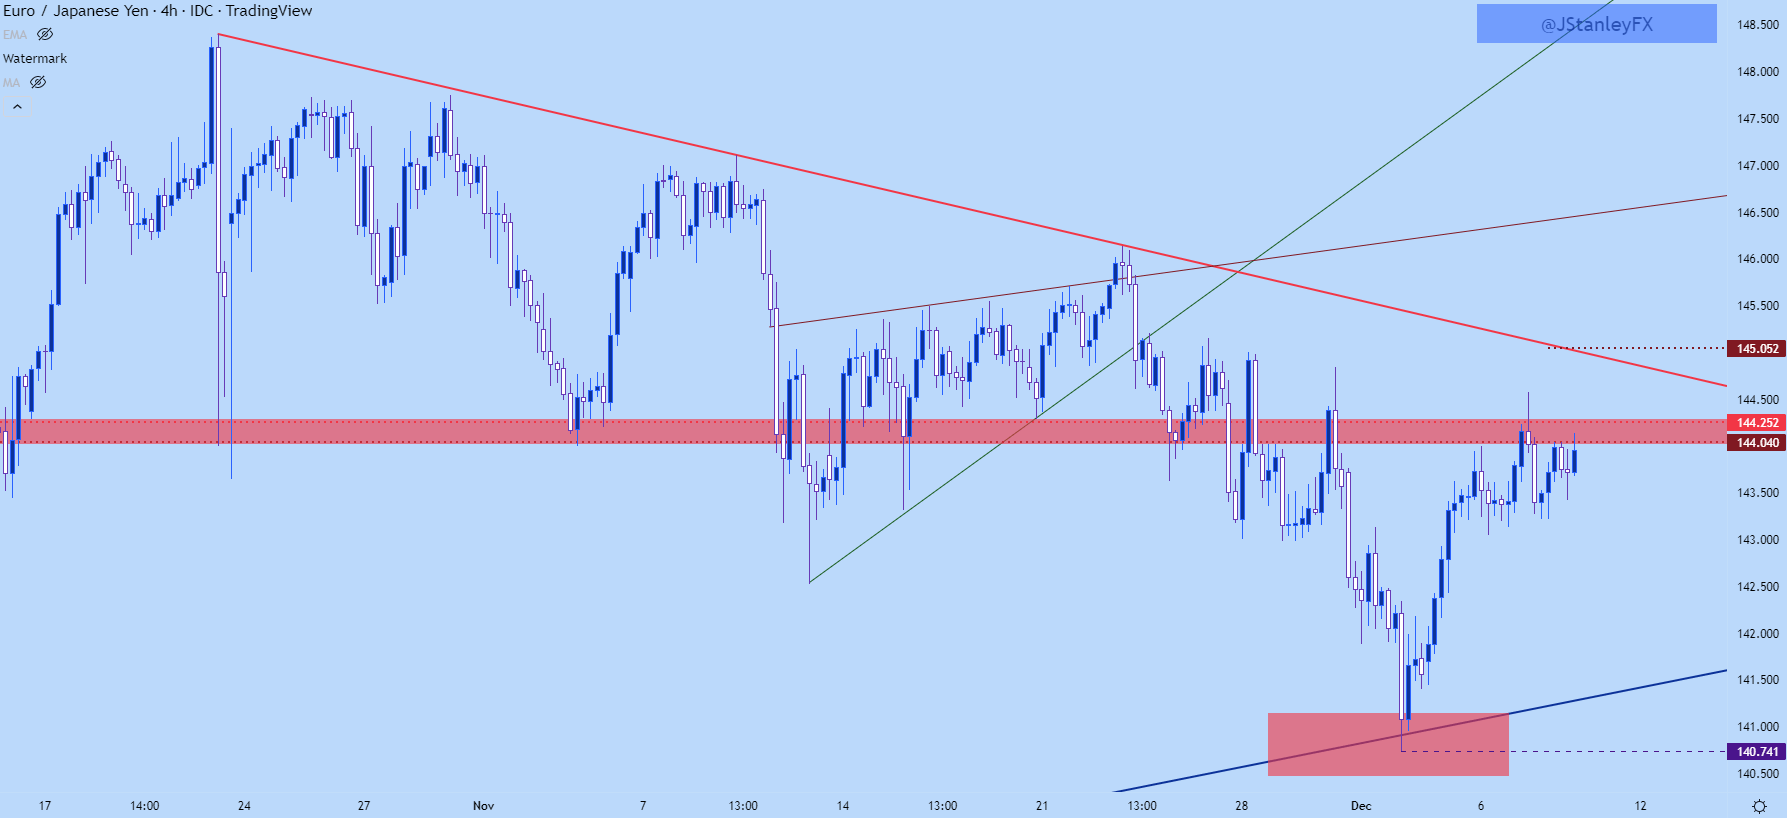
From a shorter-term basis, we can see where EUR/JPY tested above that resistance zone yesterday and quickly snapped back. This keeps the door open for swing potential, particularly if this zone of resistance can hold a lower-high below yesterday’s swing.
EUR/JPY Four-Hour Chart
EUR/GBP
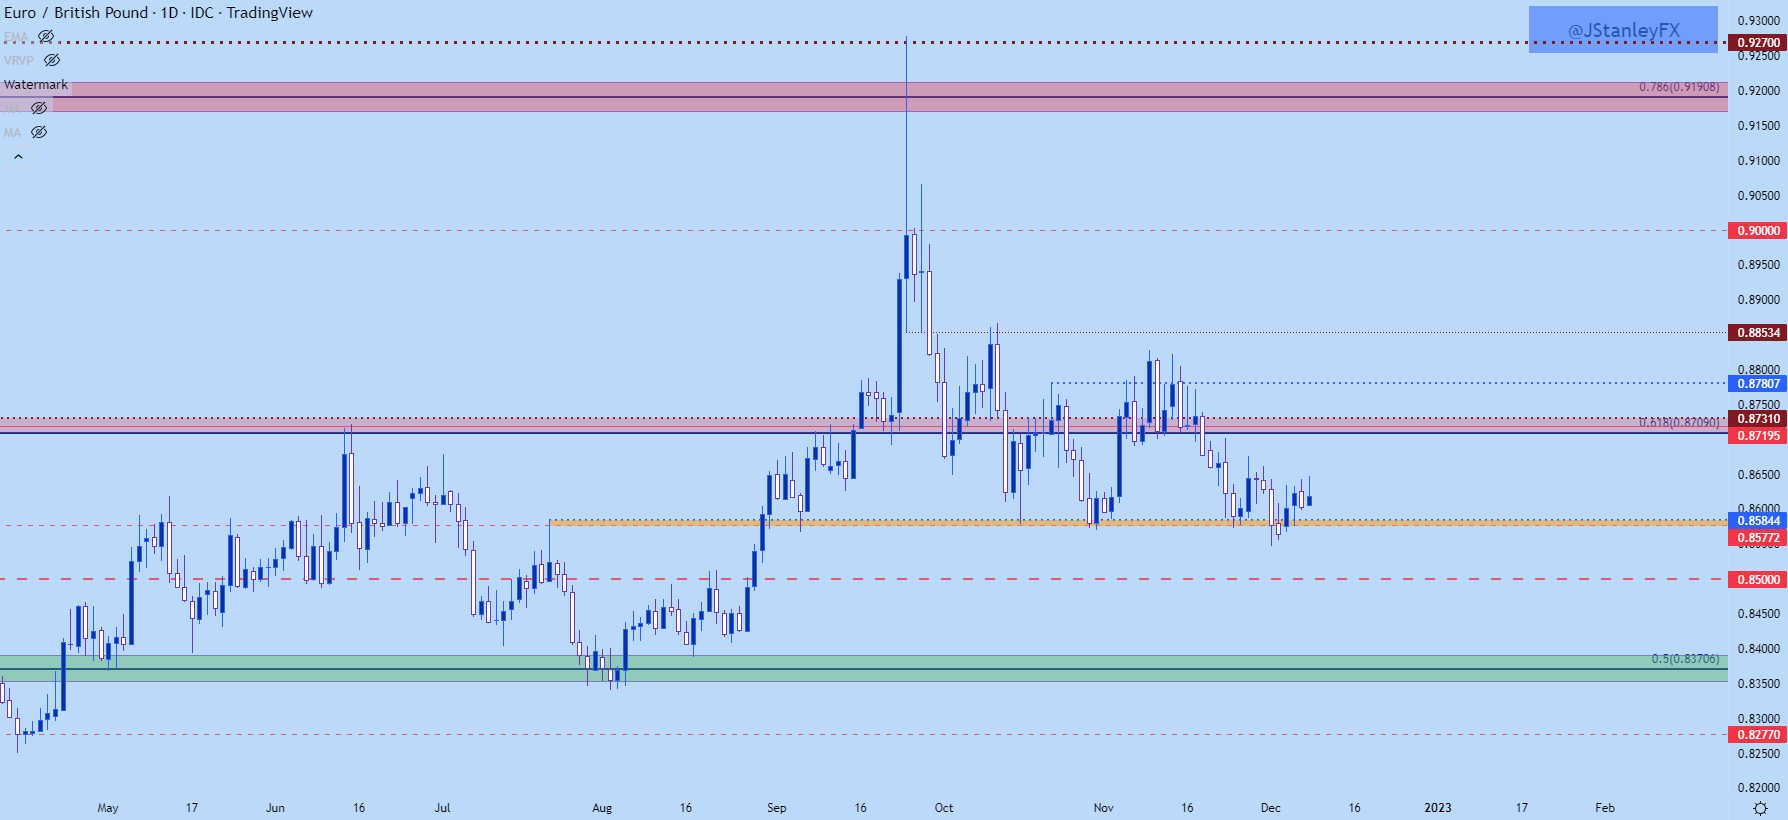
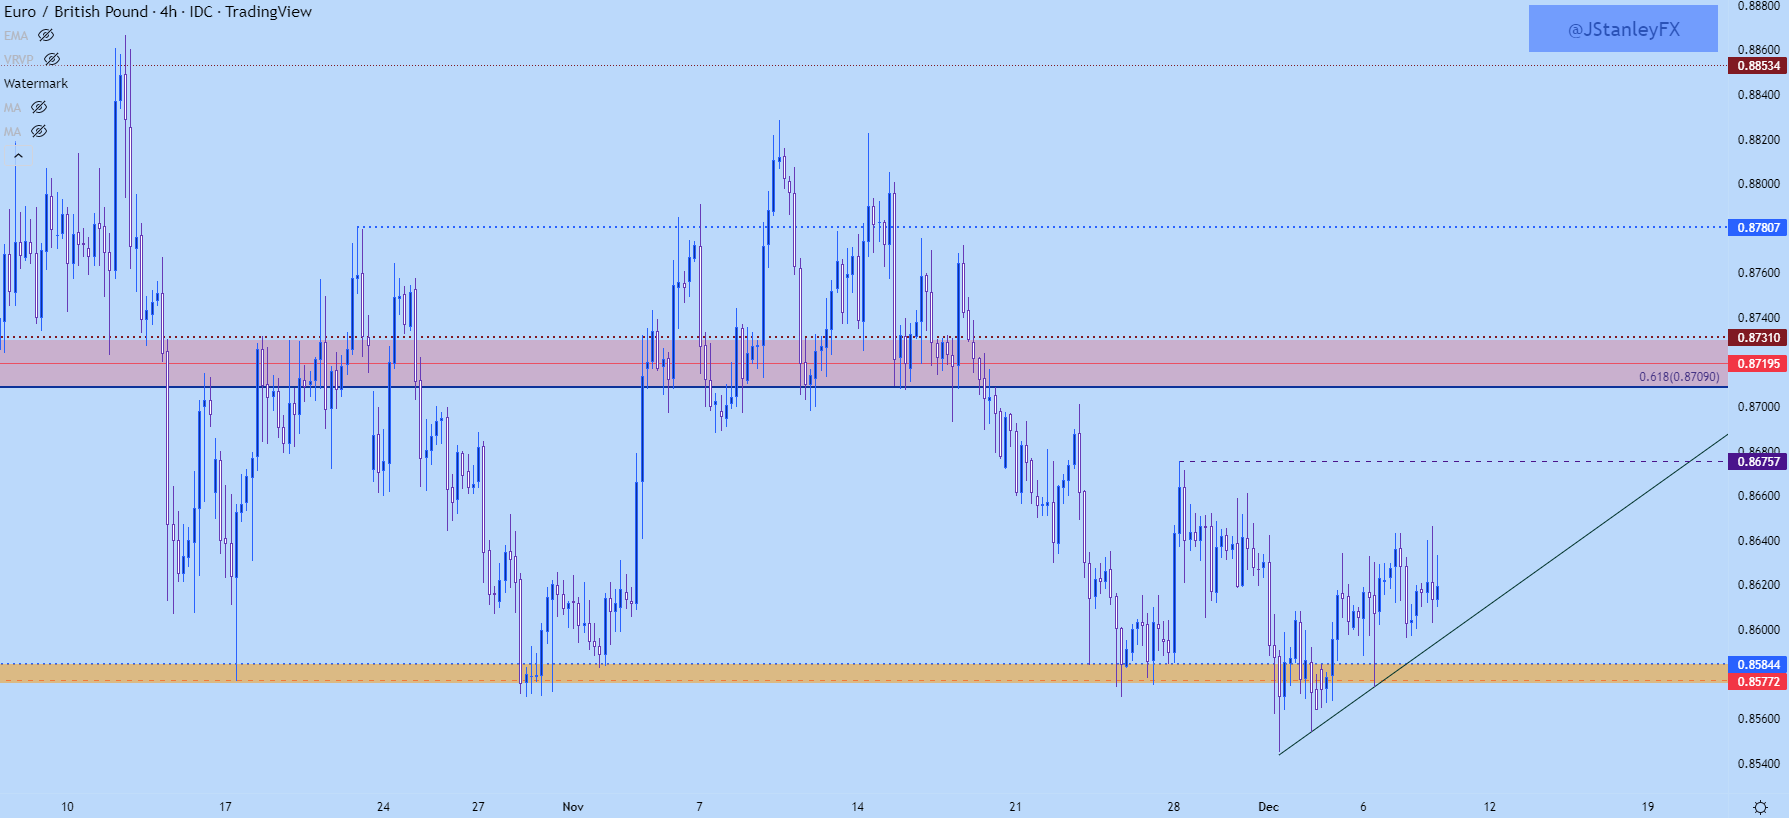
I had looked into EUR/GBP early last month, highlighting a bout of range resistance that had just come into the picture. Price took about a week but, continued to hold in that area without breaching the next resistance level on the chart at .8853. Then GBP strength started to show up and EUR/GBP began to trickle lower, eventually crossing the .8700 handle and then, as of last week, visiting range support around .8577.
So far this week a bounce has developed off of this support, but sellers have been standing at the ready, as highlighted by the upper wicks sitting atop the past three daily candles (four, if including today’s unfinished bar).
EUR/GBP Daily Chart
EUR/GBP Shorter-Term
Going down to the four hour chart, we can see an attempt at recovery. It’s still very early though, as price hasn’t yet been able to test through a prior lower-high around .8680. There has, however, been a string of recent higher-lows, and this can keep the door open for bounce scenarios in the pair until that string is broken. And for that, I’m tracking the Tuesday low at .8574. If bulls can hold the low above that level, the longer-term range scenario can stay alive with focus on revisits to .8676 after which the .8709-.8731 zone comes back into the picture.
Take part in a flagship affiliate contest for the partners from Nigeria, earn the highest partner’s commission, and win fantastic prizes! It’s your chance to win one of the fabulous prizes worth a total of $145,000 Registration: https://bit.ly/3FAbENb Our prizes Hyundai Tucson as the main prize; 3 travel packages worth $5000 for you to visit the company’s main office; 7 MacBooks Pro; 240 extra money prizes will be raffled during the year. How to win? Score the most points and win the competition!
Bring in active clients and deposits, scoring the most contest points.
Remain active throughout the year and don’t let anybody outrun you. Go to the contest page to learn more about it. Best regards, LiteFinance
The main economic highlight in Thursday’s session was the (weekly) unemployment filings out of the US for the week ending 3 December.
According to the US Department of Labour, unemployment claims rose 230,000, 4,000 higher than the previous upwardly revised 226,000 reading; the release was largely in line with economists’ forecasts.
Trading Derivatives carries a high level of risk to your capital and you should only trade with money you can afford to lose. Trading Derivatives may not be suitable for all investors, so please ensure that you fully understand the risks involved, and seek independent advice if necessary. A Product Disclosure Statement (PDS) can be obtained either from this website or on request from our offices and should be considered before entering into a transaction with us. Raw Spread accounts offer spreads from 0.0 pips with a commission charge of USD $3.50 per 100k traded. Standard account offer spreads from 1 pips with no additional commission charges. Spreads on CFD indices start at 0.4 points. The information on this site is not directed at residents in any country or jurisdiction where such distribution or use would be contrary to local law or regulation.
The 4-week average also ended at 230,000, up 1,000 based on the previous week’s moving average value (revised). Continuing claims was higher at 1,671,000 from 1,609,000 the week prior. Overall, however, this data was largely ignored across the markets.
Technical View for Key Markets
EUR/USD: Buyers at the Wheel?
It has been a somewhat muted week thus far for the EUR/USD currency pair. Kicking things off with the weekly scale, price remains comfortable north of its support level from $1.0298, a barrier that was breached in early November. Overhead has resistance in view at $1.0778: a Quasimodo support-turned resistance. For this reason, and given the upward movement since bottoming at $0.9536, further outperformance could be on the table for the unit, longer term.
Meanwhile on the daily timeframe, resistance forged from $1.0602 is nearby. This comes after price climbed north of the 200-day simple moving average ($1.0353) as well as resistance coming in at $1.0377 (now a marked support). Interestingly, should price overthrow $1.0602, prime resistance can be seen at $1.0954-1.0864. You will also acknowledge that the relative strength index (RSI) remains trawling the underside of the overbought space, and nearing channel support, taken from the low 25.68.
Against the backdrop of the bigger picture, the H1 timeframe has price on the verge of reaching for Quasimodo resistance at $1.0585, followed by a larger Quasimodo resistance coming in from $1.0607 (in between, of course, resides the $1.06 psychological figure).
All three timeframes, therefore, call for additional short-term buying, at least until reaching the $1.06ish region.
BTC/USD: Medium-Term Technical Harmonic Formation in Play
The price of bitcoin against the US dollar (BTC/USD) has been entrenched within a notable downtrend since topping in late 2021. Long term, therefore, this has opened the door for sell-on-rally scenarios. Shorter term, nevertheless, price recently touched gloves with the underside of an AB=CD bearish pattern, consisting of a 100% projection at $17,321 and a 1.618% Fibonacci extension from $17,291. The test was also accompanied by the relative strength index (RSI) forging negative (bearish) divergence.
As you can see, the AB=CD (harmonic) resistance has since enticed selling. Common downside targets derived from the AB=CD formation (legs A-D) are fixed at the 38.2% and 61.8% Fibonacci retracements from $16,630 and $16,194, respectively. Consequently, the noted support targets will likely be closely monitored going forward, with a breach perhaps unearthing additional selling.
The DAX 40—Germany’s major stock market index covering the performance of 40 blue-chip companies—is offering interesting price action. The one-sided advance on 10 November formed what is known as inefficient price action (the market favours efficient price action and generally fills inefficient price moves [think of these as similar to gaps as you would see in individual stocks]).
14,077-14,141 demand is a key watch for the index, following a to-the-point reaction from Quasimodo resistance at 14,605. Below current resistance at 14,322, we can see that the area under (yellow oval) the aforementioned demand is inefficient action, meaning price may be drawn to fill this void and test support from 13,969.
Therefore, based on the above analysis, sellers may remain in the driving seat under resistance at 14,322, with short-term breakout selling perhaps unfolding south of demand at 14,077-14,141 towards support at 13,969.
Gold prices were little changed on Thursday amid divergent performance between the US Dollar and Treasury yields. The anti-fiat yellow metal often finds itself the most sensitive to the latter two instruments moving in the same direction. This means that when the Greenback and bond yields go their own separate ways, that could mute XAU/USD’s performance.
A rally on Wall Street helped propel Dow Jones and S&P 500 futures by about 0.53% and 0.74%, respectively. The rosy session cooled demand for safety, placing the anti-risk US Dollar on the defensive. The DXY Index closed at its lowest since the beginning of this week. Demand for Treasuries likely faded, pushing down prices as yields climbed.
When the latter two move in different directions, the net effect on gold can be neutralized. This is leaving XAU/USD facing US PPI and University of Michigan consumer sentiment data due over the remaining 24 hours. These will be some of the last key data Fed officials will see before next week’s interest rate decision. Rosy data could continue reinvigorating hawkish policy bets, leaving gold at risk.
Gold Technical Analysis
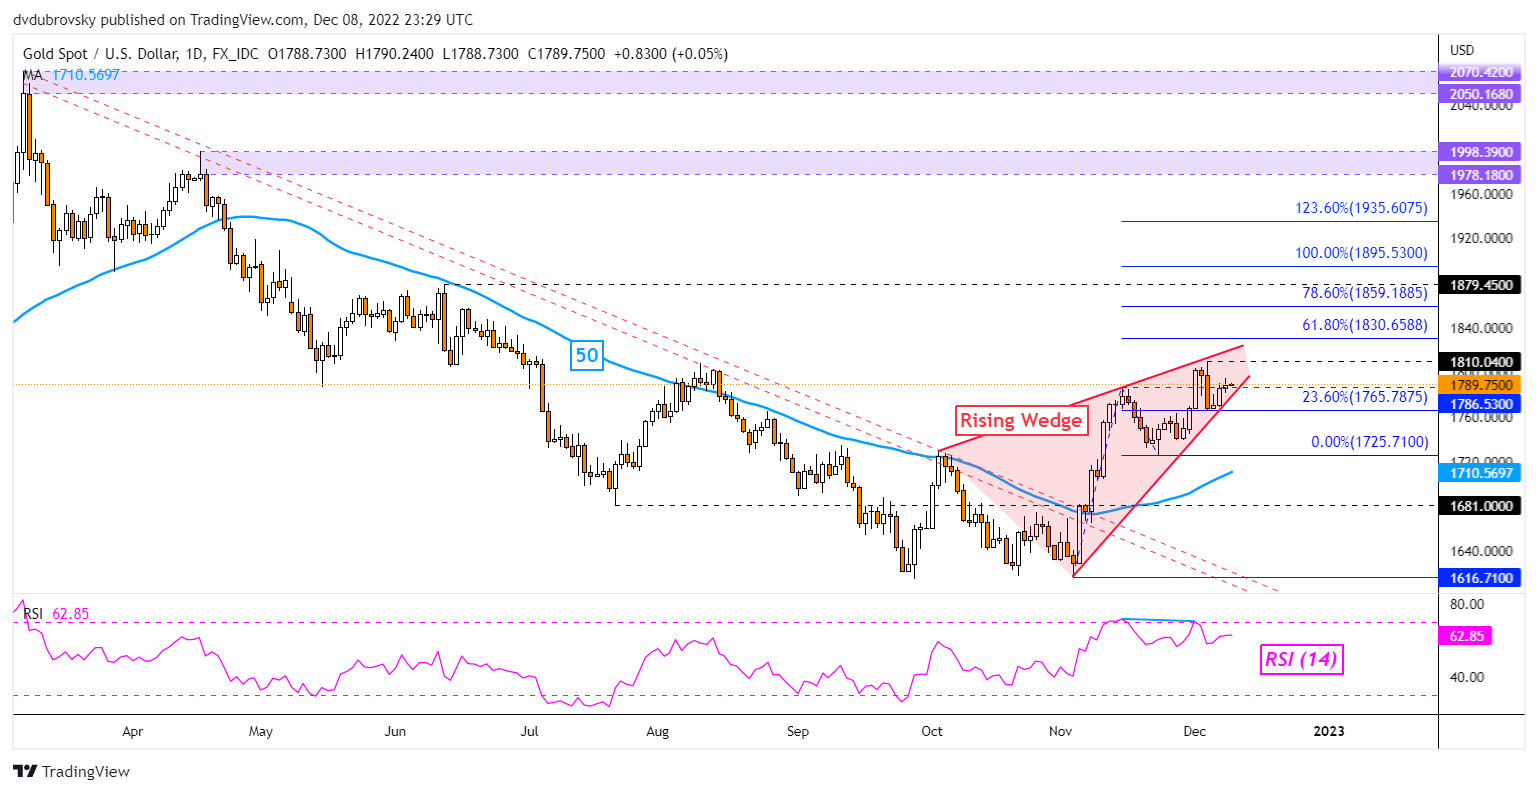
On the daily chart, gold appears to be trading within the boundaries of a bearish Rising Wedge chart formation. A breakout lower could open the door to resuming the dominant downtrend from earlier this year. That would place the focus on the 50-day Simple Moving Average, which may reinstate the near-term upside bias. Immediate resistance seems to be at 1810.
Trade Smarter – Sign up for the DailyFX Newsletter
Receive timely and compelling market commentary from the DailyFX team
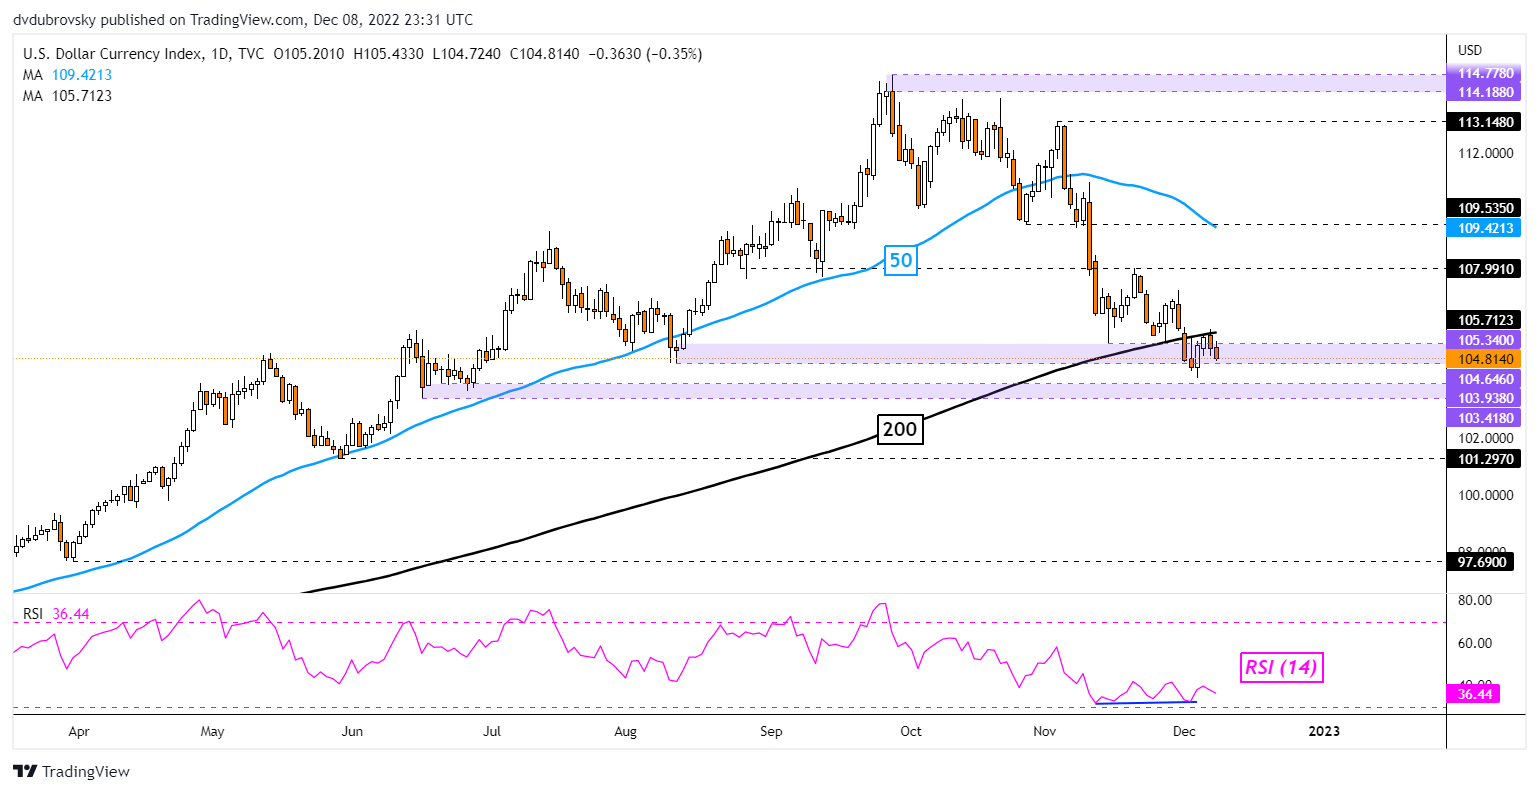
As for the DXY Dollar Index, the currency continues to consolidate around the 105.34 – 104.64 inflection zone. Prices are also trying to confirm a breakout under the key 200-day SMA. That could open the door to a broader shift in USD’s direction, exposing the 103.41 – 103.93 support zone from June. In the event of a turn higher, keep a close eye on the 50-day SMA< which could reinstate the near-term downside bias.











 Chat now!