Portland, OR, USA - October 5, 2013: The entrance to the United States National Bank building in Portland, OR.. Built in 1917, the bronze door entrance was designed by Arvard Fairbanks.

US banks brace for recession, and other economy stories you need to read this week

1. US banks brace for recession

The biggest US banks are bracing for a worsening economy next year as inflation threatens consumer demand.

JPMorgan Chase Chief Executive Jamie Dimon told CNBC that consumers and companies are in good shape, but said that may not last much longer as the economy slows down and inflation erodes consumer spending power.

“Those things might very well derail the economy and cause this mild to hard recession that people are worried about,” he said.

US consumers have $1.5 trillion in excess savings from pandemic stimulus programs, but it may run out some time in mid-2023, Dimon said. He also said the Federal Reserve may pause interest rate rises for 3-6 months after lifting them to 5%, but that this may “not be sufficient” to curb high inflation.

The US central bank last month raised rates by 75 basis points for the fourth consecutive time, taking them to 3.75-4%, but also signalled hopes to shift to smaller hikes as soon as its next meeting.

Inflation is impacting consumers’ savings, while US banks brace for recession.

Inflation is impacting consumers’ savings, while US banks brace for recession. Image: Statista.

2. Global stock markets fall

Stock markets around the world have fallen this week amid concerns about economic stagnation next year.

European shares have been dragged down by weakness in healthcare and rate-sensitive tech stocks, with investors concerned about a global economic slowdown in the run-up to a raft of major central bank decisions.

The Europe-wide STOXX 600 index fell as optimism around China easing its COVID-19 restrictions was overshadowed by worries around interest rates and the likelihood of recession.

The European Central Bank, US Federal Reserve and Bank of England all meet next week to discuss monetary policy. The Reserve Bank of Australia offered a glimpse of decisions to come after raising rates to a 10-year high and sticking with its projection that more hikes are needed to cool inflation.

“We are again seeing global recession fears rise,” Equiti Capital’s Head Macro Economist Stuart Cole told Reuters. “With equities, specifically, there’s also a realization that a lot of corporations were far too optimistic and the cost of living crisis is really going to curtail aggregate consumption going forward.”


future preparedness capabilities.

imf-768x576

Debt to GDP Ratio by Country: State of Global Debt 2022

The COVID-19 pandemic led governments to spend massively in emergency support, forcing them to run big deficits that have resulted in historically and rising high debt. The debt to GDP ratio by country, particularly seen in Europe, Japan and other large, global economies, has surged. This debt constitutes a significant risk as central banks start to raise interest rates, making new debt more expensive and existing bonds worth less. Central banks are also halting asset purchases, removing an important price support for government bonds.

The State of Global Debt, by Country

Source: Visual Capitalist

Brookings Institution economists have calculated that overall global debt rose by 30 percentage points in 2020, to 263% of GDP. Government debt rose 13 points to 97% of GDP, with advanced economies rising 16 points to 120%.

Governments threw debt caution to the winds as central bank purchases of bonds effectively monetized the debt, allowing politicians to spend and borrow freely. Ultra-low interest rates, in some cases negative, reduced the cost of borrowing.

Modern monetary theory had already paved the way for this change in attitude by hypothesizing that countries with fiat currencies, such as USD or JPY, could issue debt more or less without limits. However, mainstream economists argue that high levels of debt stifle growth and are not sustainable. They cite problems like higher taxes, lower future incomes, and growing inequity between generations.

Debt to GDP ratio: the US

The ratio of government debt to GDP soared especially in the big advanced economies. In the US, that ratio reached 137.2% in 2021, according to estimates by the administration. That’s up from 128.1% in 2020, and 106.8% in 2019.

The EU scraps debt promises, for now

Before interest rates fell, a 60% ratio was considered the maximum sustainable and 100% seemed outrageously high. The European Union enshrined the 60% ratio in its so-called Stability Pact limiting debt to 60% and deficits to 3% of GDP for those using the joint euro currency. The EU, which observed these limits only fitfully in the past, has now bowed to reality and suspended them through 2023.

Debt to GDP league champ: Japan

The league champion in debt to GDP has been Japan, where government debt rose to 266% of GDP by the end of 2020. Japan has defied conventional debt rules for years due to the public’s high propensity to save and to channel these savings into domestic bonds. But the 2020 figure was up significantly from 238% in the previous year.

Greece is a distant second with 193% in 2021, but the Greek economy is No. 53 in the world while Japan is No. 3 and has a much bigger impact.

China’s debt to GDP: too good to be true?

China, the world’s second-largest economy, registered a 2020 debt ratio of 66.8%, but the reliability of data from the notoriously opaque economy is an open question. The UK, which ranks fifth among world economies, came in at 94% in 2020, up from 82.7% the previous year.

Debt amounts and debt to GDP ratios for any country can vary considerably depending on which figures are used.

President Joe Biden boasts that the US government will reduce this year’s deficit by $1.5 trillion as government support for businesses and individuals fades out. But a lower deficit will slow the build-up of debt but by itself won’t reduce the debt to GDP ratio.

The optimistic plan for reducing the elevated debt to GDP ratio in the US and other advanced economies rests on strong economic growth (increasing the GDP denominator) that outpaces the growth in debt, which should be constrained by fiscal discipline.

This is easier said than done. Another scenario would see surging inflation reducing the relative amount debt, while at the same time allowing growth in the nominal GDP. Fitch Ratings, for one, has forecast that inflation in 2022 can bring a reduction in the global debt to GDP ratio by 2.0 percentage points.

Inflation has its own costs, however, and poses a political problem. A central bank-induced recession to tame inflation would lower GDP and likely increase the deficit by reducing tax revenue. There is, in short, no easy way out.

demo-attachment-501-Businessman-with-smartphone-standing-at-staircase.@2x

Learn to Take Losses Like a Winner

Nobody likes to be a loser, but taking losses well is required in order to be a winner. Just ask some of the most prolific hedge fund managers of all time. George Soros once said (I’m paraphrasing), it isn’t about being right, it’s about how much you make when you are right versus how much you lose when you are wrong.

Soros’ extremely successful disciple, Stanley Druckenmiller, once said in an interview that he estimates he is right about 60% of the time. This means he is wrong 40% of the time. Paul Tudor Jones, another billionaire macro legend, once said he is wrong about as often as he is right, but he also echoed Soros by saying that what matters the most is how much he makes on his winners when right versus how big the losses are when wrong.

That means that some of the most successful hedge fund managers in the world are wrong, a lot. And they don’t care because it is part of the game and not what really matters most. What they care about is managing the risk on their ideas and seeking asymmetry between their winning and losing ideas.

Accepting losing is of course easier said than done given it is human nature to dislike losing, so for many taking losses frequently can be a jagged pill to swallow. But you should embrace it, actually, because it is just part of the game and what will keep you in the game in the long run. Furthermore, the faster an idea hits its stop the faster you can move onto the next potential winner.

Not all losses are created equally. What should raise red flags is when you are constantly taking losses, or taking outsized losses relative to your wins. A loss could be a function of market conditions not conducive to your trading style/strategy, or it could be something deeper that implies you are not consistently following your trading rules.

When suffering a losing period (drawdown) take a close look at what you are doing. Examine your trade log, go through your journal, see if you are following your trading plan or deviating. If deviating, then you need to figure out what you need to do to get back on track. This is when losing isn’t acceptable, because it is self-inflicted.

However, if you are following your plan it could be a function of a market not conducive to your strategy, and while you should be flexible to adapting to market conditions, a solid time-proven strategy over multiple cycles should still come out ahead. The key here is to be consistent and seeing the strategy through the ups and downs.

Summary:

  • The very best in the business understand that taking losses is part of the game and don’t focus on being right all the time
  • What matters most is managing the risk on winning ideas versus losing ideas and coming out ahead with asymmetrical win/loss ratios
  • Not all losses are created equally, though; you need to understand when losing is a function of market conditions and when it is a function of deviating away from your trading plan

Resources for Forex Traders

Whether you are a new or experienced trader, we have several resources available to help you; indicator for tracking trader sentiment, quarterly trading forecasts, analytical and educational webinars held daily, trading guides to help you improve trading performance, and one specifically for those who are new to forex.

new-business-project-PZ5EYKS.jpg

Morning Star Candlestick: A Forex Trader’s Guide

What is a Morning Star Candlestick?

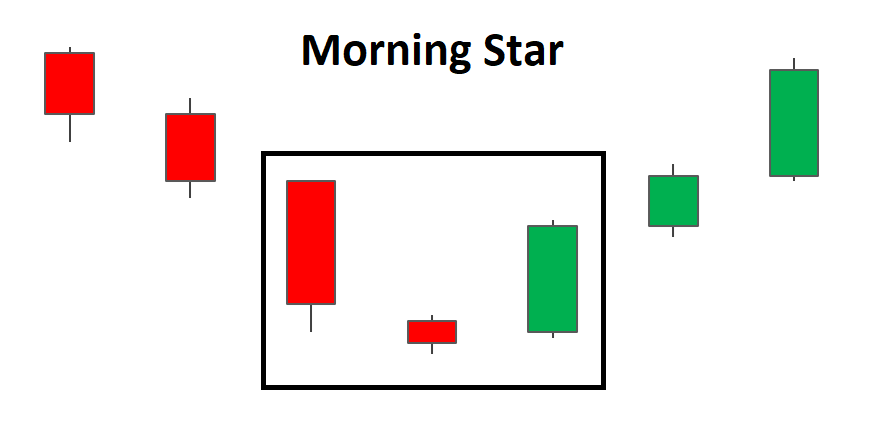
The Morning Star pattern is a three-candle, bullish reversal candlestick pattern that appears at the bottom of a downtrend. It reveals a slowing down of downward momentum before a large bullish move lays the foundation for a new uptrend.

Morning Star pattern

Morning Star Doji

Traders will often look for signs of indecision in the market where selling pressure subsides and leaves the market somewhat flat. This is where Doji candles can be observed as the market opens and closes at the same level or very close to the same level. This indecision paves the way for a bullish move as bulls see value at this level and prevent further selling. The appearance of the bullish candle after the Doji provides this bullish confirmation.

Morning Star Doji

What about the Evening Star?

The bearish version of the Morning Star is the evening star and it signifies a potential turning point in a rising market ( bearish reversal pattern). The same analysis applied to the Morning Star can be implemented with the evening star however, it will be the opposite direction.

How to identify a Morning Star on Forex Charts

Identifying the Morning Star on forex charts involves more than simply identifying the three main candles. What is required, is an understanding of previous price action and where the pattern appears within the existing trend.

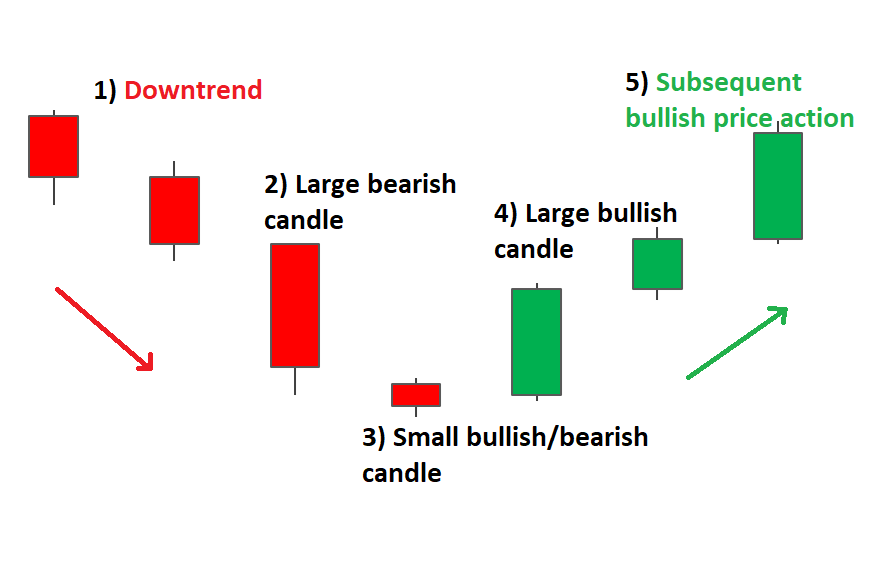
  1. Establish an existing downtrend: The market should be exhibiting lower highs and lower lows.
  2. Large bearish candle: The large bearish candle is the result of large selling pressure and a continuation of the existing downtrend. At this point traders should only be looking for short trades as there is no evidence of a reversal yet.
  3. Small bearish/bullish candle: The second candle is a small candle – sometimes a Doji candle – that presents the first sign of a fatigued downtrend. Often this candle gaps lower as it makes a lower low. It does not matter if the candle is bearish or bullish as the main takeaway here is that the market is somewhat undecided.
  4. Large bullish candle: The first real sign of new buying pressure is revealed in this candle. In non forex markets, this candle gaps up from the close of the previous candle and signals the start of a new uptrend.
  5. Subsequent price action: After a successful reversal, traders will observe higher highs and higher lows but should always manage the risk of a failed move through the use of well-placed stops.
how to identify a Morning Star pattern

How to Trade the Morning Star Pattern

The Morning Star pattern can be observed in the EUR/GBP chart below, where there is an established downtrend leading up to the formation of the reversal pattern.

Looking at the chart, once the formation has completed, traders can look to enter at the open of the very next candle. More conservative traders could delay their entry and wait to see if price action moves higher. However, the drawback of this is that the trader could enter at a much worse level, especially in fast moving markets.

Targets can be placed at previous levels of resistance or previous area of consolidation. Stops can be placed below the recent swing low, as a break of this level would invalidate the reversal. Since there are no guarantees in the forex market, traders should always adopt sound risk management while maintaining a positive risk to reward ratio.

trading the Morning Star EUR/GBP

When trading the Morning Star on forex markets, the price will very rarely gap like they do with stocks and so the three-candle pattern usually opens very close to the previous closing level.

How reliable is the Morning Star in Forex Trading?

The Morning Star, like most candlestick patterns, should be assessed in line with the current trend and whether there is supporting evidence in favour of the trade, when looking at an indicator. Below are the advantages and limitations of the Morning Star pattern:

usd

USD/CAD Eyeing Upside Breakout Following Dovish BoC Rate Hike

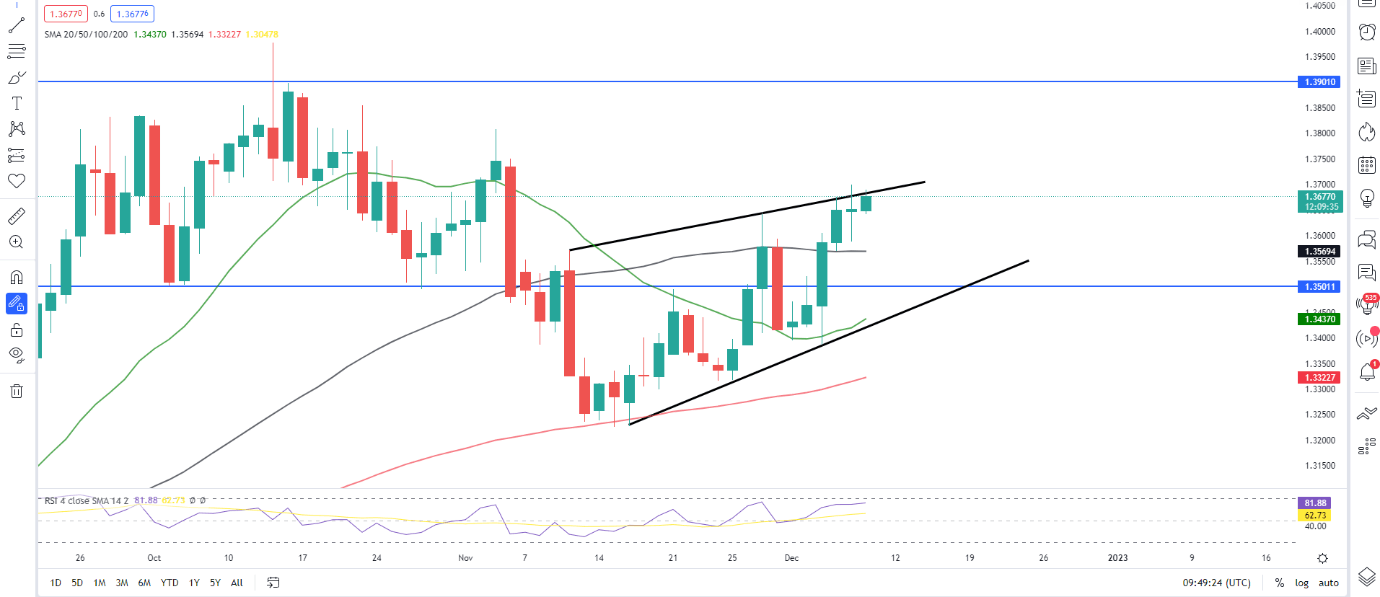
The Canadian Dollar has all but surrendered yesterday’s gains against the greenback following a dovish 50bps hike by the Bank of Canada. USD/CAD dropped 60-odd pips in the immediate aftermath of the announcement before rallying higher during the Asian session and into the European open, currently trading just shy of the one-month high around the 1.37000 handle.

The Bank of Canada signaled that the hiking cycle may be approaching its end as it deals with signs of an economic slowdown. The loonie faced further pressure as oil prices continue their decline printing fresh YTD lows on the back of demand and recession fears. This resulted in a return of haven demand which has kept the US dollar on the offensive as well with higher prices for the pair looking all the more likely.

The recent batch of US data suggests the Federal Reserve may hike rates for longer even if it is in smaller increments. This does not bode well for the Canadian Dollar as continued hiking by the FED and a pause by the Bank of Canada could push USD/CAD higher as we head into the new year. Tomorrow brings US PPI as well as the Michigan consumer sentiment data which could add some dollar strength and perhaps facilitate a move higher for USD/CAD.

Graphical user interface, application  Description automatically generated

For all market-moving economic releases and events, see the DailyFX Calendar

From a technical perspective, USD/CAD is trading at one-month highs with yesterday’s daily candle closing as a doji candlestick highlighting some degree of indecision. As you can see on the chart below the pair is currently testing the top of the wedge pattern and given yesterday’s daily close could see a slight consolidation or even a pullback before breaking higher. Further supporting this narrative is next week’s Federal Reserve meeting which could see dollar bulls remain on the side-lines as the meeting approaches. A retracement may find support at the 50-day MA around 1.35700 with a break lower opening up a test of the ascending trendline of the wedge pattern.

Alternatively, an upside break of the wedge pattern could result in an upside rally around 250-odd pips. To complete a move of that size USD/CAD might require a catalyst such as the FOMC decision due next week.

USD/CAD Daily Chart, December 8, 2022

Chart  Description automatically generated

Source: TradingView, Prepared by Zain Vawda

japan-768x432

Japan fin min Suzuki says its important for FX to move stably in line with fundamentals

Japan finance minister Suzuki says its important for FX to move stably in line with fundamentals. • Will keep monitoring the FX market with a sense of urgency. • FX rates should be set by market. • No change in his stance of responding to FX moves in an appropriate way. • Excess FX volatility, disorderly moves can hut the economy. Rinse, repeat yen comments from Suzuki. He has made similar comments many time during the run higher for USD/JPY over previous months. These are a verbal form of FX intervention.

china-768x576

China to cut gasoline, diesel retail prices

BEIJING, Dec. 5 (Xinhua) — China will cut the retail prices of gasoline and diesel from Tuesday based on recent changes in international oil prices, the country’s top economic planner said Monday.

Gasoline and diesel prices will reduce by 440 yuan (about 62.51 U.S. dollars) per tonne and 425 yuan per tonne, respectively, said the National Development and Reform Commission.

It is China’s second consecutive reduction in gasoline and diesel prices since Nov. 21, which will cut the costs for daily and logistics transportation.

Under China’s current pricing mechanism, if international crude oil prices change by more than 50 yuan per tonne and remain at that level for ten working days, the prices of refined oil products such as gasoline and diesel will adjust accordingly.

China’s three biggest oil companies, namely the China National Petroleum Corporation, the China Petrochemical Corporation, and the China National Offshore Oil Corporation, have been directed to maintain oil production and facilitate transportation to ensure stable supplies.

eurusd-price-forecast-euro-to-us-dollar-price-prediction-768x419

Dollar and Risk Asset Reversals Throw Off Anticipation of Major Tend Developments

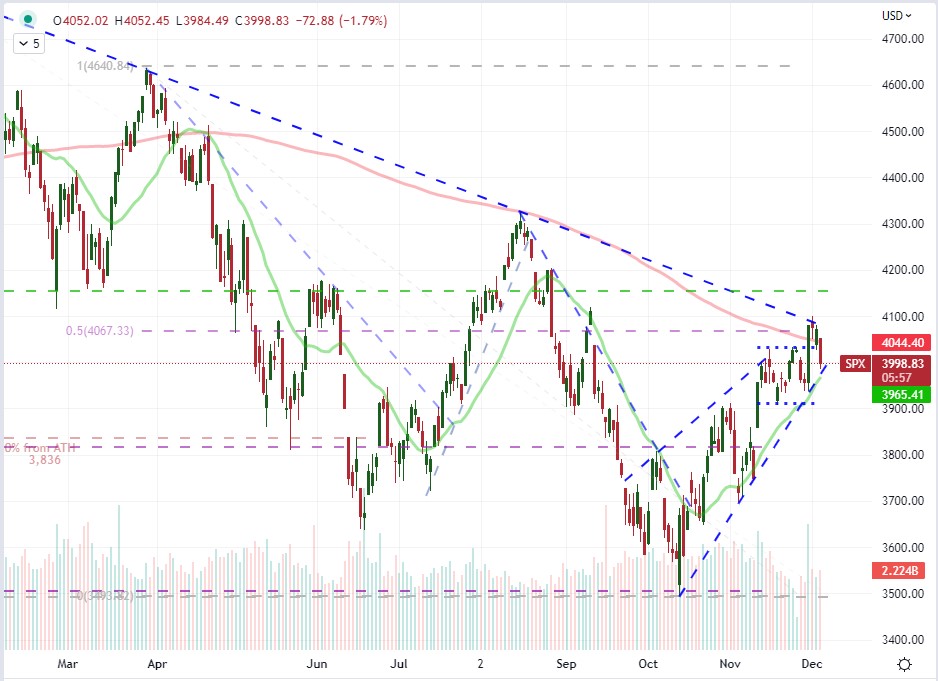
The speculative charge that we had initially witnessed through the middle of last week didn’t exactly reach a rolling momentum heading into the weekend. For risk-leaning assets such as US indices, the technical breakout stalled quickly after launch and maintained some serious overhead resistance. In comparison, the Dollar’s slide was managed to achieve a little more traction in its own slide to five-month lows and through the closely-watched 200-day SMA (on the DXY Index). Both moves have experienced a correction to start the week, opening up discussion as to what the prevailing trend is versus the counter move. Big picture, 2022 has seen an overall bear trend for the S&P 500 – as a benchmark for ‘risk’ – both in the technical sense (20 percent correction from all-time highs) and generalized market participant assessment. Therefore, the -1.8 percent drop from the index Monday could be viewed as simply returning to the prevailing trend or a pullback within the context of the past two month’s rising wedge. This is where technicals can exert a little more influence on bias. While there remains notable fundamental event risk to generate volatility, the heavy-hitting stuff is expected next week. Therefore, for now, my focus remains on the 20-day SMA and wedge floor from the October 13th low at 3,965 as my guide for support while the 2022’s trendline resistance of major swing highs around 4,090 is the roof to congestion.

Chart of the S&P 500 Overlaid with the 20 and 200-Day SMAs (Daily)

I was dubious of the S&P 500’s ability to commit to a trend this week given the anticipation of the FOMC and other key events the week following and the uneven response to the PCE deflator and NFPs through the end of last week. The ISM service sector activity report released this past session added to the erosion of fundamental traction. Generally, the most representative (and timely) measure of the US economy unexpectedly accelerated from 54.4 to 56.6 – fending off the concerns following its factory counterpart released last week. Further, the component readings showed that business activity surged (55.7 to 64.7), employment turned positive (49.1 to 51.5) and the prices gauge was little changed (70.7 to 70.0). Overall, that can feed speculation that the Fed will pursue the higher terminal rate that Powell reiterated last Wednesday, where the market initially focused on the slower pace of hikes comment.

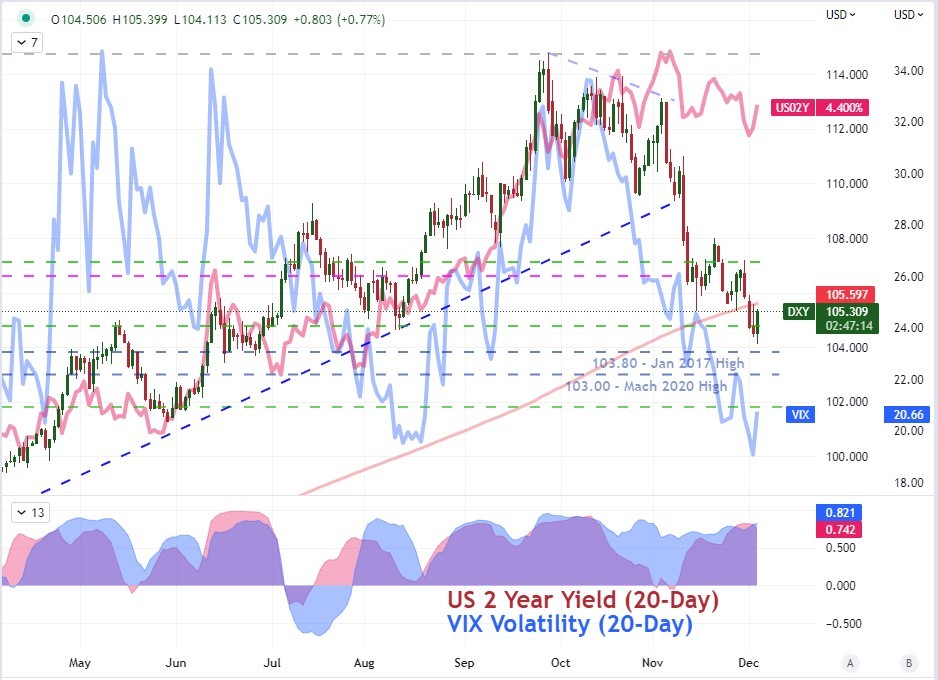
The same backdrop for speculative view likely exists for the US Dollar, but here the pricing the December and terminal rate levels is likely less sensitive. The Greenback charged to multi-decade highs despite many of its peer central banks pursuing tightening regimes of their own. Rates may still matter for the currency, but not in the format we typically suspect. Below, I have overlaid the 2-year Treasury yield (a proxy for Fed Fund rates) and the VIX volatility index (the measure of ‘fear’). Both enjoy a high correlation to the Dollar over a 20-day rolling basis, suggesting it is playing the role of a traditional carry currency. Will this be enough to restore the bulls?

Chart of the DXY Dollar Index with 20 and 200-Day SMAs, 20-Day Rate of Change (Daily)

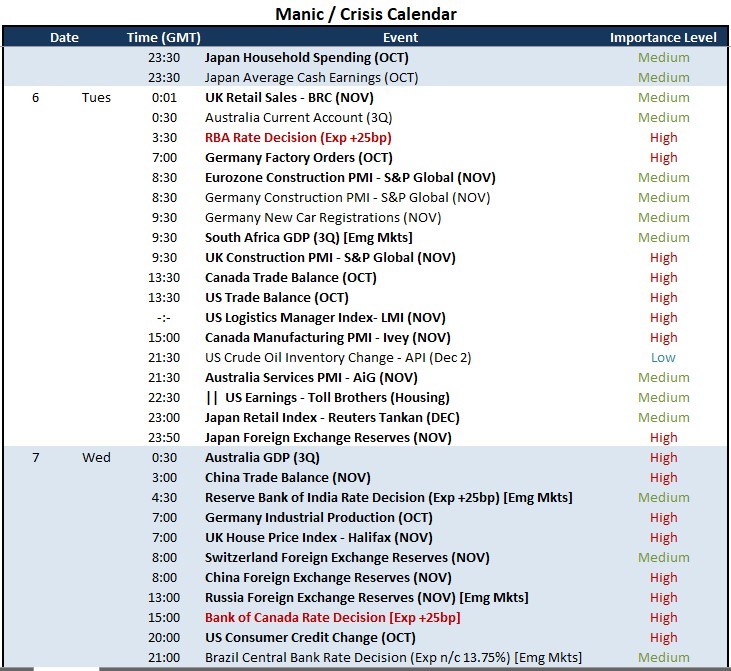
One consideration working against the prospect of the Dollar mounting a serious recovery trend is the lack of sizable event risk ahead. It is possible that a general bias can carry the market to a meaningful trend, but such productive movement usually requires serious conviction. There are macro events to monitor on the docket, but nothing that stands out as a capable of redefining the scale of sentiment nor the Fed’s overall monetary policy ambitious. The US trade balance and LMI Logistics Manager Index for October and November respectively can offer insight, but are unlikely to change the tone of the market. Nothing of that magnitude from the US side really shows up until Friday’s UofM Consumer Confidence survey; but by that time, we will be in the full pull of the FOMC rate decision on December 14th.

Critical Macro Event Risk on Global Economic Calendar for Next 48 Hours

Calendar Created by John Kicklighter

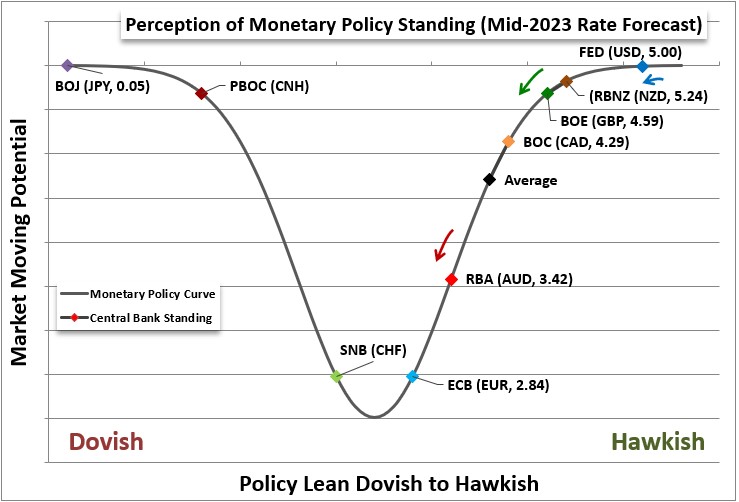
Speaking of rate decisions, we are coming into the run of major developed and emerging market central bank rate decisions scheduled for this week. Kicking off Tuesday trade, we are due the Reserve Bank of Australia’s (RBA) call on stance. The economist consensus is for a 25bp hike to a 3.10 percent benchmark. The tempo and previous statements suggests this central bank is nearing the terminal rate more quickly than counterparts like the Fed. Less than a month ago, the forecast for the RBA’s benchmark rate via futures suggested the group would lift up to a level around 3.90 percent, but the same instruments are currently pricing in a 3.42 percent level by mid-2023. The 25bp move at this meeting will likely generate little heat among Aussie traders (unless they hold or hike more aggressively), rather the focus will be on the rhetoric. If they indeed depress the breaks further, it could extend the AUDUSD correction or urge a 91 break from AUDJPY. Looking a little further ahead, it will be important to be mindful that the Bank of Canada is up on Wednesday along with the Reserve Bank of India and Brazilian Central Bank.

Graph of Relative Monetary Policy Standing of Major Central Banks


trading-plan_body_Actionplantradingplan-Copy

How to Create a Trading Plan in 7 Steps

What is a Trading Plan?

A trading plan is essentially a framework that guides traders through the entire trading process. It sets the conditions under which a trader enters trades, identifies markets, exits trades and manages risks along the way. The trading plan ensures accountability and keeps traders focused on their personal strategy.

trading plan on the wall

How to Create a Trading Plan

1) Choose Your Analytical Approach

The analytical approach answers the question, “how do you identify trade set-ups?”. It could be a combination of price support and resistance, trend lines, chart patterns, Fibonacci levels, moving averages, Ichimoku Clouds, Elliott Wave Theory, sentiment or the use of fundamentals etc.

This initial step of the trading plan helps traders to narrow their focus on a handful of scenarios that the trader is comfortable with. Thereafter, traders can look for opportunities to trade based on preferred trade set ups.

2) Select Your Favourite Trade Set Ups

The trade set up is at the core of the trading process. But first, think of the analytical approach as the event that triggers the trade set up. An example of this would be viewing a consolidation pattern (listed in the analytical approach as a chart pattern) which then gives rise to subsequent action from the trader, i.e. the trader will decide to trade the breakout or wait for a pullback or combine breakouts with pullbacks only after the chart pattern has successfully played out.

Set ups are based on a number of factors that collectively lead to higher probability trades. If you are new to forex trading, this process may take some time to figure out but it is essential for traders to find a trade set up that works best for them.

3) Limit the Markets to Focus on

When starting out, it is important for traders to limit the number of markets in focus. No market is the same and limiting the scope of markets can assist traders to understand the nuances of the market in question. Traders can even focus on specific time frames on a single market to familiar themselves with its characteristics and movements.

4) Think About Your Holding Period

Time frames will depend on the type of trader. Traders that focus on short term trades (trades opened and closed on the same day) include scalpers and day traders. Medium term traders usually hold trades for a few hours up to a few days and are referred to as swing traders. Long term trading involves time frames ranging from a number of days, weeks, months and in some cases, years.

Planning is essential to any trading plan

5) Know Your Risk Tolerance

Each step in the trading plan is important, however, if risk management is missing, the whole plan will fall apart. In this step traders will need to discover their personal risk tolerance which corresponds with how far a trader is willing to set stop losses when limiting downside risk.

At DailyFX, we researched over 30 million live trades to discover that traders with a minimum risk to reward ratio of 1:1 were three times more likely to turn a profit than traders without any defined risk to reward. This and other information all traders should know can be found in our Traits of Successful Traders report.

6) Plan How You Will Handle Adversity (and Success)

All traders will eventually experience the dreaded drawdown, so it is important for traders to set a few rules to follow once this happens in order to manage emotions. An effective way to do this is to quantify an amount, or percentage loss, that would force the trader to take a step back and evaluate what went wrong/ is going wrong. Do not fall into the trap of setting this figure along the way, rather quantify this upfront.

 Now the good news – what to do when trades are successful. Confidence is good, but overconfidence can quickly turn winning trades into losing trades. If the market moves favourably it is not unusual to increase risk/exposure however, this should be kept to a minimum.

7) Have a Routine For Staying on Track

Traders should set aside time to reflect on the week’s events and analyze individual trades. It’s a good idea to regularly review the trading plan and make tweaks if necessary. Periodical trade review and journaling are excellent ways to ensure you are following the process outlined in the trading plan. Make a note or save charts relating to successful/unsuccessful trade set ups that can be reviewed later on.

Trading plans should be rigid to begin with but should become a little more malleable as the trader becomes more familiar with the market in focus. The purpose of a trading plan is to give you a strong foundation and boundaries to operate within.

Trading Plans: A Summary

  • Traders should implement a trading plan in order to establish a clear framework when navigating financial markets.
  • Be disciplined and find out what works best for you. Read our trading guide on how to build your confidence in trading.
  • Regularly track your progress in a trading journal and review the current trading plan. Make alterations if needed.
  • For more information, check out Senior Analyst Tyler Yell’s dedicated podcast on the importance of a trading plan and how to put one together.