08166635848

Crude Oil Eyeing 7 Percent Drop this Week So Far as Retail Bets Becoming More Bullish

Crude Oil Eyeing 7 Percent Drop this Week So Far as Retail Bets Becoming More Bullish

Crude oil prices are on course to sink nearly 7 percent this week so far. If confirmed, this could end up being the worst 5-day period for WTI since the middle of March. Retail traders are now increasingly boosting upside exposure. This can be seen by taking a look at IG Client Sentiment (IGCS), which could have a key influence on where the commodity goes from here.

Crude Oil Sentiment Outlook – Bearish

According to IGCS, about 57% of retail traders are net-long crude oil. Since most of them remain net-long, this hints that prices may continue falling down the road. This is as upside bets increased by 33.08% and 67.76% compared to yesterday and last week, respectively. With that in mind, the combination of overall exposure and recent changes offers a stronger bearish contrarian trading bias.

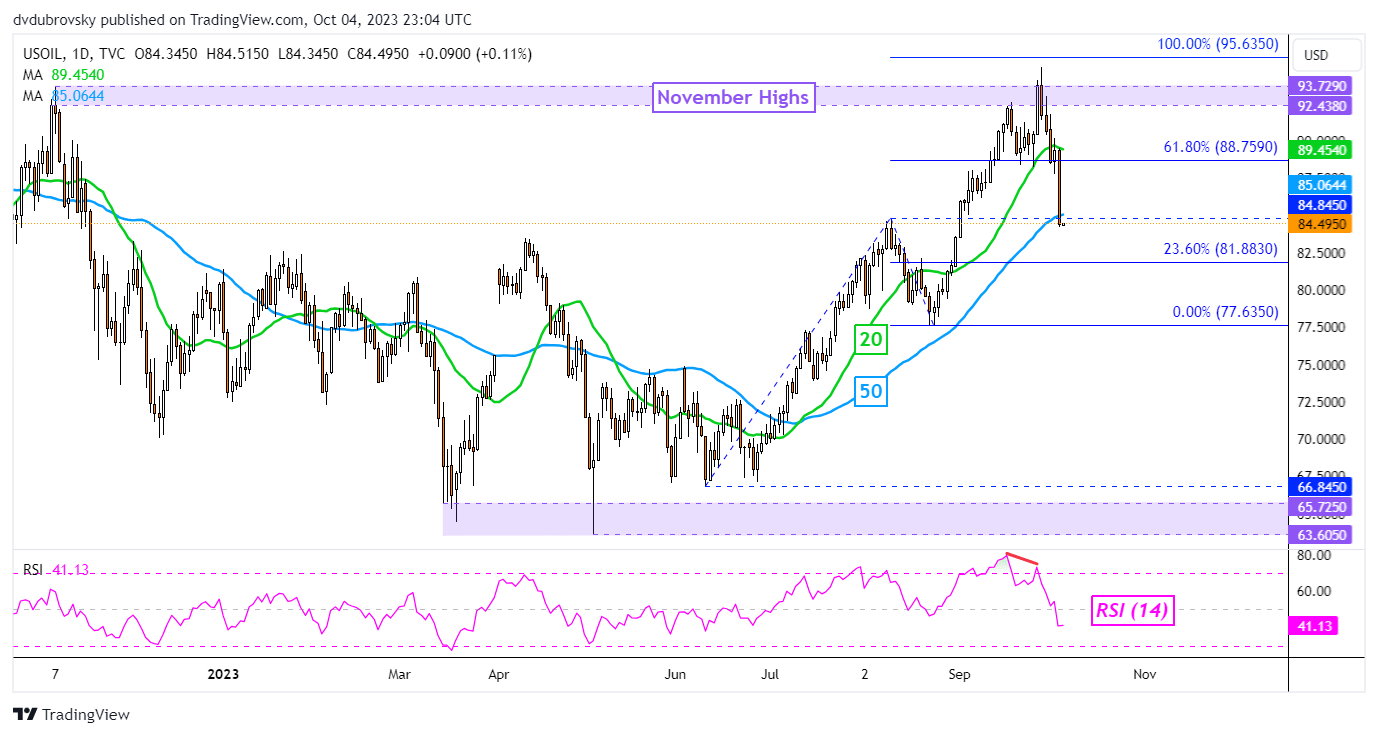
On the daily chart below, WTI has confirmed a breakout under the 20-day moving average and recently closed under the 50-day moving average. However, confirmation of a breakout under the latter has yet to be achieved. That said, recent losses followed negative RSI divergence, which showed that upside momentum was fading.

From here, recent losses have exposed the 23.6% Fibonacci extension level of 81.88, which is immediate support. Further losses beyond that place the focus on the August low of 77.63. Otherwise, in the event of a turn higher, keep a close eye on the 84.84 inflection point from the August peak.

Crude Oil Daily Chart

Crude Oil Daily Chart

British Pound Technical Update: GBP/USD, EUR/GBP Show that Sterling Remains Pressured

British Pound Technical Update: GBP/USD, EUR/GBP Show that Sterling Remains Pressured

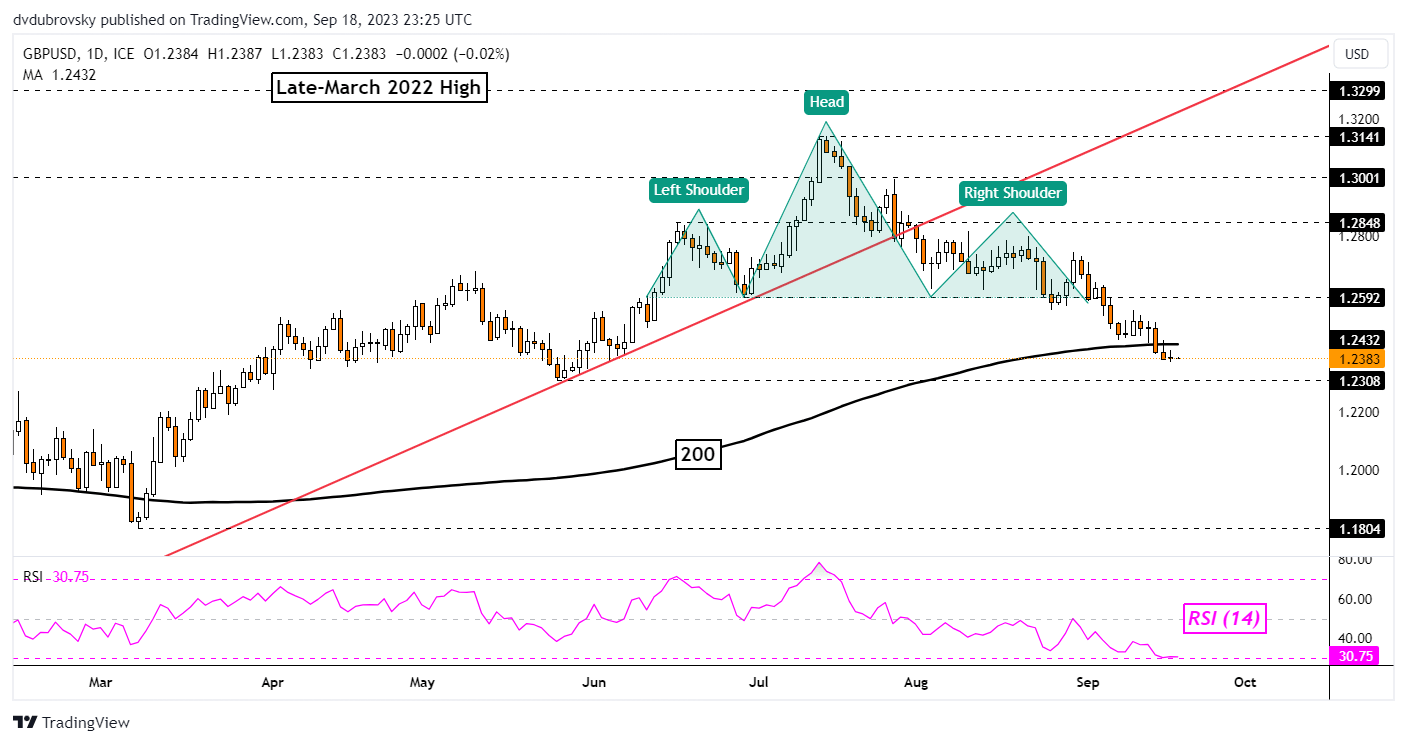
The British Pound may be readying to extend its losing streak against the US Dollar. For context, GBP/USD has been aiming lower since breaking under a bearish Head & Shoulders chart formation, opening the door to an increasingly downward technical bias. Now, prices have confirmed a breakout under the 200-day Moving Average.

That is further underscoring the bearish GBP/USD view, placing the focus on immediate support which is now the May low of 1.2308. This will likely be the next key test. Pushing lower underscores, the near-term bearish bias. Otherwise, a turn higher places the focus back on the neckline of the Head & Shoulders, which is around 1.2592.

image1.png

Chart Created in TradingView

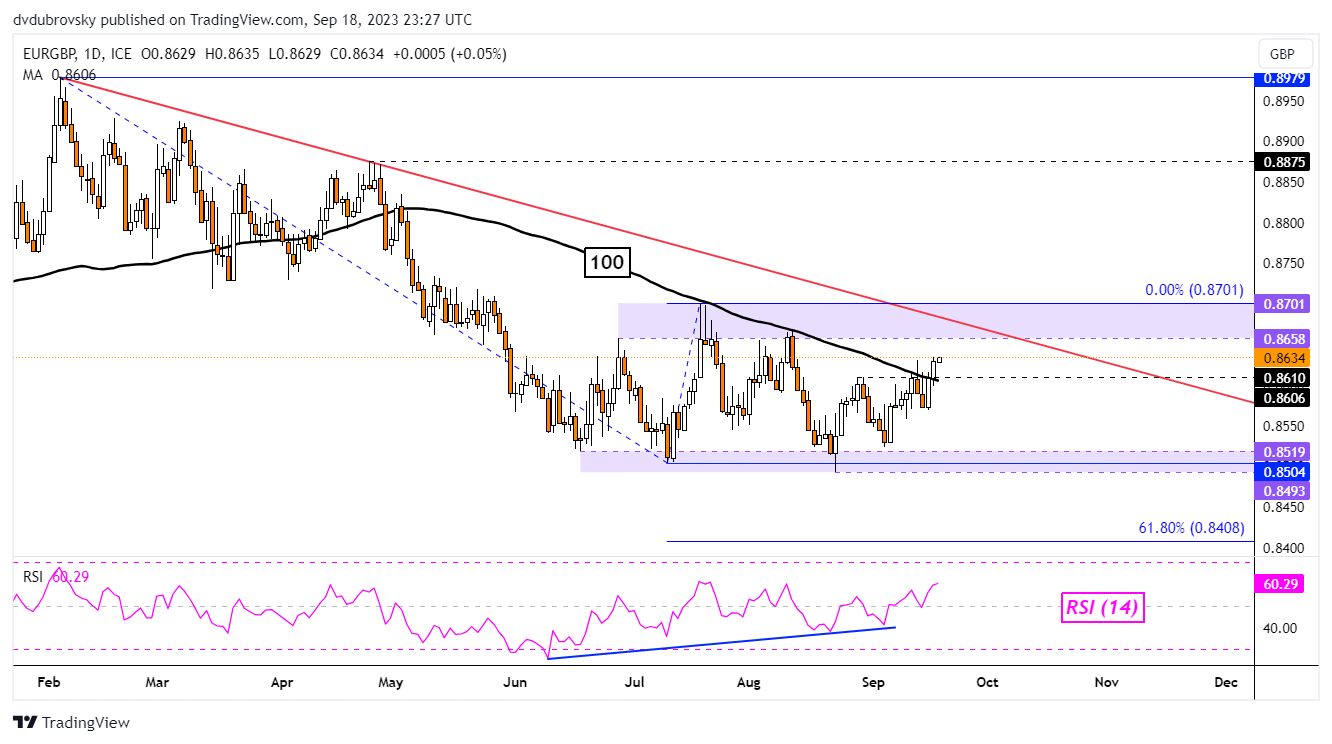
Meanwhile, the British Pound is also losing ground to the Euro. On the daily chart below, EUR/GBP is attempting to confirm a breakout above the 0.861 inflection point and the 100-day Moving Average. While this could open the door to a stronger bullish technical bias for the exchange rate, the broader horizon remains neutral.

EUR/GBP remains in a consolidative setting between resistance (0.8658 – 0.8701) and support (0.8493 – 0.8519). Recent progress does open the door to revisiting the former, as well as the broader falling trendline from February. These could hold as resistance. As such, there is more work for EUR/GBP to do before shifting to a stronger bullish technical bias.

The Fundamentals of Breakout Trading

The Fundamentals of Breakout Trading
Recommended by Daniel Dubrovsky
The Fundamentals of Breakout Trading
Get My Guide

image2.png

Chart Created in TradingView

Market relief in Wall Street amid China’s jitters: Russell 2000, Straits Times Index, AUD/USD

Market relief in Wall Street amid China’s jitters: Russell 2000, Straits Times Index, AUD/USD

Wall Street managed to start the week higher (DJIA +0.07%; S&P 500 +0.57%; Nasdaq +1.05%), tapping on some recovery in big tech and semiconductors to override earlier jitters around China’s property and financial sector risks. There was not much to note on the economic calendar overnight, with the relief potentially attributed to the positive view on Nvidia from Morgan Stanley, along with some attempt to stabilise after recent sell-off.

US Treasury yields continue its way higher, with the 10-year yields back at its year-to-date high around the 4.2% level. The two-year yields edged near its 5% level as well, largely a reflection for US rates to be kept high for longer. The US dollar index tapped on higher yields to gain 0.3%, but are now facing a crucial test of resistance at its 200-day moving average (MA), which it has not overcome since November 2022. Its weekly relative strength index (RSI) is hanging at its key 50 level as well, suggesting that its moves over the coming days may be critical in determining the trend ahead.

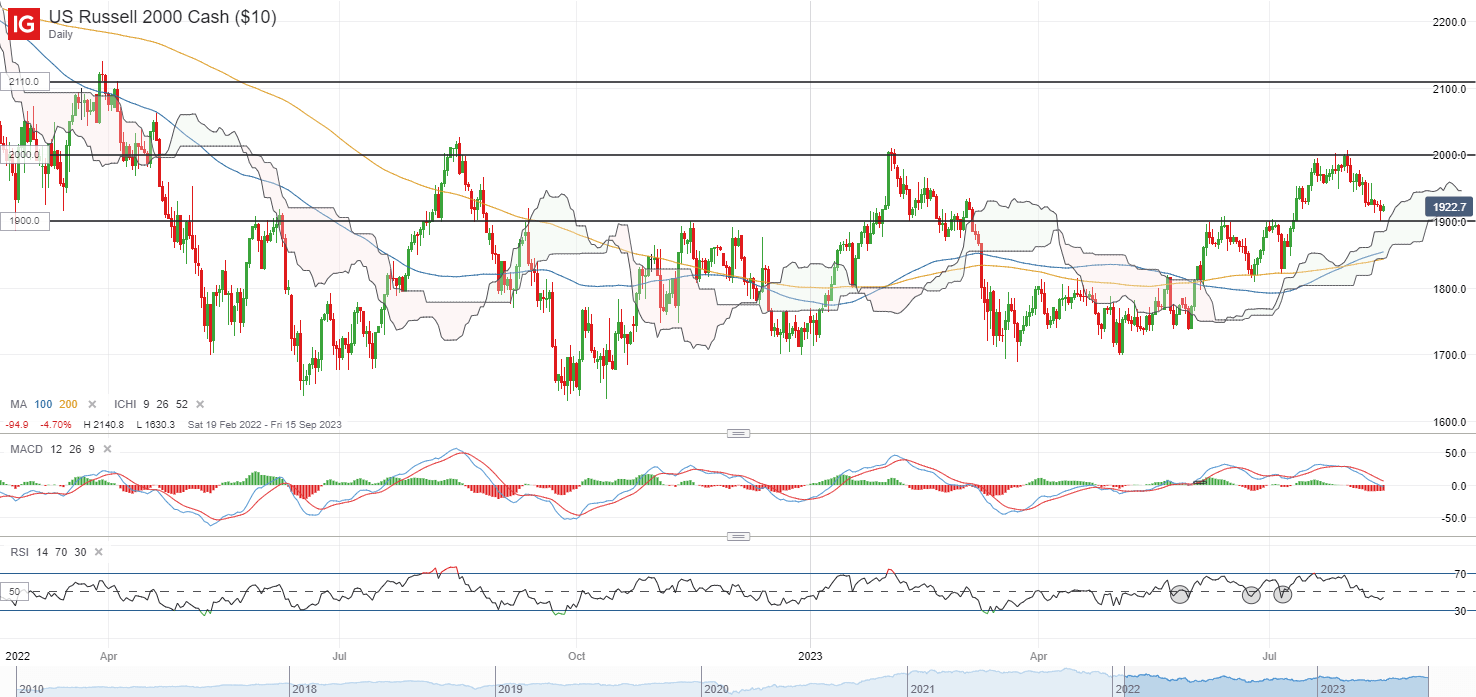
Perhaps one to watch may also be the Russell 2000 index, which is currently back at its previous horizontal resistance-turned-support at the 1,900 level, in coincidence with the upper edge of its Ichimoku cloud on the daily chart. A long-legged candle denotes some overnight dip-buying, but buyers may potentially find greater conviction from a move in the daily RSI back above its 50 level. For now, the 1,900 level will need to see some defending, failing which may pave the way towards the 1,820 level next.

image1.png

Asia Open

Asian stocks look set for a positive open, with Nikkei +0.70% and ASX +0.38% at the time of writing. South Korean markets are off-trading for Liberation Day. Despite the relief in Wall Street, Chinese equities are more subdued, with the Nasdaq Golden Dragon China Index down 0.5% overnight.

Economic releases this morning saw a pull-ahead in Japan’s 2Q GDP (annualised 6% vs 3.1% forecast), the strongest expansion since 4Q 2020. The data is likely to provide the Bank of Japan (BoJ) with more room for normalisation, although the initial short-lived bounce in the Japanese yen seems to reflect some market expectations that patience from the central bank is still the likely stance.

Ahead, focus will be on the Reserve Bank of Australia (RBA) minutes. At the previous meeting, the RBA has kept its tightening bias in place for some policy flexibility, so the minutes will be scrutinised on the factors to guide the RBA’s next decision. The China’s monthly economic data dump will be in focus as well. Industrial production is expected to stay unchanged, while retail sales are projected to recover to 4.5% from previous 3.1%. The downside surprises in economic data lately may leave room for disappointment and it may still have to take a trend of recovering economic data to convince markets that the worst is over.

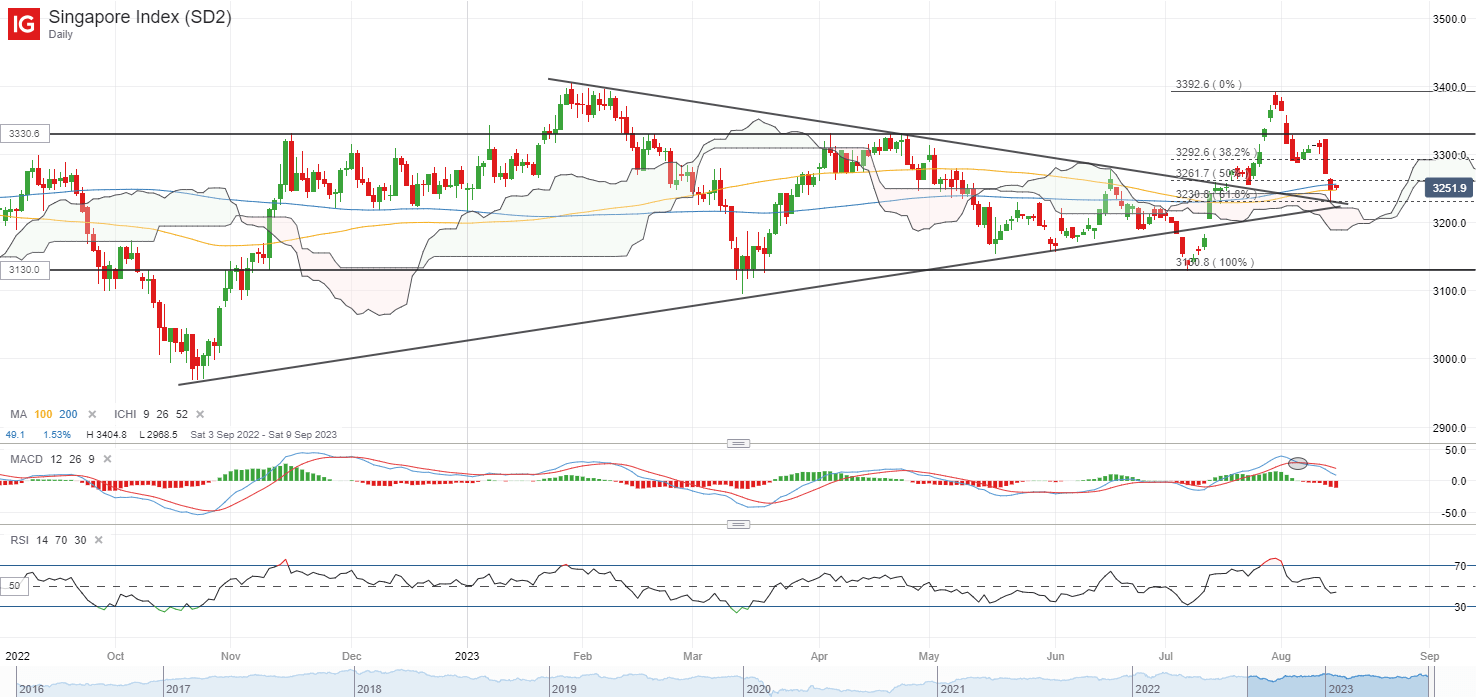
The Straits Times Index is attempting to defend its trendline support after unwinding all of its past month’s gains, alongside its 200-day MA at around the 3,245 level. Failure to defend the trendline support with a break below its 3,230 level may potentially support a move to retest its July 2023 bottom at the 3,130 level. On any upside, the 3,260 level will be an immediate resistance to overcome.

image2.png

On the watchlist: AUD/USD attempting to find support from year-to-date low

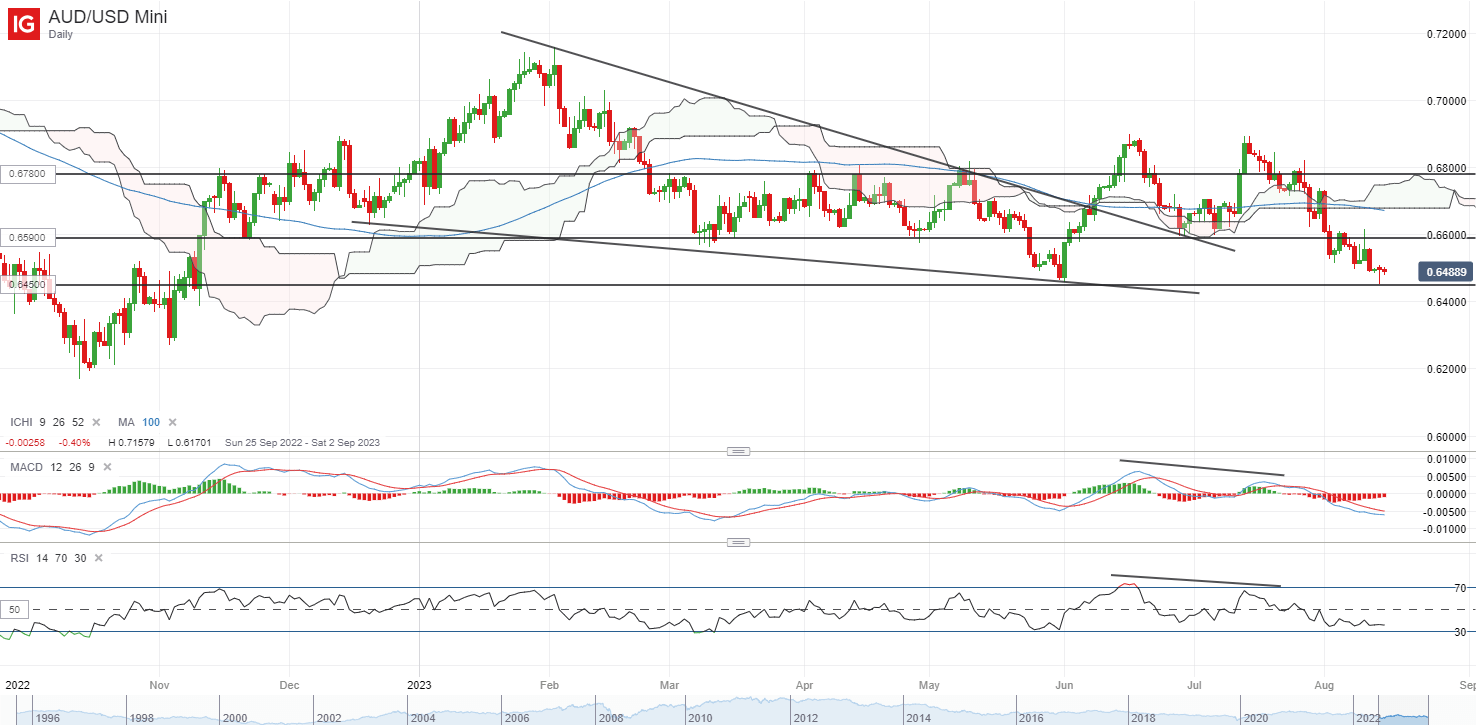
Ahead of the RBA meeting minutes and China’s economic data today, the AUD/USD is tapping on some relief in the risk environment overnight to hold its year-to-date bottom at the 0.645 level. The formation of a bullish pin bar on the daily chart reflects some near-term dip-buying, although one may watch for a confirmation close to potentially support a move to retest the 0.659 level.

Thus far, rate expectations remain firm that the RBA is nearing the end of its hiking cycle but the central bank’s data-dependent stance will still leave eyes on incoming data such as wage growth and inflation for confirmation. For now, while there is an attempt to stabilise after recent sell-off, the broader trend still seems to carry a sideway to downward bias, with the weekly RSI hanging below the 50 level. The year-to-date bottom at the 0.645 level may have to see some defending ahead for some near-term relief.

image3.png


Japan’s Fiscal Plight Draws Scrutiny After BOJ Tweak to YCC

Japan’s Fiscal Plight Draws Scrutiny After BOJ Tweak to YCC

The Bank of Japan’s tweak to its yield curve control mechanism created another reason to take a look at the nation’s fiscal conditions, as Tokyo seeks to expand spending on defense and childcare while shouldering a massive public debt.

BOJ Governor Kazuo Ueda’s loosening of restraints on 10-year bond yields prompted speculation among some that the end of the YCC program was somewhere on the horizon, and with it the quantitative easing program that allowed the government to grow the national debt to almost 260% of gross domestic product, the most in the developed world. With Tuesday’s move by Fitch Ratings to downgrade US government credit, Japan’s creditworthiness may also come under question if rates rise.


Ueda’s YCC adjustment was “a message to the government that it now will have to do financial management responsibly, because the BOJ won’t control yields as firmly as it used to,” said Takahide Kiuchi, economist at Nomura Research Institute Ltd. and a former BOJ board member. “Yields will rise if markets lose faith in their management.”

In the decade since then Bank of Japan Governor Haruhiko Kuroda launched his monetary bazooka in a bid to end entrenched deflation, the central bank has held the spotlight for economists and traders attempting to assess the outlook for Japan’s economy.

The prolonged period of rock-bottom interest rates, which predates Kuroda’s aggressive actions in 2013, helped turn fiscal policy into something of an afterthought, as the BOJ’s version of QE — YCC — ensured that the government could sell as much debt as needed and would always find a buyer.

Now some economists see near-term risks if rising rates complicate financing operations. “If talk emerges of a possible cut to Japan’s credit rating, it’s possible upward pressure would push yields over 1%,” said Shinichiro Kobayashi, chief economist at Mitsubishi UFJ Research and Consulting.

Japan’s credit ratings have been stuck in a downward trend for three decades. S&P last changed its assessment in 2015, when it cut its sovereign long-term rating to A+.

If 10-year yields rise by 1 percentage point from a base case, Japan’s debt-servicing payments are expected to increase by 3.6 trillion yen by fiscal year 2026, according to Finance Ministry calculations. Japan is expected to spend 22.1% of its 114 trillion yen ($795 billion) national budget for this year on debt-servicing costs.

Yields on those securities touched a fresh nine-year high of 0.65% Thursday, prodding the BOJ to announce an unscheduled bond-purchase operation for the second time this week in a sign of its determination to support the market.

For now, the mood in the finance ministry is calm. Given the nation’s enormous outstanding debt, the ministry needs to issue JGBs in a stable manner over the medium-to-long term without being constrained by short-term financing costs, said a senior official who asked not to be named. He noted that in addition to controlling short-term costs, authorities manage debt policy with an eye on preserving market functionality, so last week’s tweak to YCC is in line with the ministry’s thinking.

If investors lose faith in Japan’s fiscal management, and begin to fret over the safety of JGBs, negative sentiment could build on itself, warned Yasunari Tanaka, researcher at Mitsubishi Research Institute Inc.

“Foreign investors would shift from JGBs to other countries’ bonds if they believed JGBs to be risky,” Tanaka said. “This would lead to higher interest rates, which in turn would lead to a further deterioration of public finances.”

Tanaka emphasized that he doesn’t foresee a crisis, but a slow period of deterioration could mean further increases in interest rates lead to “a negative spiral.”

Moody’s Investors Service said last week’s YCC tweak probably won’t create headwinds for the finance ministry. “In the absence of a more fundamental shift in monetary policy toward tightening, we expect that interest rates will not rise so much that they undermine credit conditions for Japanese issuers over the next year,” analysts at Moody’s wrote in a report Monday.

A saving grace for Japan is that Japanese investors still own a large portion of outstanding JGBs, with the BOJ itself holding more than 50%. Less than 15% of all public debt was held by overseas investors as of the end of March. Before Kuroda launched his stimulus program in 2013, the central bank held 11.6% of outstanding debt.

Also, the BOJ’s failure to reinflate the economy through its ultraeasy policy may prevent problems for fiscal policy. Ten-year yields wouldn’t go up to 1% “even if the BOJ says it’s OK to get there,” said Kiuchi at Nomura Research. “That means that the BOJ hasn’t been able to generate much of an stimulative impact for the economy by holding down yields.”

Ueda’s assertion that the YCC tweak didn’t represent a first step toward policy normalization will assure Prime Minister Fumio Kishida and the finance ministry that the economy — and the government’s funding operations — will continue to benefit from low rates.

“The BOJ won’t say publicly, but it’s important to consider the impact on Japan’s finances,” Chotaro Morita, senior fellow at SMBC Nikko Securities, wrote in a report Tuesday. “It wants to avoid creating the impression there might be an abrupt increase in fiscal costs due to YCC adjustments.”

–With assistance from Emi Urabe, Yoshiaki Nohara and Yumi Teso.

©2023 Bloomberg L.P.

Top P

China raises foreign debt limit

China raises foreign debt limit

China increased the macro-prudential adjustment parameter for cross-border financing of corporates and financial institutions to 1.5 from 1.25 on Thursday, a move that experts said will help boost confidence in the renminbi, the Chinese currency.

The People’s Bank of China, the country’s central bank, and the State Administration of Foreign Exchange announced in a joint statement on Thursday the intention to raise the parameter, which allows Chinese companies and financial institutions to borrow more from overseas.

The move is aimed at expanding the cross-border funding sources of enterprises and financial institutions and encouraging them to optimize their asset-liability structure, the statement said.

AUD/USD Price Forecast: Aussie Sinks on Lackluster RBA and Chinese Rates

AUD/USD Price Forecast: Aussie Sinks on Lackluster RBA and Chinese Rates

AUSTRALIAN DOLLAR FUNDAMENTAL BACKDROP

The Australian dollar is on offer this morning against the US dollar even though the greenback remains relatively flat as measured by the DXY index. The selloff stemmed initially from concerns around the Chinese economy as the PBoC cut both the 1-year and 5-year loan prime rates by only 10bps respectively (refer to economic calendar below). In a push to stimulate economic growth, we may see further rate cuts going forward and with China’s low inflation relative to other major global economies, there is little in the way of limitations to continue easing monetary policy. Being a major trading partner with China, the grim outlook will hinder commodity exports from Australia thus weighing negatively on the Aussie dollar.

AUD/USD ECONOMIC CALENDAR (GMT +02:00)

image1.png

The Reserve Bank of Australia (RBA) minutes then followed which highlighted the indecision in the last meeting to hike rates but with the surprise hike, July’s expectations are slightly skewed towards a rate pause as depicted in the table below – following the trend of the Fed. Economic data inputs will be of utmost importance leading up to the meeting as data dependency becomes more and more important for the RBA.

Later today, focus shifts to Fed speak as well as building permit data for the US. Recent releases have ben on the decline but estimates point to a marginal uptick that could be a net positive for the dollar.

RBA INTERST RATE PROBABILITIES

image2.png

TECHNICAL ANALYSIS

AUD/USD DAILY CHART

image3.png

Daily AUD/USD price action is now marginally above the 0.6800 psychological level after slipping below briefly during the Asian trading session. Coming off overbought levels as measured by the Relative Strength Index (RSI) makes the move unsurprising from a technical analysis point of view and has rom to move further. That being said, there may be the possibility of a bullish crossover known as the golden cross where the 50-day MA (yellow) crosses above the 200-day MA MA (blue). This could mean the current downward bias may be short-lived in the medium-term.

Key resistance levels:

  • 0.6900
  • 0.6856

Key support levels:

  • 0.6800
  • 0.6772
  • 0.6700

IG CLIENT SENTIMENT DATA: MIXED

IGCS shows retail traders are currently net HORT on AUD/USD, with 51% of traders currently holding short positions. At DailyFX we typically take a contrarian view to crowd sentiment resulting but due to recent changes in long and short positioning, we arrive at a short-term cautious disposition.

Japanese Yen Week Ahead as Fed Skip Bets Grow: USD/JPY, EUR/JPY, AUD/JPY

Japanese Yen Week Ahead as Fed Skip Bets Grow: USD/JPY, EUR/JPY, AUD/JPY

The Japanese yen’s slide appears to be losing steam as US Federal Reserve rate hike expectations take a ‘U’-turn after dovish remarks from central bank officials.

The market is now pricing in a 79% chance of a pause at the June 13-14 FOMC meeting, compared to 35% a week ago, after several Fed officials including the vice chair-designate pointed toward a ‘skip’ in June. “Skipping a rate hike at a coming meeting would allow the Committee to see more data before making decisions about the extent of additional policy firming,” vice chair nominee Philip Jefferson said late last week.

However, any decision to hold rates steady should not be viewed as the end of the tightening cycle, the vice chair nominee added. Fed Chair Powell last month left the door open for a pause at the June meeting given the tightening in credit conditions, but reiterated that the central bank would now make decisions “meeting by meeting”.

USD/JPY Daily Chart

image1.png

Meanwhile, Japan’s Q1 GDP data and Econ Watchers Survey are due on Thursday, which could shed some light on the economy. Macro data have been underwhelming with the Economic Surprise Index for Japan at the lowest level since January. With Japan’s headline inflation showing signs of moderation and the Bank of Japan’s (BOJ) persistence with ultra-loose policy settings, there are very few monetary policy cues to push USD/JPY meaningfully in either direction as of now. For more discussion see “Making Sense of Japanese Yen’s Recent Slide: Is it the Start of a Renewed Leg Lower?”, published June 1.

USD/JPY 240-minute Chart

image2.png

Chart Created by Manish Jaradi Using TradingView

USD/JPY: Holding above a key cushion

USD/JPY has rebounded from quite strong converged support on the 89-period moving average and the lower edge of the Ichimoku cloud on the 240-minute charts. However, as the colour-coded candlestick charts show, USD/JPY remains in a consolidation phase within the broader short-term bullish phase (see the 240-minute chart).

The pair last week retreated from a stiff hurdle on the median line of a pitchfork channel from January (at about 141.30), roughly coinciding with the upper edge of a rising channel also from the start of the year. Last week’s high of 141.00 could continue to pose constraints on the latest rebound. On the downside, USD/JPY would need to drop below the mid-May low of 133.75 for the immediate upward pressure to fade.

EUR/JPY Daily Chart

image3.png

Chart Created by Manish Jaradi Using TradingView

EUR/JPY: Sideway price action could stretch a bit

The sharp drop in momentum even as EUR/JPY last week attempted to retest the early-May high of 151.60 is a sign that the cross could be due for an extended consolidation given the March-May rally. This follows a retreat from the upper edge of a rising channel from mid-2022 (see chart). There’s no threat to the broader uptrend unless EUR/JPY were to break below the 145.50-146.50 floor. In sum, EUR/JPY could be settling in a 146.00-152.00 range in the interim.

AUD/JPY Daily Chart

image4.png

Chart Created by Manish Jaradi Using TradingView

AUD/JPY: Struggles at a key ceiling

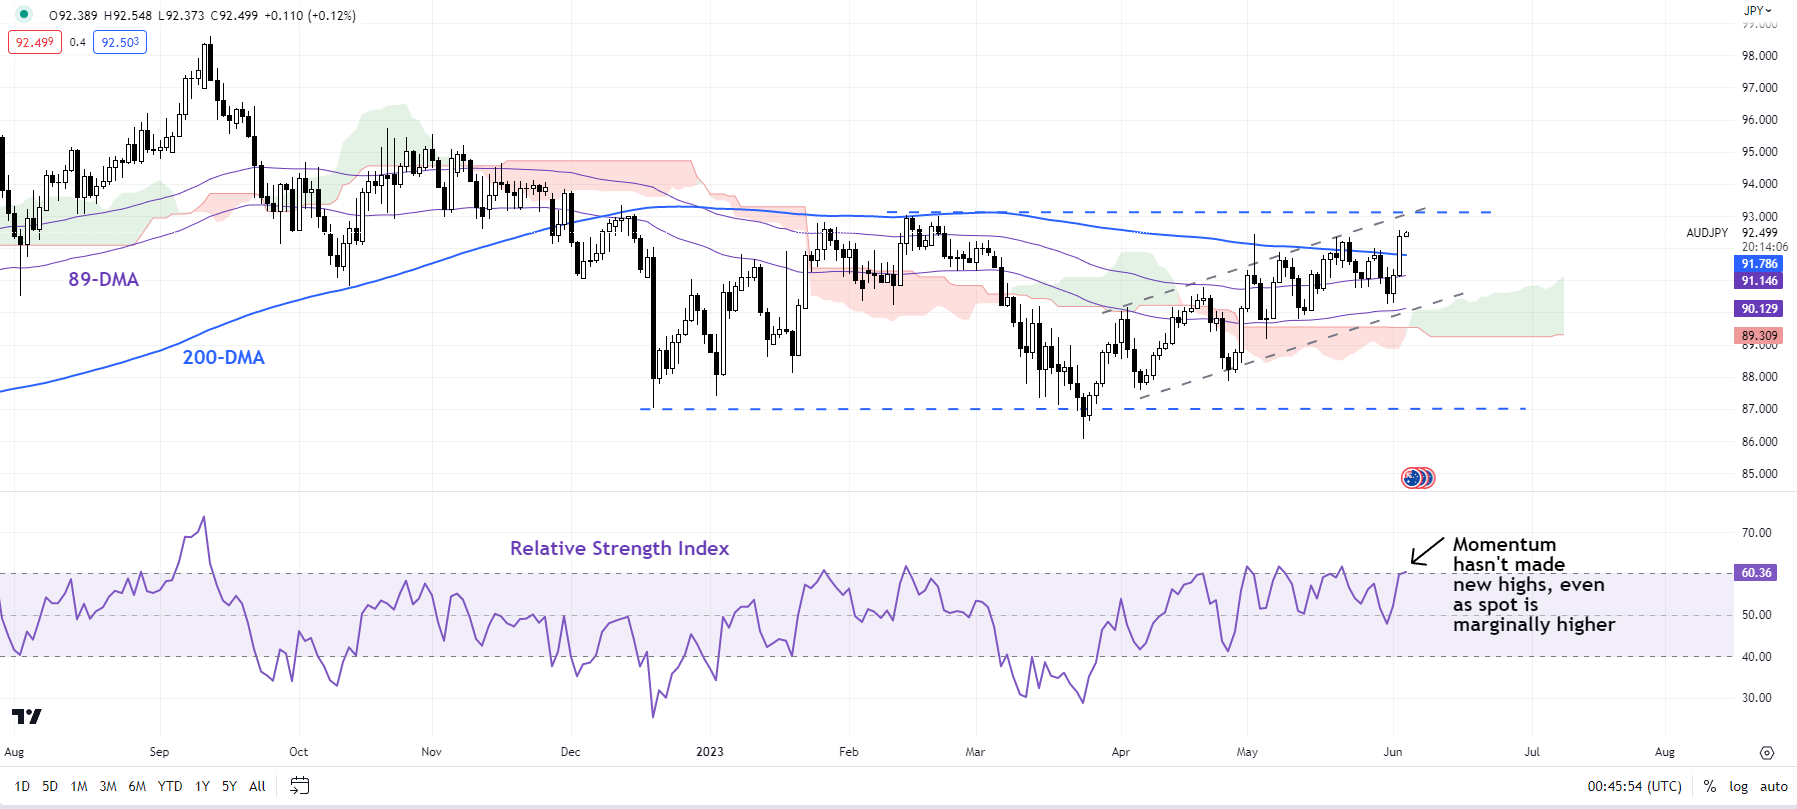
AUD/JPY is once again testing the tough converged barrier on the 200-day moving average, coinciding with the February high of 93.00. Interestingly, momentum hasn’t picked up substantially to reflect the renewed strength that the cross showed last week. Nevertheless, the cross needs to clear the cap for the outlook to improve materially. An encouraging sign for bulls is that AUD/JPY hasn’t broken any support, keeping alive the possibility of an eventual break higher.

US Dollar Holds the High Ground While Crude Oil Whips Around. Higher USD?

US Dollar Holds the High Ground While Crude Oil Whips Around. Higher USD?

The US Dollar added modest gains to Friday’s rally on Monday as markets digest the OPEC+ production cut agenda that was announced over the weekend.

USD had been assisted by a mixed jobs report on Friday that was overall seen as more positive than negative. Currency markets have had a quiet start to the week so far.

339k jobs were added in May according to the non-farm payrolls data. This beat the 195k anticipated and there was also an upward revision to the April figure to 295k from 253k.

However, the unemployment rate ticked up to 3.7% from 3.4% previously and above the 3.5% anticipated.

APAC equity indices have generally had a positive day after Wall Street notched up decent gains in their cash session to end last week after the resolution of the debt ceiling deal lifted the mood. Futures are pointing toward a subdued start to Monday.

The mood was buoyed by China’s Caixin services PMI May reading of 57.1 instead of the 55.2 expected and 56.4 prior.

The OPEC+ announcement of a reduction in oil production output among the cartel saw Saudi Arabia bearing the brunt of cutbacks. They will be reducing their contribution to global supply by 1 million barrels per day.

The UAE received an increase in its production target while Russia’s remains unchanged.

Crude spiked higher on the open today but has since given up a chunk of the gains although prices are still above where they closed the Friday session.

The WTI futures contract is near US$ 72.50 bbl while the Brent contract is a touch below US$ 77 bbl. Live prices can be viewed here.

Treasury yields have remained elevated to start the week with the 1-year bond remaining near the 23-year high above 5.30%.

June 14th is the next Federal Open Market Committee (FOMC) meeting, and the blackout period began over the weekend. This means that committee members will not be making any public comments about policy until after the gathering.

Looking ahead, after the Swiss CPI and Eurozone PPI, the US will see factory and durable goods orders data. Tomorrow the RBA will decide on monetary policy followed by the Bank of Canada on Wednesday.

Check the calendar for more events.

DXY (USD) INDEX TECHNICAL ANALYSIS

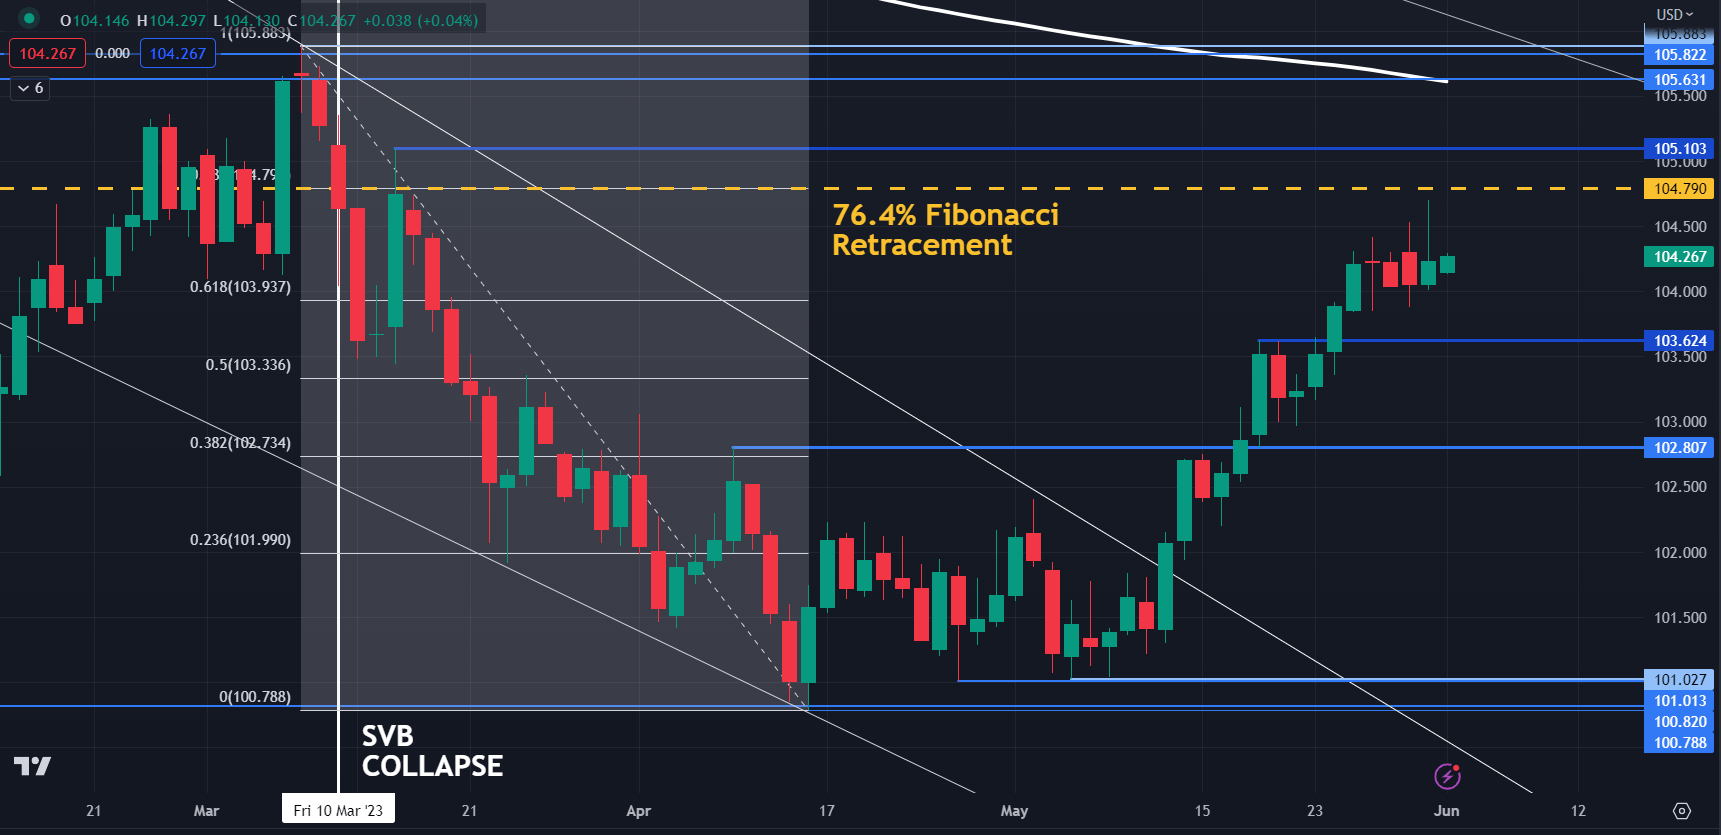
The DXY index appears to be in a short-term sideways pattern for now. Resistance might be in the 104.70 – 104.80 area where last week’s high was as well as the 76.4% Fibonacci Retracement.

On the downside, support may lie at the recent low of 103.38 or the breakpoint of 102.80.

image1.png

Chart created in TradingView

EUR/GBP Latest: Support Breaks Ahead of BoE Rate Decision

EUR/GBP Latest: Support Breaks Ahead of BoE Rate Decision

A recent Bloomberg report using Reed Recruitment Jobs data shows that the UK jobs market remains buoyant with people changing jobs seeing a 10% boost to their wages on average. This is markedly higher than last month’s official UK data that showed average earnings including bonus (3Mnth/Year) rising by 5.9% in February, while average earnings excluding bonus rose by 6.6% over the same time frame.

The Bank of England: A Forex Trader’s Guide

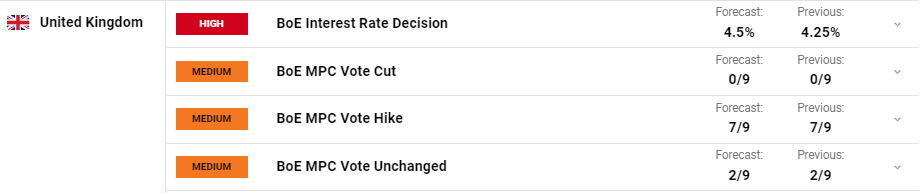
The Bank of England is set to hike the UK Bank Rate by a further 25 basis points to 4.50% tomorrow. Recent inflation data has shown price pressures remaining stubbornly high and today’s Reed Report, while not an official data point, will have many in Threadneedle Street worried that a robust wage market may keep inflation higher for longer. The post-decision commentary and press conference should see BoE governor Andrew Bailey point towards the jobs market as an area of ongoing concern.

image1.png

The latest UK GDP data will be released on Friday this week and is expected to show that the UK missed going into a technical recession in the first three months of this year. Preliminary year-on-year Q1 data is expected to show growth of 0.2%, compared to 0.6% in Q4 2022, with year-on-year growth slowing to 0.4% in March from 0.5%.

image2.png

For all market-moving data releases and events, see the DailyFX Economic Calendar

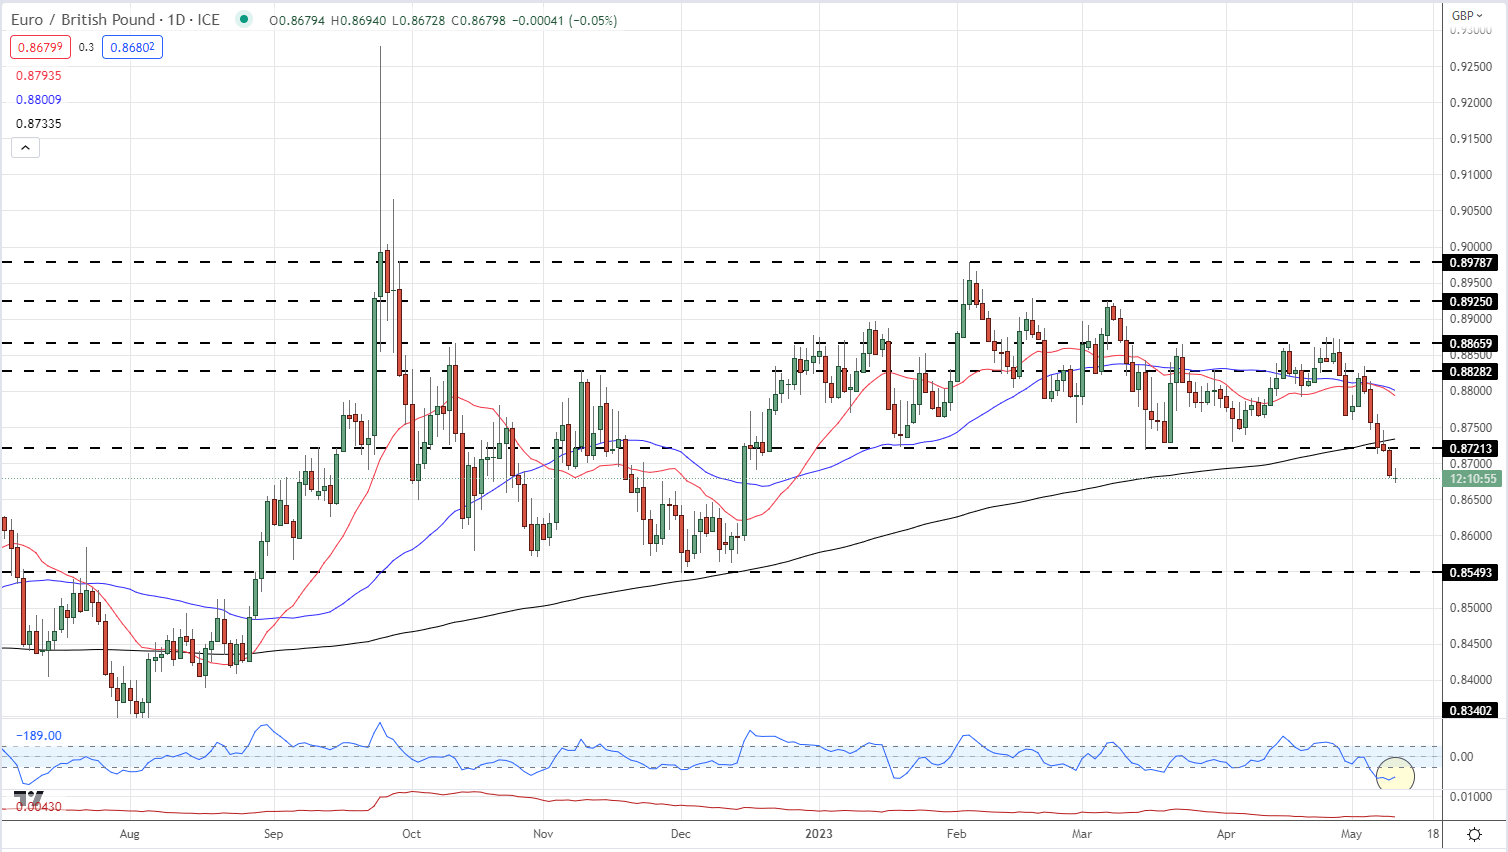
EUR/GBP broke below a multi-month level of horizontal support on Tuesday, and with it opened below the 200-day moving average for the first time since August 2022. The range-break move happened despite hawkish commentary from a number of ECB board members who see further rate hikes in the months ahead. This commentary should act as a level of support for the Euro but it seems that this is not the case currently. The pair sit squarely in oversold territory, using the CCI indicator, while volatility in the pair remains low. If EUR/GBP continues to fade lower, support should be seen around 0.8600 and 0.8550.

EUR/GBP Daily Price Chart – May 10, 2023

image3.png

Chart via TradingView

Major Bullish Break in KOSPI; ASX 200 Index’s Rally is Running into a Tough Barrier

Major Bullish Break in KOSPI; ASX 200 Index’s Rally is Running into a Tough Barrier

KOSPI COMPOSITE INDEX TECHNICAL OUTLOOK – BULLISH

KOSPI’s break higher this week indicates that South Korean equities could finally be catching up with some of its regional peers.

The South Korean benchmark index has risen above the marginally downward-sloping trendline from August triggering a major reverse head & shoulders pattern (the left shoulder is the mid-2022 low, the head is the September low, and the right shoulder is the early-January low), paving the way toward 2870. Interim resistance is at the end-May 2022 high of 2685.

KOSPI Daily Chart

image1.png

Chart Created by Manish Jaradi using TradingView

The bullish break has also coincided with a move above another key resistance, setting the stage for a higher-top-higher-bottom sequence (that is, an uptrend). Furthermore, the rise above the 200-day moving average for the first time since late 2021 is a sign that the multi-month downward pressure was fading.

KOSPI Daily Chart

image2.png

Chart Created by Manish Jaradi Using TradingView

On the downside, the index needs to hold above the March low of 2350, around the 200-day moving average for the nascent uptrend to remain intact.

ASX 200 TECHNICAL OUTLOOK – NEUTRAL

Australia ASX 200 index’s three-week-long rally looks set to pause as it runs into a stiff roadblock.

The index has staged a ‘V’-shaped rebound but is now testing the upper edge of the Ichimoku channel on the daily chart, roughly coinciding with the early-March high of 7370. The index needs to clear the 7325-7370 resistance area for the February-March downtrend to reverse.

ASX 200 INDEX Daily Chart

image3.png

Chart Created by Manish Jaradi using TradingView

Earlier last month, the index held above a strong support area: the 200-day moving average, coinciding with the early-January low of 6905, keeping the higher-top-higher-bottom sequence intact. Beyond the short term, the ASX 200 index continues to be in a broad range of 6400-7600 (see the weekly chart).

ASX 200 INDEX Weekly Chart

image4.png

Chart Created by Manish Jaradi Using TradingView

On the downside, the index has immediate support at Thursday’s low of 7200. Any break below could indicate that the three-week-long upward pressure had faded.

Shopping Basket
Chat now!
1