Gold Price Trickles Lower as Acceptance Above the $2000 Level Remains Elusive

Gold Price Trickles Lower as Acceptance Above the $2000 Level Remains Elusive

Gold (XAU/USD) FUNDAMENTAL BACKDROP

Gold prices trickled lower in Asian trade as acceptance above the $2000 handle remains elusive. Overnight we saw some dollar strength and modestly better sentiment allowing an ease in safe haven demand.

Friday’s concerns around Deutsche Bank failed to inspire a sustained break and acceptance above the $2000 handle. The Asian session also brought news about the SVB bank, as it was finally acquired by First Citizens Bank who will receive a line of credit from FDIC in the case of liquidity issues. The precious metal however, remains delicately poised as regional banks in the US remain on edge amid undercapitalization concerns which could rear its ugly head.

The weekend also brought geopolitical concerns back into focus as Russian President Vladimir Putin stated his intentions to deploy tactical nuclear weapons in Belarus. The statement was met with a stern reply from NATO officials who called Putin’s comments dangerous and irresponsible. The manner in which markets digest these developments moving forward and whether we see signs of escalation may be a further driver of gold prices moving forward.

We do not have a lot in the way of data for the first half of the week with most significant US releases coming later in the week. We have CB Consumer Confidence, GDP Growth Rate and of course the Feds preferred gauge of inflation the Core PCE data to come.

image1.png

TECHNICAL OUTLOOK AND FINAL THOUGHTS

Gold has been a winner of late, however we could possibly see wild swings in prices moving forward given the host of factors at play. As mentioned above changes in the geopolitical landscape and a return of bank sector fears could push gold prices back toward the $2000 level. Alternatively improving sentiment may result in continued downside for the precious metal with a short-term view likely to be more suited to the current environment.

The continued rejection of the $2000 level remains pivotal for gold with immediate support resting at the $1960 handle. A break below opens up a retest of the $1934 support area. On the upside we do need a daily candle close above the $2000 level for a continuation of the bullish momentum in the precious metal.

Gold (XAU/USD) Daily Chart – March 27, 2023

US Dollar Slides After FOMC Boost as Hikes Get Baked in. Is There a New Trend for USD?

US Dollar Slides After FOMC Boost as Hikes Get Baked in. Is There a New Trend for USD?

The US Dollar pulled back from overnight gains posted after the Federal Open Market Committee (FOMC) meeting minutes revealed a united board that supported the 25 basis point move at the gathering earlier month

The minutes reinforced the notion that the Fed is determined to get inflation under control and that any rate cuts are a long way off. This is something that they have verbalised on many occasions but perhaps has not been fully comprehended by markets.

The interest rate swap and futures markets now have 25 bp hikes for the next three FOMC meetings in March, May and June. Treasury yields are slightly softer with the hope that the Fed will get inflation under control further down the track.

New York Fed President John Williams was also on the wires yesterday and reiterated his hawkish stance as he emphasised the need to get price pressures under control.

In an interview on Bloomberg television, Band of International Settlements (BIS) Settlements CEO Augustin Carstens said that fiat currencies have won the battle over cryptocurrencies. Bitcoin remains below USD 25,000, trading near USD 24,600 at the time of going to print.

The Bank of Korea (BoK) left rates unchanged at 3.50% despite CPI currently running at 5.2% y/y. BoK Governor Rhee Chang-yong said in the post-decision press conference that more hikes can still happen despite the pause. Nonetheless, USD/KRW dipped under 1300.00.

The Australian Dollar has been the best-performing currency today after private capital expenditure data showed growth of 2.2% q/q over 4Q 2022 rather than the 1.0% forecast. The prior quarter was also revised up to 0.6% from -0.6%

Crude oil steadied after heavy losses yesterday with the WTI futures contract back above US$ 74 bbl and the Brent contract nudging US$ 81 bbl.

APAC equities have had a quiet day with Japan on holiday and futures are indicating a solid start to the Wall Street session later today.

Elsewhere, China instructed state-owned enterprises to stop using the top 4 auditing firms Deloitte, EY, KPMG and PWC.

The directive comes after Beijing agreed to auditors examining the books of Chinese firms listed on US exchanges last year. This action prevented these companies from being kicked out of the US.

Looking ahead, after Euro-wide CPI, US GDP data will be keenly watched by the market.

DXY (USD) INDEX TECHNICAL ANALYSIS

The DXY index broke above a descending trend channel and has consolidated above it, which might suggest that the bearish trend could be pausing or might be over.

Fortifying the break, the price also moved above 10-, 21- and 55-day simple moving averages (SMA). This could suggest that bullish short and medium term is potentially evolving.

The longer-term 100- and 200-day SMAs hang above the price and a move above these may confirm unfolding bullish and that a new is possibly emerging.

Resistance might be at the prior peaks of 104.67, 105.63 and 105.82. On the downside, support could be at the previous lows and breakpoints of 102.58, 101.30 and 100.82.

image1.png

AUD/USD Price Forecast: Hawkish RBA Unable to Arrest Slide, 200-Day MA in Focus

AUD/USD Price Forecast: Hawkish RBA Unable to Arrest Slide, 200-Day MA in Focus

AUDUSD FUNDAMENTAL BACKDROP

AUDUSD continued its move to the downside in the Asian session as the dollar index extended gains. Hawkish commentary from RBA Governor Lowe was seemingly drowned out by a host of similarly hawkish Federal Reserve policymakers.

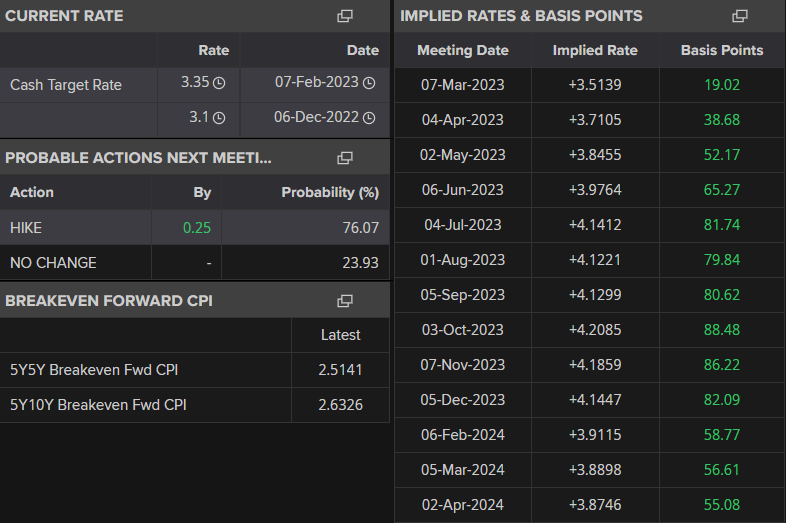
Comments from Reserve Bank of Australia (RBA) Governor Lowe failed to arrest the slide in AUDUSD. Governor Lowe cautioned that the RBA are keeping an open mind, and their opinion is that further rate hikes are needed. Lowe also stated that interest rates are not on a predetermined path as it takes 18-24 months for rate hikes to be felt in the economy. The probability for a further 25bps hike at the RBA meeting on March 7 now rests at 76% (as shown below).

A screenshot of a computer  Description automatically generated with medium confidence

Federal Reserve policymakers meanwhile continued their hawkish rhetoric yesterday which likely drowned out the comments from RBA Governor Lowe. Fed policymakers Loretta Mester and James Bullard both stated that they would not rule out a 50bps hike at the Fed’s March meeting. Bullard and Mester’s comments were in response to US PPI data which recorded its largest increase since June 2022. The recent moves in AUDUSD are largely attributable to the US dollar as we continue to see repricing of the Fed Funds Peak rate with this week’s upbeat economic data out of the US further strengthening the narrative.

Looking ahead to the rest of the day we have a relatively quiet US economic calendar with Federal Reserve policymaker Thomas Barkin speaking and the CB Leading Index for January out of the US. Neither of which is expected to provide markets with any significant shocks ahead of the weekend.

Graphical user interface, text, application  Description automatically generated

TECHNICAL OUTLOOK

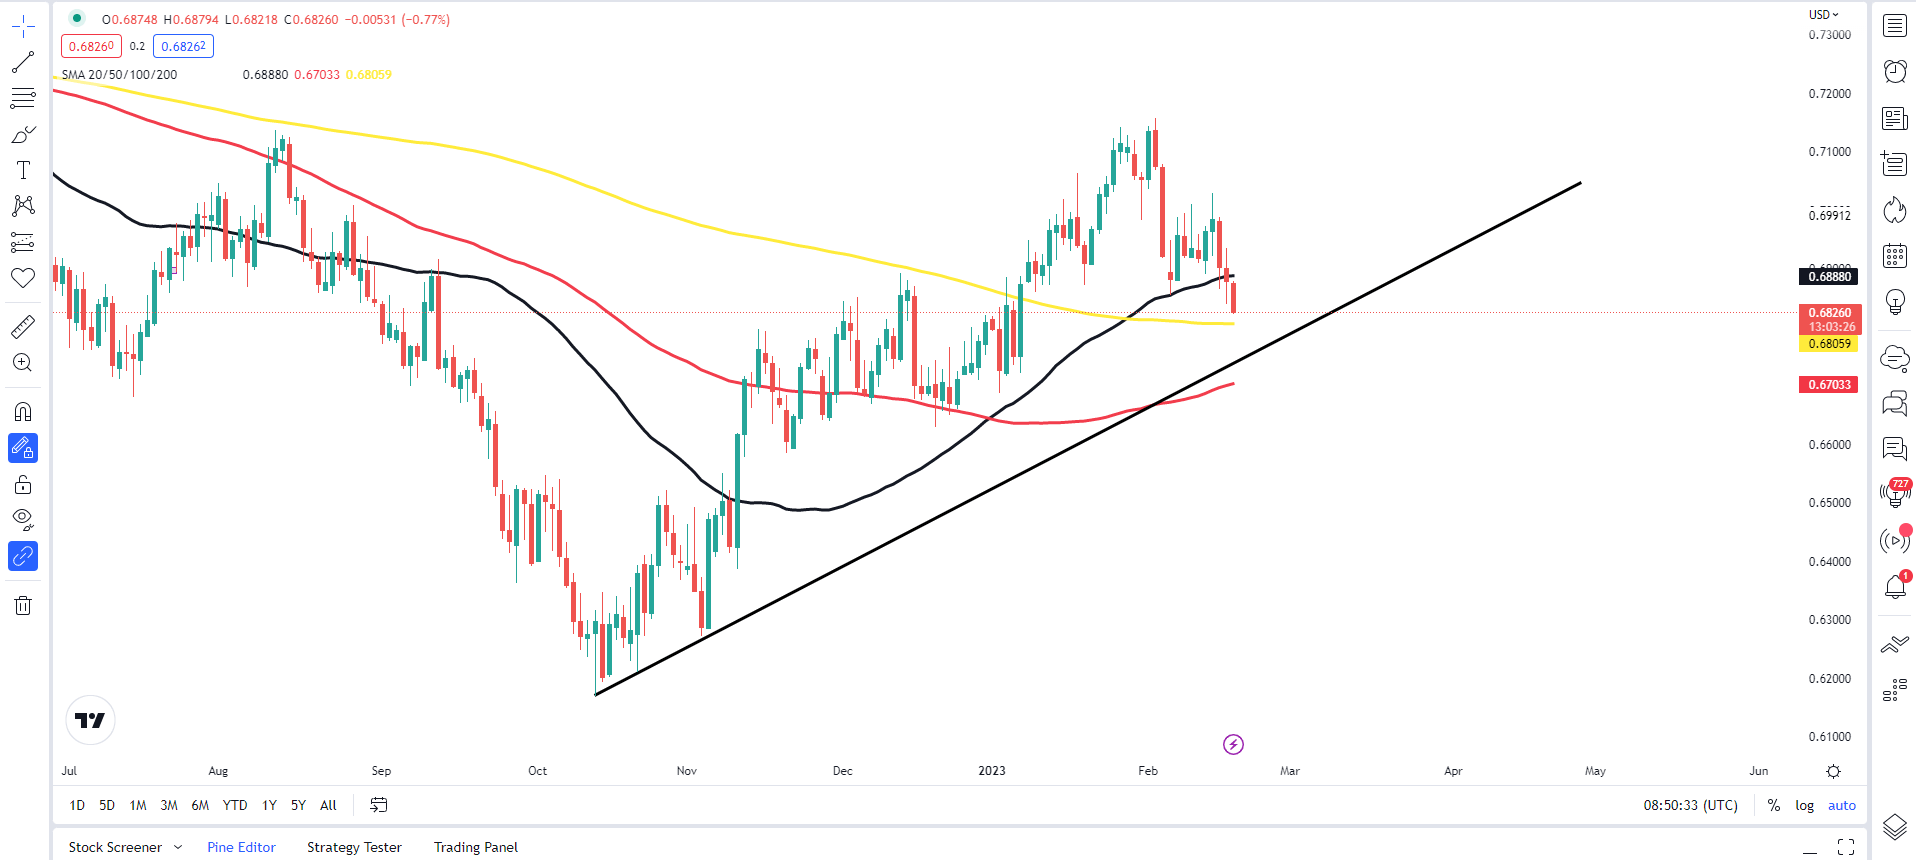
The continued selling pressure on AUDUSD could be linked to yesterday’s daily candle which closed below the 50-day MA. The pair has failed to find acceptance above the 0.7000 level despite briefly breaking above it on January 23. Further downside seems the path of least resistance at this stage, however the 200-day MA rests just below current price at 0.68090 and could provide temporary relief. A bounce of the 200-day MA could lead to a retest of the 50-day MA before the next leg to the downside and a third touch of the ascending trendline from October 2002 lows.

AUD/USD Daily Chart – February 17, 2023

Graphical user interface, chart, histogram  Description automatically generated

3 Triangle Patterns Every Forex Trader Should Know

3 Triangle Patterns Every Forex Trader Should Know

Triangle patterns have three main variations and appear frequently in the forex market. These patterns provide traders with greater insight into future price movement and the possible resumption of the current trend. However, not all triangle formations can be interpreted in the same way, which is why it is essential to understand each triangle pattern individually.

Forex triangle patterns main talking points:

  • Definition of a triangle pattern
  • Symmetrical triangles explained
  • Ascending and descending triangle patterns
  • Key points to remember when trading triangle patterns

Test your knowledge of forex patterns with our interactive Forex Trading Patterns quiz

What is a triangle pattern?

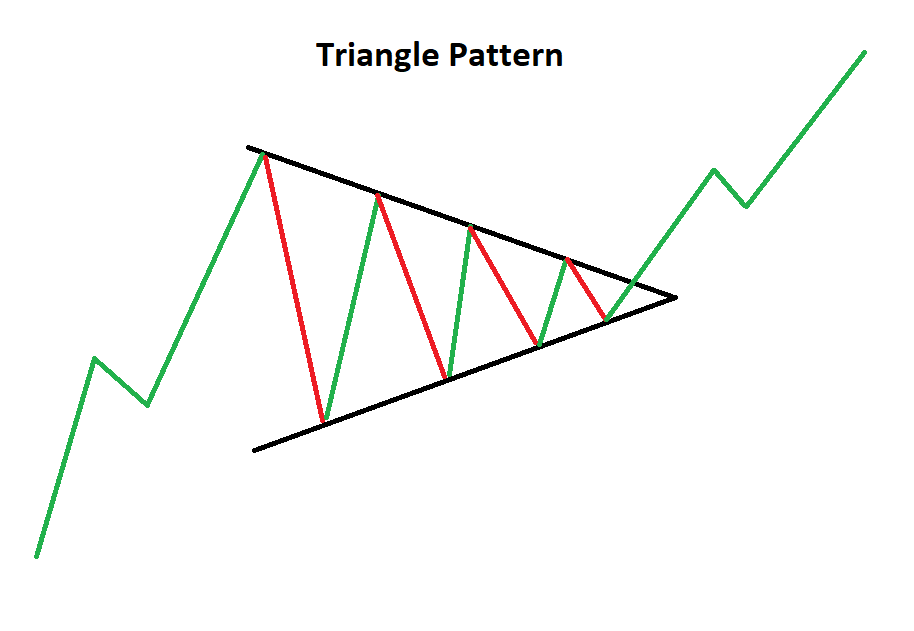
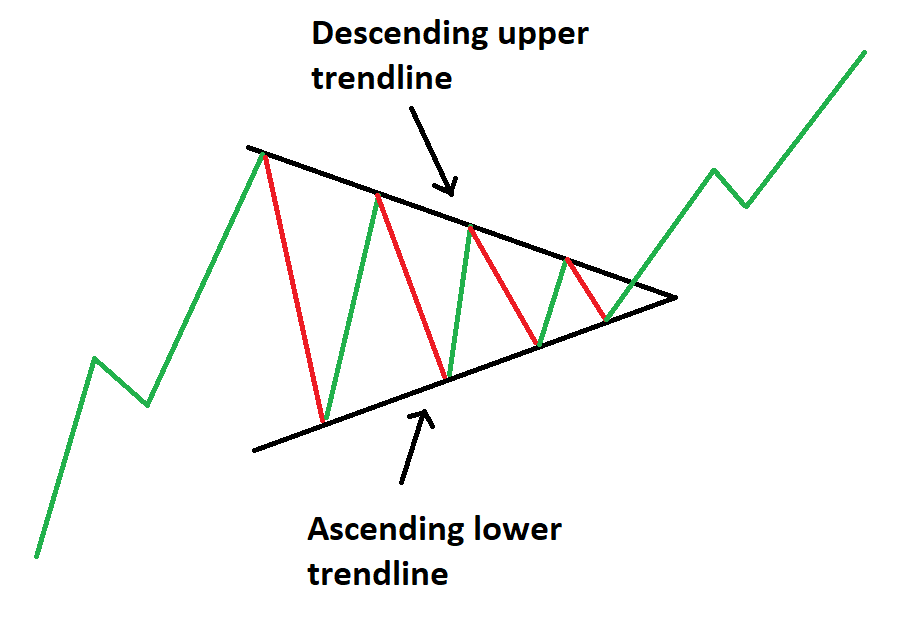
A forex triangle pattern is a consolidation pattern that occurs mid-trend and usually signals a continuation of the existing trend. The triangle chart pattern is formed by drawing two converging trendlines as price temporarily moves in a sideways direction. Traders often look for a subsequent breakout, in the direction of the preceding trend, as a signal to enter a trade.

Triangle chart pattern

This article makes use of line chart illustrations to present the three triangle chart patterns. Traders ought to familiarize themselves with the three technical analysis charts and figure out which one suits them best, although, most prefer using forex candlestick charts.

Symmetrical Triangles

The symmetrical triangle can be viewed as the starting point for all variations of the triangle pattern. As the name suggests, a triangle can be seen after drawing two converging trendlines on a chart.

The difference between the symmetrical and the other triangle patterns is that the symmetrical triangle is a neutral pattern and does not lean in any direction. While the triangle itself is neutral, it still favors the direction of the existing trend and traders look for breakouts in the direction of the trend.

Symmetrical triangle chart pattern

Symmetrical triangle trading strategy

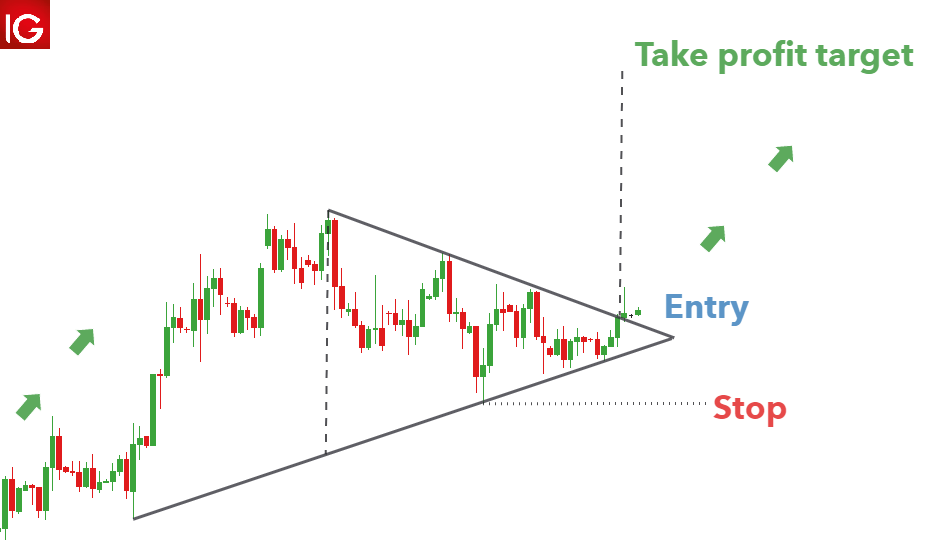
Triangles provide an effective measuring technique for trading the breakout, and this technique can be adapted and applied to the other variations as well.

The AUD/USD chart below shows the symmetrical triangle. The vertical distance between the upper and lower trendline can be measured and used to forecast the appropriate target once price has broken out of the symmetrical triangle.

Its important to note that finding the perfect symmetrical triangle is extremely rare and that traders should not be too hasty to invalidate imperfect patterns. Traders ought to understand that triangle analysis is less about finding the perfect pattern and more about understanding what the market is communicating, through price action.

Symmentrical triangle pattern on forex pair AUD/USD

Ascending Triangle Pattern

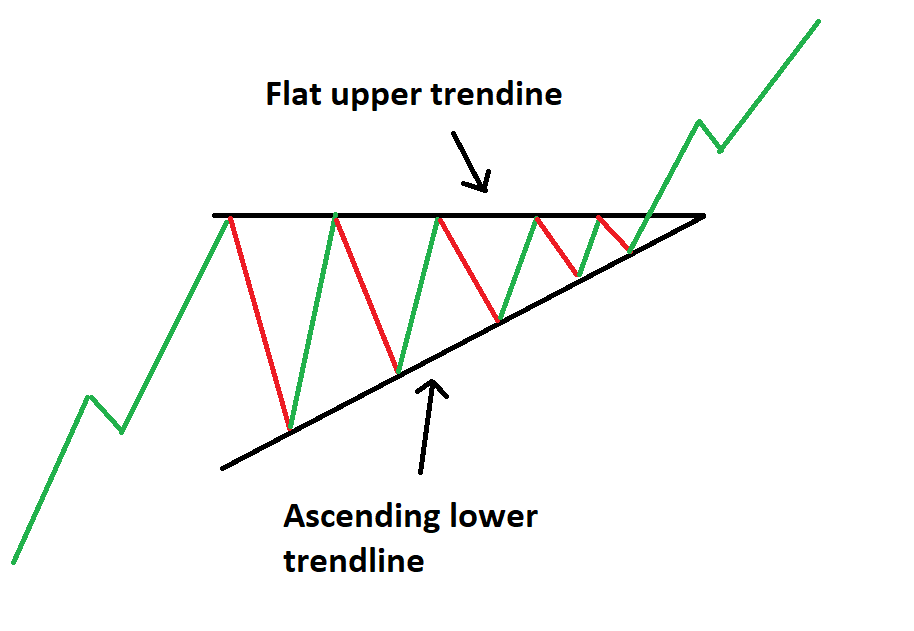
The ascending triangle pattern is similar to the symmetrical triangle except that the upper trendline is flat and the lower trendline is rising. This pattern indicates that buyers are more aggressive than sellers as price continues to make higher lows. Price approaches the flat upper trendline and with more instances of this, the more likely it is to eventually break through to the upside.

Ascending triangle chart pattern

Ascending triangle trading strategy

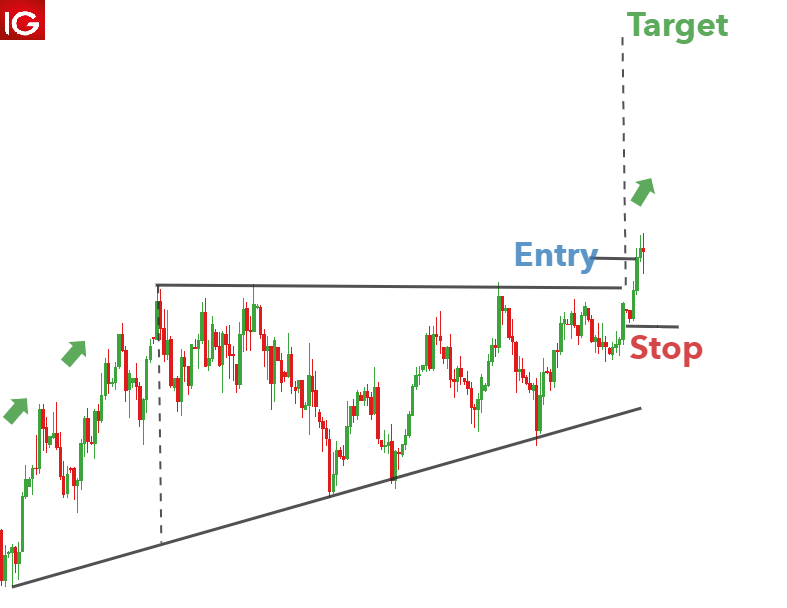
An ascending triangle can be seen in the US Dollar Index below. Leading on from the existing uptrend, there is a period of consolidation that forms the ascending triangle. Traders can once again measure the vertical distance at the beginning of the triangle formation and use it at the breakout to forecast the take profit level. In this example, a rather tight stop can be placed at the recent swing low to mitigate downside risk.

Ascending triangle US dollar basket

Descending Triangle Pattern

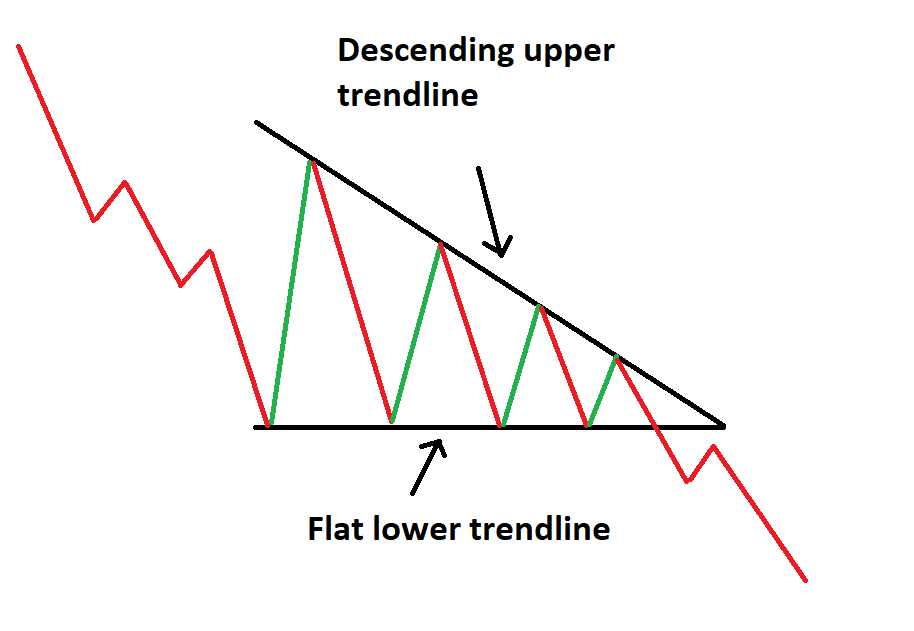
The descending triangle pattern on the other hand, is characterized by a descending upper trendline and a flat lower trendline. This pattern indicates that sellers are more aggressive than buyers as price continues to make lower highs.

Decending triangle chart pattern

Descending triangle trading strategy

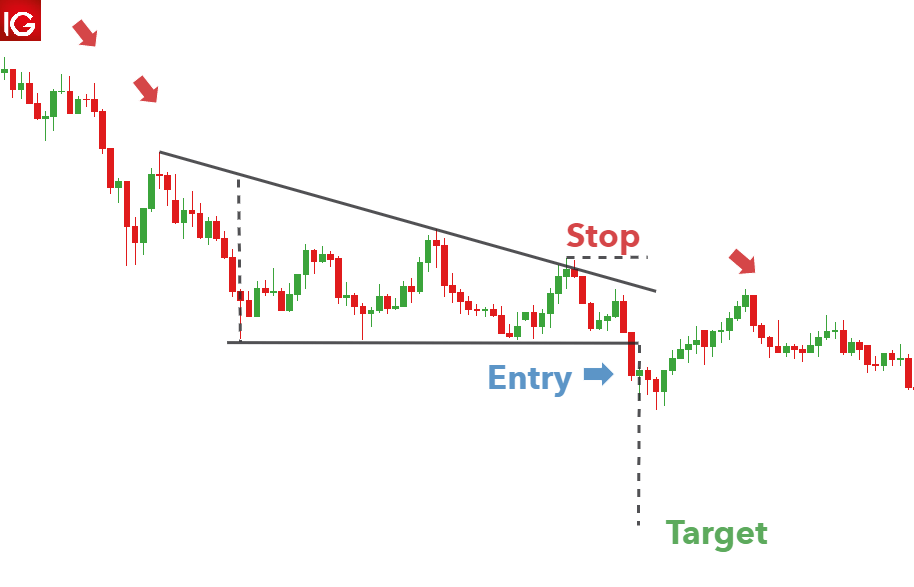
Below is a good example of the descending triangle pattern appearing on GBP/USD. A downtrend leads into the consolidation period where sellers outweigh buyers and slowly push price lower. A strong break of the lower trendline presents traders with an opportunity to go short. In this example, it doesn’t take long for the position to move in the opposite direction, highlighting the importance of setting an appropriate stop level.

The take profit level is set using the vertical distance measured at the beginning of the descending triangle formation.

Descending triangle pattern on GBP/USD

Trading with Triangle Patterns: Key things to remember

  • Always be cognisant of the direction of the trend prior to the consolidation period.
  • Make use of upper and lower trendlines to help identify which triangle pattern is being formed.
  • Use the measuring technique discussed above to forecast appropriate target levels
  • Adhere to sound risk management practises to mitigate the risk of a false breakout and ensure a positive risk to reward ratio is maintained on all trades.

Interactive Brokers registers steep increase in revenues in Q4 2022

Interactive Brokers registers steep increase in revenues in Q4 2022

Electronic trading major Interactive Brokers Group, Inc. (NASDAQ:IBKR) has reported its financial results for the final quarter of 2022.

Reported diluted earnings per share for the three months to end-December 2022 were $1.31 and $1.30 as adjusted. For the year-ago quarter, reported diluted earnings per share were $0.67 and $0.83 as adjusted.

Reported net revenues were $976 million for the fourth quarter of 2022 and $958 million as adjusted. For the year-ago quarter, reported net revenues were $603 million and $683 million as adjusted.

Reported income before income taxes was $689 million for the final quarter of 2022 and $671 million as adjusted. For the year-ago quarter, reported income before income taxes was $373 million and $453 million as adjusted. Commission revenue increased 3% to $331 million on higher customer futures trading volume and larger average trade size in options, tempered by lower customer stock trading volume.

Net interest income increased 92% to $565 million on higher benchmark interest rates and customer credit balances, despite a decline in margin lending balances.

Other income increased $107 million to a gain of $37 million. This increase was mainly comprised of $58 million related to Interactive Brokers’ strategic investment in Up Fintech Holding Limited (Tiger Brokers), $34 million related to Interactive Brokers’ currency diversification strategy and $6 million related to the remeasurement of Interactive Brokers’ Tax Receivable Agreement liability.

The number of customer accounts increased 25% to 2.09 million.

Total daily average revenue trades (DARTs) decreased 22% to 1.89 million, whereas cleared DARTs decreased 22% to 1.69 million.

The Interactive Brokers Group, Inc. Board of Directors declared a quarterly cash dividend of $0.10 per share. This dividend is payable on March 14, 2023, to shareholders of record as of March 1, 2023.


Breaking News: Pound Bid After Core Inflation Beat, 50bps Secured?

Breaking News: Pound Bid After Core Inflation Beat, 50bps Secured?

The British pound received support this morning after a mixed bag of inflation data. Headline inflation in the UK declined in line with expectations to 10.5% (see economic calendar below) while beat estimates likely due to labor shortages. The core read which excludes food and energy from the calculation highlights the tight labor market conditions seen in yesterday’s UK employment numbers while the recent drop in the price of energy has contributed to the decline in the headline figure. In addition, as cited in the ONS report, the primary headline deflationary sectors were “transport (particularly motor fuels), clothing and footwear, and recreation and culture, with rising prices in restaurants and hotels, and food and non-alcoholic beverages.” Many expected a sharp drop in inflationary pressures including the Bank of England’s (BoE) Governor Andrew Bailey which leaves the UK diverging from inflation trends seen in the U.S. which could give GBP additional sustenance against the USD. That being said, the Christmas period could have subsidized much of the upside in the numbers which makes next month’s release a focal point.

ECONOMIC CALENDAR

image1.png

From an interest rate perspective (see table below), money markets are in favor of a 50bps (42bps at present) increment in the February meeting with a high degree of certainty. With no high impact data scheduled before the meeting, there is little on the way of shifting the needle lower, leaving the half a basis point raise an almost certainty. The BoE will need to take into account recessionary fears for this meeting and could be a factor that keeps the 25bps option on the table.

BANK OF ENGLAND INTEREST RATE PROBABILITIES

image2.png

TECHNICAL ANALYSIS

GBP/USD DAILY CHART


image3.png

Chart prepared by Warren Venketas, IG

The daily GBP/USD chart has followed through on the promise of the golden cross formation (50-day SMA crosses above 200-day SMA) (green) post-CPI, now looking to run up towards the June 2022 swing high at 1.2407; a level that saw resistance back in mid-December.

While the Relative Strength Index (RSI) shows signs of bearish/negative divergence, there is still room for additional pound strength before a possible pullback lower.

Key resistance levels:

  • 1.2500
  • 1.2407

Key support levels:

  • 1.2154
  • 1.2100

BULLISH IG CLIENT SENTIMENT

IG Client Sentiment Data (IGCS) shows retail traders are currently SHORT on GBP/USD, with 58% of traders currently holding short positions (as of this writing). At DailyFX we typically take a contrarian view to crowd sentiment resulting in a short-term upside bias.


Australian Dollar Bumped on China GDP Data. Where to for AUD/USD?

Australian Dollar Bumped on China GDP Data. Where to for AUD/USD?

The Australian Dollar leapt toward yesterday’s six-month peak against the US Dollar with China’s GDP much better than forecast.

Chinese GDP printed at 2.9% year-on-year for the fourth quarter against expectations of 1.6% and 3.9% previously.

Other Chinese data was released at the same time, with industrial production for the year to the end of December coming in at 1.3% instead of 0.1% anticipated and 2.2% prior.

Retail sales numbers for the same period were -1.8% well above the -9.0% forecast and -5.9% previously, although still negative.

The GDP numbers capture a locked-down China that re-opened near the end of the quarter. Large outbreaks of Covid-19 materialised rapidly and so the economic benefits may not become apparent for some time.

Today’s data is very positive news for an economy that has the potential to strengthen further once Covid-19 restrictions are completely lifted and case numbers start to drop.

Prior to the GDP release, the People’s Bank of China (PBOC) injected CNY 504 billion of liquidity via revere repos. This is the most since January 2019.

Markets are already pricing in an expansionary outlook for the world’s second-largest economy with the CSI 300 equity index at its highest level since August.

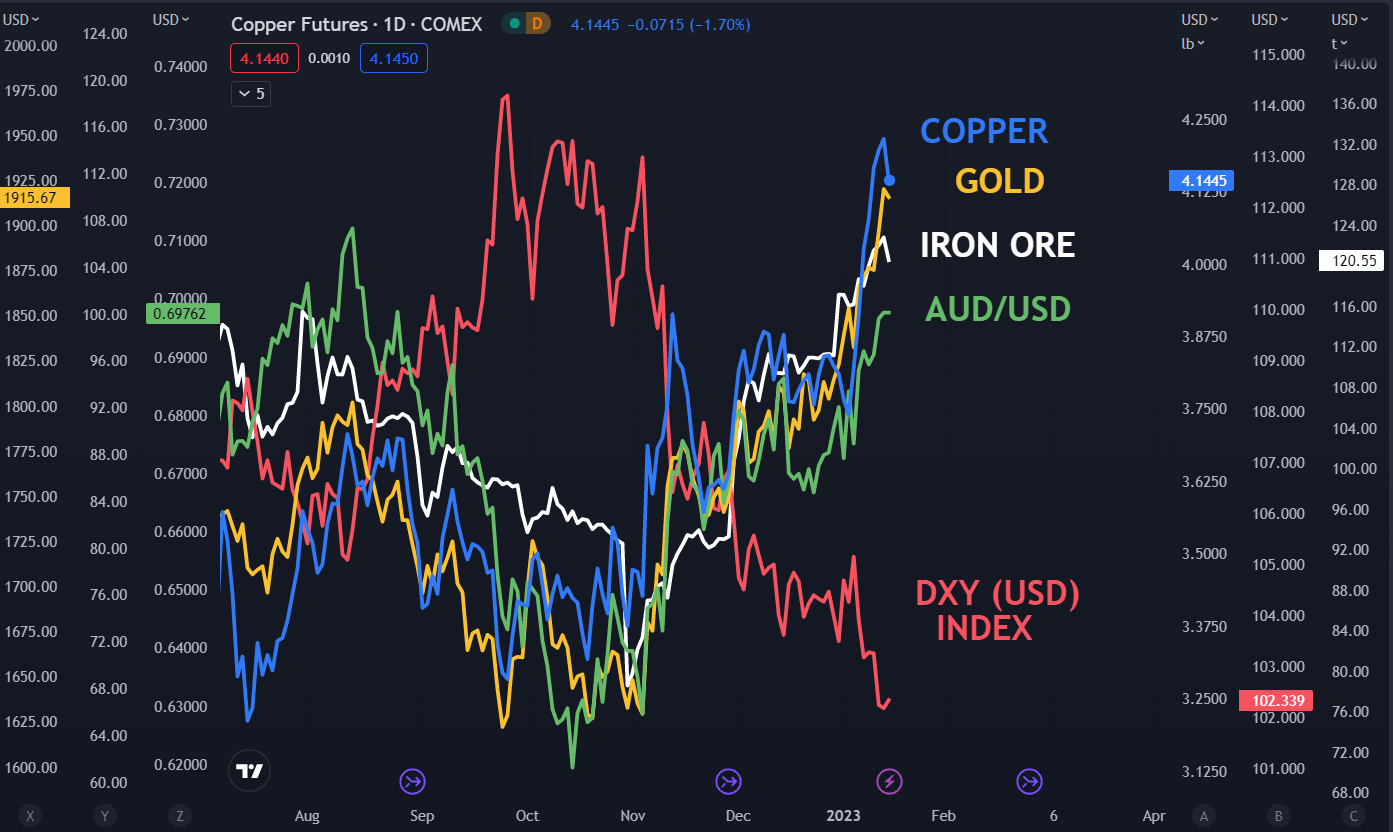
Commodity markets have also been underpinned with base metals notching up significant gains so far this year. Iron ore and copper, two of Australia’s top exports, are much higher and have added to perceptions of the Aussie Dollar benefitting from the China re-open.

Elsewhere, the US Dollar is under pressure as the market appears to be expecting the Federal Reserve to ease up on its aggressive monetary policy tightening later this year.

This is despite consistent messaging from several members of the Federal Open Market Committee (FOMC) stating that rates will need to go higher and stay there.

Gold is also trading near its highest level since April last year as the precious metals pick up interest from the weaker US Dollar and the broader increasing appetite for metals.

With the China re-opening story and the seemingly endangered status of the ‘big dollar’, it is little wonder that AUD/USD is experiencing some bullish momentum.

CHART – AUD/USD, IRON ORE, COPPER, GOLD, DXY INDEX (USD)

image1.png


litefinance-blog-audusd-05-04-22-768x419

Crude Oil Holds the High Ground as Risks Swirl in BoJ Aftermath. Will WTI Rally?

Crude oil held onto overnight gains today as the fallout from yesterday’s surprise move by the Bank of Japan continues to reverberate throughout markets.

US crude inventories decreased by 3.1 million barrels last week according to data from the American Petroleum Institute (API).

This was well below the slight decline that was anticipated. Oil traders will now look to today’s Energy Information Administration (EIA) stockpile figures for clarity on the situation.

OPEC also weighed in yesterday by saying that they will remain proactive and pre-emptive.

Further delays to the re-opening of the Keystone pipeline have also been announced. The connection links the Canadian oil fields to the US gulf coast.

The WTI futures contract is above US$ 76 bbl while the Brent contract is near US$ 80 bbl at the time of going to print.

Japan is a major energy importer and the surge in the Yen this week may assist their capacity to shore up supplies as they head into their winter.

Yesterday’s volatility in the Asian session has been replaced by relatively sedate price action across most markets so far today. The implications of the Bank of Japan’s decision are yet to be fully digested.

Wall Street managed to eke out some small gains that fed into a mixed APAC equity session. Australia’s ASX 200 found firmer footing while Japan’s Nikkei 225 slipped again. The rest of the region was mostly flat.

Swimming against the tide in Japan is the bank and insurer stocks. These entities could gain from a higher interest rate environment.

Speculation is growing that the BoJ might move out of the negative interest rate policy (NIRP) stance. Further tightening by another major central bank may impact global growth.

Treasuries have added a couple of basis points across the curve today, adding to the large gains seen yesterday, particularly at the back end of the curve.

Currencies markets have settled down somewhat, except for the New Zealand Dollar. It is notably lower while the US Dollar is mildly firmer across the board. Gold is steady above US$ 1,800.

Canadian CPI will be released later today alongside US mortgage and home sales data.

WTI CRUDE OIL TECHNICAL ANALYSIS

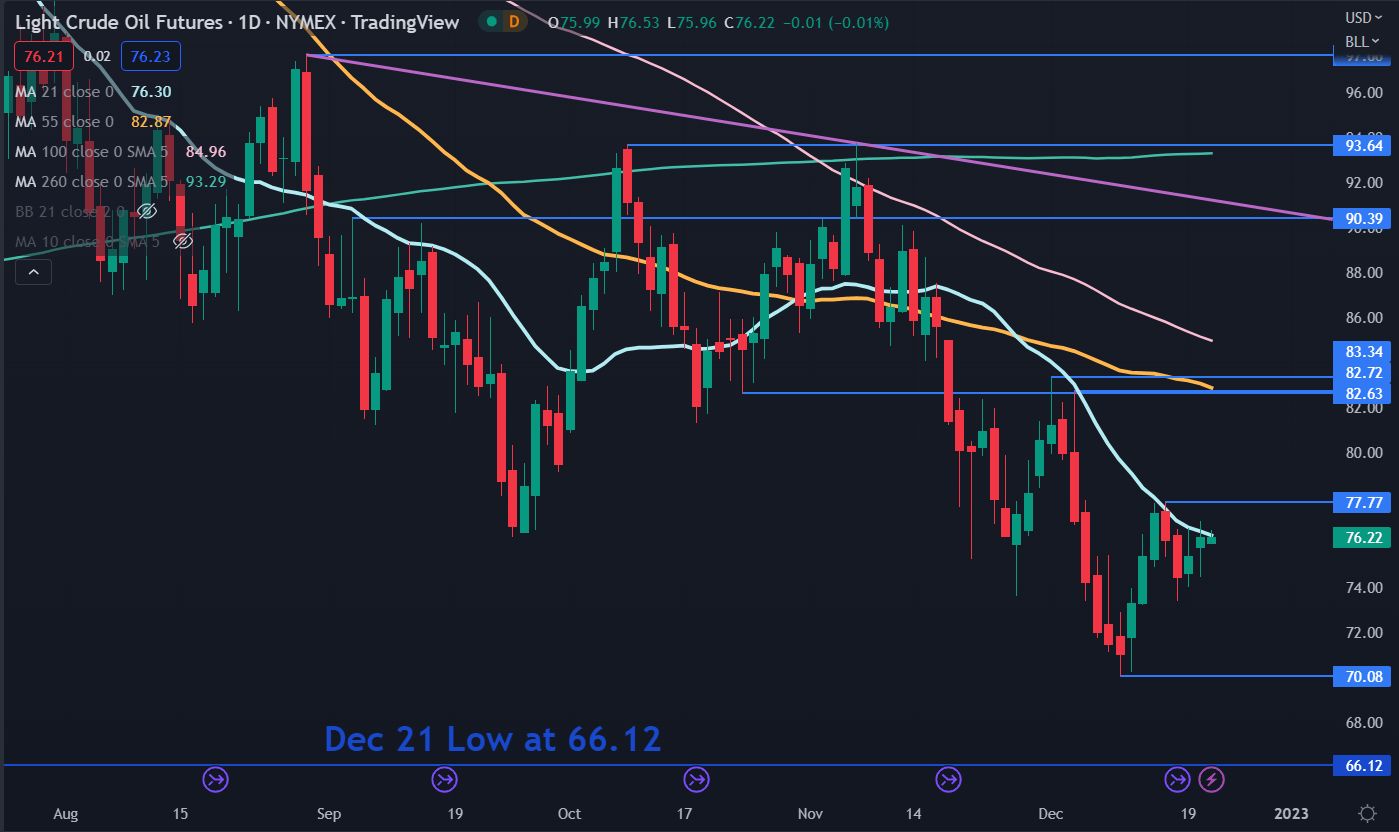
WTI crude oil rallied off its 12-month low of 70.08 seen earlier this month and that level may provide support ahead of the December 2021 low of 66.12.

The price has been unable to overcome the 21-day simple moving average (SMA) of late and it may continue to offer resistance ahead of the recent high of 77.77. That level may offer resistance

Further up, resistance might be at the breakpoint of 82.63 or the recent peaks of 82.72 and 83.34. The 55-day SMA is also currently near that high of 83.34.

image1.png

PPI vs CPI vs GDP Deflator

Understanding Inflation and its Global Impact

What is Inflation?

Inflation is the rise in prices of goods and services in an economy over a period of time, and is often displayed in percentage form. For example, if inflation is 2%, this suggests that prices are (on average) 2% higher than the previous period. Therefore, if a bottle of water cost $1 last year then this year it should be around $1.02. Inflation can result in significant costs to an economy as the purchasing power of individuals fall.

Deflation

Deflation is the opposite of inflation where prices fall. This suggests low demand for goods and services and often leads low interest rates. Deflation is atypical amongst developed countries.

Stagflation vs Hyperinflation

Stagflation occurs when an economy is stagnant (low growth) but inflation is still prevalent. This can occur when external factors impact an economy such as the price of oil.

Hyperinflation is an extremely high rate of inflation within an economy. Hyperinflation can be caused by an increase in money supply which consequently results in increased consumer spending and higher demand for goods and services.

Both deflation and hyperinflation can be detrimental to an economy and can result in higher rates of unemployment and lower growth. This makes the role of central banks critically important to control inflation as a lack of stability may have the potential for destructive penalties.

Measuring Inflation

Consumer Price Index (CPI)

This is one of the more common ways of measuring inflation, calculating inflation is based on a basket of goods and services which are often referred to as a ‘cost-of-living index’. Common cost-of-living indexes are the Consumer Price Index (CPI) and Retail Price Index (RPI). These measures relate to inflation experienced by consumers on a daily basis. Each central bank faces unique headwinds in selecting appropriate items to include within their inflation calculation.

Core CPI vs Headline CPI:

Two common phrases when dealing with inflation is ‘core’ and ‘headline’ CPI. This differentiating factor between the two terms is quite simple. Core CPI refers to the omission of food and energy prices from the Consumer Price Index while headline CPI includes both food and energy prices.

Producer Price Index (PPI)

The Producer Price Index (PPI) focuses on inflation at the early stages of production which can provide essential information for manufacturers and industry. The chart below shows the historical comparison between the different inflation measures (CPI, PPI and GDP Deflator). It is clear that PPI is the most volatile which can be explained in part by producers being unable to pass on relatable costs to the consumer in difficult periods such as the global financial crisis.

GDP Deflator

Another way to measure inflation is via the GDP deflator which takes into account domestic goods only while CPI and/or RPI includes foreign goods, as well. A second key difference is that the GDP deflator method encompasses all goods and services while CPI and/or RPI only measures the price of goods and services bought by consumers. Because the GDP deflator is not restricted by a fixed basket of goods, it has an advantage over the others.

GDP Deflator = (Nominal GDP/Real GDP) x 100

Each measure has bespoke properties that may appeal to different individuals. Therefore, there is no ‘best’ way to calculate inflation but rather each measure has unique aspects that will be suited for different requirements and applications.

PPI vs CPI vs GDP Deflator
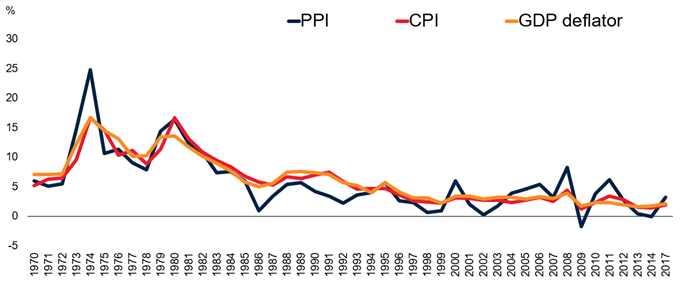
PPI vs CPI vs GDP Deflator

Source: World Bank

Sources of Inflation

Inflation can begin via many avenues in isolation or combination. Below are a few of the primary sources of inflation that can distress any nation across the globe:

Exchange Rates

A weakening local currency means that more local currency is required to purchase imports. This increased cost gets passed on to the end consumer which can contribute to inflation.

Essential Commodity Prices

Most manufacturers require inputs to produce a certain good. These often come in the form of commodities such as iron ore or oil. If these inputs increase in price due, then those costs can be passed on to consumers and the higher costs are a form of inflation.

Interest Rates

Lower interest rates theoretically lead to more spending by consumers, ultimately resulting in greater demand and cost of goods; which should lead to inflation, all factors held equal.

Government Debt

Increases in government debt may infer that there is a greater potential of a government default, which leads to higher yields on treasury securities to compensate potential investors for the higher risk. The effect this has on the public is that more tax revenue will be allocated to the higher interest payments on government debt obligations which reduces living standards. Businesses in turn increase the prices of goods and services to offset the lessened government expenditures, and this can lead to inflation.

The sources listed above generally fall into two broad categories of inflation which are:

  1. Demand-Pull Inflation – This type of inflation comes as a result of an increase in aggregate demand inclusive of households, governments, foreign buyers and businesses.
  2. Cost-Push Inflation – Supply is the driver of inflationary pressure for cost-push inflation. When supply falls due to higher production costs, the outcome is higher final prices for consumers.

Consequences of Inflation

Value of Money

The most obvious penalty of inflation from a consumer point of view is the higher cost of goods and services. This translates to a decrease in the value of money as individuals can now purchase fewer goods and services with the same amount of money prior to an inflationary rise.

Wealth Gaps

The inequitable distribution of inflationary pressure amongst individuals can lead to changes in wealth. For example, individuals with loans during periods of high inflation will benefit as the real value of their debt repayments will fall over time while others may not.

Inflation Volatility

Fluctuating or erratic inflation data complicates business operations as businesses do not know where to set prices, and this can have a negative effect on the economy as both businesses and consumers adjust to the higher rates of inflation. Long-term business deals will also incur higher costs as volatile inflation causes a higher risk premia on hedging costs, which can reduce foreign investor confidence.

Central banks use of Inflation Targeting

Inflation targeting is quite simple in theory as involves a central bank setting a specific inflation goal in percentage terms. This strategy is achieved by manipulating monetary policy. The goal of inflation targeting allows central banks along with the public to have more clarity in terms of future expectations. The reason behind inflation targeting is control with regards to price stability, and price stability can be attained by governing inflation.

Generally an inflation target of 1% – 2% is familiar as it allows governments and central banks some flexibility at this low base. As a rule of thumb, any deviation greater than 1% either side of the targeted figure is cause for concern and has generally lead to policy intervention.

How do Governments Control Inflation?

There are many ways governments go about controlling inflation which can have knock-on effects (positive and negative) to the economy depending on current economic conditions. The most common way is via contractionary monetary policy which is used by central banks to curb inflation by restricting liquidity. This is achieved via 3 main avenues:

1. Decrease Money Supply

Decreasing money supply simply gives consumers less money to spend overall and should help limit inflation. One way this can be realized is by increasing interest on sovereign bond payments which can attract more investors to buy bonds.

2. Reserve Constraints

Restricting the amount of money banks are allowed to keep can influence the amount of money being lent to consumers. That is, if banks are required to keep higher amounts of money as a legal threshold, then naturally banks will have less money to lend. This should decrease consumer spending and thus, inflation.

3. Raising Interest Rates

Higher interest rates which result in fewer individuals willing to borrow and therefore leads to a decrease in spending. There’s also a greater opportunity cost of investing capital into a business given the higher rates of return that could be had through capital markets.

Global Inflation and Key Relationships

Advanced vs Developing Economies
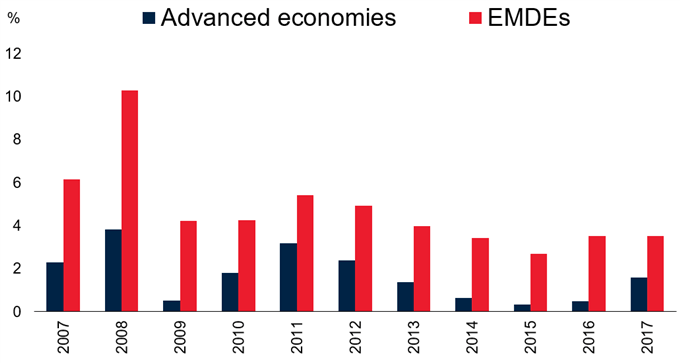
Advanced vs Developing economies

Source: World Bank

The chart above shows a consistent and logical pattern whereby the historical inflation rate in developed countries is generally less than emerging and developing economies (EMDE).There are two primary reasons behind this:

  1. EMDE generally have higher growth rates which can lead to excess demand.
  2. Volatile currencies are present in many EMDE which makes central banks’ management of monetary policy more difficult than those in advanced economies.

The Phillips Curve

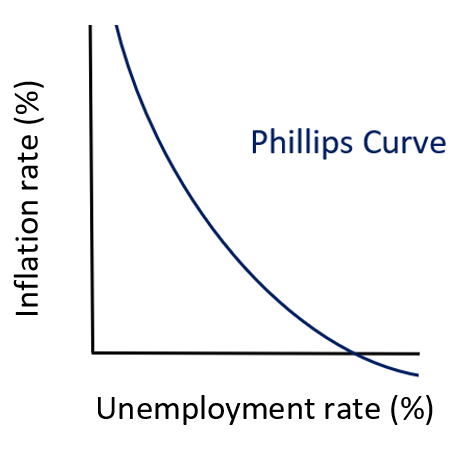
The historical relationship between unemployment and inflation has been largely inverse which means that high levels of unemployment correlates with lower inflation and vice versa. The reason why the inverse relationship exists is best explained with basic economics. For example, an increase in aggregate demand which is a consequence of demand-pull inflation, results in higher prices of goods and services and lower unemployment. This lower unemployment means that there is more income available in the economy to spend on goods and services. Both elements have recurrent effects on one another and is best represented by the basic Phillips Curve (see chart below).
The Phillips Curve

Source: Created by Warren Venketas

Inflation: Conclusion

This article has demonstrated the wide reaching implication of inflation from more concentrated effects to wide-ranging systemic global impacts. Inflation is an important economic tool from a macroeconomic perspective but also can be powerful if understood and implemented within a trading strategy as inflation data can cause changes in price in many financial markets.