The (GBPUSD) declined sharply in recent intraday trading, due to the stability of the key resistance at 1.3480, with the emergence of the negative signals from the relative strength indicators, after forming negative divergence that intensifies the negative pressure, on the other hand, the dynamic support continues due to its trading above EMA50, keeping the chances of the recovery valid with the dominance of bullish corrective wave on the short-term basis.
Silver Price shows new positive signals
Silver price is stabilizing with a slight decline during its latest intraday trading, as the price attempts to find a higher low that could serve as a base to help it regain positive momentum and resume recovery. This comes despite the continued dominance of the short-term corrective upward trend, with the price moving alongside a supportive trend line for this path.
In the technical background, we notice the beginning of a positive crossover on the relative strength indicators, after reaching sharply oversold levels that appear exaggerated compared to the price movement. This indicates the possibility of forming a positive divergence, which may support chances of an upward rebound in the coming period.
Alphabet price receives positive support
Alphabet Inc. (GOOG) stock price recorded a slight rise in its latest intraday trading, after rebounding from support at its SMA50, coinciding with a test of a short-term upward sub-trend line, which provided modest positive momentum and helped the stock achieve those gains. This comes as the Stochastic reached deeply oversold levels and is beginning to show signs of a positive crossover.
Therefore we expect the stock price to rise in upcoming trading, as long as the $297.45 support level holds, to target the key resistance at $350.75.
Today’s price forecast: Bullish
EURUSD price reaches key resistance
The (EURUSD) price rose in its last intraday trading, attacking the key resistance at 1.1800, supported by the continuation of the trading above EMA50, which represents dynamic support that reinforces the dominance of the main bullish trend on the short-term basis, especially with the trading alongside supportive trendline.
On the other hand, we notice the emergence of negative overlapping signals on the relative strength indicators, after offloading the previous overbought conditions, which opens the way for moving to the upside, and reinforces the chances of extending its gains on the near-term basis when breaching the current resistance steadily.
Sterling moves in a positive zone before UK labor data
The British pound rose in European trading on Tuesday against a basket of global currencies, resuming its recovery from a two-month low against the US dollar, supported by a pause in the dollar’s rally ahead of key remarks from Federal Reserve Chair Jerome Powell.
Expectations are leaning toward a 25-basis-point rate cut by the Bank of England at its November meeting. To reassess these odds, investors are awaiting the release of key UK labor market data later today.
Price Overview
• GBP/USD: The pound rose by 0.15% to 1.3352 from the opening level of 1.3333, after touching an intraday low of 1.3326.
• On Monday, the pound lost 0.2% against the dollar, following a 0.4% rise on Friday as part of a rebound from a two-month low of 1.3262.
US Dollar
The US dollar index fell by more than 0.15% on Tuesday, pulling back again from its two-month high, reflecting a pause in the greenback’s advance against major and minor currencies.
This decline came as investors weighed the latest trade tensions between the United States and China, which, if they intensify, could reignite a trade war between the world’s two largest economies.
Federal Reserve Chair Jerome Powell is scheduled to participate in a moderated discussion on the economic outlook and monetary policy at the annual meeting of the National Association for Business Economics in Philadelphia, where audience questions are expected.
UK Interest Rates
• Following the Bank of England’s most recent meeting, traders increased bets on further monetary easing, expecting at least one additional 25-basis-point cut this year.
• Futures markets currently price a roughly 60% probability of a 25-basis-point cut at the November policy meeting.
UK Labor Market
To reassess these expectations, investors are awaiting the release of key UK labor market indicators later today, including September jobless claims, the unemployment rate, and average earnings for August.
Pound Outlook
Here at Economies.com, we expect that if the upcoming UK labor market data turn out softer than market expectations, the likelihood of a Bank of England rate cut in November will increase — likely placing downward pressure on the pound.

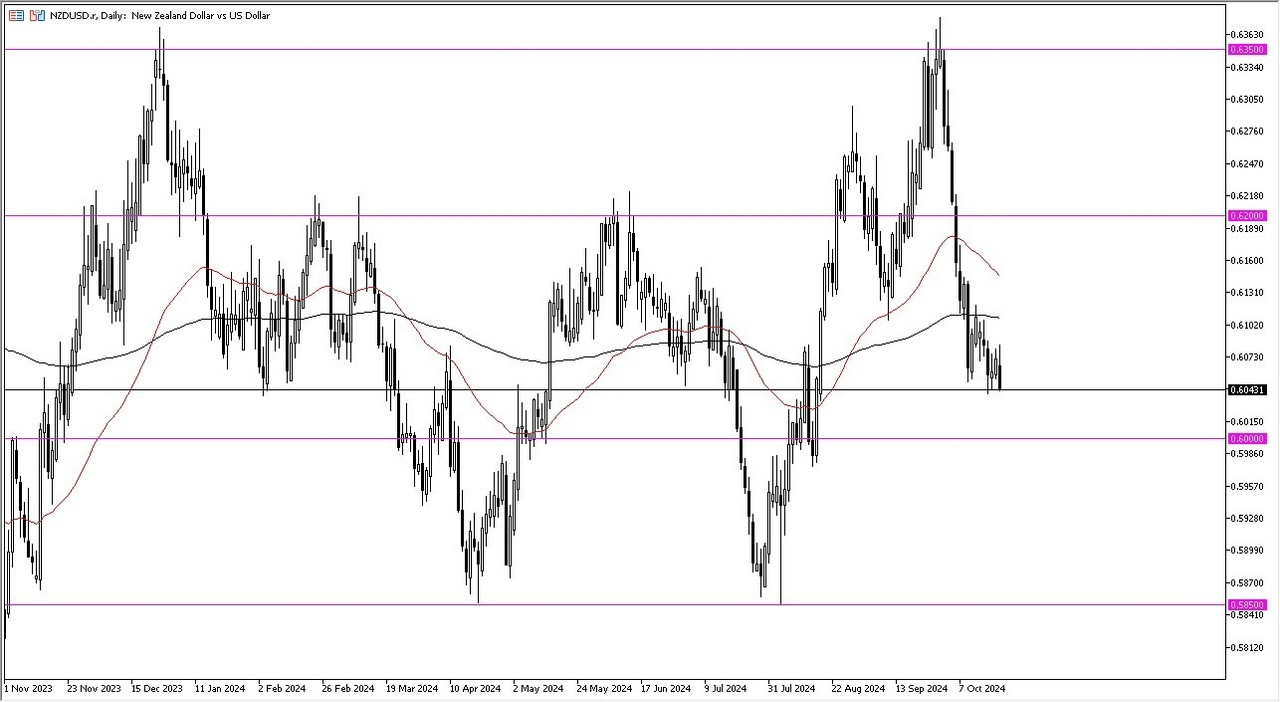
NZD/USD drops to near 0.5650 as US Dollar appreciates ahead of Initial Jobless Claims
NZD/USD continues to remain subdued for the third consecutive session, trading around 0.5660 during the European hours on Thursday. The pair’s downside is attributed to the stronger US Dollar (USD) amid hawkish sentiment surrounding the US Federal Reserve’s (Fed) policy stance.
According to the CME FedWatch tool, traders are confident that the Fed will keep its key borrowing rates in the range of 4.25%-4.50% in the upcoming three policy meetings. Moreover, US President Donald Trump’s policies could drive inflationary pressures, potentially limiting the Fed to just one more rate cut in 2025.
Gold price keeps the red below record high, downside seems limited ahead of US PCE data
Gold price (XAU/USD) maintains its offered tone through the early European session on Thursday amid a further rise in the US Treasury bond yields. Apart from this, bets for a less aggressive policy easing by the Federal Reserve (Fed) turn out to be key factors exerting some downward pressure on the non-yielding yellow metal. Any meaningful corrective slide for the commodity, however, seems elusive in the wake of the uncertainty surrounding the US presidential election and Middle East tensions.
Adding to this, the risk-off impulse – as depicted by a generally weaker tone around the equity markets – continues to offer some support to the safe-haven precious metal. Traders also seem reluctant and might prefer to wait on the sidelines ahead of the release of the US Personal Consumption Expenditure (PCE) Price Index. This, along with the Nonfarm Payrolls (NFP) report on Friday, should provide cues about the Fed’s interest rate outlook and provide a fresh directional impetus to the XAU/USD.
Technical Outlook: Gold price needs to consolidate or retreat a bit before the next leg up amid overbought RSI
From a technical perspective, the recent move up along an upward-sloping channel from the August monthly swing low points to a well-established short-term bullish trend. That said, the Relative Strength Index (RSI) on the daily chart is already flashing overbought conditions. Hence, any subsequent move up is more likely to remain capped near the $2,800 mark. The said handle represents the top boundary of the channel, which if broken decisively will be seen as a fresh trigger for bulls and set the stage for an extension of the appreciating move.
On the flip side, any meaningful corrective decline now seems to find decent support near the $2,750-2,748 region or a trading range resistance breakpoint. Some follow-through selling could make the Gold price vulnerable to extend the fall further towards the $2,732-2,730 intermediate support en route to the $2,715 area. This is followed by the $2,700 mark, which if broken should pave the way for a decline towards the next relevant support near the $2,675 zone en route to the $2,657-2,655 region.
Bitcoin Price Targets $70k as CME Group Hint 100% Chance of Fed Rate Cut
Bitcoin Price Analysis:
Bitcoin price fell as low as $57,614 on Tuesday Sept 17, down 5% within the last 3-days, but with Chicago Mercantile Exchange Group (CME) hinting, a 100% chance of a Fed rate cut, could this trigger a major breakout above $70,000?
Bitcoin Price Dips 3% as Bulls Sit-and-Watch
Bitcoin price action in the last two-weeks has been heavily influenced positive macroeconomic indicators. However, after testing new monthly timeframe peaks above $60,000, BTC failed to sustain the upward momentum.
Experts Trade Bitcoin with IC Markets
Trading Derivatives carries a high level of risk to your capital and you should only trade with money you can afford to lose. Trading Derivatives may not be suitable for all investors, so please ensure that you fully understand the risks involved, and seek independent advice if necessary. A Product Disclosure Statement (PDS) can be obtained either from this website or on request from our offices and should be considered before entering into a transaction with us. Raw Spread accounts offer spread
Amid growing anxiety ahead of the Fed Rate decision expected on Sept 18, BTC bull traders appear to be taking a sit-and-watch approach, leaving room for bears to force a mild correction.

Bitcoin Price Analysis | BTCUSDSince hitting the monthly peak of $61,000 on Saturday, BTC price entered a steep downtrend. The chart above shows how BTC price has 5.15% between Sept 14 and Sept 17, the time of publication.
Barely 24-hours away from the US Fed Rate decision, the recent BTC price action shows that bull have scaled back on the buying pressure, likely waiting on the Fed decision to decide their next moves.
CME Groups Hints 100% Chance of USA Fed Rate Cut
While the official verdict is still up in the air, the Chicago Mercantile Group (CME), one of the largest institutional trading exchanges in the world, having hinted that the US Fed is highly likely to cut rates on Sept 18.

Chicago Mercantile Group (CME) | FedWatch ToolAccording to analysts at Chicago Mercantile Group (CME), there’s a 100% chance of a rate cut on September 18. This overwhelming expectation suggests that the market is pricing in a more favorable interest rate environment. .
A rate cut could be highly bullish for risk assets, including cryptocurrencies. Lower interest rates reduce the cost of borrowing, increase liquidity, and encourage more speculative investments.
With less incentive to park money in traditional, yield-bearing assets, investors could flock to more volatile and potentially high-reward sectors like crypto. Historically, such actions have been linked to periods of increased inflow into digital assets, especially Bitcoin.
More so, the chart shows that 67% of investors anticipate the target rate will drop to 475-500 basis points, while 33% expect a smaller cut to 500-525 basis points
If the Federal Reserve cuts rates to the 475-500 basis point range, as CME’s chart suggests is 67% likely, Bitcoin could see even stronger upward momentum. This more aggressive rate cut would inject additional liquidity into the economy, making capital cheaper and encouraging more speculative investments.
With such a cut, investors may perceive heightened inflation risks, further pushing them toward assets that are seen as stores of value, such as Bitcoin. Additionally, lower interest rates often weaken the U.S. dollar, enhancing BTC’s appeal as an alternative asset.
A weaker dollar could lead to increased demand for BTC from both institutional and retail investors seeking to hedge against potential currency devaluation.
Bitcoin Price Forecast: $61,000 Retest Could Trigger More Gains
Despite the recent 5% correction in the last 3 days, Bitcoin’s short-term trading indicators remain bullish.
Currently, BTC is trading comfortably above the critical support level of $56,866, reflecting resilience after the pullback. The Donchian Channel, particularly, highlights that Bitcoin is still within a broader bullish trend, with the upper boundary of $61,164 marking the next significant resistance level.

Bitcoin Price Prediction | BTCUSDThe Donchian Channel’s upper boundary aligns with the $61,164 resistance, hinting at a potential retest of this level. A successful breakout could trigger a stronger bullish rally, driving the price towards $63,000. Meanwhile, ALMA’s slope suggests that speculative activity has fueled recent gains, but the positive price action could gain further strength if macroeconomic catalysts, such as the anticipated US Fed rate cut, come into play.
If the rate cut occurs, this could reinforce the bullish sentiment and catalyze an accelerated breakout above $61,000. Support levels to watch closely are $56,866 and a lower support at $52,568. As investors await the Fed’s decision, the bullish momentum may persist, keeping BTC poised for a potential surge.
Pound Sterling Latest: GBP/USD Attempts Come Back Post-FOMC Sell-off
Post FOMC Rebound on the Cards for GBP/USD?
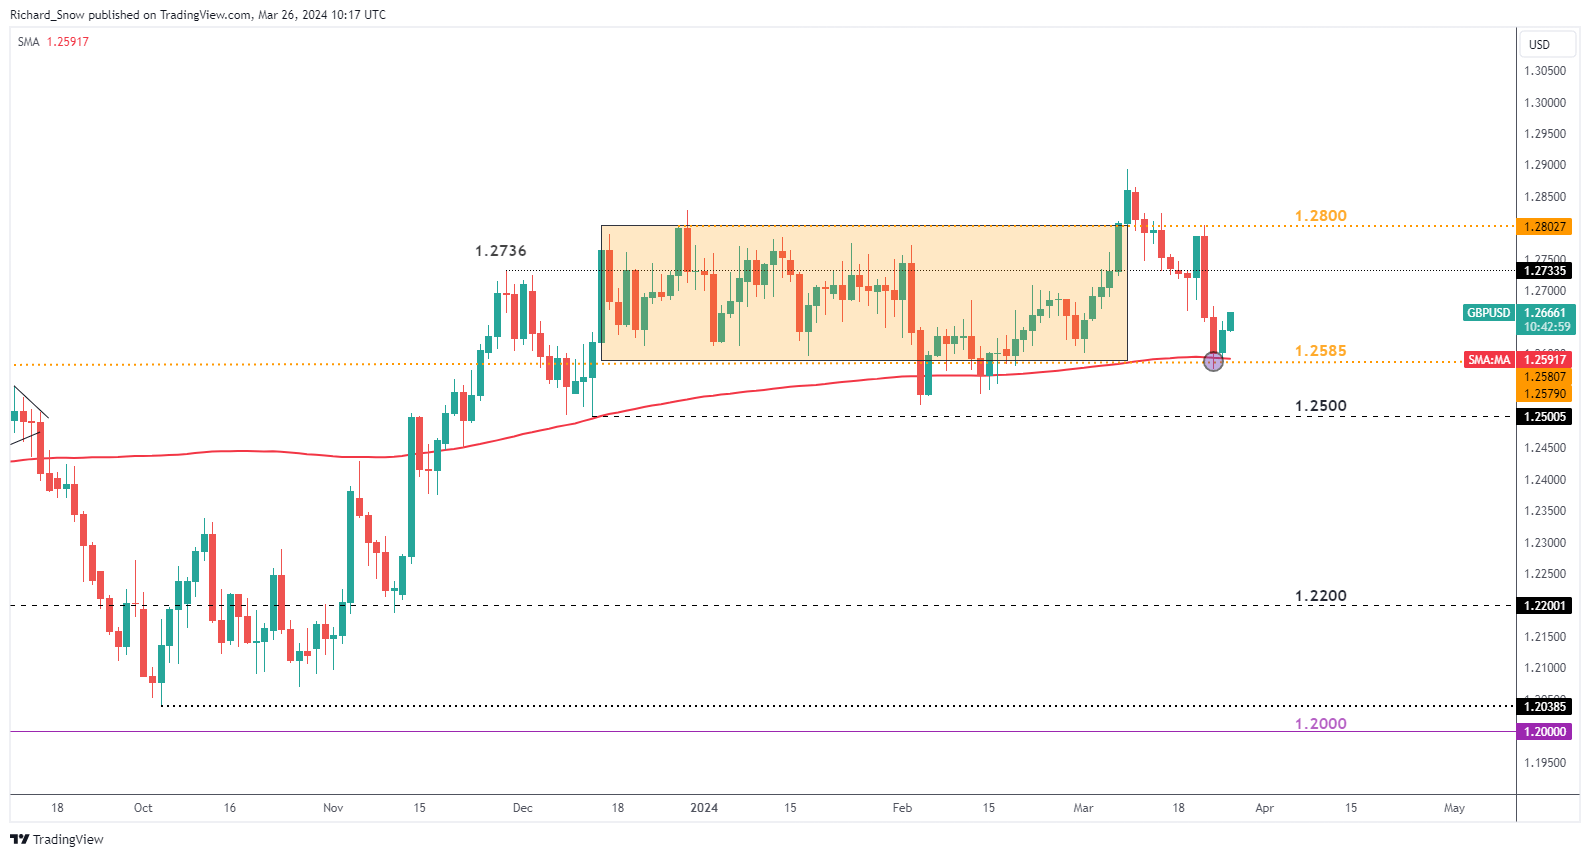
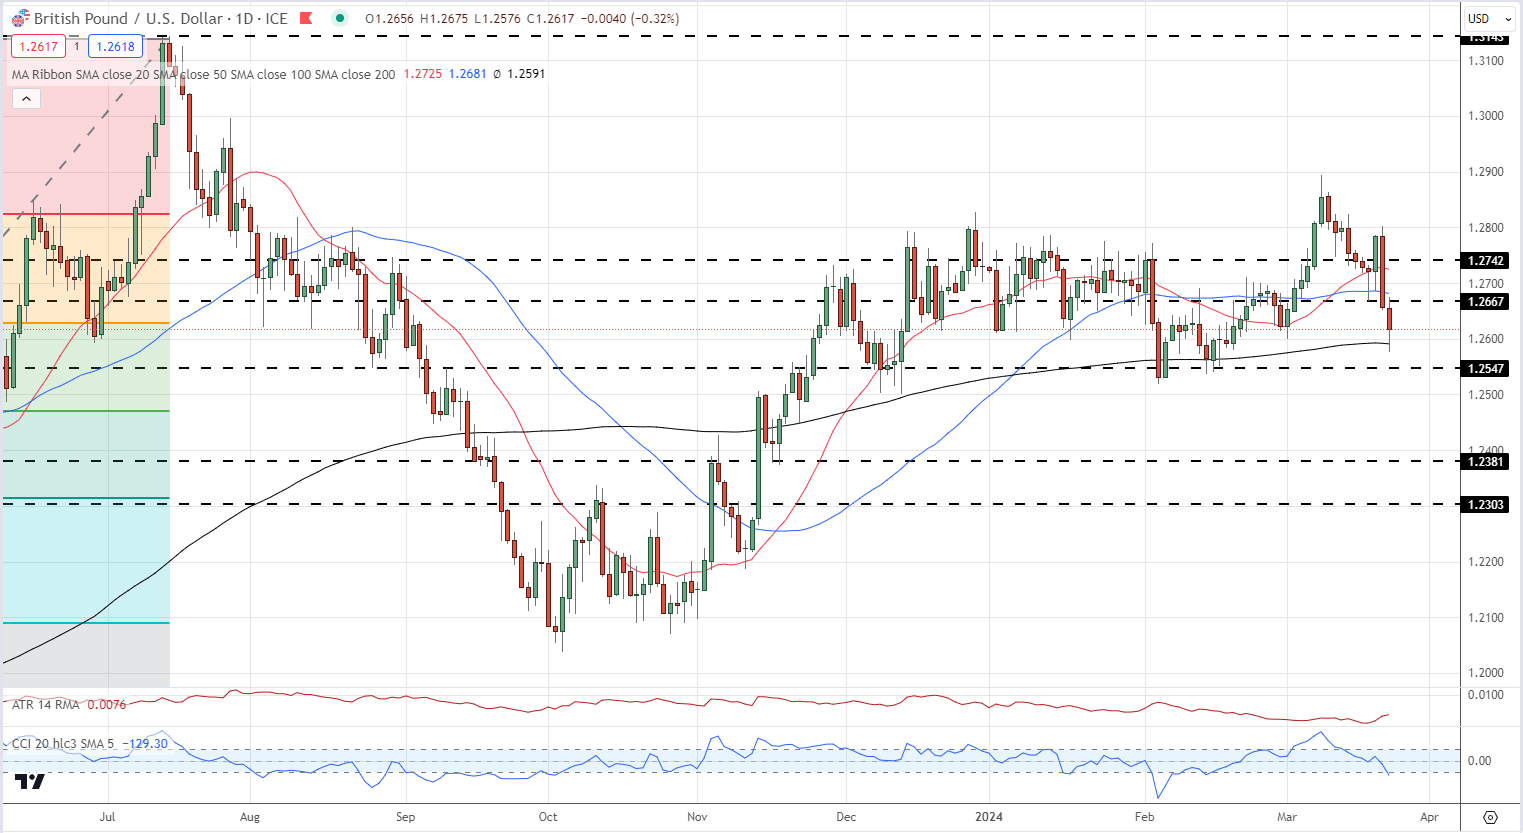
The daily GBP/USD chart reveals an attempt to lift off the stern zone of support found at the 200-day simple moving average and the 1.2585 level that help up prices for large parts of early 2024 when prices exhibited a range-bound preference.
Since spiking above the prior range, not for the first time either, GBP/USD heads back into familiar territory as the pair looks to recover from the sharp decline. 1.2736 is the next level of resistance should bulls take over from here. Sterling stands to benefit from a slightly weaker dollar at the start of the holiday-shortened week which also happens to be very quiet from a scheduled risk point of view with just PCE data scheduled for release on Good Friday.
GBP/USD Daily Chart
We typically take a contrarian view to crowd sentiment, and the fact traders are net-long suggests GBP/USD prices may continue to fall.
Read the detailed GBP/USD sentiment report to find out why recent changes in positioning has clouded the outlook for the pair from a contrarian view point.
Positioning is less net-long than yesterday but more net-long from last week. The combination of current sentiment and recent changes gives us a further mixed GBP/USD trading bias.
British Pound Weekly Forecast – GBP, Gilt Yields Slide, FTSE 100 Rallies Further
GBP/USD is trading around lows last seen one month ago after the Bank of England gave a strong hint that they may start cutting interest rates in June. Going into the meeting, market forecasts pointed at the August meeting for the first UK Bank Rate cut, but this changed rapidly after the MPC meeting on Thursday. GBP/USD fell from a high of 1.2800 to around 1.2650 and this sell-off has continued as we go into the weekend. Sterling is currently trying to find a balance against the US dollar, and this will be made harder next week due to a lack of any important events or data releases, and a UK Bank Holiday on the Friday. Support is seen at 1.2591 (200day sma), 1.2547, and then the 50% Fib retracement at 1.2471.
GBP/USD Daily Price Chart
IG Retail data shows 64.55% of GBP/USD traders are net-long with the ratio of traders long to short at 1.82 to 1.The number of traders net-long is 39.00% higher than yesterday and 21.10% higher from last week, while the number of traders net-short is 29.34% lower than yesterday and 30.53% lower from last week.
We typically take a contrarian view to crowd sentiment, and the fact traders are net-long suggests GBP/USD prices may continue to fall.
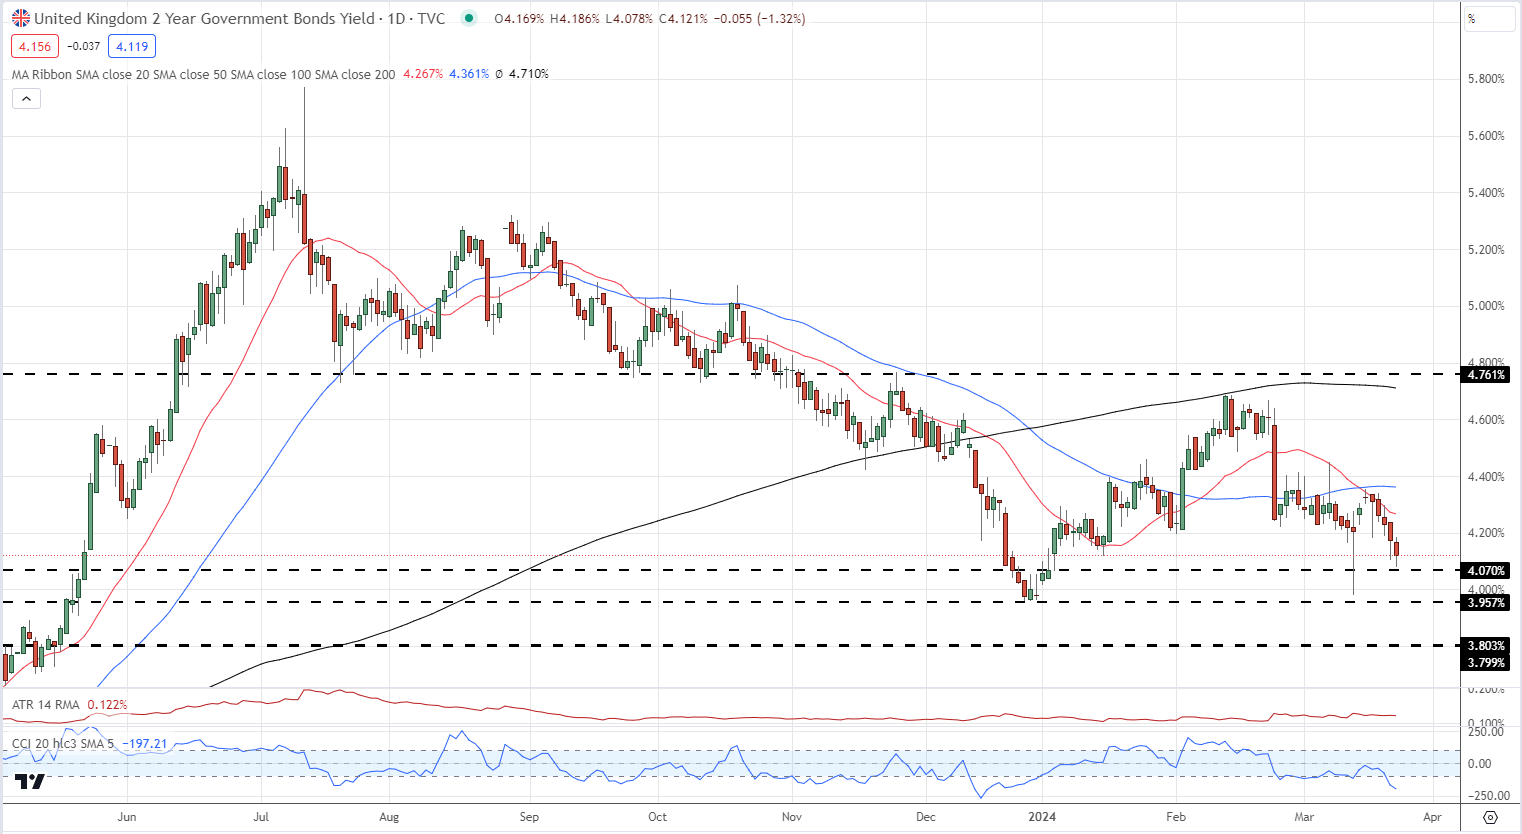
UK government bond yields also fell sharply post-BoE as traders began pricing in lower UK borrowing costs. The rate-sensitive UK 2-year gilt opened this week with a yield of 4.35% before drifting lower into the meeting. This move lower accelerated yesterday and today with the yield touching a low of 4.08%. The chart suggests a break below 4.07% brings a near-term target of 3.96% into focus.
UK 2-Year Gilt Yield
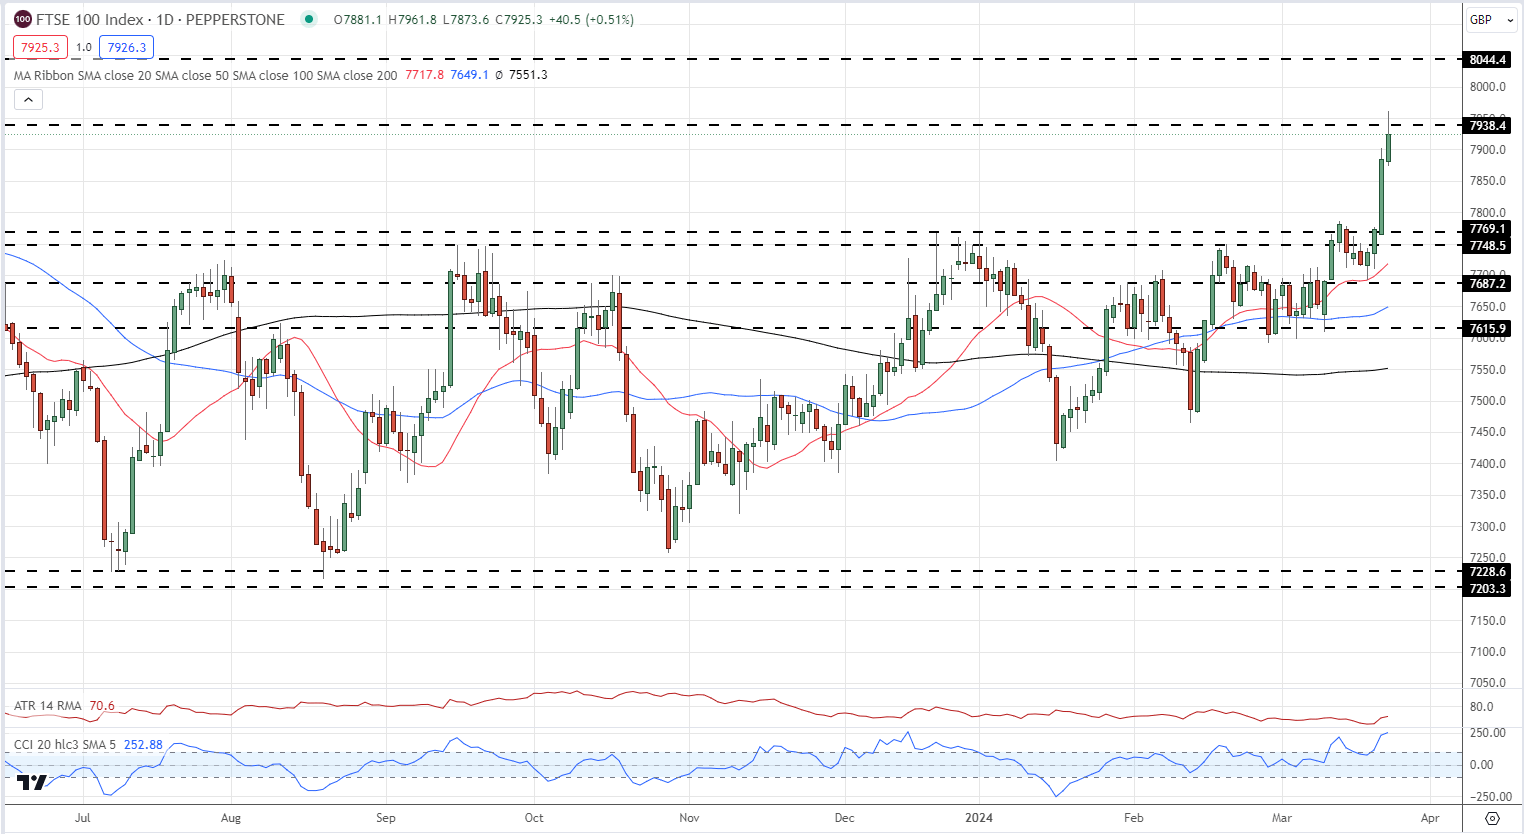
The FTSE 100 had a much better week as a weaker rate backdrop saw traders push the indices to a new one-year high. A weaker GBP/USD also helped fuel the move, boosting profits of FTSE 100 companies that earn US dollars abroad. With GBP/USD unlikely to push higher in the short term, the FTSE 100 will push higher. The FTSE 100 all-time high of 8044 is set to come under pressure in the weeks ahead.
FTSE 100 Daily Chart
What is your view on the British Pound, Gilt yields, and the FTSE 100