Australian Dollar Price Setup: Can AUD/USD Rise to 0.80?

Australian Dollar Price Setup: Can AUD/USD Rise to 0.80?

AUD/USD has fallen 7% since February but the retreat isn’t sufficient to conclude that the rebound from 2022 is over for two reasons. The drop to 0.6565 earlier this month marked a 50% retracement of the October-February rise – in general, 38%-50% retracements are considered to be normal, and not necessarily the end of the (prior) trend. Secondly, AUD/USD held a crucial support area of 0.6580-0.6625 (including the November and December lows). A decisive break (two weekly closes below) would have disrupted the higher-top-higher-bottom sequence since the end of last year.

To be fair, the price action is still unfolding, and AUD/USD could decline further, negating the prospective bullish pattern and changing the outlook to bearish. In this regard, the 0.6780-0.6850 resistance area is key – the pair needs to rise above the barrier for the bullishness to resume. Until then the path of least resistance is sideways to down. Any break below this month’s low of 0.6565 could open the way toward 0.6400.

AUD/USD Daily Chart

image1.png

On the other hand, any break above 0.6780-0.6850 would imply that the uptrend from October is intact, initially opening the way toward the February high of 0.7150. A break there would trigger a major head & shoulders pattern (the left shoulder is the July low; the head is the October low; and the right shoulder is this month’s low), exposing upside potential toward the 2021 high of 0.80 in subsequent months.

Australia inflation data released on Wednesday cemented expectations of a pause in interest rate hikes at RBA’s meeting next week, weighing on AUD. The market is pricing a less than 10% chance of a rate hike on April 4. The Australian central bank last month raised its official cash rate to 3.6%, the highest level in more than a decade, with the central bank governor Lowe saying the bank has a “completely open mind” about its April policy meeting and will be guided by key economic data.

AUD/USD Weekly Chart

image2.png

Aside from the relative monetary policy outlooks (including the US Federal Reserve’s data-dependent approach), Australian macro data has been mixed – a strong February jobs report overshadowed by downbeat retail sales and financial stability concerns.

Still, AUD is likely to benefit from higher commodity/iron ore prices on China’s efforts to revive its property market and accelerated the re-opening of the economy. Moreover, the news of Alibaba’s plans for a major revamp have boosted hopes that China’s regulatory crackdown on corporates could be ending. China accounts for about half of the industrial metal demand and about two-thirds of the world’s iron ore. China is Australia’s biggest export market and iron is Australia’s largest export earner.

Crude Oil Prices Fall on Soft Fed Energy Report, Eyes on US Jobless Claims Next

Crude Oil Prices Fall on Soft Fed Energy Report, Eyes on US Jobless Claims Next

WTI crude oil prices fell about 1% on Wednesday, although the commodity is on course to rise about 5% this week. Broadly speaking, sentiment-linked oil diverged from what was a broader improvement in risk appetite. On Wall Street, the tech-heavy Nasdaq 100 rallied 1.8%, closing at the highest since the end of August. The index is now in a bull market, up 20% from the most recent bottom.

So why then did crude oil diverge from the ‘risk-on’ dynamic? A key culprit seemed to be an energy report by the Federal Reserve Bank of Dallas. Oil executives were surveyed by the central bank and they expect the price of oil to reach USD80 per barrel by the end of this year. That would represent a deterioration from the prior survey, which called for about USD84 per barrel.

Still, it could have been worse for WTI. The latest inventory report by the EIA showed that stockpiles last week unexpectedly contracted by about 7.5 million barrels. Economists were looking at roughly a +610k increase. This unexpected decrease in supply worked to cushion the bearish effect of the energy report from the Dallas Fed.

Looking ahead, traders will be closely watching the next US jobless claims report, due at 12:30 GMT. Filings are expected to rise by 195k last week versus 191k prior. This data is some of the timeliest information we have on the labor market. The reason why this is important is that we will get a better idea of how the economy is faring in the wake of Silicon Valley Bank’s collapse. An unexpected surge could induce recession woes, which may end up denting WTI further.

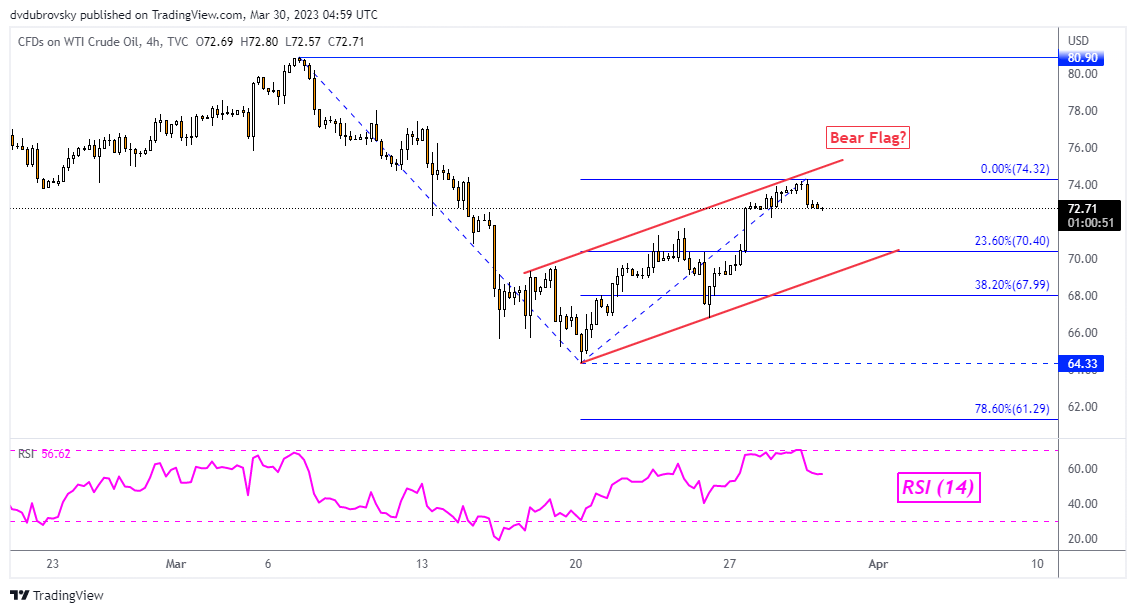
Crude Oil Technical Analysis – 4-Hour Chart

WTI appears to be carving out a Bear Flag chart formation on the 4-hour setting below. The latest test of the ceiling could see prices aim toward the floor. Subsequent downside follow-through could open the door to extending losses seen through the middle of March. Otherwise, key resistance seems to be at 74.32. Clearing this point exposes the March peak at 80.90.

Crude Oil Technical Analysis – 4-Hour Chart


Bitcoin Technical Outlook: Medium-Term Downward Pressure is Fading

Bitcoin Technical Outlook: Medium-Term Downward Pressure is Fading

BITCOIN TECHNICAL OUTLOOK – BULLISH

Bitcoin’s break earlier this month above a four-year moving average has raised the odds that the medium-term downward pressure is fading. However, the unwinding of a year-long slide could be prolonged and bumpy.

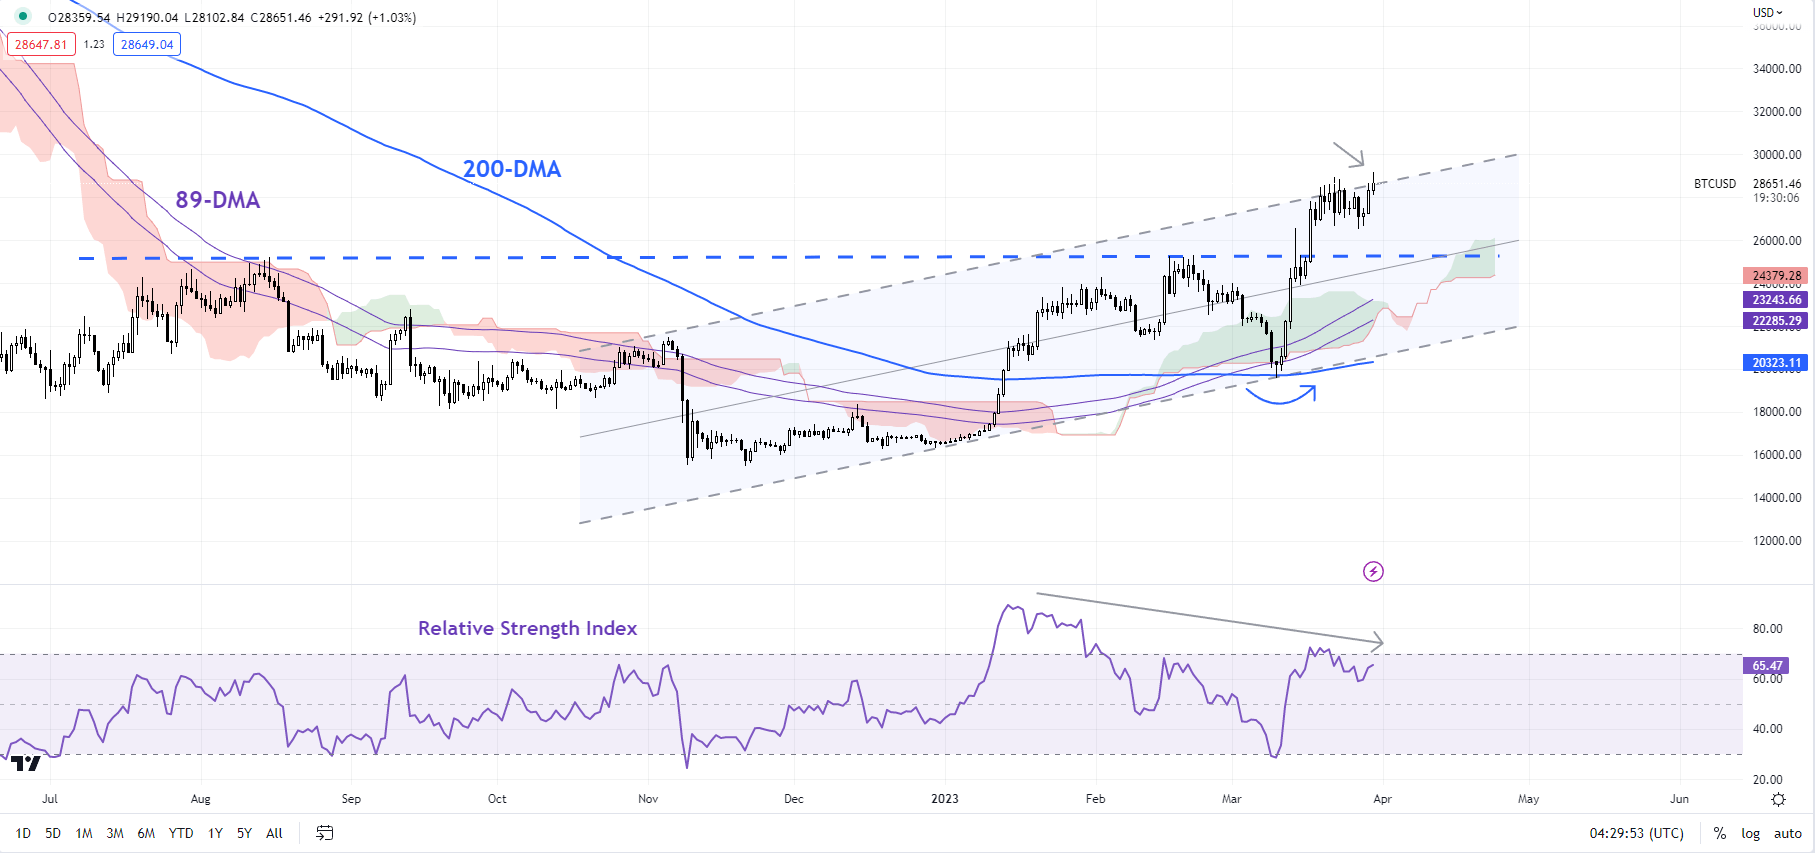
Earlier this month, BTC/USD rebounded from near strong converged cushion at 19500-21400 (including the 200-day moving average, the 89-day moving average, and the lower edge of the Ichimoku cloud on the daily charts. Within the overall context, the retreat in February was part of the consolidation and not a reversal of the uptrend.See the previous update highlighting the key support area and the overall bullish bias.

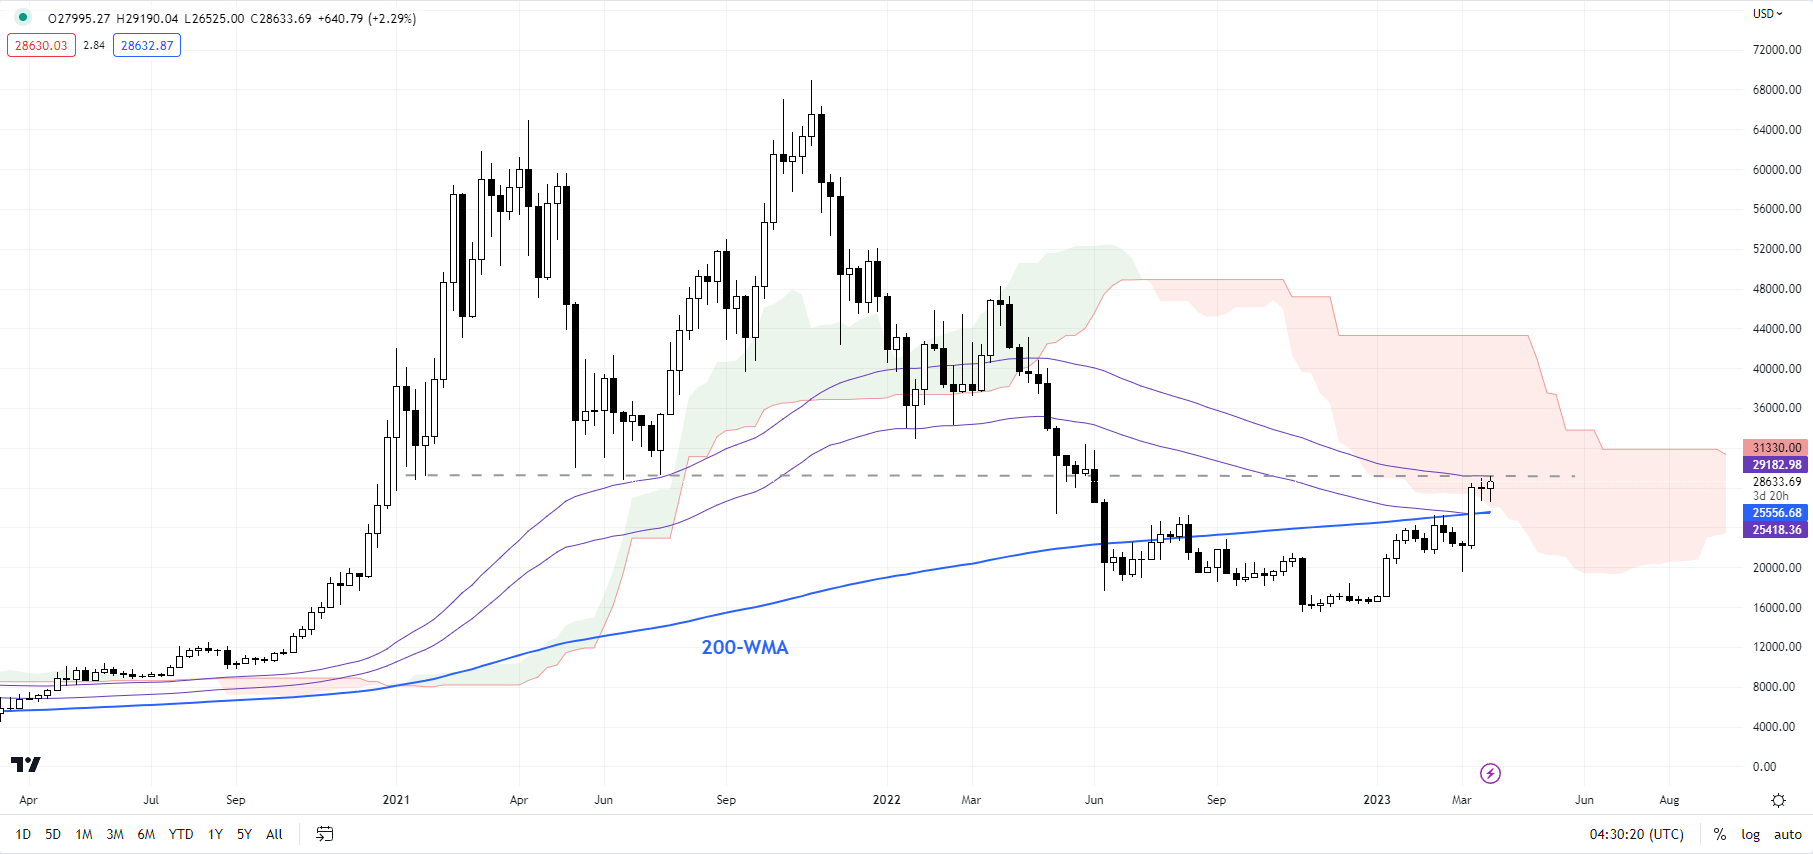
BTC/USD Weekly Chart

image1.png

Chart Created Using TradingView

The subsequent break above the February high of 25250 to a new nine-month high also coincided with a move above the 200-week moving average. The rise above the four-year average has raised the odds that the medium-term downward pressure is fading. (See the mid-January updatefor more details.) Importantly, the developments on charts in recent weeks confirm that cryptocurrencies are in the process of building a base. (See the mid-November update).

BTC/USD Daily Chart

image2.png

BTC/USD is now testing yet another ceiling: the June 2021 low of 28800, coinciding with the 89-week moving average, near the top end of a rising channel from the end of 2022. A negative momentum divergence (rising price associated with a stalling in momentum) implies that the rally is showing signs of fatigue in the near term.

BTC/USD 240-minute Chart

image3.png


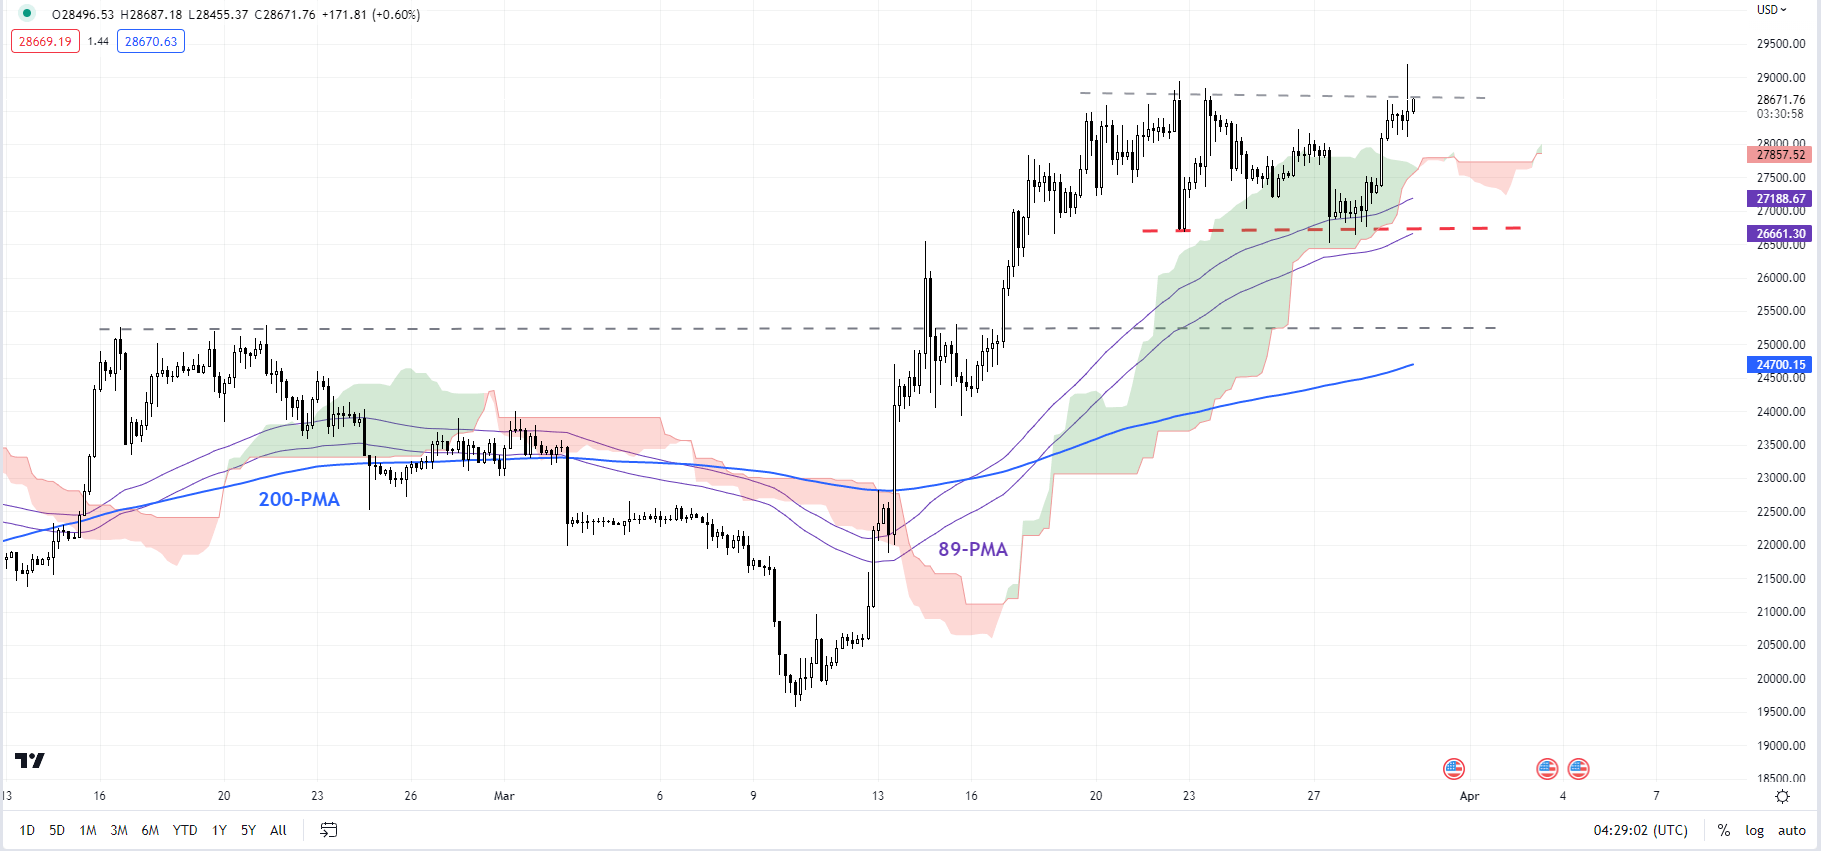
Any break below immediate support at Monday’s low of 26525 could open the way toward the 200-period moving average on the 240-minute chart (see chart). For the nascent upward trajectory to reverse, BTC/USD would need to fall below the early-March low of 19540. Until then, the ‘two-steps-forward-one-step-back’ nature of recovery could continue.

British Pound Price Setup: GBP/USD, EUR/GBP, GBP/JPY

British Pound Price Setup: GBP/USD, EUR/GBP, GBP/JPY

The British Pound’s rebound this month from fairly strong support keeps alive the possibility of further gains against the US dollar.

GBP/USD has been supported by last week’s interest rate hike by the Bank of England (BoE) and comforting remarks from BoE Governor Andrew Bailey on Tuesday regarding the resilience of the UK banking system. BoE hiked the Bank Rate by 25bps last week, in line with expectations given still-high inflation, but reiterated its data-dependent approach for further interest rate hikes. Moreover, Governor Bailey said on Tuesday that Britain was not experiencing stress linked to the collapse of Silicon Valley Bank and Credit Suisse.

GBP/USD Daily Chart

image1.png

Moreover, UK data has surprised to the upside in recent weeks, with the Economic Surprise Index at its highest level since January. Money markets are now pricing in a high chance of one more BOE rate hike by May and don’t foresee any rate cuts at least until early 2024. In contrast, markets are pricing in a less than 50% chance of one more Fed rate hike in May, with two rate cuts priced in by the end of the year.

GBP/USD: Uptrend intact

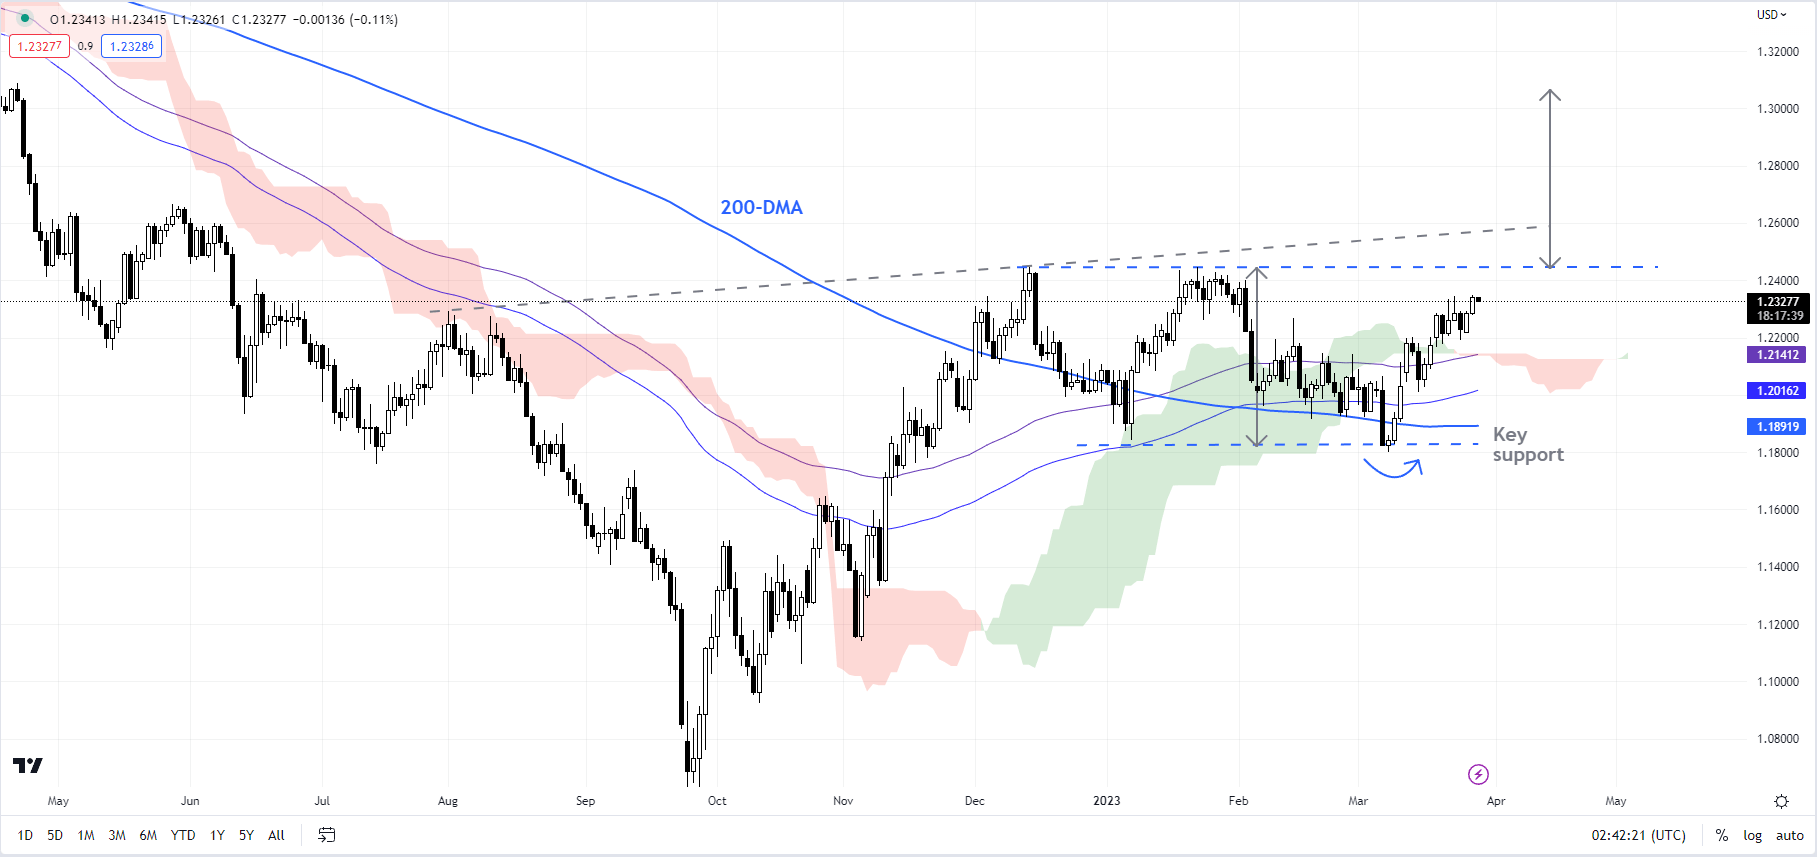
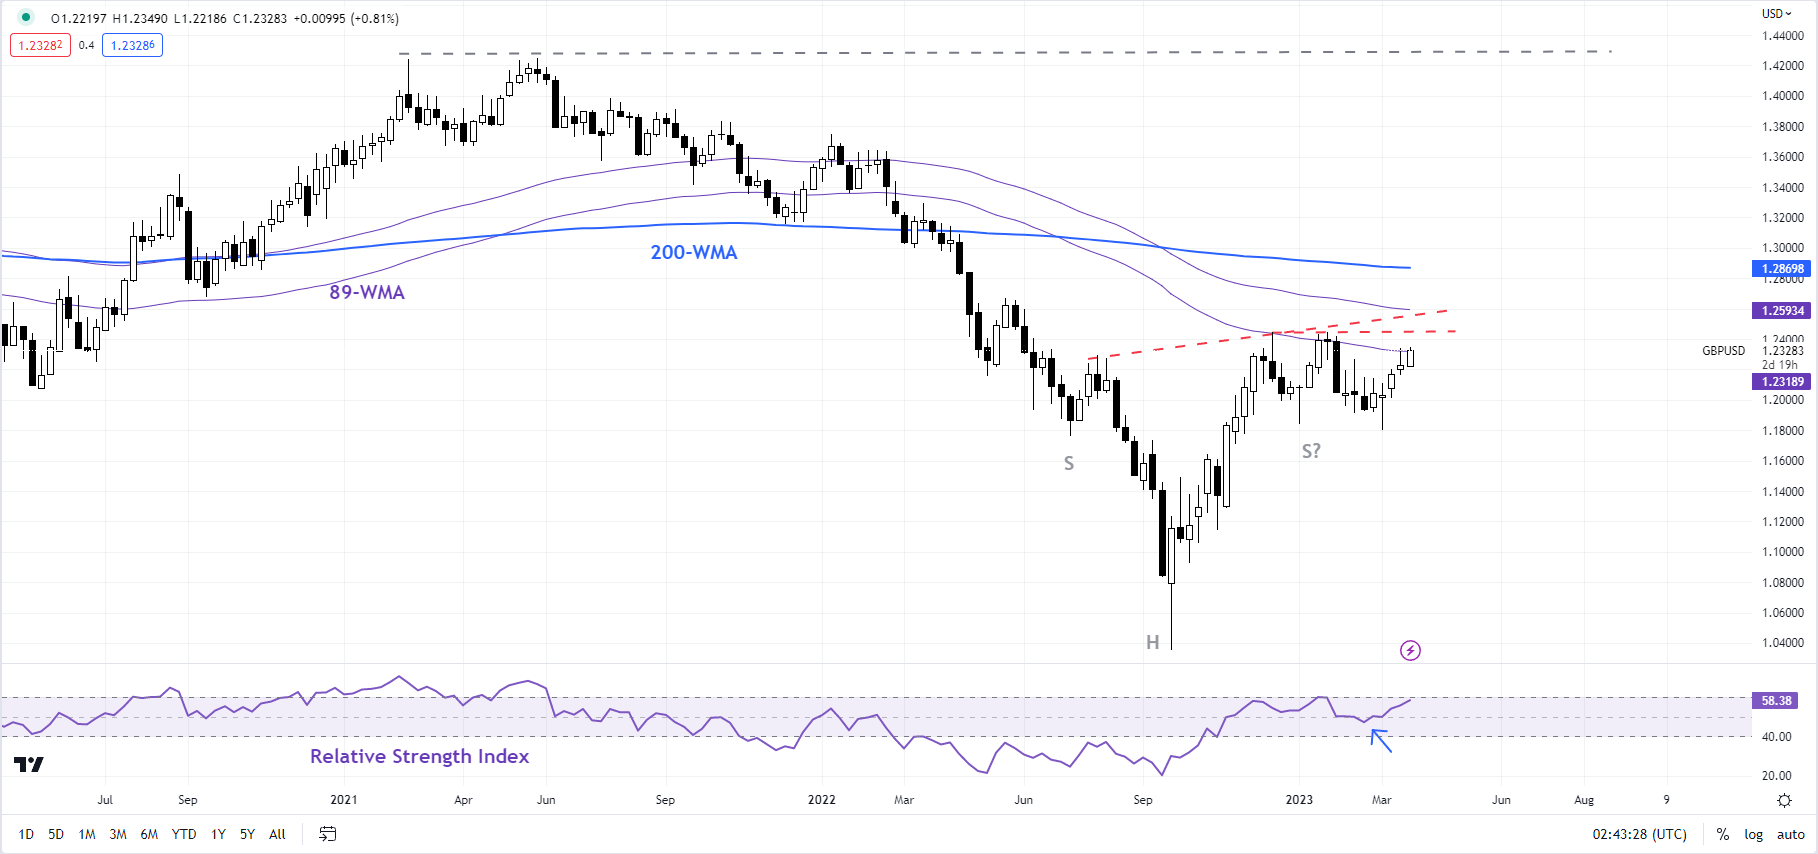
GBP/USD has rebounded from a vital converged floor of around 1.1840, including the early-January low, the 200-day moving average, and the lower edge of the Ichimoku cloud support, negating the risk of a minor double top. See “British Pound Price Setup: GBP/USD Looks Fragile Ahead of US PCE Data”, published February 24.

GBP/USD Weekly Chart

image2.png

Importantly, the sequence of higher-top-higher-bottom remains intact. Any break above the top end of the recent range at 1.2450, roughly coinciding with a slightly upward-sloping neckline from August would trigger a major reverse head & shoulders pattern (the left shoulder at the July low, the head at the September low, and the right shoulder at the 2023 low), potentially opening the door for significant gains in subsequent months.

EUR/GBP Daily Chart

EUR/GBP: Looking vulnerable

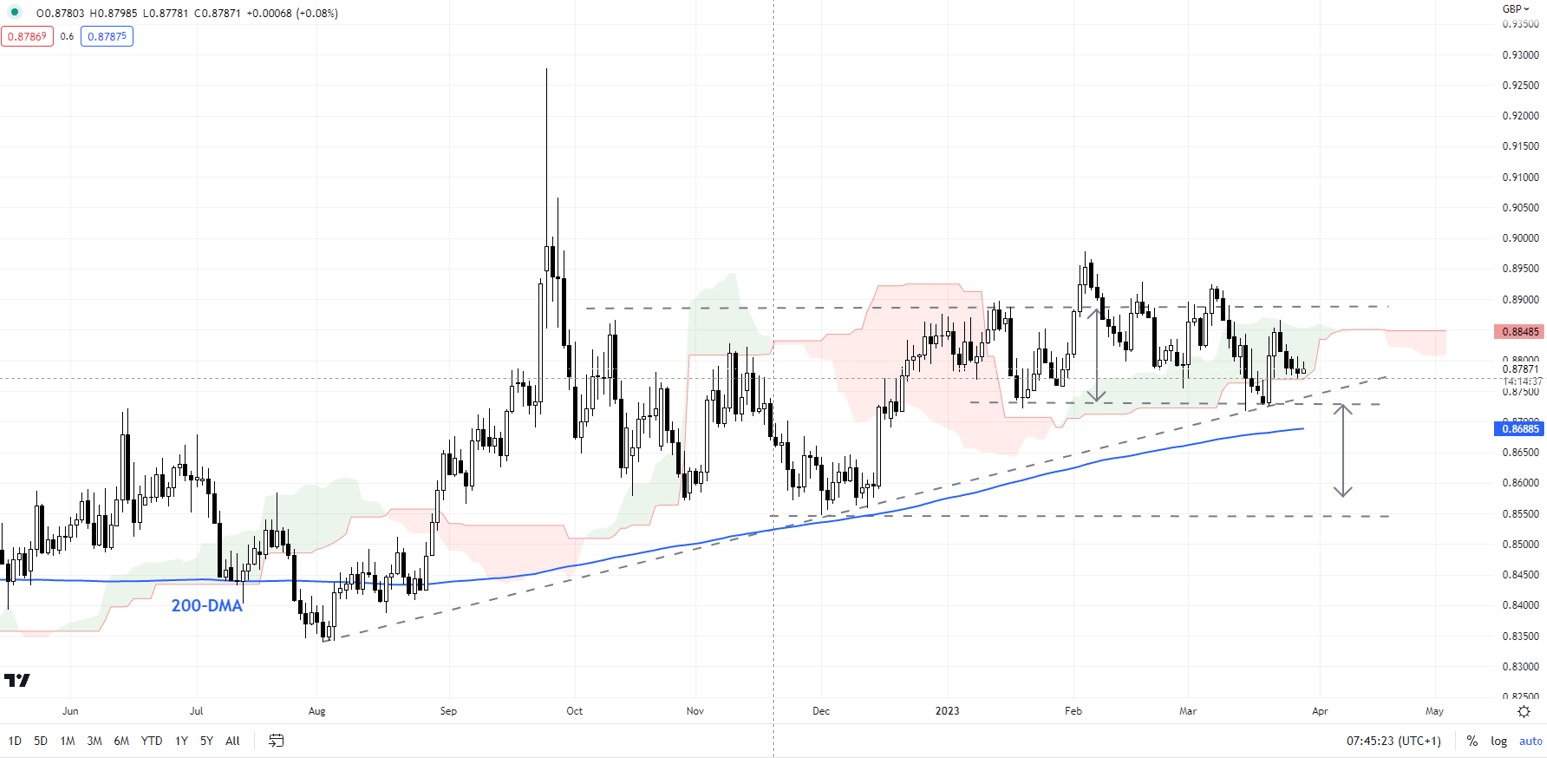
EUR/GBP’s failure to break past a horizontal trendline resistance at about 0.8900 confirms that the broader bias remains range to slightly down. Any break below immediate support on a horizontal trendline from early 2023 at about 0.8700, roughly around the 200-day moving average, could open the way toward the December low of 0.8545.

GBP/JPY Daily Chart

GBP/JPY: Holds above crucial support

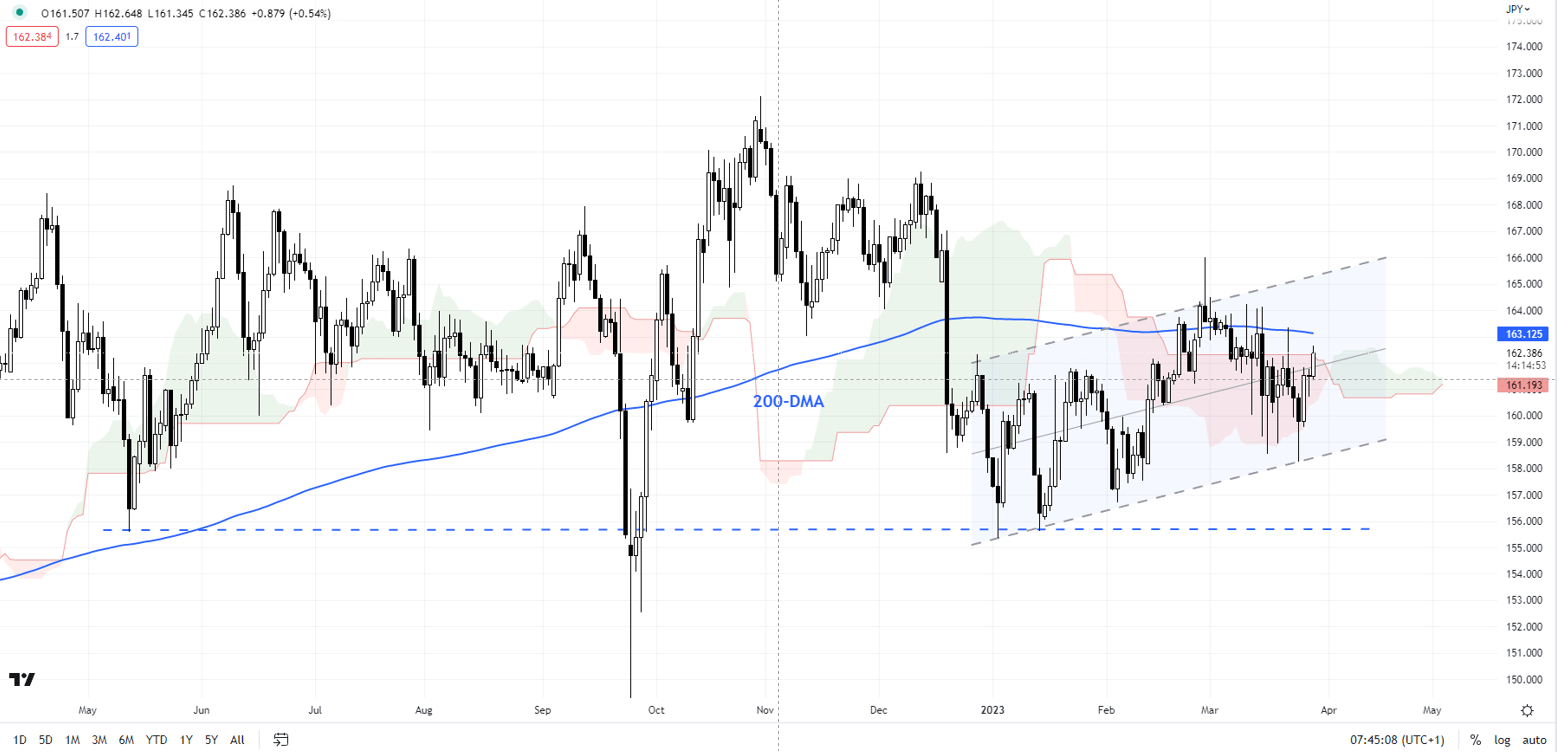
GBP/JPY has been in a broad range in recent months, holding above strong support on a horizontal trendline from last year at about 155.50. Most recently, the cross has been guided higher within a slightly upward sloping channel from the start of 2023. The cross would need to clear the upper edge of the channel (now at 165.50) for the uptrend to resume.

EUR/CHF IG Client Sentiment: Our data shows traders are now net-short EUR/CHF for the first time since Jan 13, 2023 when EUR/CHF traded near 1.00.

EUR/CHF IG Client Sentiment: Our data shows traders are now net-short EUR/CHF for the first time since Jan 13, 2023 when EUR/CHF traded near 1.00.

EUR/CHF Client Positioning

Number of traders net-short has increased by 26.45% from last week.

SYMBOL TRADING BIAS NET-LONG% NET-SHORT% CHANGE IN LONGS CHANGE IN SHORTS CHANGE IN OI
EUR/CHF BULLISH 49.35% 50.65% -24.51% Daily

-13.18% Weekly

46.27% Daily

26.45% Weekly

0.00% Daily

3.20% Weekly

EUR/CHF Bullish

EUR/CHF: Retail trader data shows 49.35% of traders are net-long with the ratio of traders short to long at 1.03 to 1. In fact, traders have remained net-short since Jan 13 when EUR/CHF traded near 1.00, price has moved 0.58% lower since then. The number of traders net-long is 24.51% lower than yesterday and 13.18% lower from last week, while the number of traders net-short is 46.27% higher than yesterday and 26.45% higher from last week.

We typically take a contrarian view to crowd sentiment, and the fact traders are net-short suggests EUR/CHF prices may continue to rise.

Our data shows traders are now net-short EUR/CHF for the first time since Jan 13, 2023 when EUR/CHF traded near 1.00. Traders are further net-short than yesterday and last week, and the combination of current sentiment and recent changes gives us a stronger EUR/CHF-bullish contrarian trading bias.

Gold Prices Remain Vulnerable to PCE Data as Retail Traders Boost Upside Exposure

Gold Prices Remain Vulnerable to PCE Data as Retail Traders Boost Upside Exposure

Gold prices aimed higher over the past 24 hours, gaining 0.87%. As we approach the end of March, XAU/USD is looking at about a 7.7% gain this month. If sustained, that would be the best performance since November.

The anti-fiat yellow gained despite a strong day for the 2-year Treasury yield. This followed upbeat US Conference Board Consumer Confidence data for March despite the collapse of Silicon Valley Bank and the ensuing uncertainty in the financial sector.

Markets have been slowly fading dovish Federal Reserve policy expectations. Despite this, the US Dollar did not receive much love on Tuesday. This is likely why gold performed well.

XAU/USD will be awaiting key US economic data later this week, such as the Federal Reserve’s preferred inflation gauge, PCE Core, on Friday. Stubbornly high prices would continue making it difficult for the Fed to manage the economy while tackling the aftermath of SVB’s collapse. This is a recipe for uncertainty and volatility. That is something that might benefit the US Dollar at the expense of gold.

XAU/USD Daily Chart

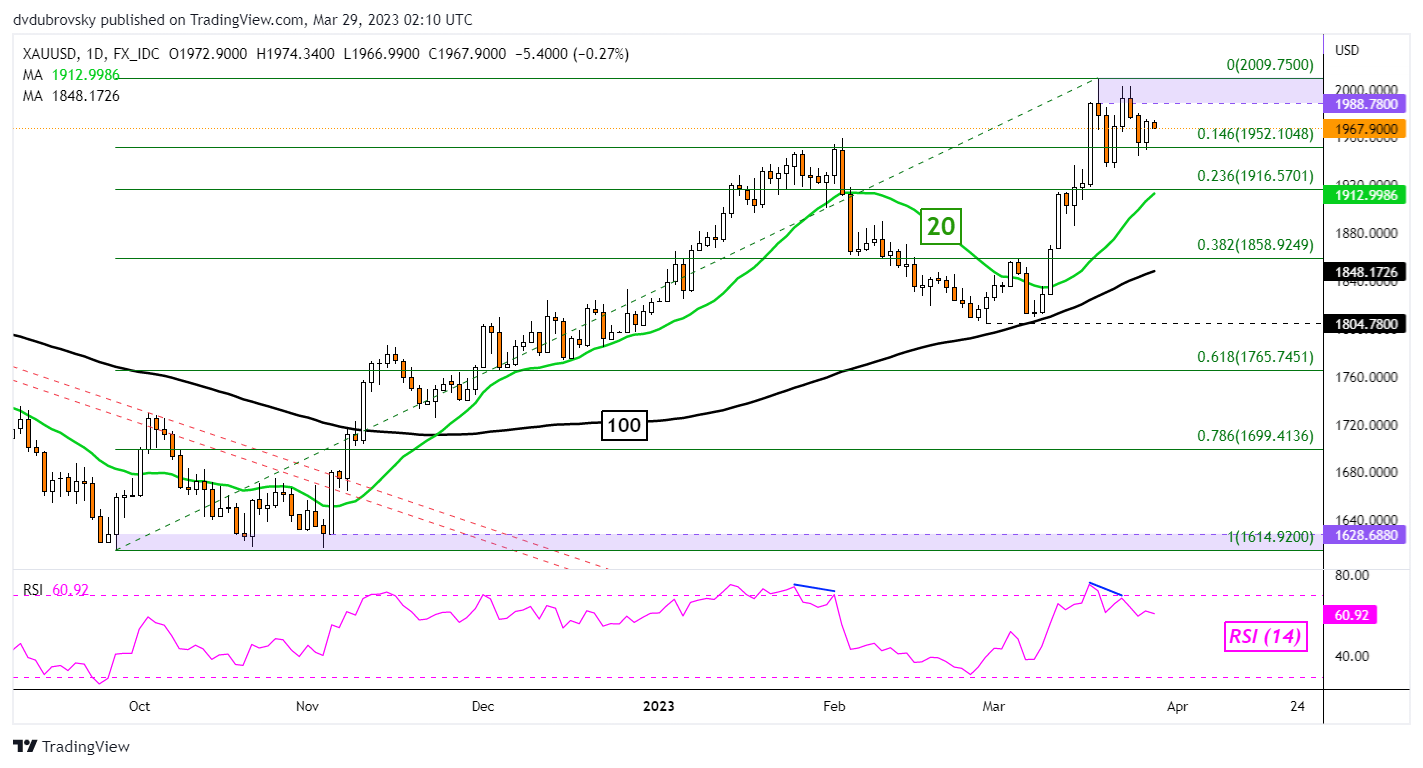
Overnight, gold reinforced the 14.6% Fibonacci retracement level at 1952, which remains as immediate support. The broader technical bias remains bullish since the yellow metal found a bottom in November. Key resistance is the 1988 – 2009 range. A drop through support exposes the 20-day Simple Moving Average (SMA).

XAU/USD Daily Chart

Gold Sentiment Analysis – Bearish

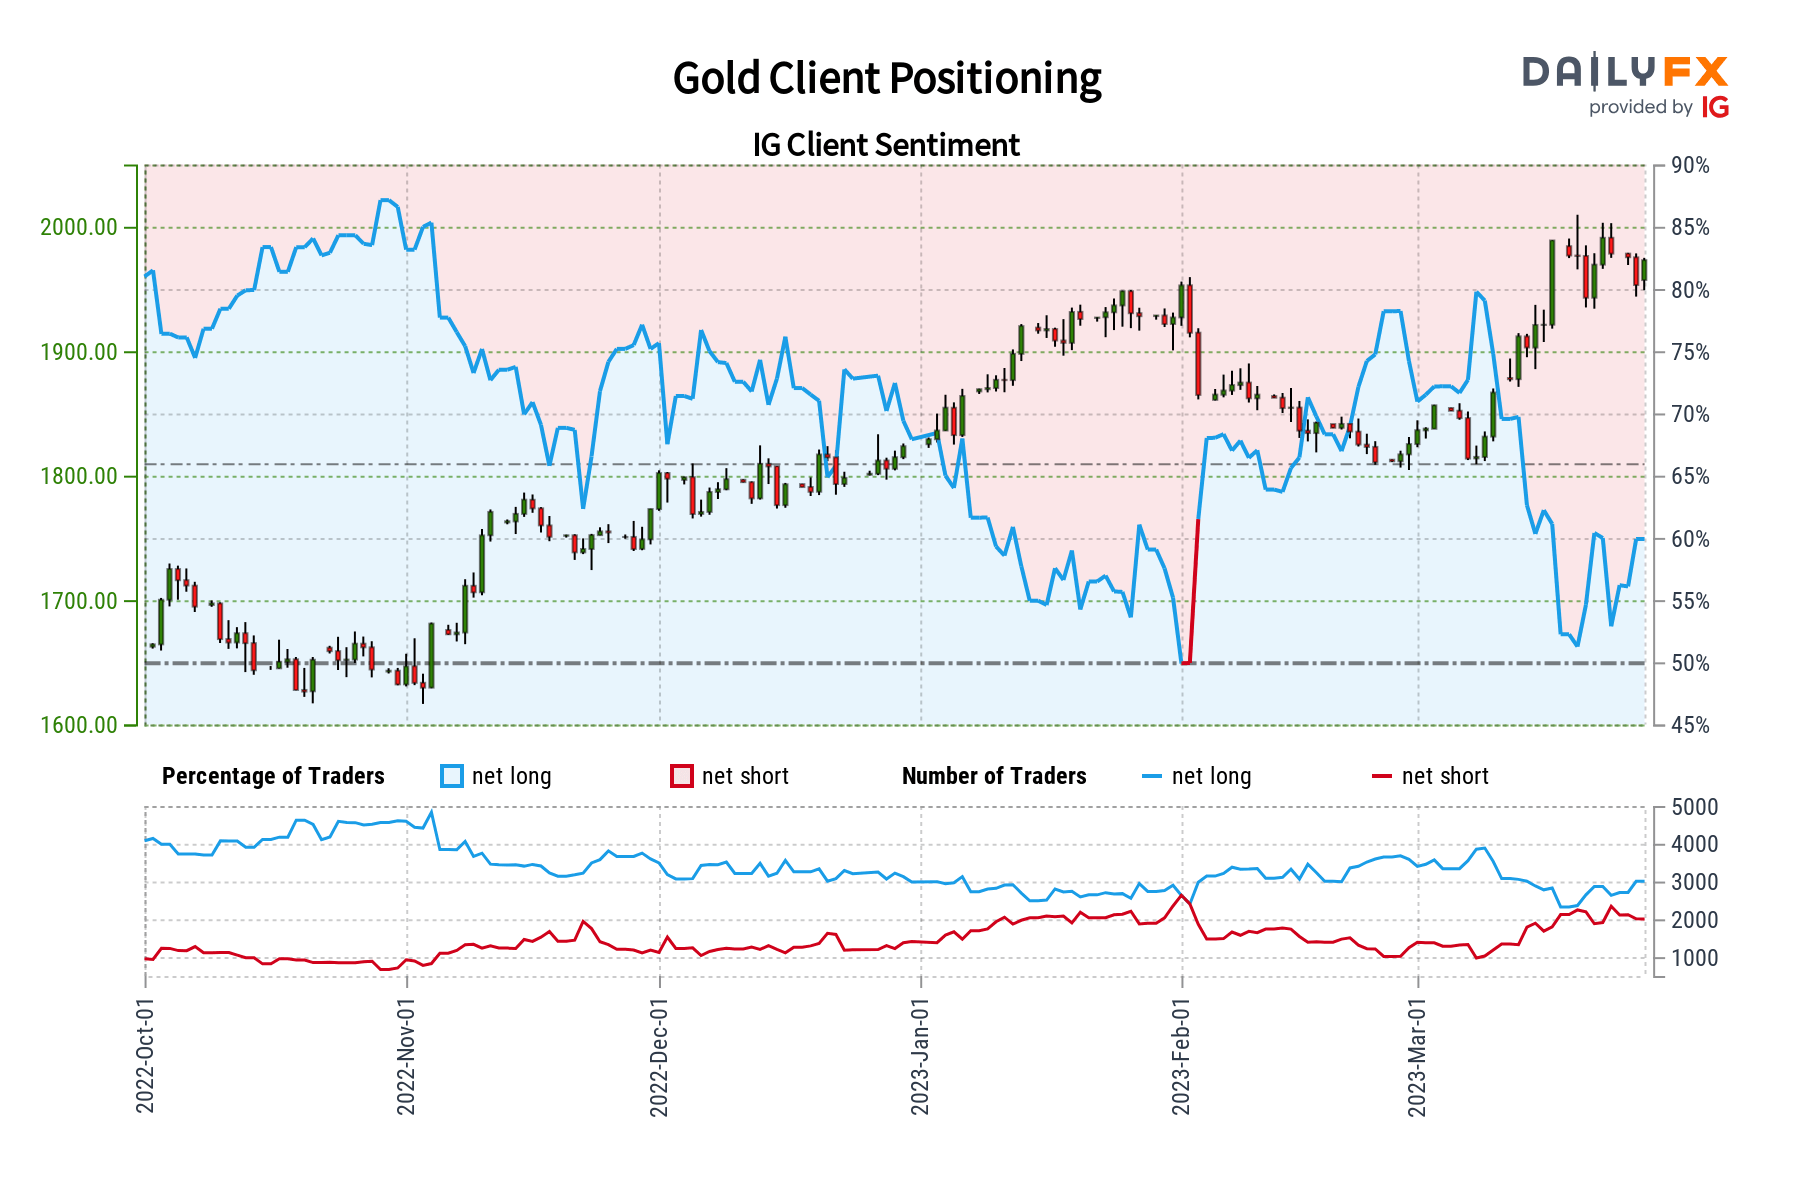
According to IG Client Sentiment (IGCS), about 61% of retail traders are net-long gold. IGCS tends to function as a contrarian indicator, especially in trending markets. Since most traders remain long, this hints prices may fall down the road. This is as upside exposure increased by 7.9% and 21.76% compared to yesterday and last week, respectively.

Gold Sentiment Analysis - Bearish

EUR/USD Price Analysis: Snaps two-day winning streak as bears approach 1.0800 key support

EUR/USD Price Analysis: Snaps two-day winning streak as bears approach 1.0800 key support

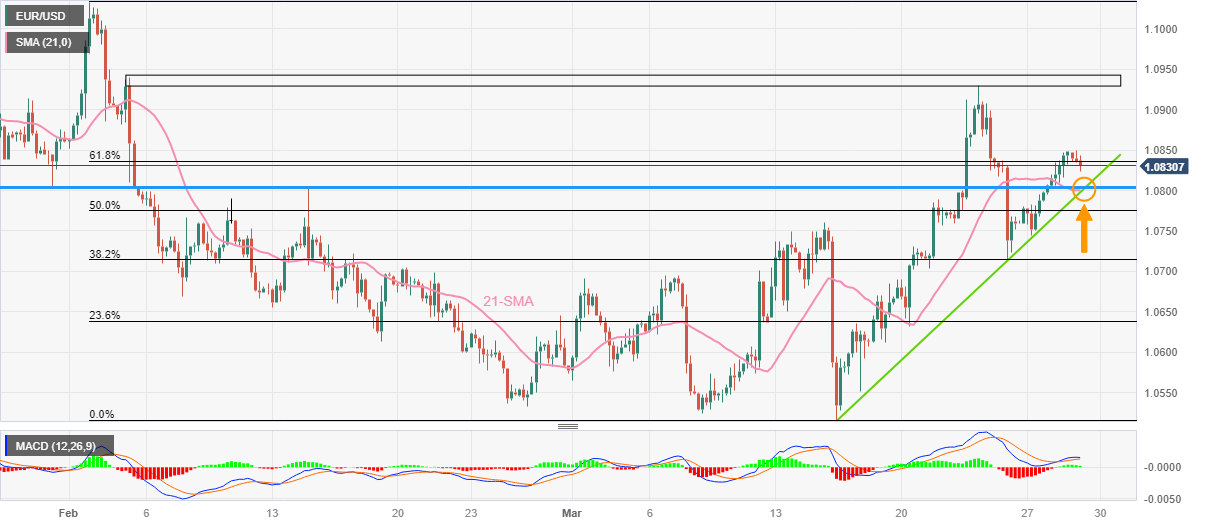
EUR/USD drops to 1.0830 as it welcomes intraday sellers during the initial hour of Wednesday’s European session. In doing so, the Euro pair prints the first daily loss in three.

The major currency pair’s latest weakness drags it back below the 61.8% Fibonacci retracement level of its February-March downside, following a brief run-up, which in turn teases sellers. Adding strength to the downside bias is the looming bear cross on the MACD indicator.

It should be noted, however, that a convergence of the 21-SMA, horizontal line from late January and a two-week-old ascending trend line together highlight the 1.0800 as a tough nut to crack for the EUR/USD bears.

In a case where the Euro pair drops below 1.0800, the mid-month top around 1.0760 and the last Friday’s high near 1.0715 could lure the bears.

Alternatively, a clear upside break of the recent top surrounding 1.0850 becomes necessary for the EUR/USD buyers to return to the table.

However, a seven-week-long broad resistance area between 1.0930 and 1.0940 can challenge the Euro pair’s further advances, a break of which could quickly propel the pair toward the Year-To-Date (YTD) high marked in January around 1.1033.

EUR/USD: Four-hour chart


EUR/USD consolidates below 1.0850 amid upbeat mood

EUR/USD consolidates below 1.0850 amid upbeat mood

EUR/USD is easing below 1.0850 in the early European morning. Traders turn cautious, despite easing banking fears, as the focus shifts toward the euro area inflation data. The pair’s pullback could be also attributed to a broad US Dollar rebound.

Despite the recent advance, the EUR/USD is still far from last week’s highs and technical indicators on the daily chart show no clear signs for the short term. The main trend is bullish and the price is well above key moving averages. Against this backdrop, more consolidation ahead between 1.0750 and 1.0900 seems likely.

The 4-hour chart shows EUR/USD retaining the bullish bias. The move higher lost momentum before the 1.0850 zone but the correction has been limited so far. The chart shows the 20-period Simple Moving Average (SMA) turning south, as well as the RSI. Indicators suggest a break above 1.0850 is not imminent and favor a correction on Asian hours. A strong support emerges around 1.0800, where the 20-period SMA stands. An uptrend line awaits at 1.0795, and a break lower would point to more weakness.

The EUR/USD rose on Tuesday again. The slow move to the upside found resistance just below 1.0850, primarily driven by a weaker US Dollar. The pair continues to move with a bullish bias, but consolidative moves look set to prevail. The Euro continues to receive support from hawkish expectations regarding the European Central Bank (ECB). A 25 bps rate hike at the next meeting (May 4) is mostly priced in.

European banks avoided headlines on Tuesday, a sign that the banking crisis is easing. The tone across markets was positive in Europe but faded in Wall Street, where equity prices turned to the downside during the second half of the session. The deterioration in market sentiment helped the US Dollar stabilize. The Greenback was among the worst performers, even as US yields moved higher, with the 10-year holding above 3.50% and the 2-year at 4.05%.

Analysts await key inflation data while looking at development around the baking industry. Germany, France and Spain will report inflation figures on Thursday, the Eurozone on Friday. In the US, the following key report is due on Friday with the Core Personal Consumption Expenditure Price Index, the Federal Reserve’s preferred gauge of inflation. Data released on Tuesday showed consumer sentiment in the US improved modestly in March, with the Conference Board’s Consumer Confidence Index increasing to 104.2 from 103.4 in February.

Recovery continues, but momentum slows

Recovery continues, but momentum slows

Recovery continues, but momentum slows

Consumer sentiment in Germany painted a mixed picture in March. While income expectations continued their recovery, the propensity to buy showed little change. In contrast, economic expectations must accept a small setback after previously increasing four times in a row. GfK is forecasting -29.5 points in consumer sentiment for April, up 1.1 points from March of this year (revised -30.6 points). These are the findings of the GfK Consumer Sentiment Study for March 2023.

Consumer sentiment thus continues to improve for a sixth time in a row. However, the momentum has noticeably weakened compared to previous months.

The renewed rise in consumer sentiment can be primarily attributed to the positive development of the income outlook. For the sixth time in a row, the indicator recorded an increase, rising by three points to -24.3 in March. This is the best value in ten months, when it stood at -23.7 points in May 2022. Despite the positive trend, the level of income expectations remains markedly low.

“Income expectations are currently benefiting from the recent noticeable drop in energy prices, especially for gas and heating oil. Nevertheless, inflation will remain high this year, even if it will be somewhat lower than the 6.9 percent measured in 2022 according to the forecasts available so far.”, explains GfK consumer expert Rolf Bürkl. “The expected loss of purchasing power is preventing a sustained recovery in domestic demand. Accordingly, private consumption is unlikely to make a positive contribution to economic growth in Germany this year. This is also signaled by the still very low level of consumer sentiment.”

Low-level propensity to buy virtually unchanged

The propensity to buy is apparently unable to benefit from the improved income expectations in March. After a meager gain of 0.3 points compared to the previous month, the indicator shows little change. Currently standing at -17.0 points, the indicator is also 15 points lower than the previous year´s value.

This stagnant development shows the uncertainty still prevalent among consumers. Stable employment conditions as a positive factor for the propensity to buy and noticeable losses in purchasing power as a burdening factor are currently ensuring a development without a clear trend.

Economic expectations lose slightly

In contrast to income expectations, economic expectations are taking a small break in March. After four consecutive increases, the indicator suffers moderate losses. After a decrease of 2.3 points, the indicator drops to 3.7 points. This means that economic sentiment remains above its long-term average, which is at zero points. Compared with the same period of the previous year, the figure is actually up by 12.6 points.

Whether a recession can be avoided in Germany has recently become more doubtful again. At the very least, a technical recession, means two consecutive quarters with a decline in gross domestic product (GDP), has become more likely again. After GDP was already in negative territory at -0.4 percent in the last quarter of 2022, a slight decline is also possible in the first quarter of 2023. However, experts currently expect the German economy to recover somewhat in the second half of the year.


Hang Seng Index Jumps on Alibaba News as Banking Issues Subside. Higher HSI?

Hang Seng Index Jumps on Alibaba News as Banking Issues Subside. Higher HSI?

The Hang Seng Index (HSI) was up over 2.5% at one stage today on positive news for Alibaba and against a backdrop of the banking problems subsiding.

Hong Kong’s HSI posted solid gains after Alibaba announced that the business will be split into six separate business units.

The restructure saw investors reappraise their valuations for the tech behemoth. It may open the possibility of several initial public offerings (IPO) for each spin-off.

The stock closed on Tuesday at HKD 84.35 (USD 10.75) and hit a high of HKD 98.00 (USD 12.49) today. The market cap is now close to HKD 2 trillion, which is over USD 250 billion.

There is speculation that the decentralization of the group may have ticked several Chinese government regulatory boxes.

The news comes as Co-Founder Jack Ma returned to mainland China after an extended absence. It has ignited optimism in some quarters that the local government might be looking to change policy tack for the private sector to provide more favourable investment conditions.

Other APAC equity markets are generally in the green. Futures are pointing toward a positive start to the European and North American equity indices at the time of writing.

The markets appear to have found reassurance again after a US Senate hearing on the banking problems.

The regulators stated that the issues with SVB Financial were specific to internal mismanagement by the bank and were not likely to be systemic throughout the banking sector.

The Japanese Yen has been the notable underperformer in the currency space today with its perceived haven status less desirable in a ‘risk-on’ type of day. The US Dollar is generally firmer across the G-10 board.

The Aussie Dollar is a touch weaker after soft CPI data. It was 6.8% year-on-year to the end of February although it should be noted that the monthly number is less reliable than the quarterly read that will be released in late April.

Treasury yields barely changed through the Asian session after having added a few basis points overnight. Gold is steady near USD 1,670.

Crude oil has consolidated today after gaining so far this week. The WTI futures contract has been travelling above US$ 73.50 bbl while the Brent contract is eyeing US$ 79 bbl.

Looking ahead, after some European consumer confidence numbers, the UK and the US will see mortgage data.

HANG SENG INDEX TECHNICAL ANALYSIS

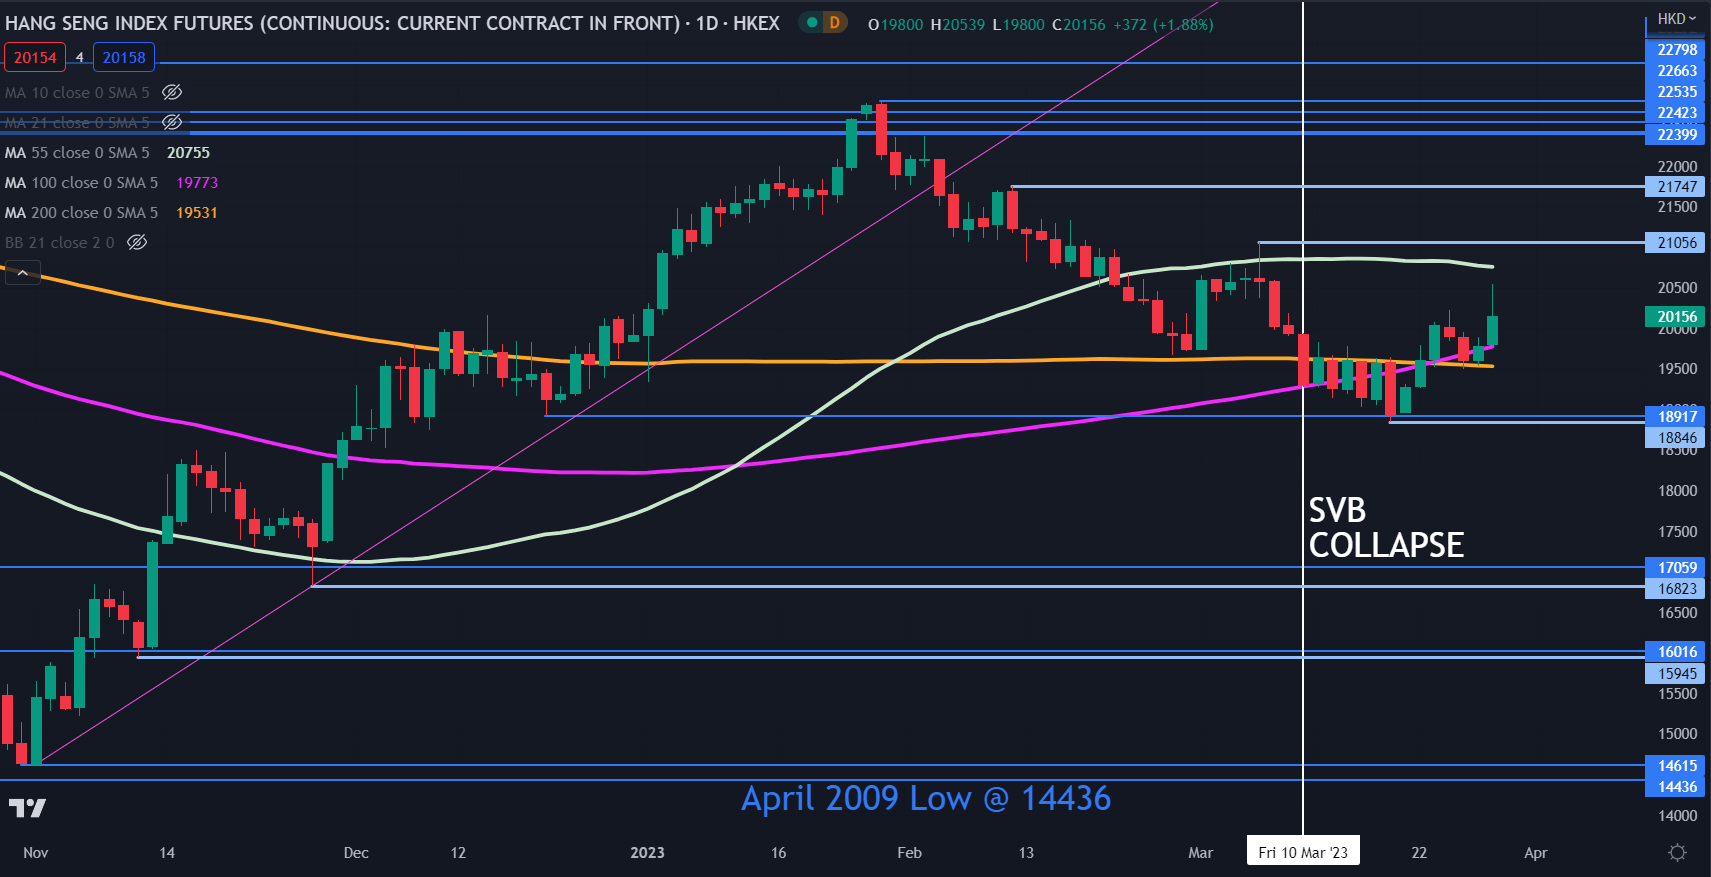
The Hang Seng Index (HSI) rally pushed it further above the 100- and 200-day simple moving averages (SMA) today.

This may indicate underlying bullish momentum could be evolving. A move above the 55-day SMA might confirm this.

Resistance might be offered at the recent peaks of 21056, 21747 and 22798. The latter has a series of historical breakpoints below that may add weight to it.

On the downside, support could lie at the prior lows of 18846, 16823 and 15945. All three levels have a breakpoint nearby.

image1.png