EUR/USD: A move to 1.10 in the coming weeks remains a very tangible possibility – ING

EUR/USD: A move to 1.10 in the coming weeks remains a very tangible possibility – ING

Markets are once again forced to re-assess the risks of the banking crisis and that will drive much of the G10 FX swings this week. Still, monetary policy differentials seem to point more clearly to a higher EUR/USD, in the view of economists at ING.

Reassessing risks?

“While our general view favours a higher EUR/USD on the back of monetary policy divergence, last Friday brought a warning not to jump to the conclusion that this banking turmoil is turning into a US-only story – and therefore into a straight-line bullish EUR/USD. Still, a move to 1.10 in the coming weeks remains a very tangible possibility.”

“For this week, re-testing 1.0900 would already be a very welcome sign for EUR/USD bulls.”

Gold Price Trickles Lower as Acceptance Above the $2000 Level Remains Elusive

Gold Price Trickles Lower as Acceptance Above the $2000 Level Remains Elusive

Gold (XAU/USD) FUNDAMENTAL BACKDROP

Gold prices trickled lower in Asian trade as acceptance above the $2000 handle remains elusive. Overnight we saw some dollar strength and modestly better sentiment allowing an ease in safe haven demand.

Friday’s concerns around Deutsche Bank failed to inspire a sustained break and acceptance above the $2000 handle. The Asian session also brought news about the SVB bank, as it was finally acquired by First Citizens Bank who will receive a line of credit from FDIC in the case of liquidity issues. The precious metal however, remains delicately poised as regional banks in the US remain on edge amid undercapitalization concerns which could rear its ugly head.

The weekend also brought geopolitical concerns back into focus as Russian President Vladimir Putin stated his intentions to deploy tactical nuclear weapons in Belarus. The statement was met with a stern reply from NATO officials who called Putin’s comments dangerous and irresponsible. The manner in which markets digest these developments moving forward and whether we see signs of escalation may be a further driver of gold prices moving forward.

We do not have a lot in the way of data for the first half of the week with most significant US releases coming later in the week. We have CB Consumer Confidence, GDP Growth Rate and of course the Feds preferred gauge of inflation the Core PCE data to come.

image1.png

TECHNICAL OUTLOOK AND FINAL THOUGHTS

Gold has been a winner of late, however we could possibly see wild swings in prices moving forward given the host of factors at play. As mentioned above changes in the geopolitical landscape and a return of bank sector fears could push gold prices back toward the $2000 level. Alternatively improving sentiment may result in continued downside for the precious metal with a short-term view likely to be more suited to the current environment.

The continued rejection of the $2000 level remains pivotal for gold with immediate support resting at the $1960 handle. A break below opens up a retest of the $1934 support area. On the upside we do need a daily candle close above the $2000 level for a continuation of the bullish momentum in the precious metal.

Gold (XAU/USD) Daily Chart – March 27, 2023

USD/JPY Bounce Looks Corrective, Lacks News Backing

USD/JPY Bounce Looks Corrective, Lacks News Backing

The United States Dollar enjoyed a little bounce against the Japanese Yen on Monday, but the move looks corrective and comes on the back of scant economic news.

There has been a little relaxation of banking-sector jitters, which may have supported the greenback via a bit more stability in Treasury yields. Last week investors worried that European titan Deutsche Bank might be unpleasantly exposed to tightening monetary conditions, but those concerns seem to have waned as a new trading week gets underway, with that lender joining the sector in broad-based gains.

Reports that First Citizen Bank will acquire what’s left of troubled Silicon Valley Bank seem to have been taken well by stock markets.

Minneapolis Federal Reserve President Neel Kashkari said over the weekend that a credit crunch might slow the economy and that the Fed was watching this closely, but it’s unlikely that this was great news to markets.

USD/JPY has inched above the psychologically important 131.00 handle in European trading Monday but doesn’t yet look very comfortable up there. The day doesn’t promise many data-related trading opportunities. These will likely have to await Thursday, when we’ll get the final official look at US Gross Domestic Product data for the old year’s last three months, along with plentiful Japanese numbers from retail sales to industrial production. China’s manufacturing Purchasing Managers Index might also be relevant for the pair, given its bearing on Japan’s huge export sector.

Still, the lasting impact of all of these is likely to be short on USD/JPY. Interest-rate prospects and the health of the banking sector will continue to provide the background music for this pair.

USD/JPY Technical Analysis

Chart Compiled Using TradingView

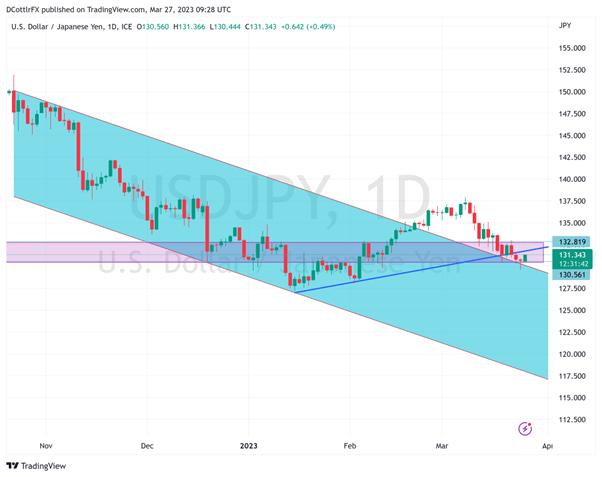
It’s hard to avoid the suspicion that USD/JPY has reached an interesting technical juncture on its daily chart. Having risen quite convincingly above its medium-term downtrend channel on February 14, it appears to have run out of steam and is now flirting with re-entry. The pair remains in a band of support and resistance bounded by February 6’s open at 132.82 and the following session’s intraday low of 130.49.

While bears appear keen to break the lower boundary of this band, they’ve yet to do so on a daily closing basis and it seems certain to herald further falls should they do so.

There seems to be some risk of a ‘head and shoulders’ chart formation forming on the chart, which would also likely presage further falls. The modest uptrend line from January 16’s low has been broken, and Dollar bulls will need to get back above it in short order to press their case. It now provides resistance at 131.94. That doesn’t look like a huge ask at present, but it will if 131.00 gives way.

Weekly Forex Forecast – NASDAQ 100 Index, Gold, Bitcoin, USD/JPY

Weekly Forex Forecast – NASDAQ 100 Index, Gold, Bitcoin, USD/JPY

The difference between success and failure in Forex / CFD trading is highly likely to depend mostly upon which assets you choose to trade each week and in which direction, and not on the exact methods you might use to determine trade entries and exits.

So, when starting the week, it is a good idea to look at the big picture of what is developing in the market as a whole, and how such developments and affected by macro fundamentals, technical factors, and market sentiment. There are just a very few valid long-term trends in the market right now, which might be exploited profitably. Read on to get my weekly analysis below.

Fundamental Analysis & Market Sentiment

I wrote in my previous piece on 19th March that the best trade opportunities for the week were likely to be:

  • Long Gold against the USD – the price declined over the week by 0.47%.
  • Long Bitcoin against the USD – the price declined over the week by 2.20%.
  • Long Japanese Yen against the USD – the price rose over the week by 0.83%.
  • Long of the NASDAQ 100 Index following a daily close above 12820 – this did not set up as there was no daily close last week above 12820.

Unfortunately, these trades produced an overall averaged loss of -0.61%.

The news is dominated by three major issues:

  1. A continuing banking crisis. Although there were no additional bank failures last week, following the failures of Silicon Valley Bank and Signature Bank in the USA during the previous week, banking shares remains weak and bearish. The week ended with great concern over Deutsche Bank whose share price declined by approximately one third over the week.
  2. The Federal Reserve’s 0.25% rate hike. The hike was widely expected, although there was a strong minority belief that the Fed would pass on any further hike. The Fed strongly hinted this would be the last hike in the present tightening cycle, which would leave the current 5% rate as the terminal rate. The Fed continued to express concern about inflation, and Powell stated that the banking crisis will not help the odds of a soft landing for the US economy.
  3. Rate hikes by the BoE and SNB. As expected, the Bank of England raised its interest rate by 0.25%, while the Swiss National Bank did the same by 0.50%.
  4. British and Canadian inflation data showed a slightly lower than expected increase in Canadian inflation, while the British data showed inflation rising by a full 0.5% more than had been expected, to a historically high rate of 10.4%. This has called into question the optimistic forecast by the UK government on inflation made during the previous week.
  5. Despite the banking crisis, rate hikes, and rising inflation data, many stock markets were able to end the week higher, notably the S&P 500 Index and the NASDAQ 100 Index. At one point, the NASDAQ was trading at a new 7-month high, suggesting that despite these problems, there seems to be a bull market in technology stocks.

There were two other significant data releases last week:

  1. US Unemployment Claims – this came in almost exactly as expected.
  2. Flash Services & Manufacturing PMI data for USA, UK, Germany, and France – in the USA, both sets of data came in better than expected. In Europe, the Services data was better than expected while the Manufacturing data was worse.

The Week Ahead: 27th March – 31st March 2023

The coming week in the markets is likely to see a considerably lower level of volatility than last week, due to a low level of key data releases scheduled. However, an intensification of the ongoing banking crisis could trigger high volatility. This week’s key data releases are, in order of importance:

  1. US Core PCE Price Index data
  2. German Preliminary CPI data
  3. Australian CPI data
  4. US Final GDP data
  5. Canadian GDP data
  6. BoE Governor Bailey testifying before UK Parliament on the collapse of Silicon Valley Bank
  7. US Consumer Confidence data
  8. US Unemployment Claims data

Technical Analysis

US Dollar Index

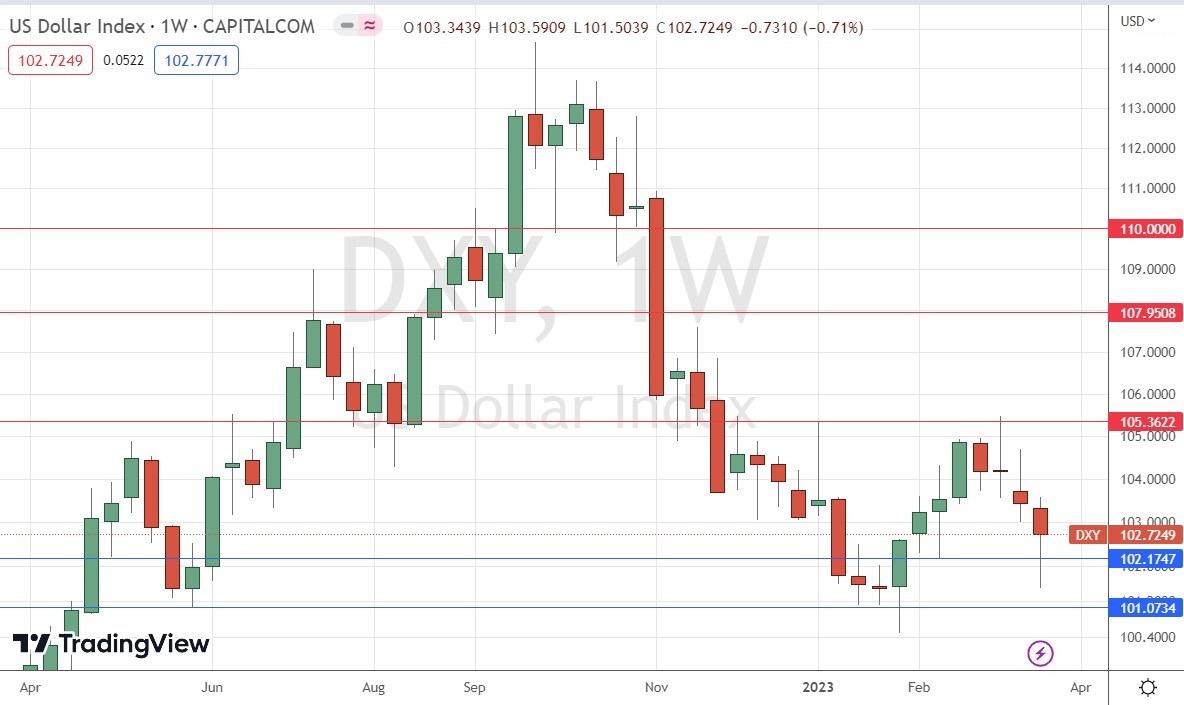
The weekly price chart below shows the U.S. Dollar Index made another successive weekly decline, continuing the rejection of the key resistance level at 105.36.

However, it is notable that the weekly candlestick has a small real body and a large lower wick, which rejected a key support level. This suggests that we may be unlikely to see another decline over the coming week, despite the long-term bearish trend in which the Dollar is trading below its levels of both 3 and 6 months ago.

The US Dollar is likely to face conflicting pressures over the coming week, due to an ongoing fear of US bank contagion. It is hard to forecast the next Dollar movement so it may be better to focus upon trading other assets over the coming week.

US Dollar Index Weekly Chart

NASDAQ 100 Index

We saw another weekly rise in the NASDAQ 100 Index over the week after a golden cross was made on the daily chart two weeks ago. At one point the Index was trading at a 7-month high, but it quickly sold off and closed the week below the key resistance level shown within the price chart below at 12820.

Stock markets continue to be shaken by the ongoing banking crisis, but we are seeing many tech shares making big rises as US inflation continues to fall, taking pressure off the Federal Reserve to continue hiking rates as the US 2-Year Treasury Yield trades well below 4%. However, this is tempered by the recent strong fall seen by the S&P 500 Index after it made a golden cross a few weeks ago, from which historically there have been no similar recoveries over the past half-century.

There is a clear resistance level shown in the price chart below at 12820. A daily close above that level will be a further bullish sign.

It seems that we have some bullish signs, but overall, we are seeing a split stock market with select tech stocks doing well while other sectors are not.
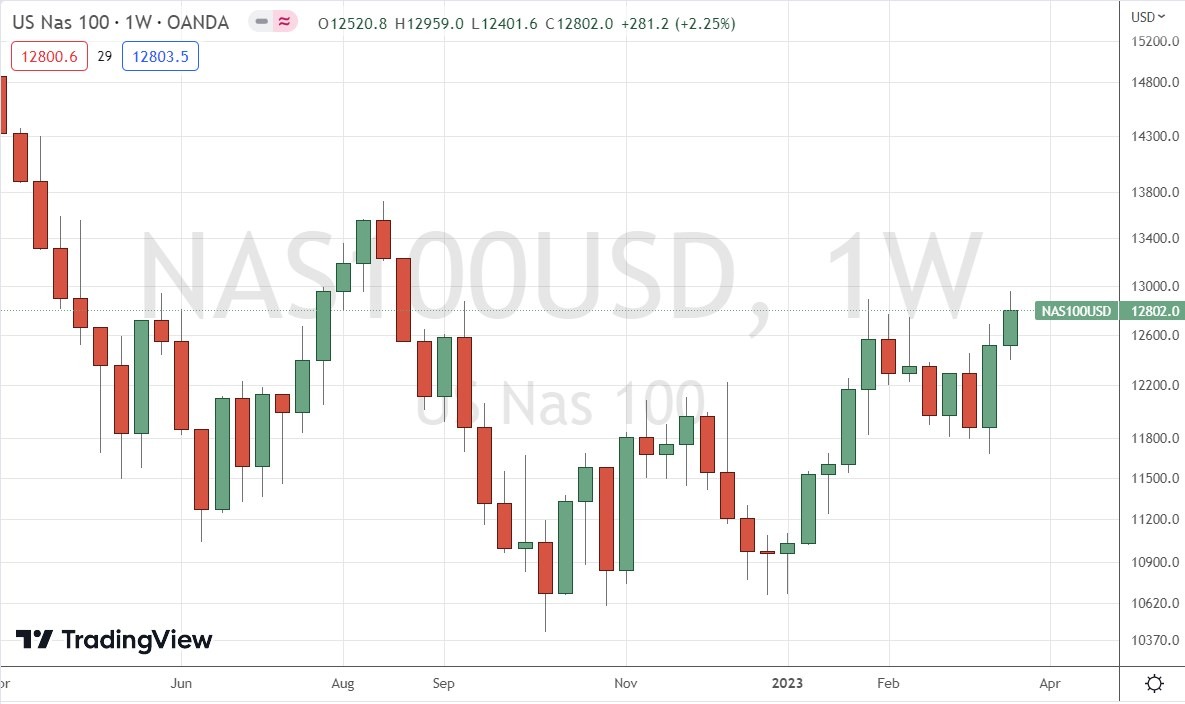
NASDAQ 100 Index Weekly Chart

Gold

Last week saw the price of Gold fall slightly, following the previous week’s unusually strong rise. This week’s candlestick could be called a near-doji, which suggests indecision. This is not surprising as the price made a new 11-month high price and has struggled to overcome the big round number at $2,000, so I would not say this is a strong sign that the price will make a large decline this week. Another bullish sign is that the recent weekly candlestick’s lower wick is considerably larger than its upper wick, suggesting there is still strong buying at the recent lows.

The price ended the week below $2000 but within sight of its all-time high price made in March 2022.

Trend and breakout traders should seriously consider buying Gold even just on these technical indications. The deeper reason why Gold is rising is probably due to the decline in the US Dollar as a safe haven due to the banking crisis, and due to the banking crisis, itself. Bitcoin also seems to be playing a similar rose to Gold now.
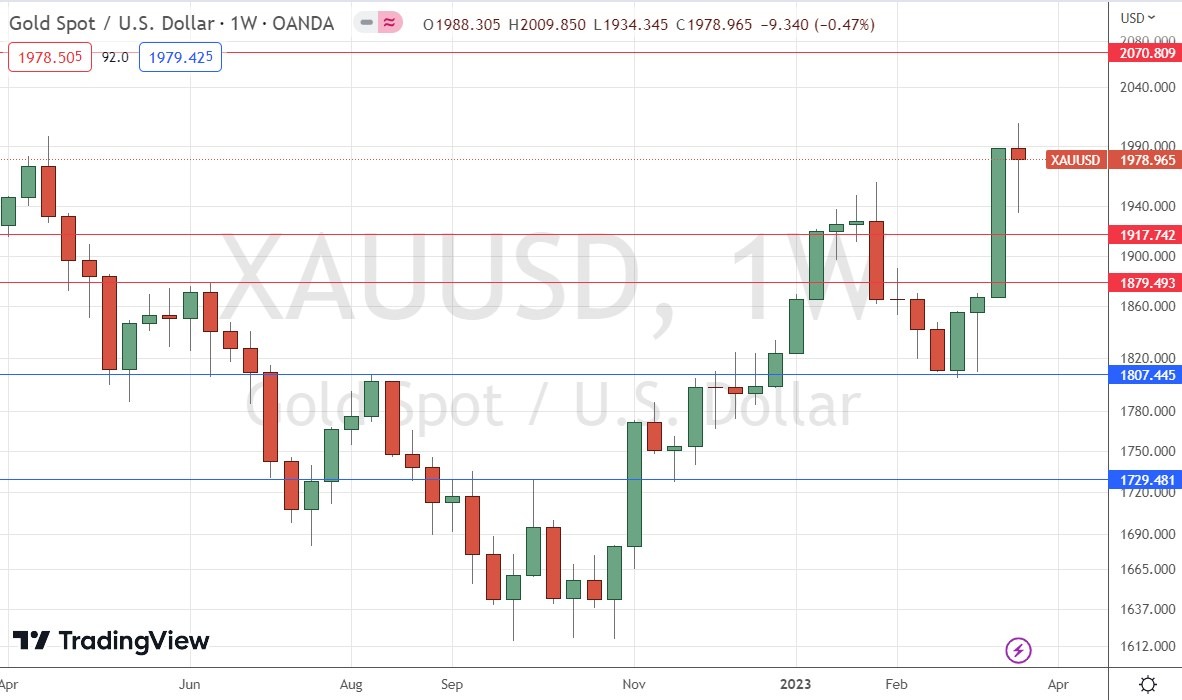
Gold Weekly Chart

Bitcoin

Last week saw the price of Bitcoin fall slightly, following its strong rise over the previous week. This week’s candlestick is a doji, which suggests indecision. This is not surprising as the price made a new 11-month high price and has struggled to overcome two key resistance levels near the big round number at $30,000, so I would not say this is a strong sign that the price will make a large decline this week.

Trend and breakout traders should seriously consider buying Bitcoin even just on these technical indications. The deeper reason why Bitcoin is rising is probably due to the decline in the US Dollar as a safe have due to the banking crisis, and due to the banking crisis, itself. Gold also seems to be playing a similar rose to Bitcoin now.

Traders should keep in mind that Bitcoin is riskier than Gold and has a poor record as a safe haven, while Gold’s record is better. Buying Gold is likely to be the better trade here.
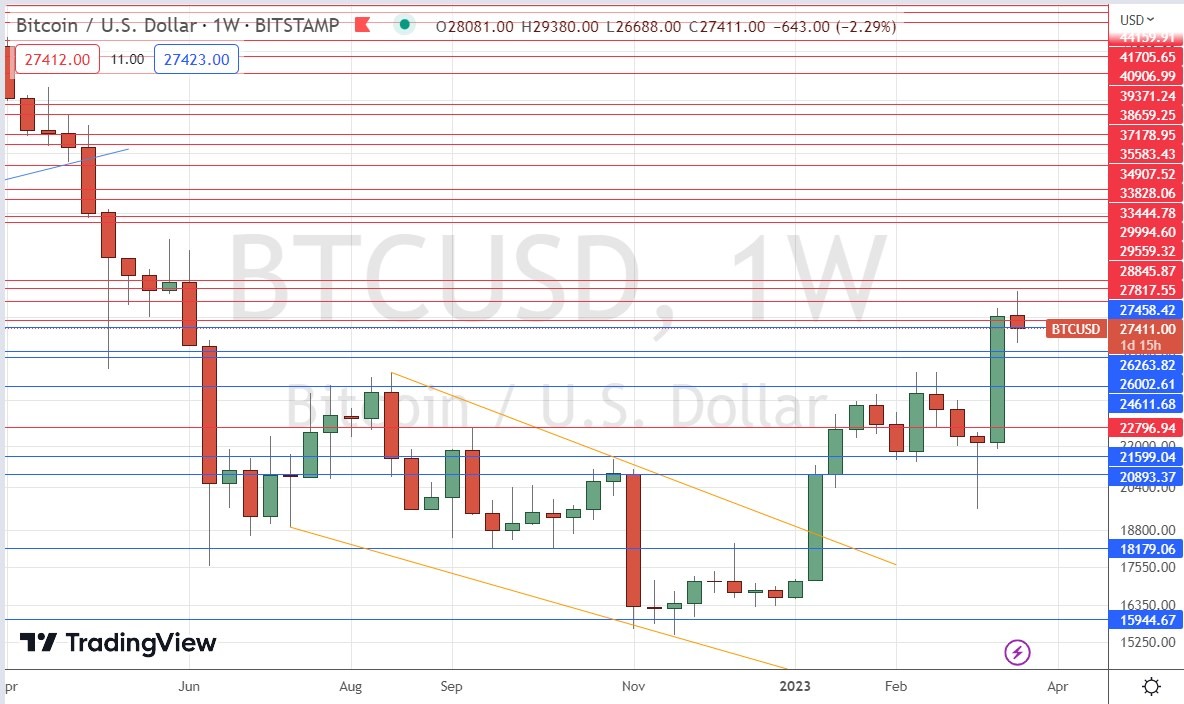
Bitcoin Weekly Chart

USD/JPY

The Japanese Yen strengthened again over the past week, for the fourth successive week. This is not due to any material change in policy by the Bank of Japan or any fundamental factor, but simply due to the Japanese Yen’s attractiveness as a safe haven currency at a time of a banking crisis in the USA.

The Yen gained by more than 0.5% against a basket of currencies, with the US Dollar one of the main losers as the Dollar is generally weak, and in a long-term downwards trend.

The price chart below shows the weekly candlestick is of only a moderate size, and looks less bearish as it has a significant lower wick which has rejected both two key support levels and the big round number confluent with them at ¥130.00.

If the perception of a banking crisis persists, we are likely to see the USD/JPY currency pair continue to decline. However, I think the odds of this being a down week are much lower than they were last week.
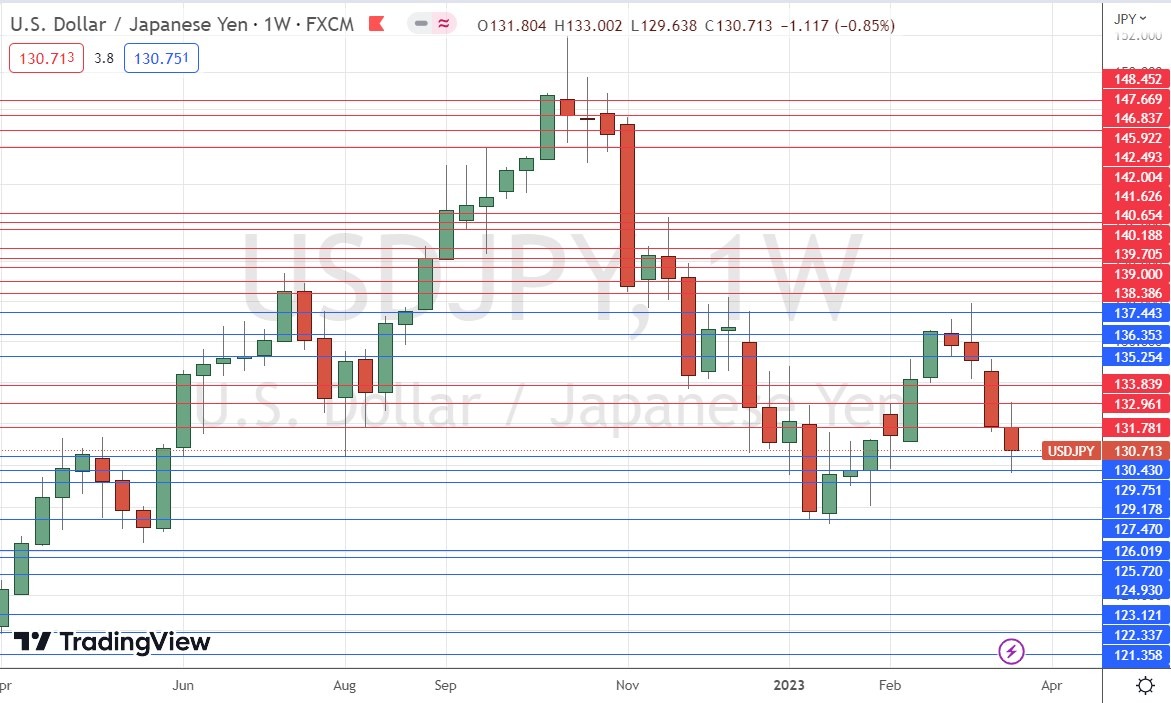
USD/JPY Weekly Chart

Bottom Line

As key markets are facing significant resistance levels against recent trends, I see the best trading opportunities this week as likely to require confirmations:

  • Long Gold against the USD following a daily close above $2,000.
  • Long Bitcoin against the USD following a daily close above $30,000.
  • Short of the USD/JPY currency pair following a daily close below ¥130.
  • Long of the NASDAQ 100 Index following a daily close above 12820,

China’s strong economic rebound in 2023 is a booster for the world: head of IMF

China’s strong economic rebound in 2023 is a booster for the world: head of IMF

China’s economy is seeing a strong rebound which “matters for the country itself and matters for the world”, said Kristalina Georgieva, managing director of International Monetary Fund (IMF) on Sunday during a panel discussion at the 2023 China Development Forum.

According to a statement that the IMF sent to the Global Times, Georgieva said that the robust rebound means China is set to account for around one third of global growth in 2023 — giving a welcome lift to the world economy.

“And beyond the direct contribution to global growth, our analysis shows that a 1 percentage point increase in GDP growth in China leads to 0.3 percentage point increase in growth in other Asian economies, on average — a welcome boost,” Georgieva said.

The IMF’s January forecast puts China’s GDP growth at 5.2 percent this year— a sizeable increase of more than 2 percentage points from 2022. Driving this growth is the anticipated rebound of private consumption as the economy has reopened and activity has normalized.

“With such a solid recovery, China can now build on positive momentum and — through comprehensive policies — stay on the growth path towards convergence with advanced economies,” Georgieva said.

Citing a Chinese saying “The whole year’s work depends on a good start in spring,” she highlighted two opportunities for the country’s policymakers.

The first opportunity is to raise productivity and rebalance the economy away from investment, and towards more consumption-driven growth that is more durable, less reliant on debt, and will also help address climate challenges. To get there, the social protection system will need to play a central role through higher health and unemployment insurance benefits to cushion households against shocks, she noted.

At the same time, market-oriented reforms to level the playing field between the private sector and state-owned enterprises, together with investments in education, would significantly lift the economy’s productive capacity.

IMF research showed that productivity enhancing reforms in China could lift real GDP by as much as 2.5 percent by 2027, and by 18 percent by 2037— growth that would be of both higher quality and more inclusive.

Green growth is another opportunity. Georgieva said the IMF welcomes China’s goal of net-zero emissions by 2060, a commitment that underlines the importance of tackling climate change for long-term development.

Policies to rebalance the economy will simultaneously help achieve China’s climate goals, as most of the country’s carbon dioxide emissions are generated from power and industrial activities — so moving to consumption-led growth will cool energy demand, she noted.

Looking forward to the world economy, “however, spring is yet to come,” Georgieva said.

The IMF expects 2023 to be another challenging year, with global growth slowing to below 3 percent as scarring from the pandemic, the Russia-Ukraine crisis, and monetary tightening weigh on economic activity.

It is also clear that risks to financial stability have increased. At a time of higher debt levels, the rapid transition from a prolonged period of low interest rates to much higher rates — necessary to fight inflation — inevitably generates stresses and vulnerabilities, as evidenced by recent developments in the Western banking sector.

“Policymakers have acted decisively in response to financial stability risks, and some advanced economies’ central banks have enhanced the provision of US dollar liquidity. These actions have eased market stress to some extent, but uncertainty is high which underscores the need for vigilance,” Georgieva said.

Georgieva highlighted China’s constructive role in addressing global challenges, including through its contributions to IMF’s Poverty Reduction and Growth Trust, its vital financing for new Resilience and Sustainability Trust, and, in helping highly-indebted countries.

In the months and years ahead, continuing to support the world’s most vulnerable countries will be vital. “We can only solve the world’s biggest challenges—and avoid the pitfalls of fragmentation — through cooperation,” she said.

GBP/USD faces further range bound near term – UOB

GBP/USD faces further range bound near term – UOB

In the opinion of Economist Lee Sue Ann and Markets Strategist Quek Ser Leang at UOB Group, GBP/USD should keep the side-line theme well in place for the time being.

Key Quotes

24-hour view: “Our view for GBP to trade in a range last Friday was incorrect as it dropped sharply to 1.2192 before rebounding. The rebound in oversold conditions suggest GBP is unlikely to weaken much further. Today, GBP is more likely to trade sideways, expected to be 1.2200 and 1.2300.”

Next 1-3 weeks: “We have expected GBP to advance since the start of last week. In our most recent update from last Friday (24 Mar, spot at 1.2275), we stated that ‘While GBP strength is still intact, short-term upward momentum is beginning to wane, and this combined with overbought conditions suggests 1.2400 may be out of reach this time around’. In London trade, GBP dropped sharply to a low of 1.2192. While our ‘strong support’ level at 1.2190 is not breached, upward momentum has more or less fizzled out. In other words, the week-long GBP strength has ended. The current movement is likely part of a consolidation phase. From here, GBP could trade within a range of 1.2140/1.2340.”

EUR/USD holds steady above 1.0750 ahead of German IFO

EUR/USD holds steady above 1.0750 ahead of German IFO

EUR/USD is consoldiating above 1.0750 in early Europe. The pair has turned sideways following the footprints of the subdued US Dollar Index, despite the looming global banking concerns and upbeat US PMI data. The immediate focus is now on Germany’s IFO survey

EUR/USD broke below the ascending regression channel and the Relative Strength Index (RSI) indicator on the four-hour chart declined slightly below 60 after having stayed in overbought territory early Thursday, suggesting that buyers have moved to the sidelines.

On the downside, 1.0820 (Fibonacci 23.6% retracement of the latest uptrend, 20-period Simple Moving Average (SMA)) aligns as immediate support. In case the pair falls below that level and starts using it as resistance, the downward correction could extend toward 1.0760 (Fibonacci 38.2% retracement) and 1.0720 (50-period SMA).

First resistance is located at 1.0850 (static level) ahead 1.0900 (psychological level, static level) and 1.0930 (multi-week high set on Thursday).

EUR/USD has reversed its direction and declined below 1.0850 after having reached its highest level since early February at 1.0930 on Thursday. The pair’s near-term technical outlook points to a loss of bullish momentum ahead.

The broad-based selling pressure surrounding the US Dollar in the first half of the day on Thursday fueled EUR/USD’s rally. During the American trading hours, however, the pair lost its traction as Wall Street’s main indexes retreated from session highs, helping the USD limit its losses.

Early Friday, US stock index futures trade virtually unchanged on the day, pointing to a neutral risk mood.

Meanwhile, European Central Bank (ECB) policymaker Klaas Knot said on Thursday that he was expecting one more rate hike in May. “Inflation risks are clearly tilted to upside; second round wage effects are increasingly visible,” Knot added. As the divergence between the Federal Reserve’s and the ECB’s outlook become more apparent, EUR/USD’s downside is likely to remain as technical corrections, at least in the near term.

S&P Global will release the preliminary March PMI surveys for Germany, the Eurozone and the US. Composite PMIs for all three are expected to stay in expansion territory slightly above 50.

Market participants are likely to pay close attention to comments on wage inflation, especially in the service sector. In case the data for Germany and the Eurozone confirm Knot’s comments on wage developments, the Euro could stay resilient against its rivals.

On the other hand, the USD is likely to gather strength ahead of the weekend if PMI surveys point out to an acceleration in salary increases in the private sector. Nevertheless, the market positioning regarding the next Fed policy action is unlikely to be impacted in a significant way, suggesting that the reaction should remain short lived. As of writing, the CME Group FedWatch Tool’s probability for one more 25 bps Fed rate hike in May stands at 33.5%.

Euro Technical Outlook – Trends and Ranges Intact for Now. Where to for EUR/USD?

Euro Technical Outlook – Trends and Ranges Intact for Now. Where to for EUR/USD?

EUR/USD TECHNICAL ANALYSIS

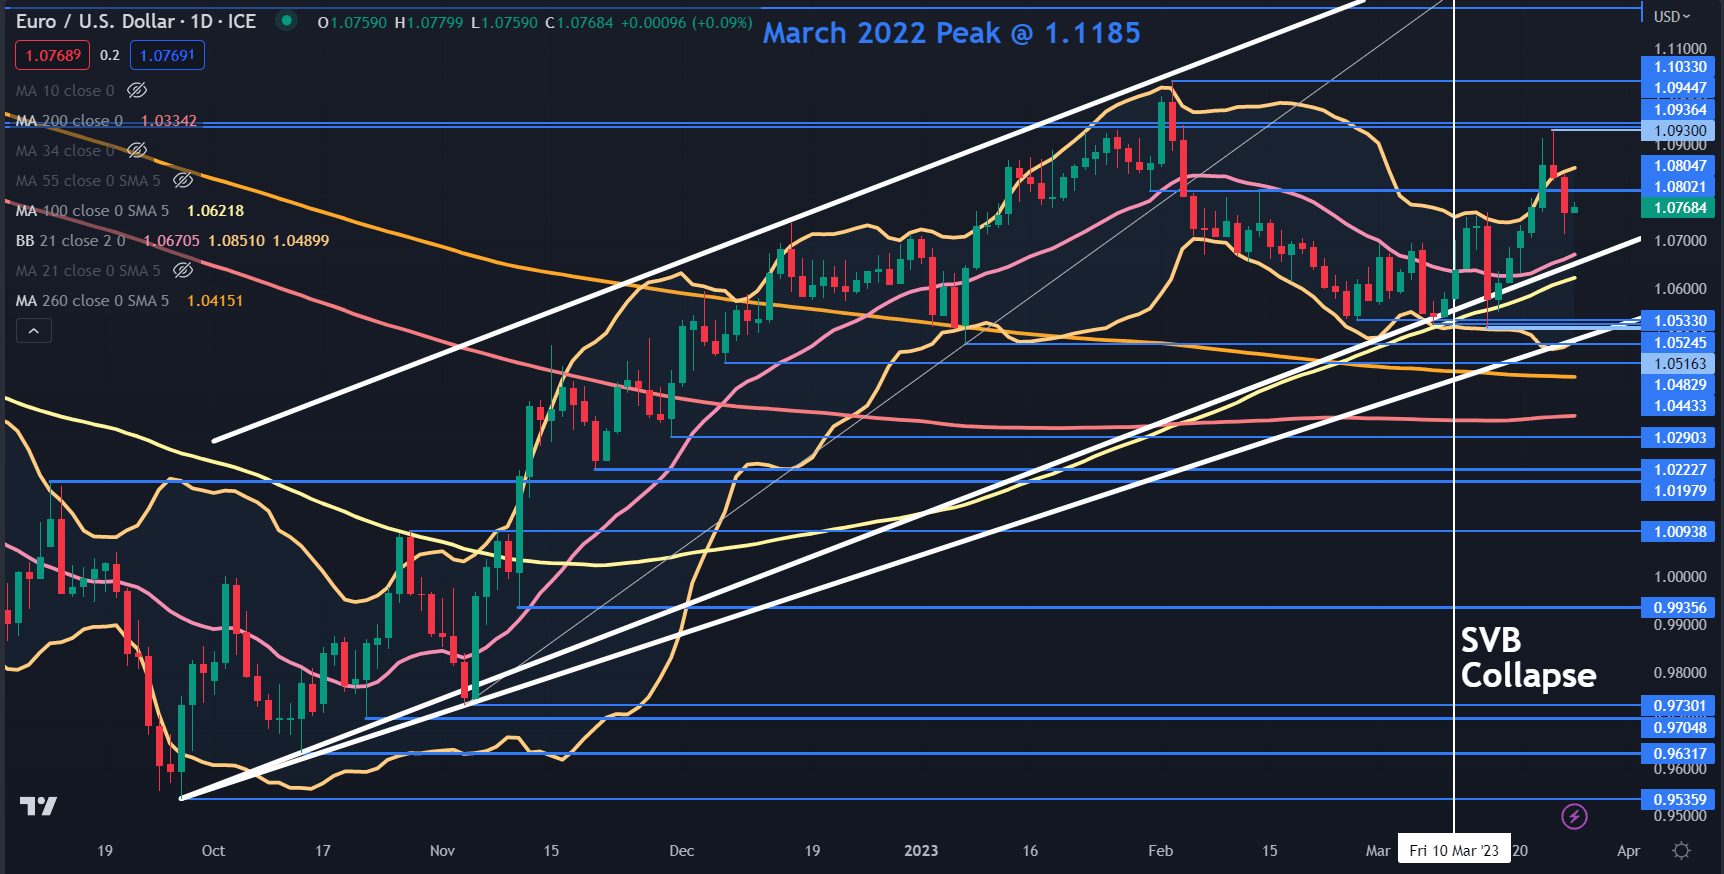
EUR/USD remains in an ascending trend channel after challenging the lower bound earlier this month ahead of the collapse of SVB Financial. An event that sent markets into a tailspin.

It tried to have another look lower post-collapse, but the 100-day simple moving average (SMA) appears to have lent some support just below that ascending trendline. These two lines may continue to provide support, currently in the 1.0620 – 1.0640 vicinity.

Below there, is another ascending trendline which is in amongst a series of recent lows and might provide a support zone in the 1.0515 -1.0535 area.

As the US Dollar came under pressure last week, EUR/USD scampered to a high of 1.0930, which was just below two breakpoints at 1.0936 and 1.0945. These levels could offer resistance ahead of the 12-month peak at 1.1033.

The recent rally broke above the upper band of the 21-day SMA-based Bollinger Band. On Friday, it closed back inside the band and that might signal a pause in the bullish run or a potential reversal.

At the least, the widening of the bands themselves could be suggestive of increasing volatility.

image1.png

EUR/CHF TECHNICAL ANALYSIS

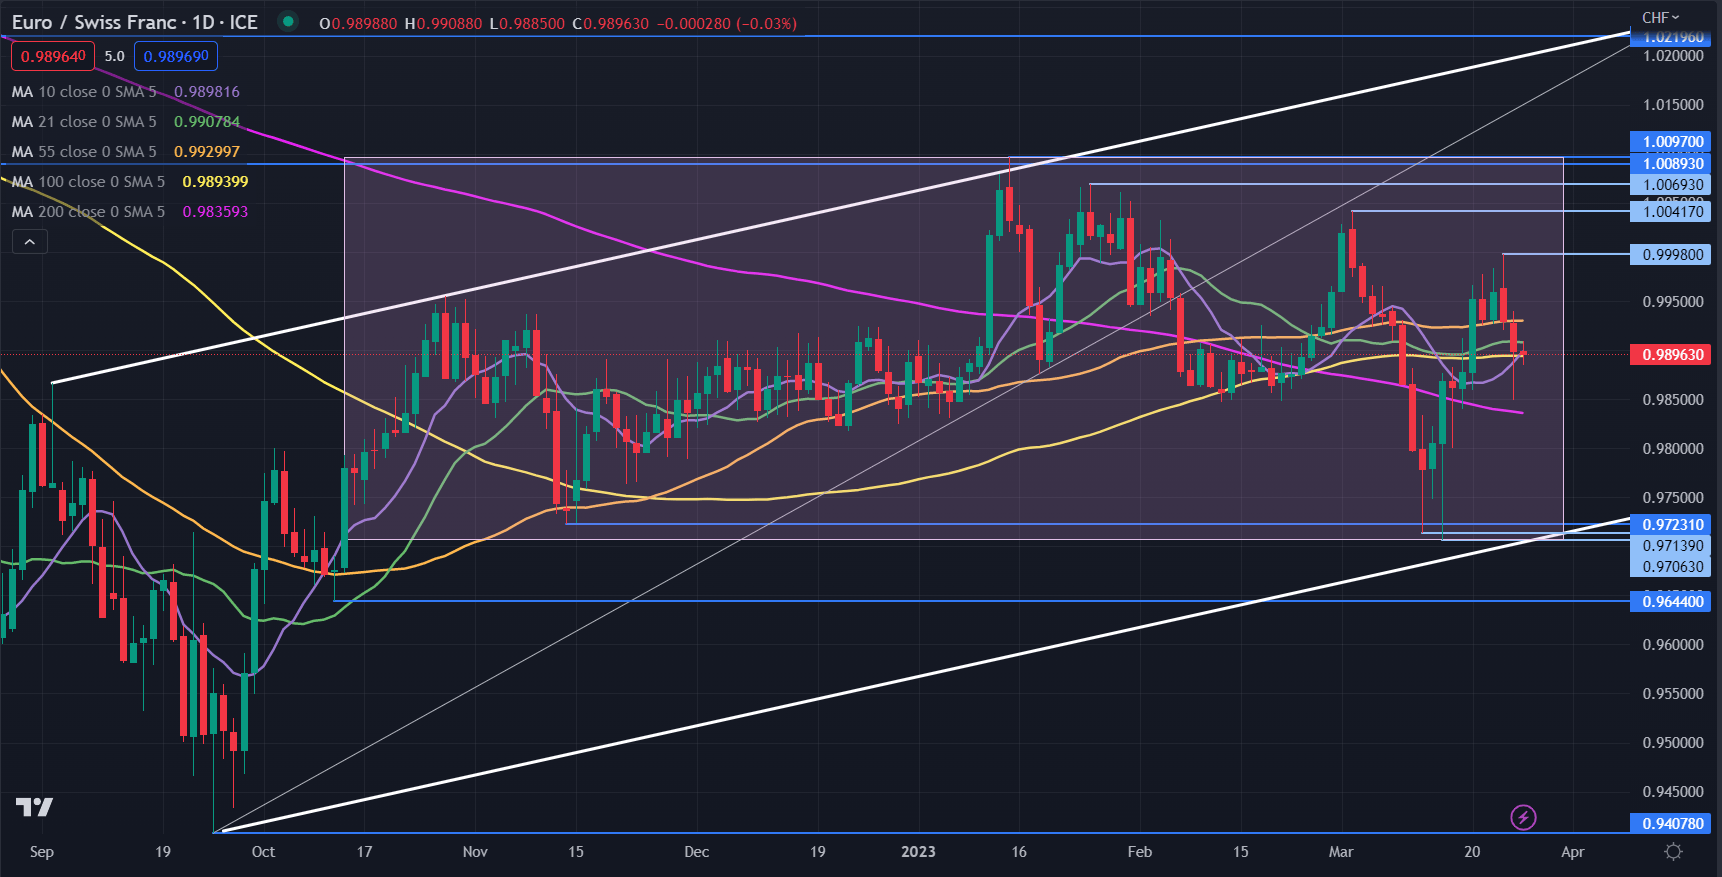
EUR/CHF has been caught within a 0.9700 – 1.0100 range for five months. In this time it has narrowly broke above resistance and below support levels.

These false breaks may confirm the challenging range trading environment seen across several asset classes.

Further evidence of the range trading environment shows that 10-, 21-, 55-, 100- and 200-day SMAs are all within 0.9835 and 0.9930 with the price hovering near the middle of this range.

The bigger picture reveals that the price remains in an ascending trend channel. The lower band of this channel currently coincides with the previous lows in the 0.9706 – 0.9723 area and may provide support.

On the topside, the prior peaks of 0.9998, 1.0042, 1.0069 and 1.0097 might offer resistance. The latter is just above potential breakpoint resistance at 1.0089.

image2.png


Japanese Yen Price Action Setup: USD/JPY, AUD/JPY, EUR/JPY

Japanese Yen Price Action Setup: USD/JPY, AUD/JPY, EUR/JPY

The Japanese yen looks set to retest its January high against the US dollar amid worries regarding the stability of the European financial sector and hopes that the US Fed is closer to a peak in rates.

Markets are pricing in around an 80% chance that US rates have already peaked, while the first Fed rate cut is priced in for July after the central bank on Wednesday shifted to a more cautious stance on rates to account for the stress in the banking sector. Minneapolis Fed President Neel Kashkari said on Sunday that authorities are monitoring “very, very closely” to see if the banking sector stress turns into a broader credit crunch, pushing the economy into recession.

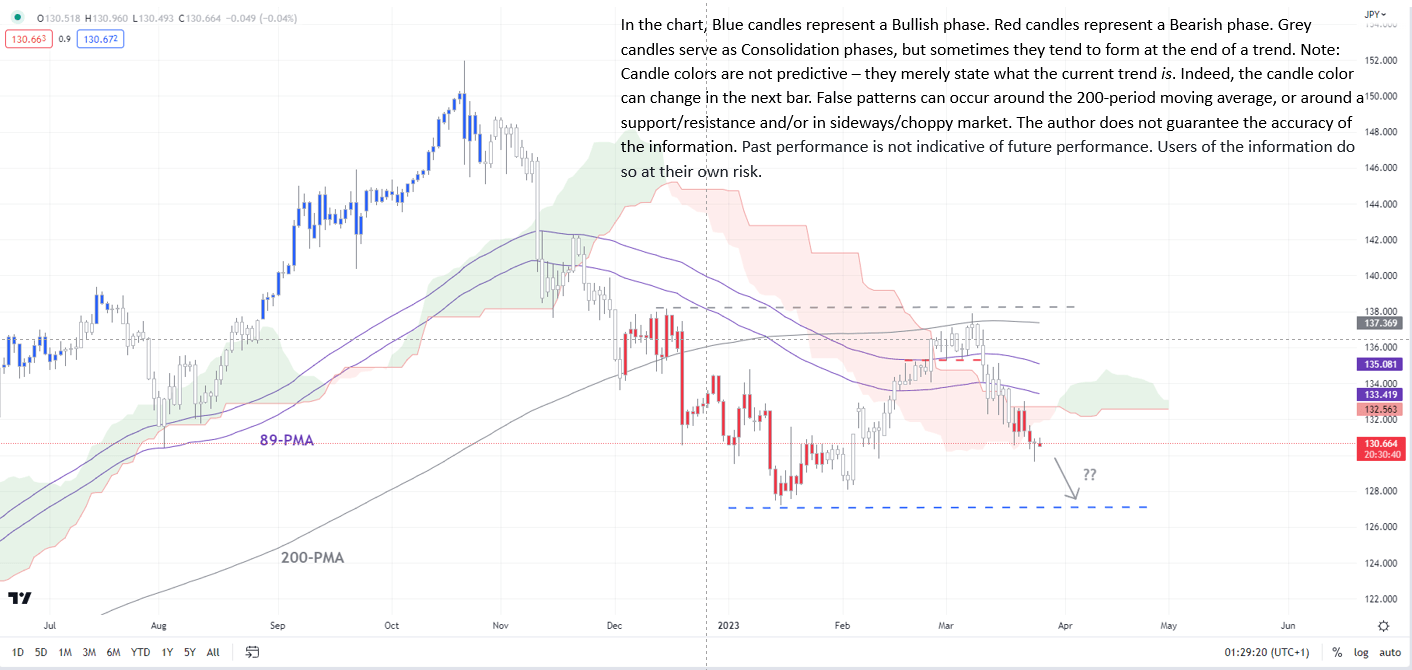
USD/JPY Daily Chart

image1.png

USD/JPY – Weak bias

On technical charts, USD/JPY appears to be drifting lower toward the January low of 127.20. This follows a retreat from a tough barrier around 137.00-138.20, including the 200-day moving average and the December high of 138.20 – a possibility highlighted in the recent updates. See “Japanese Yen Forecast: SVB Fallout Uncertainty to Weigh on USD/JPY”, published March 12, and “Japanese Yen Forecast: High Bar for USD/JPY to Crack Resistance”, published February 26.

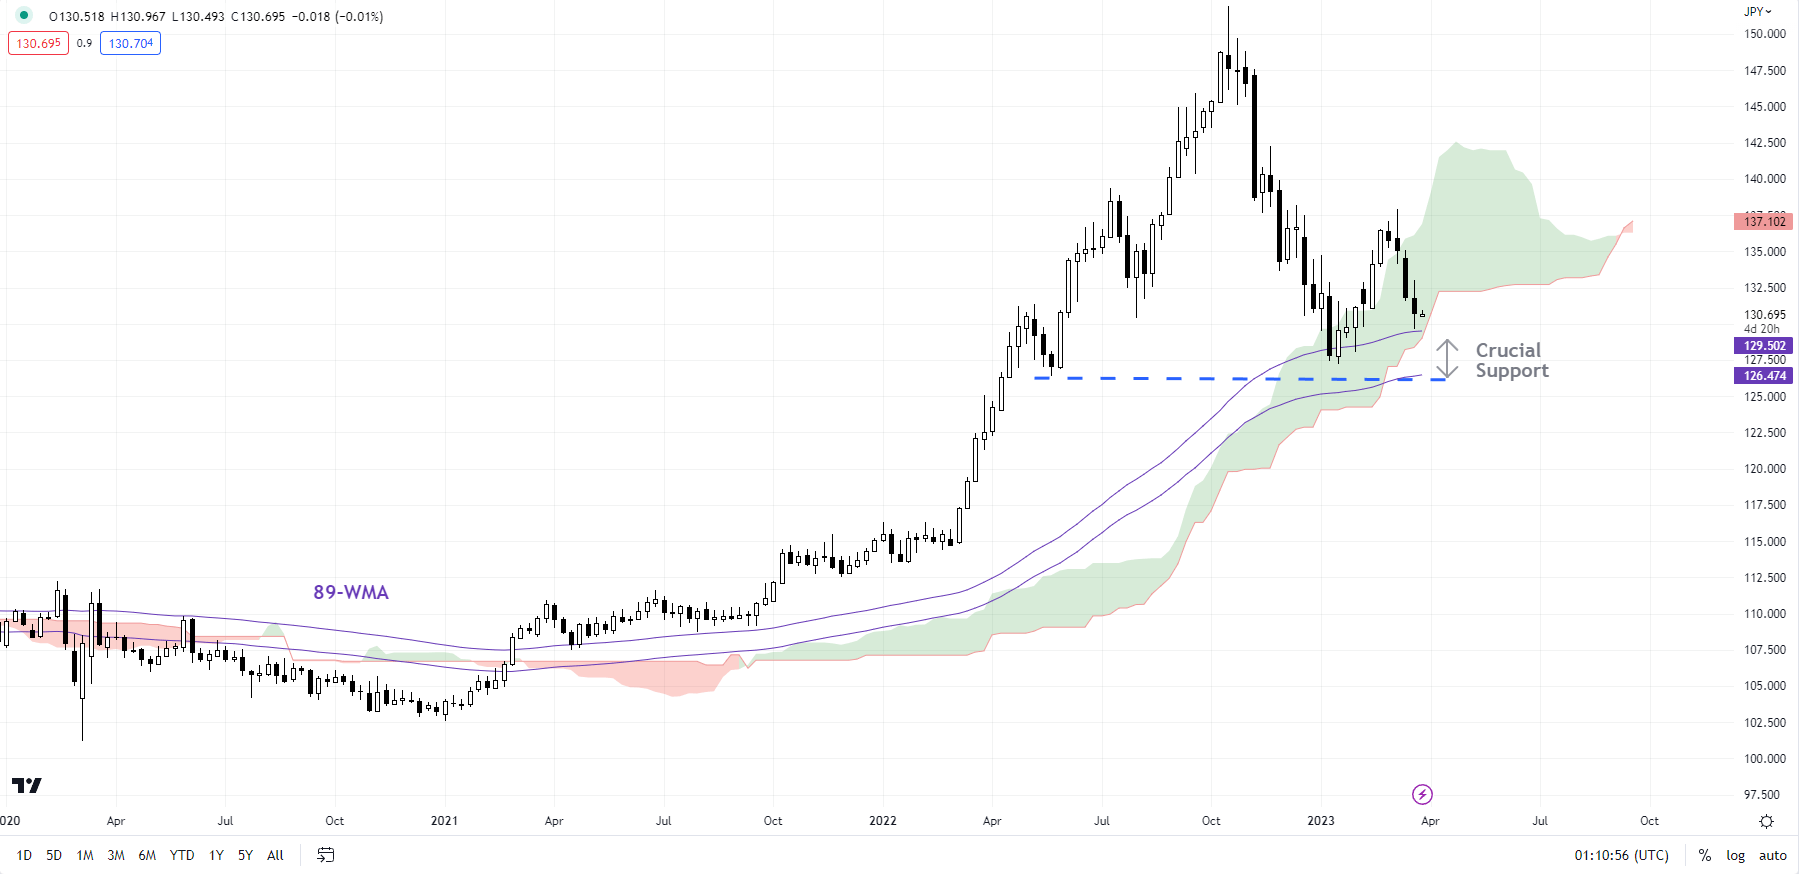
USD/JPY Weekly Chart

image2.png

The January low of 127.20 coincides with the lower edge of the Ichimoku cloud on the weekly charts and the May 2022 low of 126.35. A break below is by no means imminent, but any such break could pose a risk to the two-year-long USD/JPY uptrend.

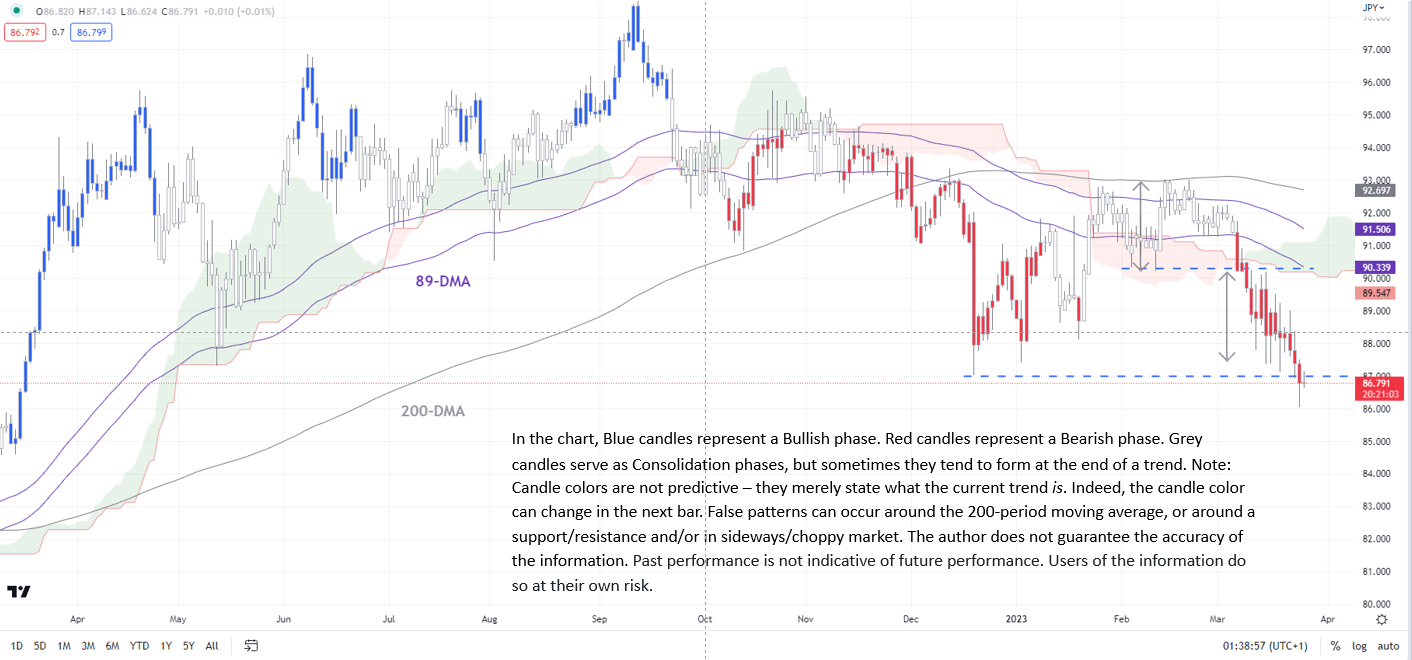
AUD/JPY Daily Chart

image3.png

AUD/JPY – Attempting to break below key support

AUD/JPY is threatening to break below the vital cushion on a horizontal trendline from May 2022 (at about 87.40). Such a break could pave the way toward the 200-week moving average (now at 81.60). The break earlier this month below the February low of 90.20 triggered a minor double-top pattern (the January and February highs) with a price objective of around 87.50, near the December low of 87.00. See “Japanese Yen Price Setup Ahead of BOJ: USD/JPY, EUR/JPY, AUD/JPY”, published March 9.

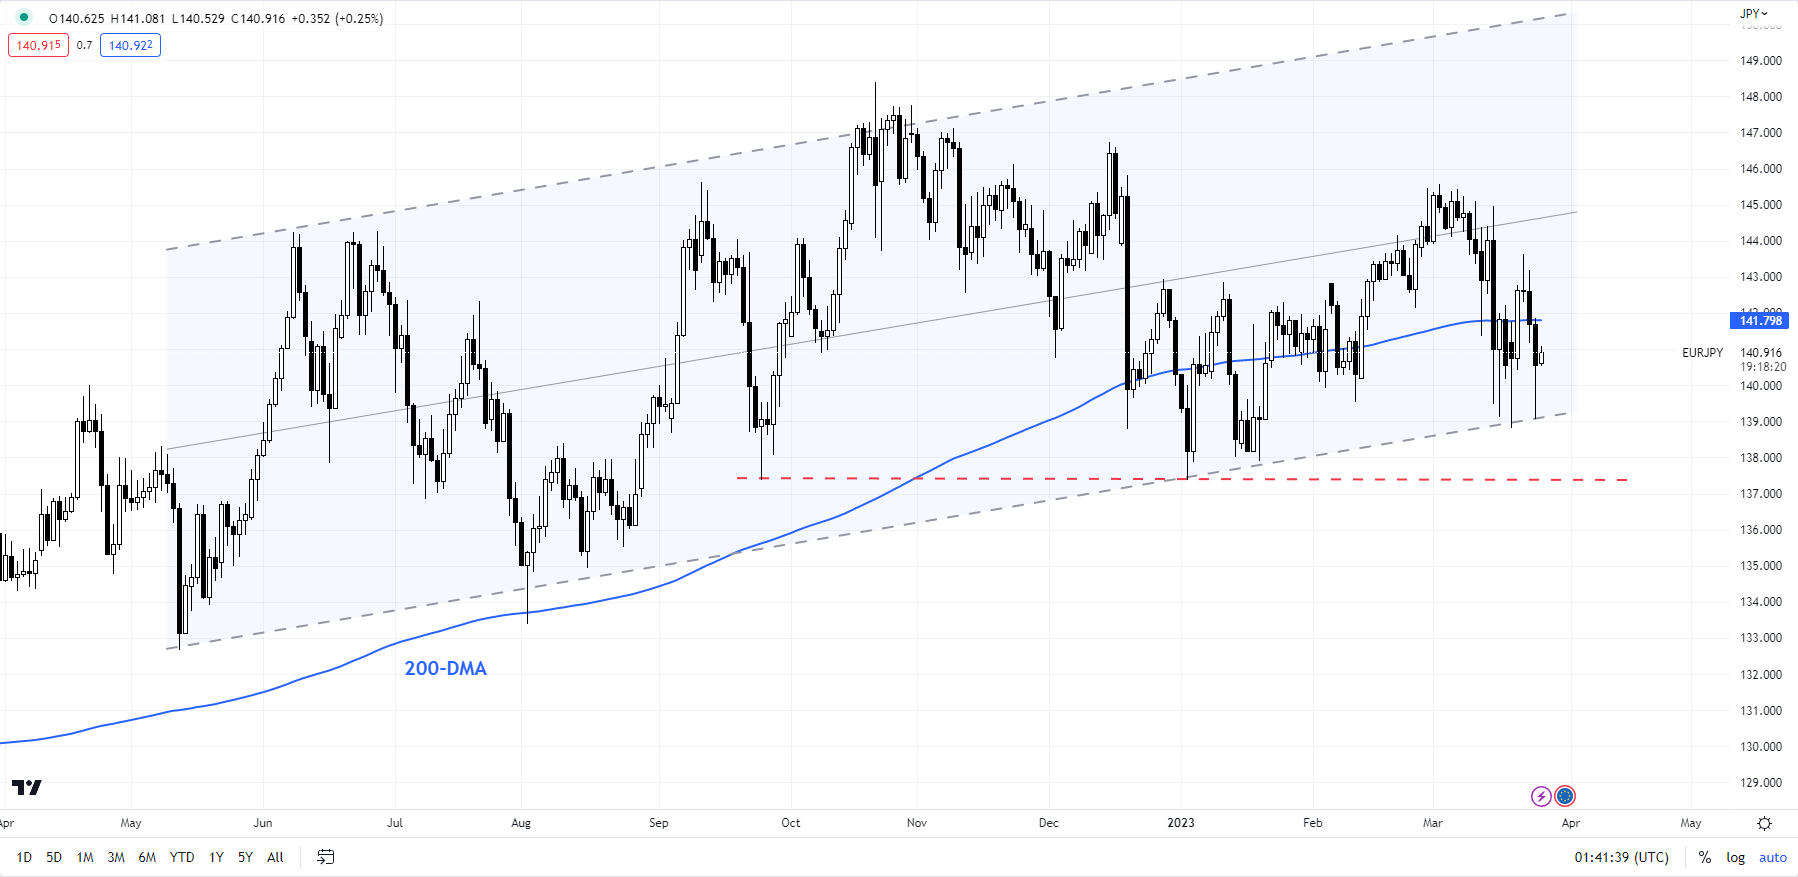
EUR/JPY Daily Chart

image4.png


US Dollar Slides as Banking Woes Continue and Treasury Yield Sink. Where to for USD?

US Dollar Slides as Banking Woes Continue and Treasury Yield Sink. Where to for USD?

The US Dollar softened again today after a selloff to end last week with the uncertainty surrounding the banking sector continuing to be assessed by markets.

It is being reported that First Citizen Bank closed a deal to acquire SVB Financial.

The announcement on the Federal Deposit Insurance Corporation (FDIC) website says, “The 17 former branches of Silicon Valley Bridge Bank, National Association, will open as First–Citizens Bank & Trust Company on Monday, March 27, 2023.”

The news may help to alleviate some worries, but the market will be eyeing Deutsche Bank’s share price today after taking a hammering on Friday on concerns that they too could be vulnerable to tightening financial conditions.

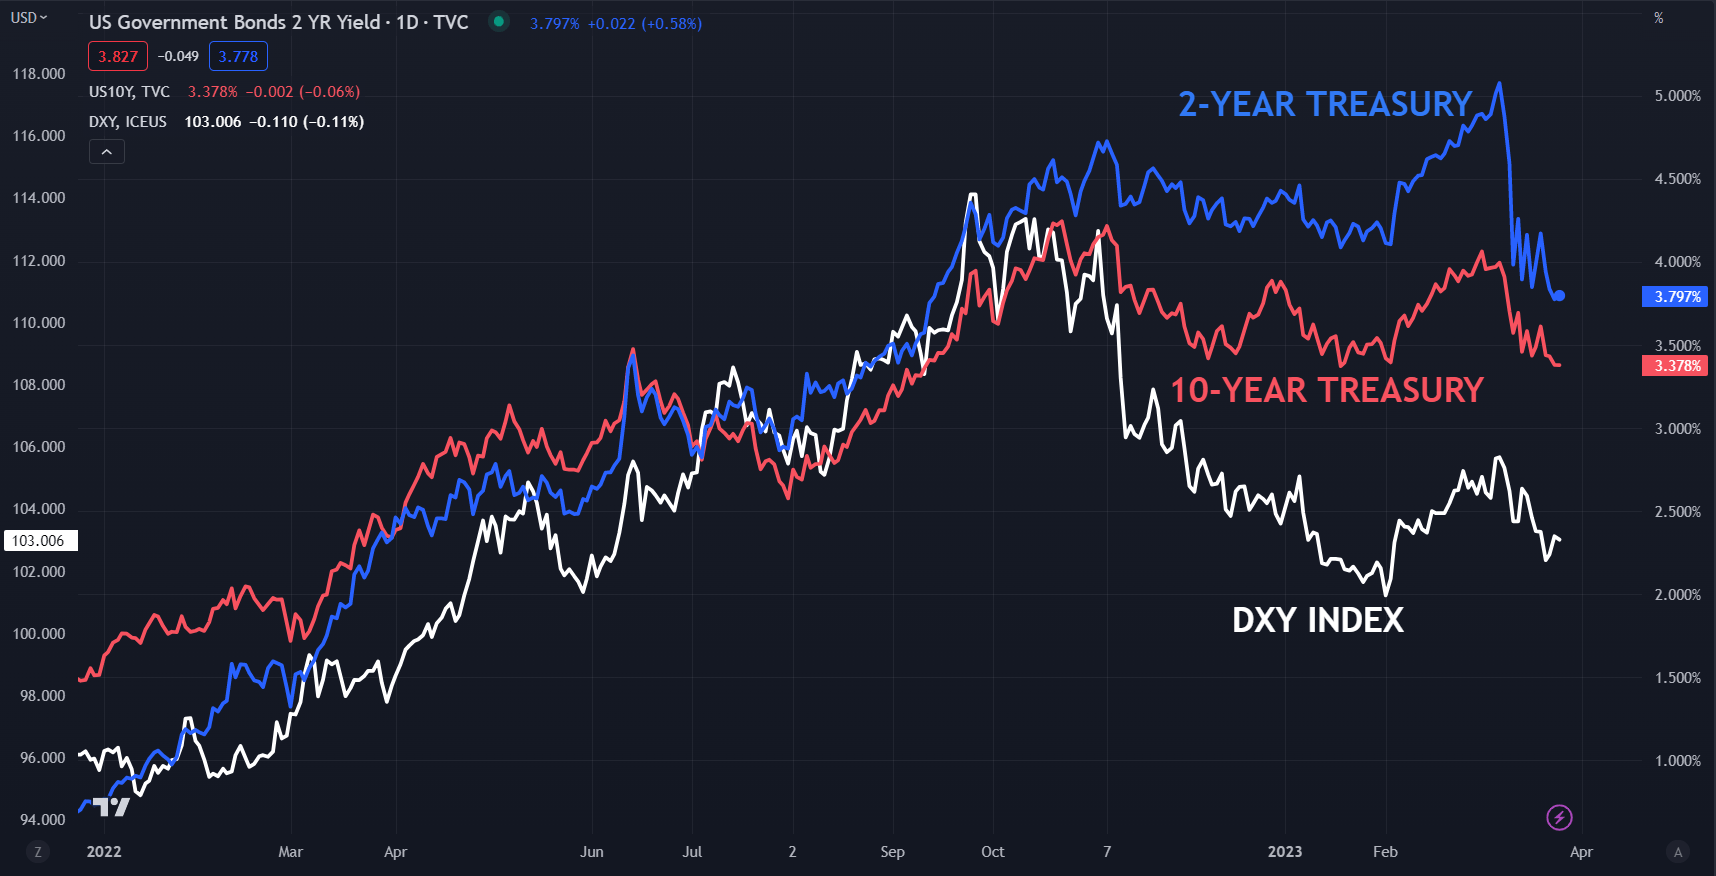
Treasury yields are little moved across most of the curve after a push lower on Friday. The benchmark 2-year note is trading near 3.80%, having yielded close to 5.10% a few weeks ago. It’s worth keeping in mind that it was under 2.40% at this time last year.

The 1-year bond managed to add some basis points today as markets vacillate about the trajectory of the Fed’s rate path.

The overall slide lower in Treasury yields appears to have undermined the DXY (USD) index.

DXY (USD) INDEX AGAINST 2- AND 10-YEAR TREASURY YIELDS

image1.png

Over the weekend, Minneapolis Fed President Neel Kashkari said that a credit crunch might slow the economy and it is something that the Fed is watching closely.

After a whippy couple of weeks, crude oil has had a quiet start on Monday with the WTI futures contract a touch above US$ 69 bbl while the Brent contract is near US$ 75 bbl at the time of going to print.

Spot gold had an early look below USD 1,970 an ounce but moved back above there. The Aussie Dollar has been the best-performing major currency going into the European session.

Hong Kong’s Hang Seng Index (HSI) is a notable underperformer of APAC equity indices with earnings and the overall weakness in the housing sector weighing it down. Futures are pointing to a good to start the European and North American equity sessions.

The highlight of today’s economic calendar will be Germany’s IFO numbers. Later this week will see a slew of European CPI figures while the US will get GDP, Core PCE and jobs data.

DXY (USD) INDEX TECHNICAL ANALYSIS

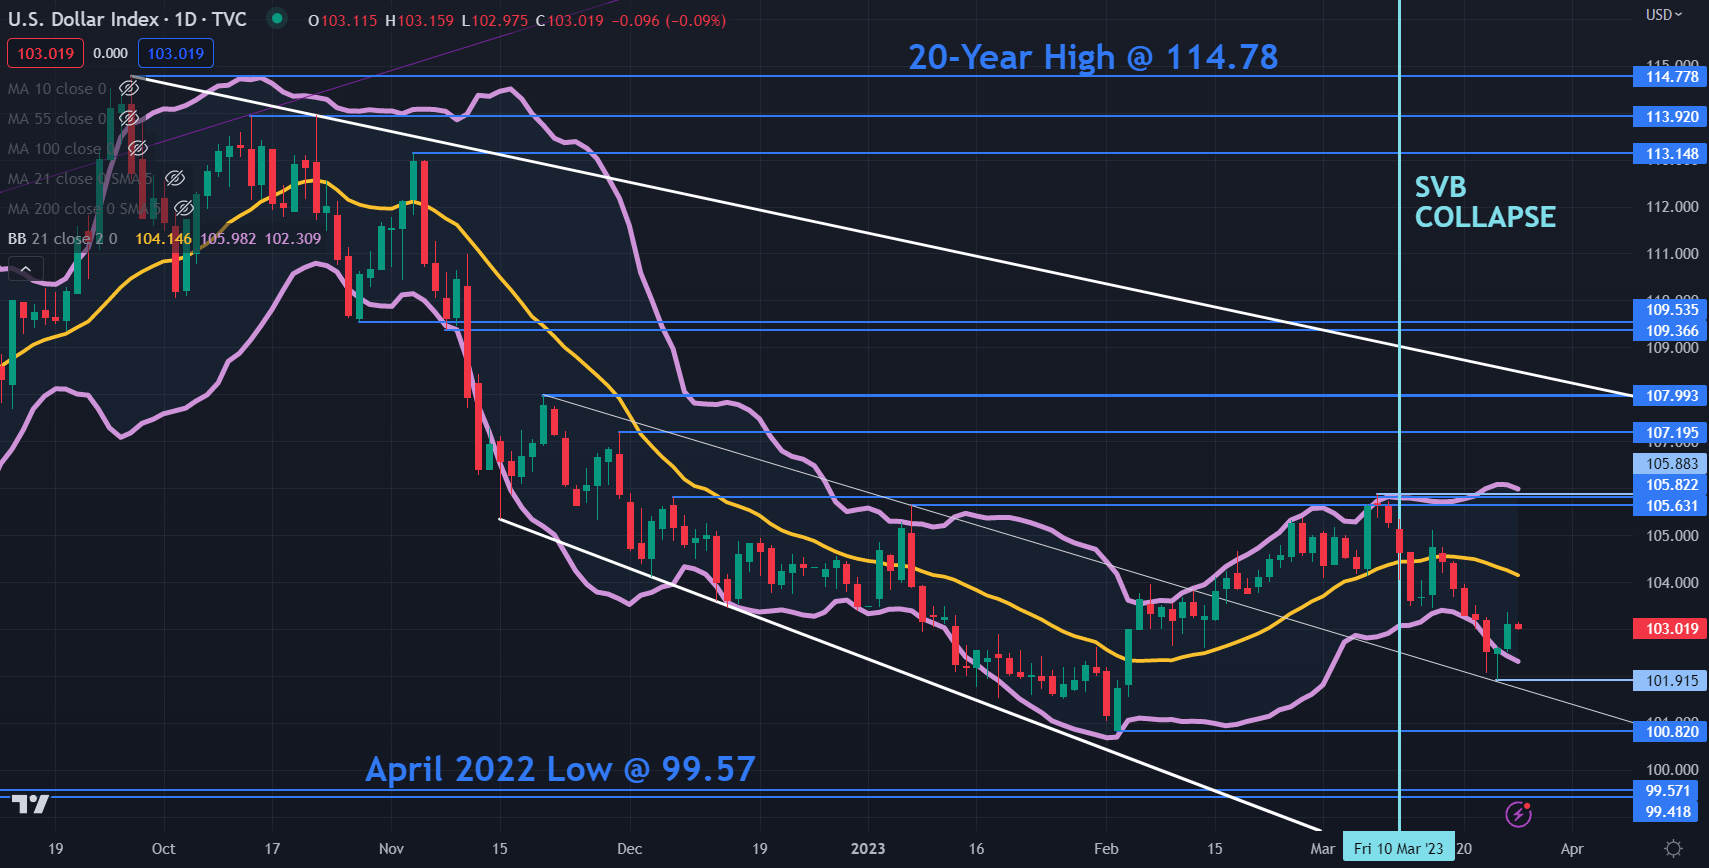
The DXY index remains in a broad long-term descending trend channel.

The recent sell-off broke below the lower band of the 21-day simple moving average (SMA) based Bollinger Band. Toward the end of last week, it closed back inside the band and that price action might signal a pause in the bearish run or a potential reversal.

Support might be at the recent lows of 101.93, 100.82, 99.57 and 99.42.

On the topside, the triple tops seen in the 105.63 – 105.88 area may provide a resistance zone. The previous peaks 107.70 and 1.08.00 could offer resistance ahead of the breakpoints at 109.37 and 109.54.

image2.png