Bitcoin Weekly Forecast: Should you trust this BTC sell signal or wait for $34,000?

Bitcoin Weekly Forecast: Should you trust this BTC sell signal or wait for $34,000?

Bitcoin price shows a clear picture of its rally after it breached a long-term bullish pattern in mid-January. As the rally takes a breather, sell signs have started to emerge, which is putting investors in a confused state.

Bitcoin price envisions its last leg of the rally

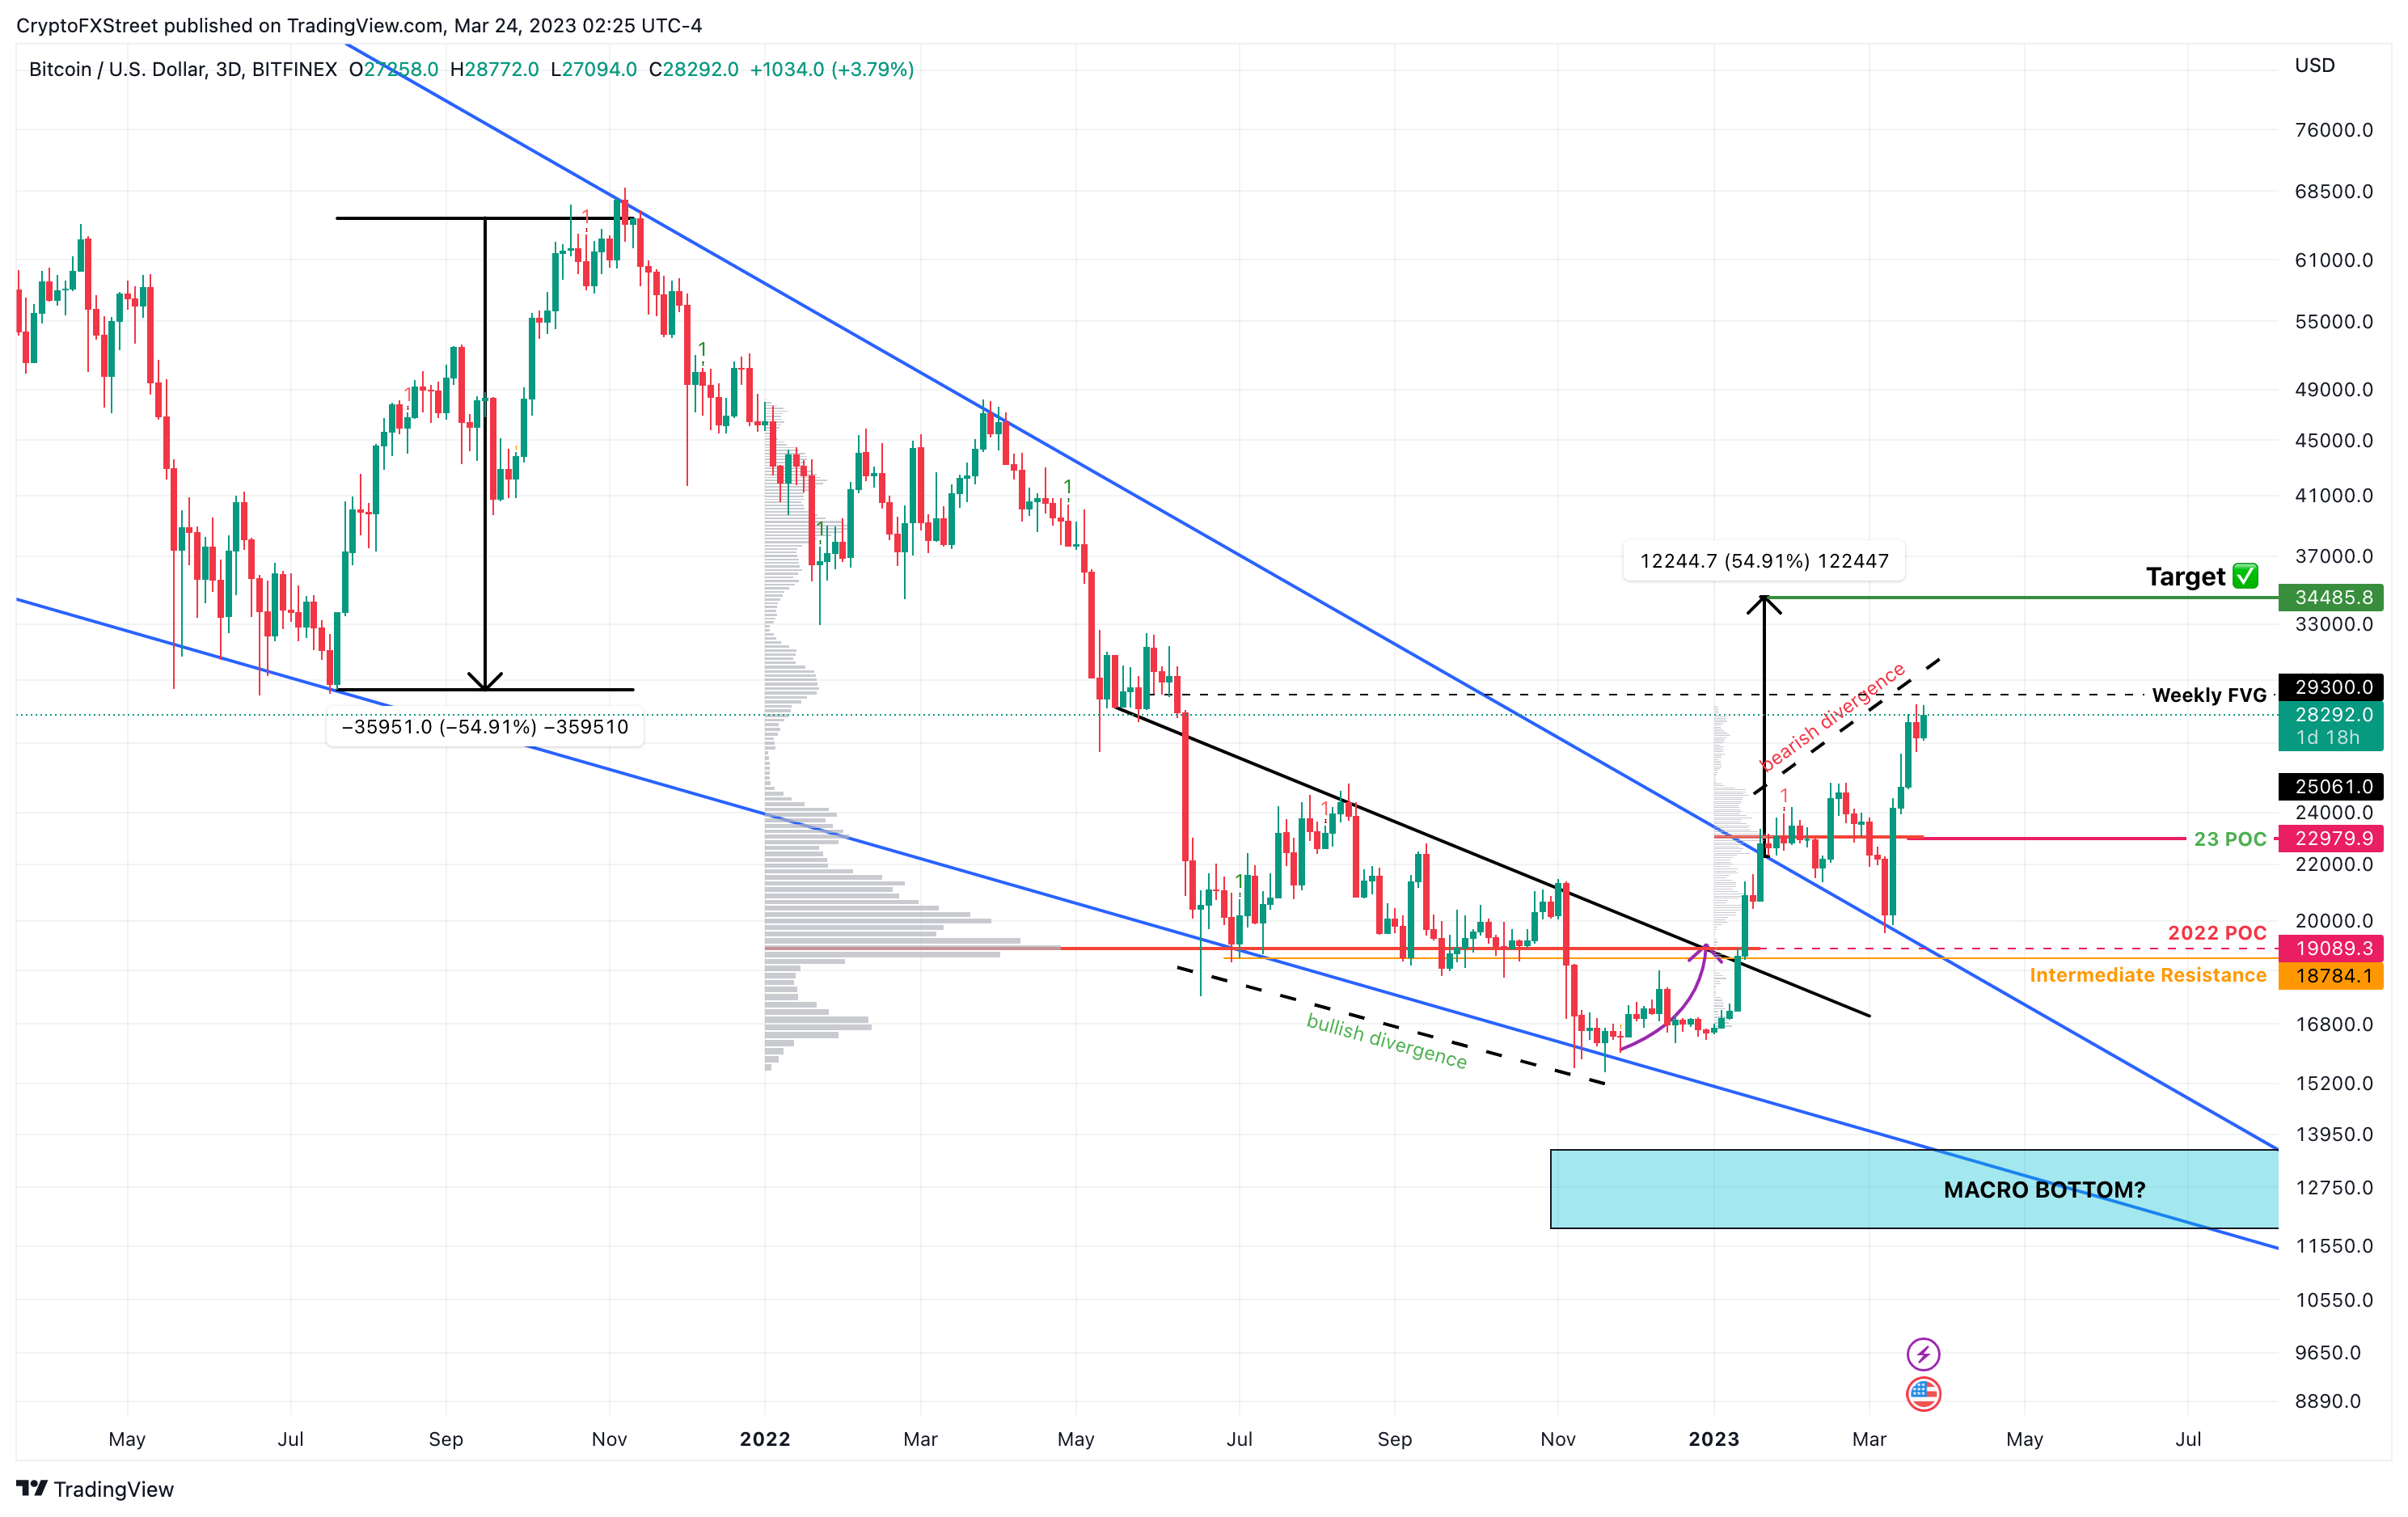
Bitcoin price action set up three distinctive swing lows and two swing highs as it dropped 77% between November 2021 and November 2022 from an all-time high at $69,000. These swing points, when connected using trend lines, reveal a falling wedge pattern.

So far, the pioneer crypto has rallied 26% from its breakout point at roughly $22,600. Bitcoin price has roughly 15% more to rally to meet the falling wedge’s theoretical target of $34,485. This target is obtained by measuring the distance between the first swing high and the swing low to the breakout point.

As Bitcoin price pauses its ascent, the Relative Strength Index (RSI) reveals a bearish divergence. This sell signal is obtained when the momentum indicator notes a steady decline while the underlying asset rises. The non-conformity that develops often results in a small pullback or a deep correction, depending on the market conditions.

Looking at the Awesome Oscillator, another momentum indicator, we cannot notice a bearish divergence, which reduces the overall confidence of a pullback, if any. If the macro outlook continues to worsen, causing widespread panic, then investors could pull out of BTC, triggering a sharp correction that will be in line with the bearish divergence’s sell signal. However, this outlook seems unlikely, considering the recent breakdown of the correlation of Bitcoin price with the US Dollar.

If any pullback does occur, the $24,000 to $25,000 range is a good place to accumulate BTC. This move will allow buyers to extend the rally by 36% and easily tag the final target of $34,485.

BTC/USDT 3-day chart

BTC/USDT 3-day chart

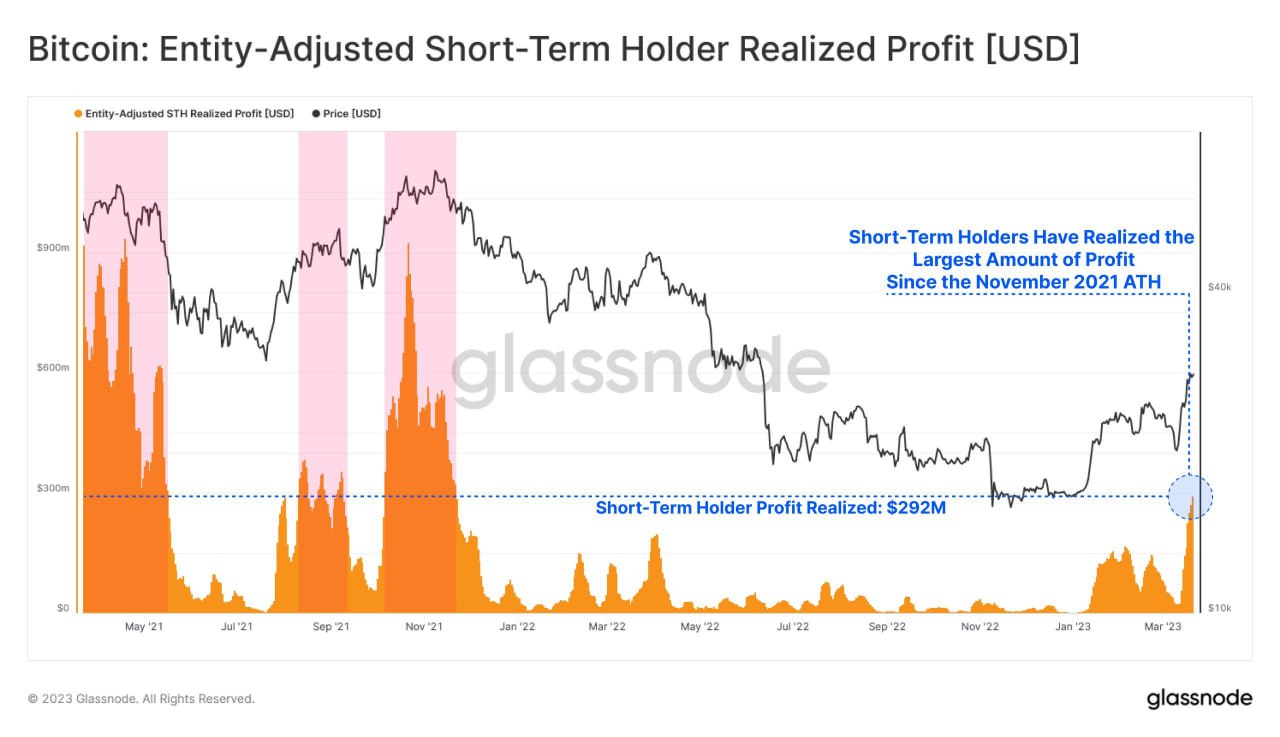
While the outlook for Bitcoin price is bullish, investors need to pay attention to the on-chain aspects of this rally. The short-term holder cohort has realized $292 million in profits; a level last seen in November 2021, just before BTC began its bear market.

Entity-adjusted short-term holder realized profit

Entity-adjusted short-term holder realized profit

Additionally, the 365-day Market Value to Realized Value (MVRV) for Bitcoin price has flipped above the zero line and currently hovers around 24.76%, a level that was last seen in November 2021. This index reveals that these investors could offload their holdings and trigger a sell-off that fits the pullback perspective noted above.

BTC 365-day MVRV

BTC 365-day MVRV

On the other hand, if the sell-off continues without a stop due to macroeconomic reasons, investors need to watchout for the $19,600 support level, a breakdown of this structure creating a lower low would invalidate the bullish thesis.

Such a development could see Bitcoin price slide down to the $18,784 barrier and, in a dire case, crash 28% and retest the macro bottom range, extending from $11,898 to $13,575.

Share: Share on Twitter Share on Facebook Copy to clipboard Cryptos feed
EU stands ready to respond with further sanctions on Russia

EU stands ready to respond with further sanctions on Russia

The European Union´s foreign minister Josep Borrell said that Belarus hosting Russian nuclear weapons would mean an irresponsible escalation and a threat to European security.

He said Belarus can still stop it, it is their choice but the EU stands ready to respond with further sanctions.

EUR/USD Weekly Forecast: The beginning of the end of the tightening cycle

EUR/USD Weekly Forecast: The beginning of the end of the tightening cycle

The EUR/USD pair traded as high as 1.0929 this week but ends it with modest gains around the 1.0750 area. The US Dollar eased throughout the first half of the week amid a better market mood, as the banking financial crisis receded on the back of governments’ actions taken throughout the weekend.

On Sunday, the Swiss National Bank announced UBS, Switzerland’s biggest bank, will take over Credit Suisse for $3.25 billion, roughly 60% less than what the bank was worth on Friday. The Swiss government even changed the law to facilitate the deal. Investors gained confidence and moved into the high-yielding Euro ahead of the United States Federal Reserve (Fed) monetary policy decision on Wednesday.

Federal Reserve’s concerns

As widely anticipated, the Board of Governors of the Federal Reserve System voted unanimously to raise the interest rate by 25 basis points (bps) to a range of 4.75% to 5%.  The decision, however, was affected by the banking crisis, and the announcement spurred risk aversion, triggering a US Dollar sell-off that saw the pair peak at the aforementioned high.

At the beginning of the press conference, Chair Jerome Powell aimed to cool down markets by saying the American banking system was resilient and that authorities would take appropriate measures to protect it. In fact, US Treasury Secretary Janet Yellen spoke alongside Chief Powell in a separate event and noted the strong actions taken to ensure American deposits are safe, adding she is prepared to take additional action if needed.

Back to the Fed’s announcement, and economic projections, policymakers hinted at one more 25 bps rate hike before pausing, as the terminal rate stands at 5.1% by the end of 2023. Rate cuts are coming in 2024, although the Federal Funds Rate for such a year was upwardly revised to 4.3% from 4.1%. Furthermore, they expected Real GDP to grow by 0.4% this year and 1.2% in 2024, both suffering downward revisions. Inflation, in the meantime, has been upwardly revised as they foresee PCE inflation up to 3.3% this year, from 3.1% previously.

Fed Chairman Jerome Powell offered multiple interesting headlines in the press conference, most of them read as dovish. In regards to how the banking turmoil affected their decision, he acknowledged the committee considered a pause but ended up opting for a hike on the back of stronger-than-expected intermediate data on inflation and the labor market.

Powell added the central bank would continue hiking if needed, but the accompanying statement read, “we no longer state that we anticipate that ongoing rate increases will be appropriate to quell inflation. Instead, we now anticipate that some additional policy firming may be appropriate,” as they believe financial conditions had tightened further with the latest developments.

Across the pond, European Central Bank (ECB) President Christine Lagarde hit the wires but stuck to the central bank’s message from the previous week, insisting that banks are much stronger than in the 2008 crisis while noting policymakers are still engaged in battling inflation.

It’s clear that while trying to pour cold water on financial tensions, global policymakers are concerned about the side effects of their aggressive monetary tightening.  A steeper banking crisis is something fragile economies cannot afford these days. Officials could come out with grandiloquent words about the health and resilience of the sector, but behind those words, their decisions indicate they are worried. The beginning of the end of the tightening cycle has arrived.

The big question now is whether inflation will continue to recede. It does not matter if it is at a slow pace as long as it moves in the right direction. The next big hurdle the market could face is inflation changing direction.

Focus on European inflation

Data-wise, Germany reported the February Producer Price Index rose 15.8% YoY, higher than the 12.4% expected, although below the previous 17.6%. Also, the March ZEW Survey showed that the assessment of the Current Situation in the country fell further to -46.5, while Economic Sentiment plunged to 13. That of the Eurozone fell to 10,  both far below anticipated. Finally, Consumer Sentiment in the EU contracted to -19.2 in March, according to preliminary estimates.

United States figures were mixed, as housing and employment-related data were encouraging, but Durable Goods Orders declined 1% MoM in February.

The upcoming week will be a lighter one in terms of macroeconomic releases, with a focus on Europe, as the Eurozone and Germany will publish the preliminary estimates of their March Harmonized Index of Consumer Prices (HICP). Germany will also offer February Retail Sales, while the United States will unveil the Fed’s favorite inflation measure, the Core Personal Consumption Expenditures (PCE) Price Index, foreseen up by 4.4% YoY in February.

EUR/USD technical outlook

The weekly chart for the EUR/USD pair offers a neutral-to-bullish stance as the pair keeps struggling to clear a long-term level, the 61.8% Fibonacci retracement of the 2022 decline at 1.0745. Despite the fresh, almost two-month high, the pair has been unable to close a week above it since breaking lower early in February.

The same chart shows that a firmly bullish 20 Simple Moving Average (SMA) attracted buyers, currently providing dynamic support at around 1.0630. On the other hand, the pair retreated after nearing a bearish 100 SMA, the latter limiting advances at around 1.0980. Finally, technical indicators held within positive territory, the Momentum directionless just above its 100 level, and the Relative Strength Index (RSI) gaining bullish traction at 59, skewing the risk to the upside without confirming so.

The daily chart shows an increased risk of a bearish extension coming up next. EUR/USD fell for a second consecutive day, and while it holds above bullish moving averages, buying interest continues to give up. Technical indicators have turned sharply lower, although still within positive levels. A break below their midlines should mean increased selling interest and hence, anticipate another leg south.

Support could be found around 1.0690, followed by the 1.0600 price zone. Below the latter, the pair could extend its decline towards the next Fibonacci support, the 50% retracement at 1.0515.

On the other hand, the pair would need to advance beyond 1.0840 to recover its positive momentum and extend its rally towards 1.0930 and beyond.

EUR/USD sentiment poll

The FXStreet Forecast Poll shows that EUR/USD will likely remain around the current level, although most polled experts are bearish in the weekly and monthly perspectives. In the quarterly view, however, bulls dominate the scene standing at 45%. On average, the target has been lifted to 1.0871.

The Overview chart, on the other hand, shows that bulls dominate EUR/USD. The three moving averages head firmly north and stand at fresh multi-week highs. Furthermore, the base of the range in all cases is higher than in the previous week. In the near-term perspective, the pair is seen mostly between 1.0600 and 1.0800. The range moves lower, to 1.0400/1.0800 in the monthly view, but for the long-term one, the base has been set at 1.0600, with scope to advance up to 1.1200.

Gold Gains After Fed’s Dovish Hike Reinforces Bullish Trend, Breakout in Play

Gold Gains After Fed’s Dovish Hike Reinforces Bullish Trend, Breakout in Play

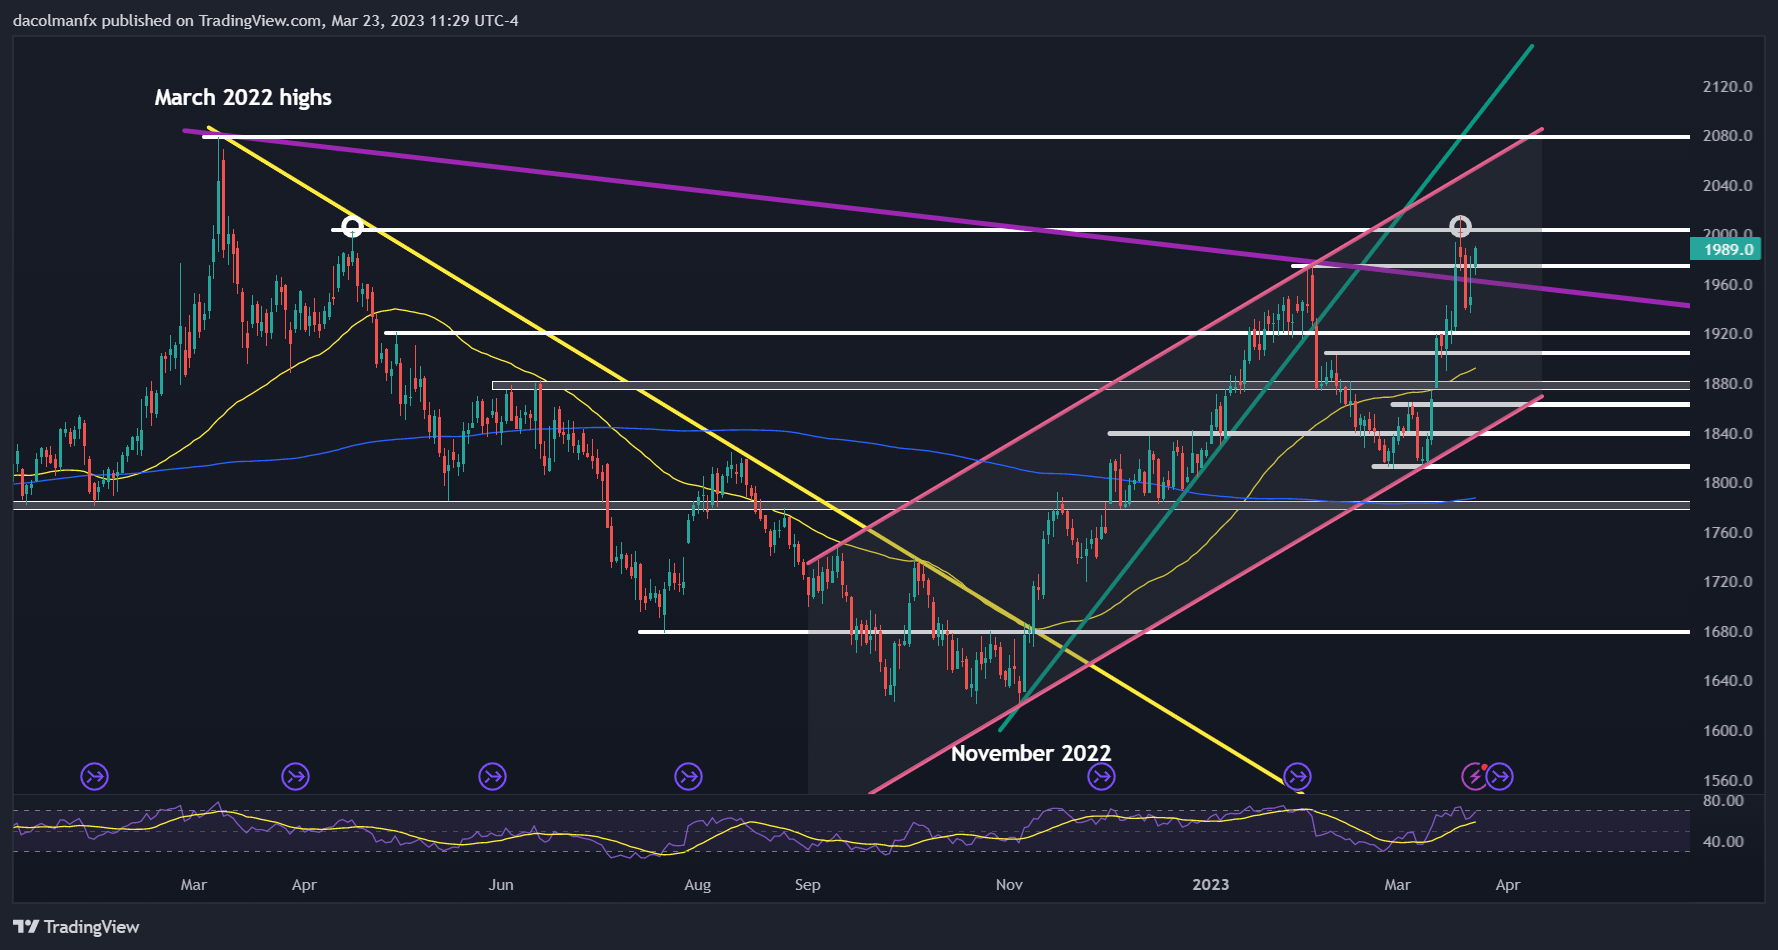
Gold prices surged on Thursday amid U.S. dollar weakness after the FOMC delivered a dovish interest rate hike and signaled that its tightening campaign may be nearing its end. In late morning trading, XAU/USD was rallying about 1% to $1,986, inching ever closer to its 2023 highs, just above the psychological $2,000 level set this past Monday.

Recent banking sector turmoil has led the Fed to adopt a much more cautious stance and to project a less aggressive hiking cycle than telegraphed just a few weeks ago, when Powell dropped a hawkish bombshell before Congress. In fact, the FOMC only expects to raise borrowing costs one final time this year to 5.00-5.25%, well below the 5.70% peak rate anticipated by the market earlier this month.

The idea that the terminal rate is within reach, coupled with growing speculation that the central bank will ease policy shortly thereafter, is likely to be bullish for non-yielding assets, including precious metals. This means that gold could remain in an upward trajectory over the medium term, especially if financial turmoil resurfaces and threatens to create systemic risks.

In terms of technical analysis, if gold extends its advance in the coming sessions, the first ceiling to consider appears in the $2,000/$2,015 region. On further strength and a decisive breakout, the focus shifts to channel resistance at $2,050, followed by $2,078, last year’s high. Conversely, if sellers return and spark a pullback, initial support comes at $1,975/$1,965. Below that, the next area of interest lies at $1,920 and $1,900 thereafter.

GOLD PRICE TECHNICAL CHART


German business activity picks up in March, with inflation falling but still high due to services price pressures

German business activity picks up in March, with inflation falling but still high due to services price pressures

March’s ‘flash’ PMI® data from S&P Global showed a second consecutive monthly increase in business activity across the German private sector, with the rate of growth accelerating though remaining only modest overall. The pace of job creation likewise picked up, though firms were a little less optimistic about the year-ahead outlook. Output price inflation meanwhile remained elevated due to stubbornly high pressures in the service sector. It did however ease to a near two-year low amid an increased drag from manufacturing, where the decline in input prices deepened and supplier delivery times shortened at an

USD/JPY Eyeing a Break of the 130.000 Handle Following Mixed Inflation Data

USD/JPY Eyeing a Break of the 130.000 Handle Following Mixed Inflation Data

USD/JPY FUNDAMENTAL BACKDROP

USD/JPY trickled lower in the Asian session to a fresh 6-week low following mixed inflation data out of Japan before finding some support at the 130.000 psychological level.

The YoY inflation rate fell to 3.3% in February 2023 from January’s 41-year high of 4.3% while the MoM print indicated declines of 0.6% in February, the first fall since October 2021. The key, however, was the so-called so-called core-core CPI (excluding fresh food and energy) accelerated further to 3.5% in February (vs 3.2 % in January). The continued rise in the CPI (excluding fresh food and energy) has reignited hope of a pivot from the BoJ when incoming Governor Ueda takes the hot seat on April 9.

image1.png

For all market-moving economic releases and events, see the DailyFX Calendar

In my view I do not see an immediate pivot in policy from incoming Governor Ueda however further tweaks to the yield control policy cannot be ruled out. According to reports PM Kishida’s administration views rigid monetary easing as problematic with the BoJ apparently monitoring the impact of Decembers widening of the control range until current Governor Kuroda’s term ends.

Japan Inflation YoY

Chart, bar chart  Description automatically generated

Source: Trading Economics, Ministry of Internal Affairs and Communication

The US Dollar has struggled since the FOMC meeting further weighing on USDJPY prices with the DXY hitting a low around the 102.000 handle yesterday. Later in the day we do have US Durable goods data, a positive print could provide the greenback with some respite. Whether such a move will have any sustainability however remains up in the air.

TECHNICAL OUTLOOK

From a technical perspective, USD/JPY has been on a steady decline since the Wednesday FOMC meeting. We saw resistance provided by the 50-day MA around the 132.60 mark which remains the most recent lower swing high.

We have printed a fresh low tapping into the psychological 130.000 mark with retracement a possibility. However, the path of least resistance appears to be further downside with any rallies providing potential shorts a better risk-to-reward opportunity. USDJPY remains bearish below the 132.60 handle.

USD/JPY Daily Chart – March 24, 2022

image3.png


Can Unlucky Traders Still be Profitable? Finding Optimal Risk Management

Can Unlucky Traders Still be Profitable? Finding Optimal Risk Management

Risk Management, Trading Luck, Risk/Reward Ratio Curve – Talking Points

Not Quite Being Lucky

Often, there is an element of luck when it comes to trading. Even if your analysis is spot on, the timing is very difficult. A famous example from the real world can be found in Michael Burry, the storied US investor who correctly predicted the 2008 housing bubble from Michael Lewis’ bestseller “The Big Short”. He had to face down a revolt among his investors that nearly chased him out of the very trades that would land him in the history books. Burry’s financial backers balked at a steady stream of expensive payments made to keep his trades in play as the markets dithered.

There is a way for traders to compensate for luck – risk management. Overlooking this essential component of the strategy is how an incredibly lucky trader – someone who can frequently call trades correctly – may still lose money in the aggregate. Conversely, using risk management effectively is how a poor win rate can still translate into profitability.

How is it that a lucky trader can lose money overall? Consider a person who profited on 8 trades out of 10, making 10 dollars per trade. On the two remaining trades, however, 50 dollars were lost each time. On net, this will leave the trader 20 dollars poorer. In this special report, we will show how an unlucky trader can still be profitable, and what you can do to optimize risk management.

The First Random Walk – Understanding the Sequence

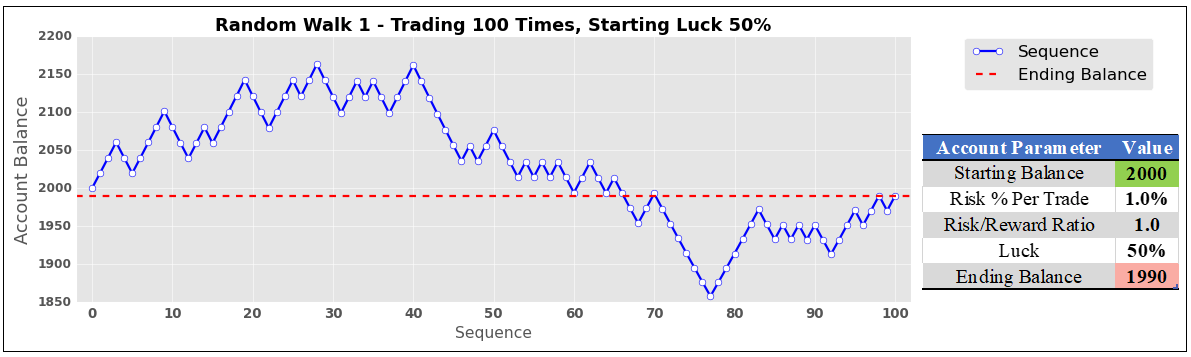
A random walk simulation was used to mimic someone trading 100 times in a row. Each random walk has a few parameters: starting account balance, the maximum risk a person is willing to take per trade as a percentage of the account balance (which stays the same as the trader makes or losses money), the risk-reward ratio (how much the trader wants to make relative to how much is put at risk), and finally the trader’s luck (the chance that a given trade in the sequence is profitable).

The first random walk is shown on the chart below. It simulates a trader that starts with a $2k account, risks 1% per trade, has a risk/reward (RR) ratio of 1:1 (meaning that the first trade risks losing $20 to make a profit of $20), and has 50% luck. Being lucky about half of the time had a predictable outcome. The ending balance ($1990) was nearly identical to where it started ($2000) after one hundred trades.

The First Random Walk – Understanding the Sequence

Study Limitations

It should be noted that this is a study computed with code and has no margin of error or human emotion factored into it. This means that no matter what, it assumes the trader being modeled always sticks to the game plan perfectly. It also assumes that trades can be seamlessly closed – with a profit or loss – at the designated settings with absolute precision. In the real world, stops may not always be executed at the specified price, resulting in some slippage. These simulations also assume 100 trades were taken, which will not match everyone’s level of activity. With that in mind, this is more of a demonstration of the importance of risk management rather than a one-size-fits-all trading system.

The Second Random Walk – Reducing Luck

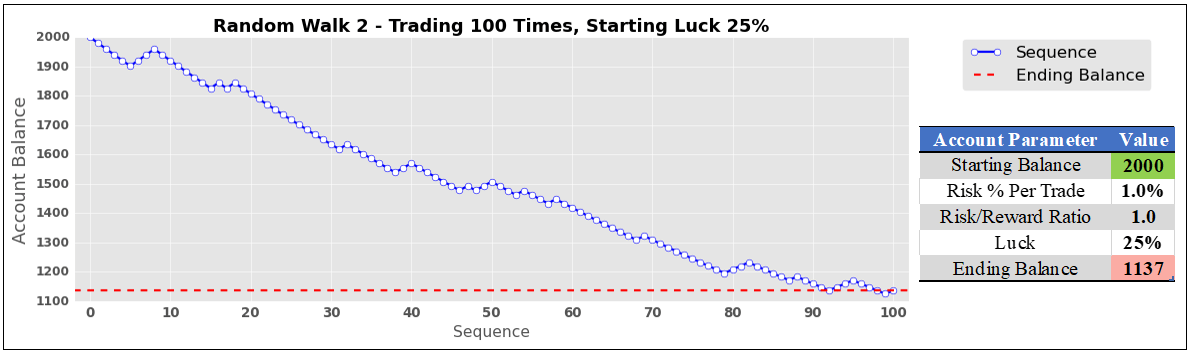
What happens when we take the same sequence but make our hypothetical trader unlucky, leaving everything else unchanged? With 25% luck, disaster strikes. Someone with a risk/reward ratio of just 1:1 would see their account balance cut almost in half after 100 trades ($1137). As we will find at the end of this journey, however, an increase in the risk/reward ratio can compensate for worse luck.

image2.png

Simulating Hundreds of Thousands of Trades to Find Optimal Risk/Reward Ratios

To find ideal risk/reward ratios for given levels of luck, these random walks were run many times to find statistically meaningful interpretations. In this study, one cycle constituted 100 trades conducted 100 times. That is a total of 10,000 trades per cycle! With each cycle, the risk/reward ratio automatically rose by 0.05, starting at 1. The program is coded to keep doing this until 100% of the trades are finished at or above the starting account balance.

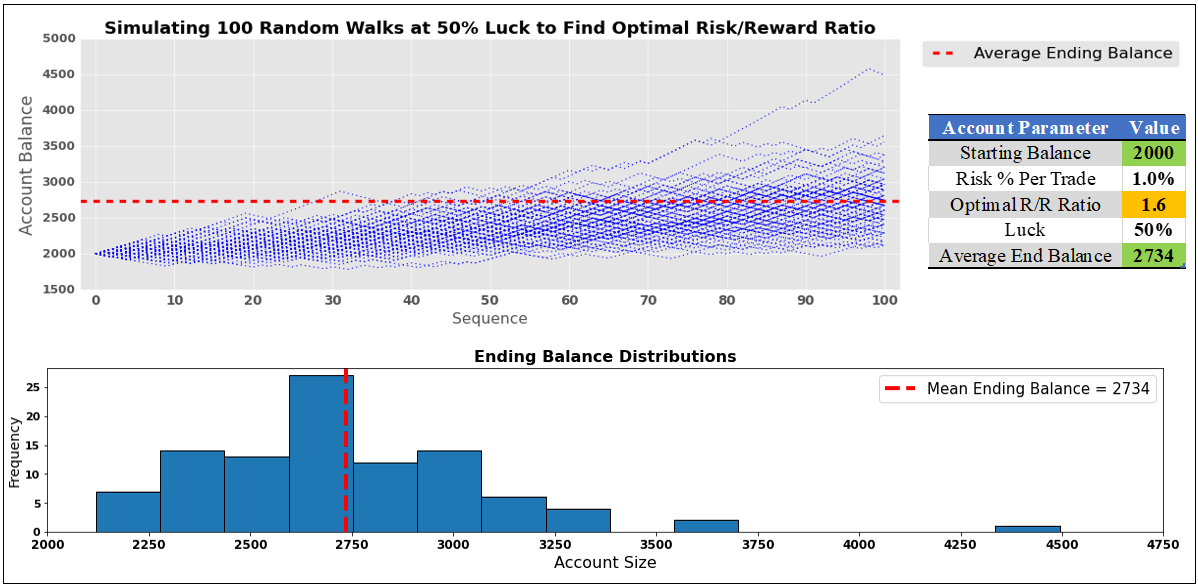
So, what does this look like for someone lucky about half of the time? Well, in the image below, we can see that the optimal risk-reward ratio is on average 1.6 (meaning that with a starting balance of $2k the strategy aims to make $32 in profit while risking $20 on the first trade). The latter two will adjust alongside the evolving account balance to maintain a 1.6 RR ratio, making sure the risk remains at 1% per trade.

The code ended up increasing the risk/reward ratio 6 times. Including the starting point, the cycle ran 7 times. In other words, 70k trades were conducted to find the optimal RR ratio. To further optimize this study, another 10 rounds of random sequences were used. This means that roughly 770,000 trades were placed to find the optimal risk/reward ratio for 50% luck! It is not exactly 770,000 because sometimes the RR ratio was above/under 1.6.

When someone is lucky half of the time, and they use a 1.6 risk-reward ratio, we can expect an average ending balance of $2734 (36.7% return, which remains constant no matter what the starting account balance size is) after 100 trades. In the lower half of the image, there is a normal distribution of outcomes. There were a couple of outliers, with an account topping $4.5k. A few others were above $3.5k.

Simulating Hundreds of Thousands of Trades to Find Optimal Risk/Reward Ratios

The Optimal Risk/Reward Ratio Curve

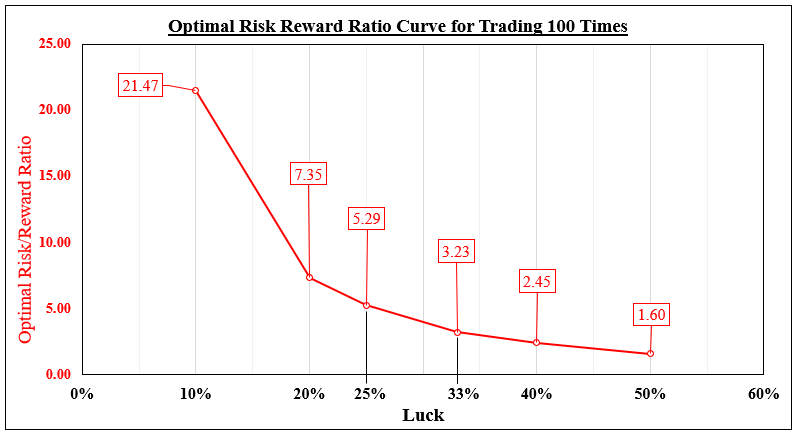
What about other levels of luck? In this study, I used the following: 50%, 40%, 33%, 25%, 20% and 10%. Optimal RR ratios are displayed in the chart below for a given luck level. As expected, lower levels of luck required higher risk/reward ratios to compensate. When you are lucky 40% of the time, an ideal RR ratio for a sequence of 100 trades seems to be 2.45.

At 2.45, a total of 30 cycles were simulated for a given random sequence. Just like before, an additional 10 were performed to help optimize this study. Combining all these sequences, roughly 3,300,000 trades were placed to find the optimal risk/reward ratio for 40% luck.

Someone lucky just 10% of the time can still make a profit. However, this would demand the daunting task of maintaining a 21.47 risk/reward ratio.

The Optimal Risk/Reward Ratio Curve

Is Trading Success Based on Luck?

Now, let us revisit the earlier scenario of a trader that is lucky just 25% of the time. Using a 1:1 risk-reward ratio, they lost almost half of their account. Using the optimal risk/reward ratio of 5.3 suggested in our analysis, their ending balance becomes $2844, a 42.2% return. Do traders have to be lucky to be profitable? Absolutely not. Success comes down to risk management.

What are Safe-Haven Assets & How to Trade Them

What are Safe-Haven Assets & How to Trade Them

What are safe-haven assets?

Safe-haven assets are where investors and traders put their money to protect against fundamental disruption. Safe-haven currencies , safe-haven stocks , gold , and US Treasuries have historically retained or increased their value during downturns or generally volatile markets, allowing protection against losses that growth equities may see in such conditions.

.

Gold as safe-haven asset

Safe-haven assets will typically show most, or all of the following characteristics:

1) High Liquidity

With significant trading volumes, you can enter and exit positions at the price you want without experiencing slippage . An example of a highly-liquid safe-haven currency pair is GBP/JPY . When signs of fundamental disruption arise, such as a Western recession, a common move is to go short GBP/JPY – and being able to enter the position at the original price will potentially mean higher profits as the price falls further.

2) Limited Supply

If an asset’s supply outpaces its demand, its value will likely erode. Markets such as gold, which have a scarcity of supply, are likely to have value residing in that scarcity, and potentially higher value still when demand increases. See more on the forces of supply and demand .

3) Varied Utility

Does the asset have enough uses, for example in industrial applications, for it to have substantial demand? Copper , for instance, has a wide range of uses in infrastructure and agriculture in particular, and demand often increases when emerging markets ramp up development.

4) Enduring Demand

A true safe haven will be expected to retain demand in the future, so there should be confidence in an asset’s future utility. For example, while some commodities such as silver may have many industrial applications now, they may be replaced by other commodities for those applications in the future.

5) Permanence

An asset capable of deteriorating in quality may see lower demand in future as its utility declines.

The top safe-haven assets to trade

When it comes to trading safe-haven assets, you can choose currency pairs, US Treasuries, commodities and even defensive stocks. Here, we’ll look at some of the most common safe-haven assets to trade.

Gold

The most noteworthy safe-haven commodity is gold , which has historically shown a reliable negative correlation with stocks. This highly-coveted physical asset is in high demand, exists independent of monetary policy decisions, and has a tight supply.

In 2009 investors flocked to gold following the financial crisis, prompting a three-year bull run taking the price to $1,900/oz in August 2011. While the metal saw a torrid run in the two years to follow, a prolonged bear market beyond that was never sustained, reinforcing its safe-haven status. The chart below gives a picture of the main price moves since the turn of the century.

Gold's performance as a safe-haven asset

Japanese Yen

JPY is recognized as one of the most reliable safe-haven currencies due to its trade surplus and status as net creditor to the world, its demand in currency carry trade transactions, and the self-fulfilling prophecy caused by these factors. The chart below demonstrates three instances where the allure of JPY as a safe haven can be seen in risk-off markets over three decades.

Japanese Yen's performance as a safe-haven asset

Defensive Stocks

While growth stocks will often fall in wider market turmoil, there are certain safe-haven stocks that can retain or increase in value during economic hardship. That’s because selected companies in sectors such as consumer goods and utilities offer products and services that are in high demand even in difficult economic times. The chart below shows three examples of how McDonald’s weathered challenging economic storms this century.

McDonald's performance as a safe-haven asset

GBP/USD holds steady below 1.2300 after UK Retail Sales

GBP/USD holds steady below 1.2300 after UK Retail Sales

GBP/USD continues to trade marginally lower on the day below 1.2300 early Friday. The data from the UK showed that Retail Sales rose by 1.2% in February, compared to the market expectation of 0.2%, but failed to provide a boost to the Pound Sterling ahead of PMI data.

GBP/USD faces first resistance at 1.2300, where the mid-point of the ascending regression channel coming from early March is located. Above that hurdle, 1.2330 (former support, static resistance from January) could be seen as the next resistance before the pair targets the upper limit of the ascending channel at 1.2370.

On the downside, 1.2230 (lower limit of the ascending channel, 20-period Simple Moving Average (SMA)) aligns as key support. With a four-hour close below that level, additional losses toward 1.2200 (psychological level) and 1.2160 (50-period SMA) could be witnessed.

GBP/USD has gathered bullish momentum and advanced toward 1.2300 early Wednesday, touching its highest level since early February. The pair’s near-term technical outlook points to a bullish bias but the US Dollar’s reaction to the US Federal Reserve’s (Fed) policy announcements should influence the action in the American session.

The UK’s Office for National Statistics reported earlier in the day that inflation in the UK, as measured by the Consumer Price Index (CPI), climbed to 10.4% on a yearly basis in February from 10.1% in January. This reading surpassed the market expectation of 9.8% by a considerable margin. The Core CPI, which excludes volatile food and energy prices, rose to 6.2% in the same period from 5.8%.

Following hot inflation figures, the probability of a 25 basis points (bps) Bank of England (BOE) rate hike on Thursday surged above 90% from 50% on Tuesday, reflecting the hawkish tilt in the expectations.

Later in the day, the Fed is forecast to raise its policy rate by 25 bps to the range of 4.75%-5%. This decision is already baked in and it’s unlikely to trigger a significant reaction.

Instead, investors will pay close attention to the terminal rate forecast in the revised Summary of Economic Projections (SEP), the so-called dot plot. In December, the median view of the policy rate at end-2023 stood at 5.1%. If the upward revision is not significant with the upper limit of the key rate landing somewhere between 5.25% and 5.5%, risk flows could dominate markets and provide an additional boost to GBP/USD. If the dot plot reveals that some policymakers penciled down rate cuts before the end of 2023, that should also trigger a similar market reaction.

On the other hand, US Treasury bond yields are likely to gain traction and help the US Dollar gather strength if the SEP shows that none of the policymakers expected a rate cut in 2023.

FOMC Chairman Jerome Powell’s comments could also influence the US Dollar’s valuation. If Powell reassures markets that liquidity issues in the banking sector are contained and that they will continue to tighten the policy to tame inflation, safe-haven flows could return to markets and force GBP/USD to turn south.