EUR/USD holds lower ground near 1.0850, awaits ECB-speak

EUR/USD holds lower ground near 1.0850, awaits ECB-speak

EUR/USD is holding lower ground near 1.0850 heading toward the European opening bells. The pair is treading water amid renewed US Dollar strength even as risk sentiment improves on US debt ceiling progress. All eyes remain on the US debt ceiling updates and ECB-speak.

The Relative Strength Index on the four-hour chart declined below 30, pointing to oversold conditions in the near term for EUR/USD. In case the pair stages a technical correction, 1.0850 (static level, 20-period Simple Moving Average (SMA)) aligns as interim resistance ahead of 1.0900 (psychological level, static level). A four-hour close above the latter could discourage sellers and open the door for an extended recovery toward 1.0930 (50-period SMA).

On the downside, 1.0800 (Fibonacci 50% retracement level of the latest uptrend) aligns as the next bearish target ahead of 1.0740 (Fibonacci 61.8% retracement).

EUR/USD has lost its traction and dropped to its weakest level in over a month below 1.0850 early Wednesday. Although the pair’s technical outlook points to oversold conditions, sellers could look to retain control unless there is a noticeable improvement in risk mood.

Although investors have turned optimistic about the US avoiding a default following the latest round of debt limit talks on Tuesday, markets remain risk-averse mid-week. The Euro Stoxx 50 Index is down nearly 0.3% in the early European morning and Dow Futures lose 0.75%.

Following his meeting with US President Joe Biden and other top congressional leaders on Tuesday, top congressional Republican Kevin McCarthy told reporters that it was possible to get a deal on raising the debt ceiling by the end of the week.

In the second half of the day, Building Permits and Housing Starts data for April will be featured in the US economic docket. Richmond Federal Reserve Bank President Thomas Barkin told Bloomberg on Tuesday that he was concerned about the commercial office sector. In case Building Permits, which are forecast to rise 3% following the 7.7% decline recorded in March, fall further in April, the US Dollar could have a difficult time gathering strength in the second half of the day.

Nevertheless, investors will continue to pay close attention to risk perception and comments from central bank officials. If Wall Street’s main indexes turn south after the opening bell, the USD should be able to stay resilient against its rivals and weigh on the pair.

Is This the Moment of Reckoning for Gold?

Is This the Moment of Reckoning for Gold?

The apparent progress in US debt ceiling talks and hawkish US Federal Reserve commentary has taken off some of the heat off gold’s rally. The focus now shifts to key support levels – a break below which would solidify the chances that gold’s rally had peaked for now.

XAU/USD has been lofty in recent weeks amid fears of a potential US debt default and hopes of an end of the Fed hiking cycle. But those drivers appear to be changing. “I’m confident that we’re going to continue to make progress toward avoiding default and fulfilling America’s responsibility as a leader on the world stage”, US President Joe Biden said after a meeting with top Republican lawmakers met at the White House on Tuesday.

XAU/USD Daily Chart

image1.png

US Treasury yields have risen in recent days following hawkish comments from Fed officials – Richmond Fed President Thomas Barkin said he was “comfortable” with raising rates further if needed to lower inflation. Cleveland Fed chief Loretta Mester said the US central bank was not at a point yet where it can hold rates steady. This follows remarks from New York Federal Reserve President John Williams last week that the Fed may not be done raising rates.

XAU/USD Monthly Chart

image2.png

The Fed earlier this month raised interest rates by 25 bps as expected, but indicated a pause in the hiking cycle. Markets are currently pricing in an 18% chance of another 25 basis points of a rate hike at the June meeting. The odds of 75 basis points rate cuts by the year-end have scaled back to 35% from 42% a week ago, according to CME’s FedWatch tool.

XAU/USD Weekly Chart

image3.png

On technical charts, the momentum on higher timeframe charts has been a concern in recent months. See previous updateson March 28,April 16,April 24, and the most recentMay 10update. However, a price confirmation has been lacking, that is, gold hasn’t broken any key support even on intraday charts. For instance, XAU/USD is holding above crucial support at the mid-April low of 1970 and the 200-period moving average on the 240-minute charts.

XAU/USD 240-minutes Chart

image4.png

However, Tuesday’s drop below the moving average is a sign that cracks are beginning to appear. This is confirmed by the 240-minute colour-coded candlestick chart (based on trending/momentum indicators) – for the first time since March, red candles have started to appear, that is, a bearish phase could be setting in. Moreover, on the daily charts, XAU/USD has entered a consolidation phase – note the early-May high of 2072 was part of the consolidation and not the start of a new leg higher (which the subsequent price action has confirmed).

XAU/USD Daily Chart

image5.png

To be fair, unless 1970 support gives way, the path of least resistance could be sideways at best. However, any break below 1970 could expose downside risks toward 1925.

Note: In the above colour-coded charts, Blue candles represent a Bullish phase. Red candles represent a Bearish phase. Grey candles serve as Consolidation phases (within a Bullish or a Bearish phase), but sometimes they tend to form at the end of a trend. Note: Candle colors are not predictive – they merely state what the current trend is. Indeed, the candle color can change in the next bar. False patterns can occur around the 200-period moving average, or around a support/resistance and/or in sideways/choppy market. The author does not guarantee the accuracy of the information. Past performance is not indicative of future performance. Users of the information do so at their own risk.

USD/JPY Price Forecast: Japanese GDP Supportive of BOJ Policy Shift

USD/JPY Price Forecast: Japanese GDP Supportive of BOJ Policy Shift

JAPANESE YEN FUNDAMENTAL BACKDROP

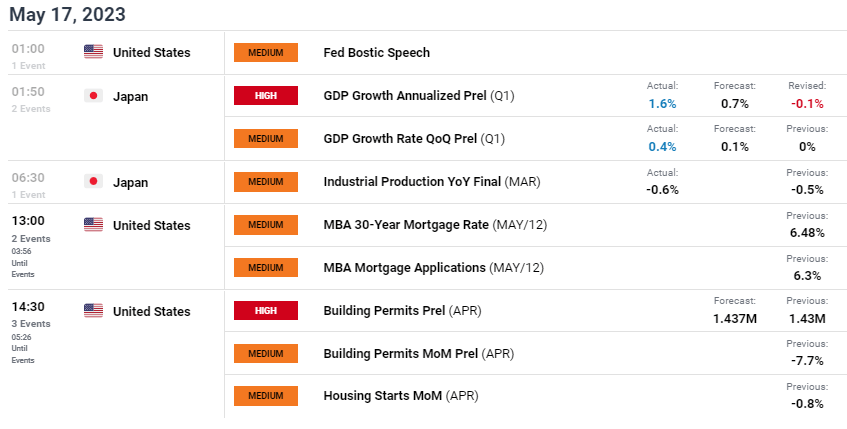
The Japanese Yen looks to be heading for its 5th consecutive loss against the USD after last nights US debt ceiling negotiations showed some positivity but not enough to ease market concerns just yet. Investors remain in favor of the greenback as a safe haven currency as opposed to the yen. This preference was even clearer after stellar Japanese GDP numbers (see economic calendar below) were unable to deter the recent trend.

ECONOMIC CALENDAR (GMT +02:00)

image1.png

From a Japanese perspective, the positive economic growth will lead nicely to elevated inflation levels (above their 2% target) and potentially result in some form of policy change – most likely by adjusting the current Yield Curve Control (YCC) conditions in the near future.

Bank of Japan (BOJ) money market pricing shows no real material change as expected upcoming meetings could be the start of the aforementioned changes by which hawkish repricing could take place.

BOJ INTEREST RATE PROBABILITIES

image2.png

Source: Refinitiv

Later today, US building permit data will be the focal point for the pair and is projected to come in marginally higher than the March print. Further US debt ceiling statements could add to volatility as it takes centre stage over other macro data.

TECHNICAL ANALYSIS

USD/JPY DAILY CHART

image3.png

Chart prepared by Warren Venketas, IG

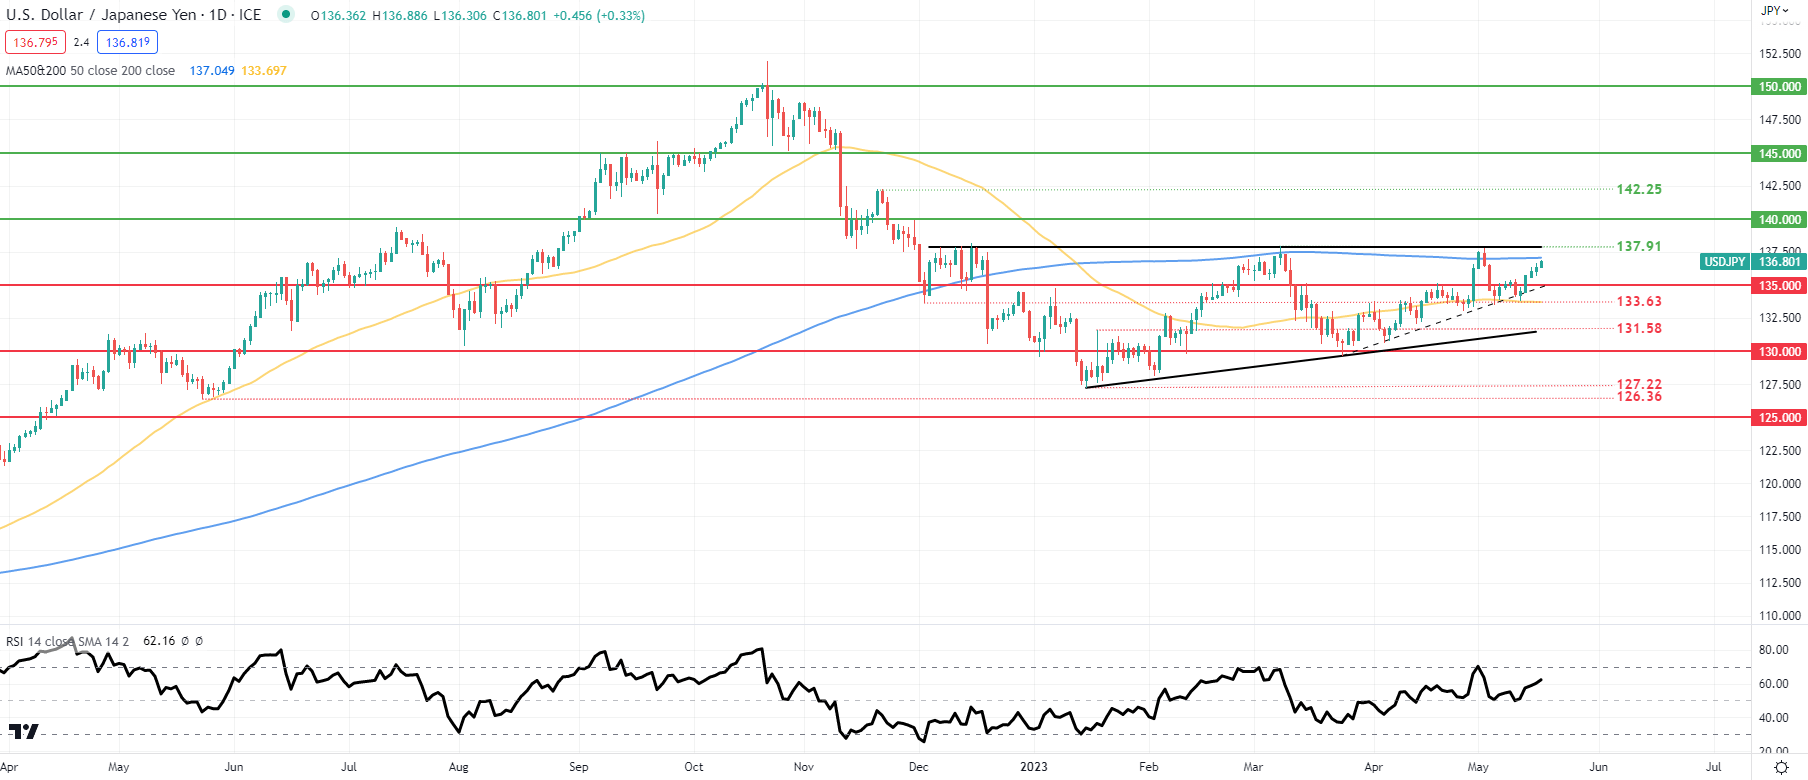
USD/JPY shows price action now looking to retest the 200-day moving average (blue) for the first time since the beginning of May as the pair continues to trade within the developing ascending triangle pattern (black). A confirmation close above the 200-day MA could bring into consideration the triangle resistance breakout coinciding with the 137.91 March swing high.

That being said, the Relative Strength Index (RSI) could move back into overbought territory possibly hinting at yet another rejection by bears around this key area of confluence.

Trading Economic Data Means Looking Past the Numbers

Trading Economic Data Means Looking Past the Numbers

The foreign exchange market’s reaction to economic data is one of the most important subjects for traders to consider, but also one of the most vexed.

The monthly round of official and private releases from around the world covers everything from inflation and employment to the forward-looking views of corporate purchasing managers. Together with central bank pronouncements, it forms what we might call the framework of foreign exchange trading.

Major Economic Releases Can Dominate Trade

Markets may well hunker down, losing both volume and volatility, in the run-up to an eagerly anticipated number. Official US labor market statistics are perhaps the most obvious example here. When the trading community expects serious gains or crushing losses the session can be subdued from Asia’s open and right across Europe as participants nurse suspicions or hopes. Even when the market expects neither many traders will – in financial journalism’s enervating cliché – “wait and see.”

This makes sense of course, enervating or not. Obviously, there’s a link between the economic performance of a country with a freely floating currency and the performance of that currency against its peers. At the most basic level a strong piece of economic data will boost a currency, a weaker one will tend to see it fall.

However, to take the matter no further would be a grave error. For one thing, individual pieces economic data tend to influence currencies in a very fleeting way. The gains provided by even a blockbuster, expectation-shattering number can be undone by the end of a day’s session, and well before that in some cases. It may even mean no more than a few minutes’ spike one way or another.

So, there’s clearly more to know about data and its effects.

The first and perhaps most important thing is that, while data provide the rhythm, the world moves to a monetarist cadence and central banks will always play lead. So, ultimately, the longer-term effects any piece of economic news must be considered with a view to how it might change monetary policy. No single data release is ever likely to do that, and markets would have caused to worry if it did. Central banks like to be ahead of the numbers, ready to tighten or loosen policy as needed before trends turn.

Therefore, we might see the markets only very briefly cheer strong retail sales, say, or powerful job creation. They might be great for the politicians, but, if inflation remains docile, they might not mean anything at all in terms of central bank policy changes. And if rates aren’t going up or coming down, then the longer-term effect of the data on the currency won’t amount to much.

Of course, these days docile inflation is little more than a happy memory across much of the world as war in Ukraine boosts both food and fuel prices at a time when post-Covid supply chain storms are still raging.

Currencies Can Fall Even When Interest Rates Rise

In July of this year, the United States Federal Reserve delivered a three-quarter point interest rate rise, something which would have been considered extraordinary monetary action for most of the past thirty years. And yet the US Dollar actually lost ground by the end of the session for, in its post-rate-hike remarks, the Fed left markets reasonably sure that future actions were going to be a lot more measured.

So, we can on occasion see the phenomena of a ‘dovish’ rate hike, or even a ‘hawkish’ rate cut. That’s when a central bank takes action but strongly implies that it has finished doing so, or that the barrier to more is extremely high. Higher interest rates have not been terribly helpful to rare-breed Sterling bulls this year either. The United Kingdom’s political and economic turmoil has left the market wondering if its economy can bare higher borrowing costs. The US certainly looks much better placed to do so.

With all this in mind, merely watching and reacting to pieces of economic news is unlikely to make for a satisfactory trading strategy. Indeed, the Dollar’s broad gains this year have rendered data watching all-but meaningless in many countries. Their currencies have fallen against the Greenback regardless of the numbers as the US currency reveals itself as the ultimate safe-haven play.

Competent traders know where the market is focused and where in the business cycle we are. What that tends to mean in practice is which specific data releases are most likely to trigger changes in the monetary mood music.

These can change dramatically over time. Older readers may well recall the days when western industrial production figures were the ones to watch for the best central bank steer. In more recent times unemployment figures took over. Policymakers were leery of wage inflation and, poised to “withdraw the punchbowl” if the labor market party showed any sign of getting out of hand.

Now of course inflation figures themselves are perhaps the ones which traders look at most obsessively, with prices’ stubborn elevation. One day, the focus will move on again. It always does. But a nuanced approach to trading economic data should remain a constant.

A Reversal or a Dead-Cat Bounce in US Dollar? EUR/USD, GBP/USD, USD/JPY

A Reversal or a Dead-Cat Bounce in US Dollar? EUR/USD, GBP/USD, USD/JPY

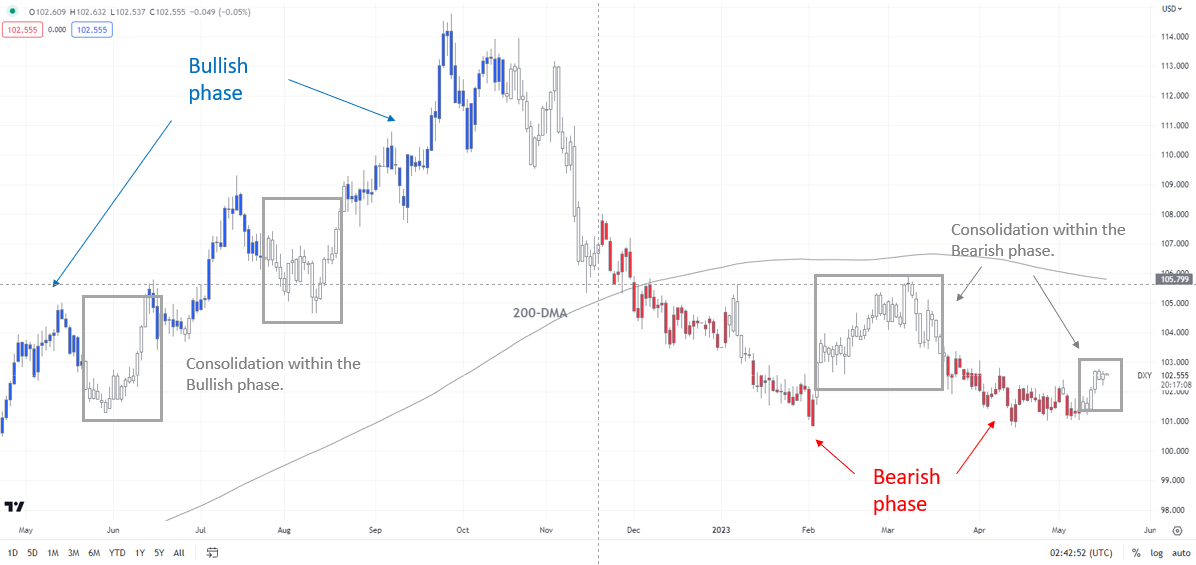
The rebound in the US dollar over the past week or so appears to be a consolidation, and not a reversal of the well-established downtrend, at least yet.

The US dollar index’s (DXY index) rise above immediate resistance at the early-March high of 102.40 confirms that the immediate downward pressure has eased somewhat, thanks to hawkish remarks from US Federal Reserve officials. Richmond Fed President Thomas Barkin said he was “comfortable” with raising rates further if needed to lower inflation. Cleveland Fed chief Loretta Mester said the US central bank was not at a point yet where it can hold rates steady.

US Dollar Index (DXY) Daily Chart

image1.png

This follows remarks from New York Federal Reserve President John Williams last week that the Fed may not be done raising rates. Still, the DXY index’s trend is broadly bearish and the recent rebound is a consolidation, as the daily colour-coded candlestick chart based on trending/momentum indicators shows.

Markets are currently pricing in an 18% chance of another 25 basis points of a rate hike at the June meeting. The odds of 75 basis points rate cuts by the year-end have scaled back to 35% from 42% a week ago, according to CME’s FedWatch tool.Key focus is now on US Fed Chair Powell’s speech on May 19 – a hawkish tilt could keep the USD well bid.

EUR/USD Weekly Chart

image2.png

Furthermore, the patchy post-Covid rebound in China and deepening producer price deflation have raised concerns regarding slowing demand in the world’s second-largest economy weighing on commodity-sensitive currencies like the Australian dollar and the New Zealand dollar.

EUR: Slight soft bias

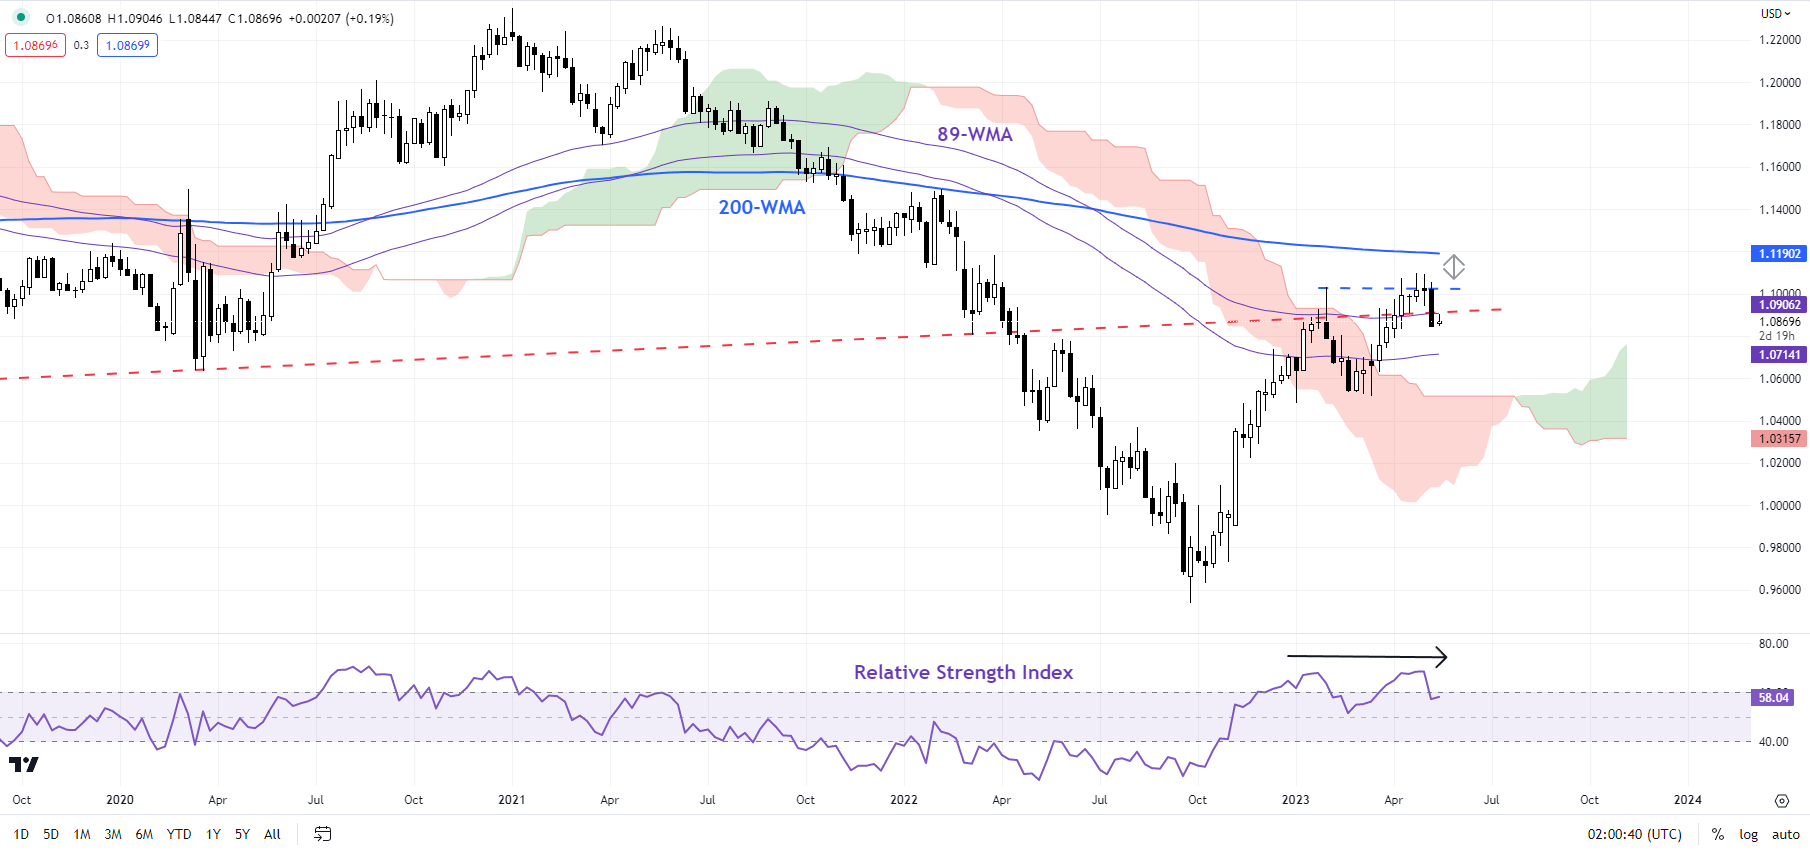
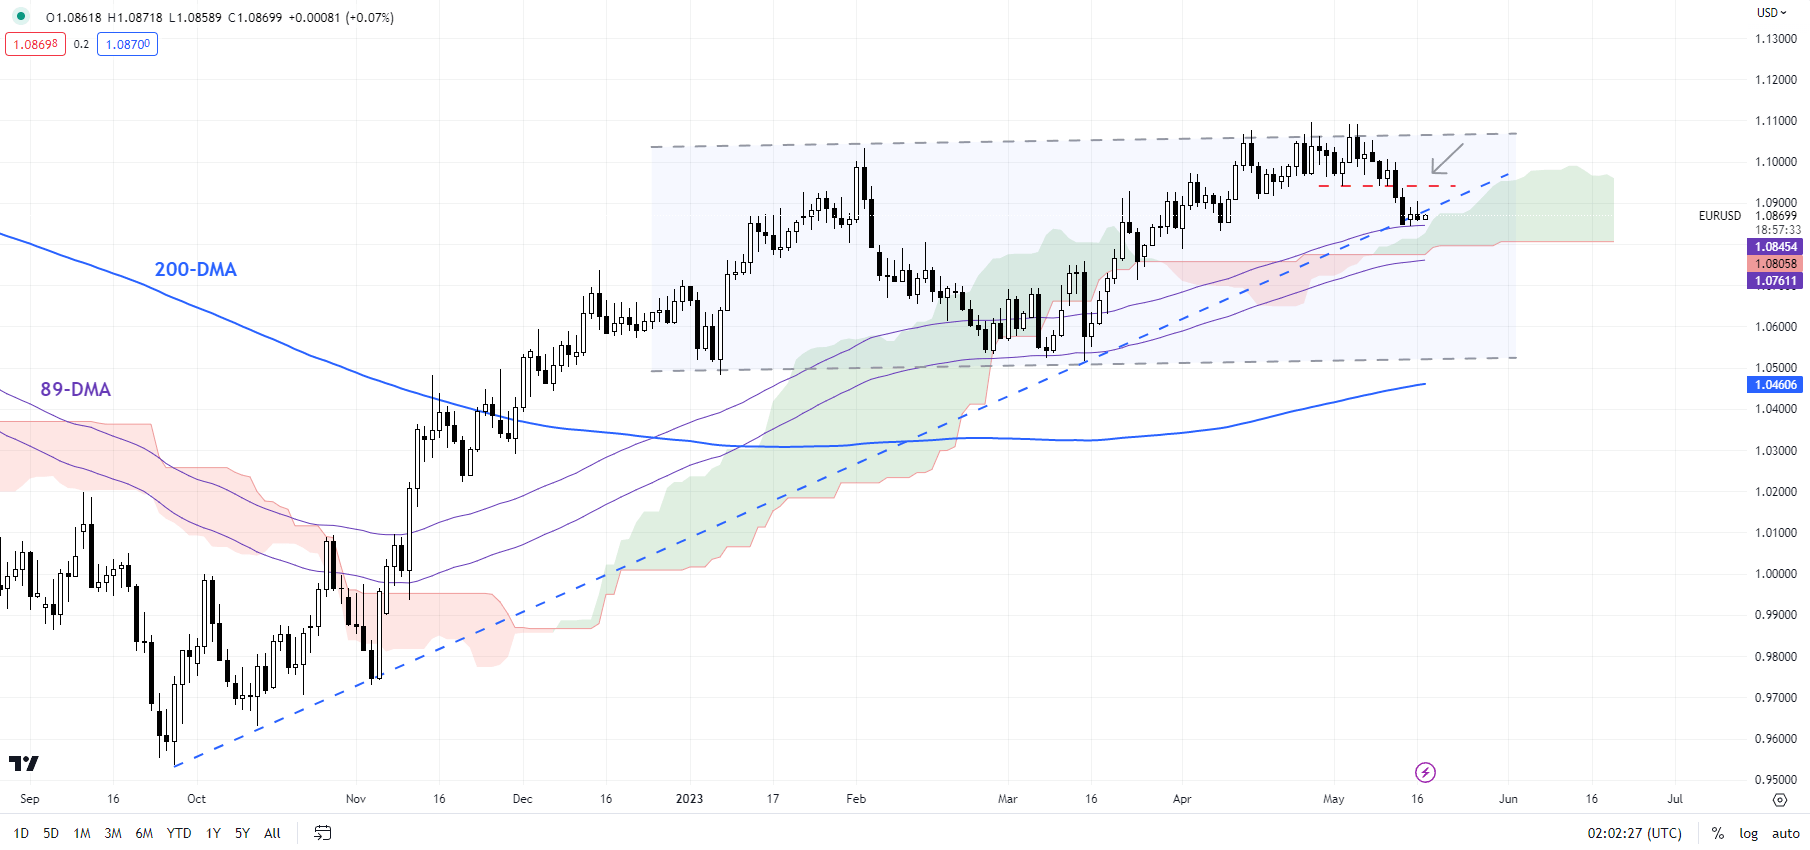
EUR/USD’s break last week below minor support at the early-May low of 1.1000 indicates that the upward pressure is easing. See the previous update that highlighted the risk of a setback “Did ECB Just Put Brakes on Euro’s Rally? EUR/USD, EUR/AUD, EUR/JPY”, published May 5.

EUR/USD Daily Chart

image3.png

The next support to watch would be the 89-day moving average, coinciding with the lower edge of the Ichimoku cloud on the daily chart (at about 1.0750). Any break below could pave the way for a deeper setback toward the March low of 1.0510. However, as of now, the probability of a significant fall looks low given the broader uptrend is in place. For more discussion on the trend, see “To What Extent Euro Could Fall: EUR/USD, EUR/GBP, EUR/JPY Price Setups”, published May 16.

GBP/USD Daily Chart

image4.png

GBP/USD: Rally stalls at resistance

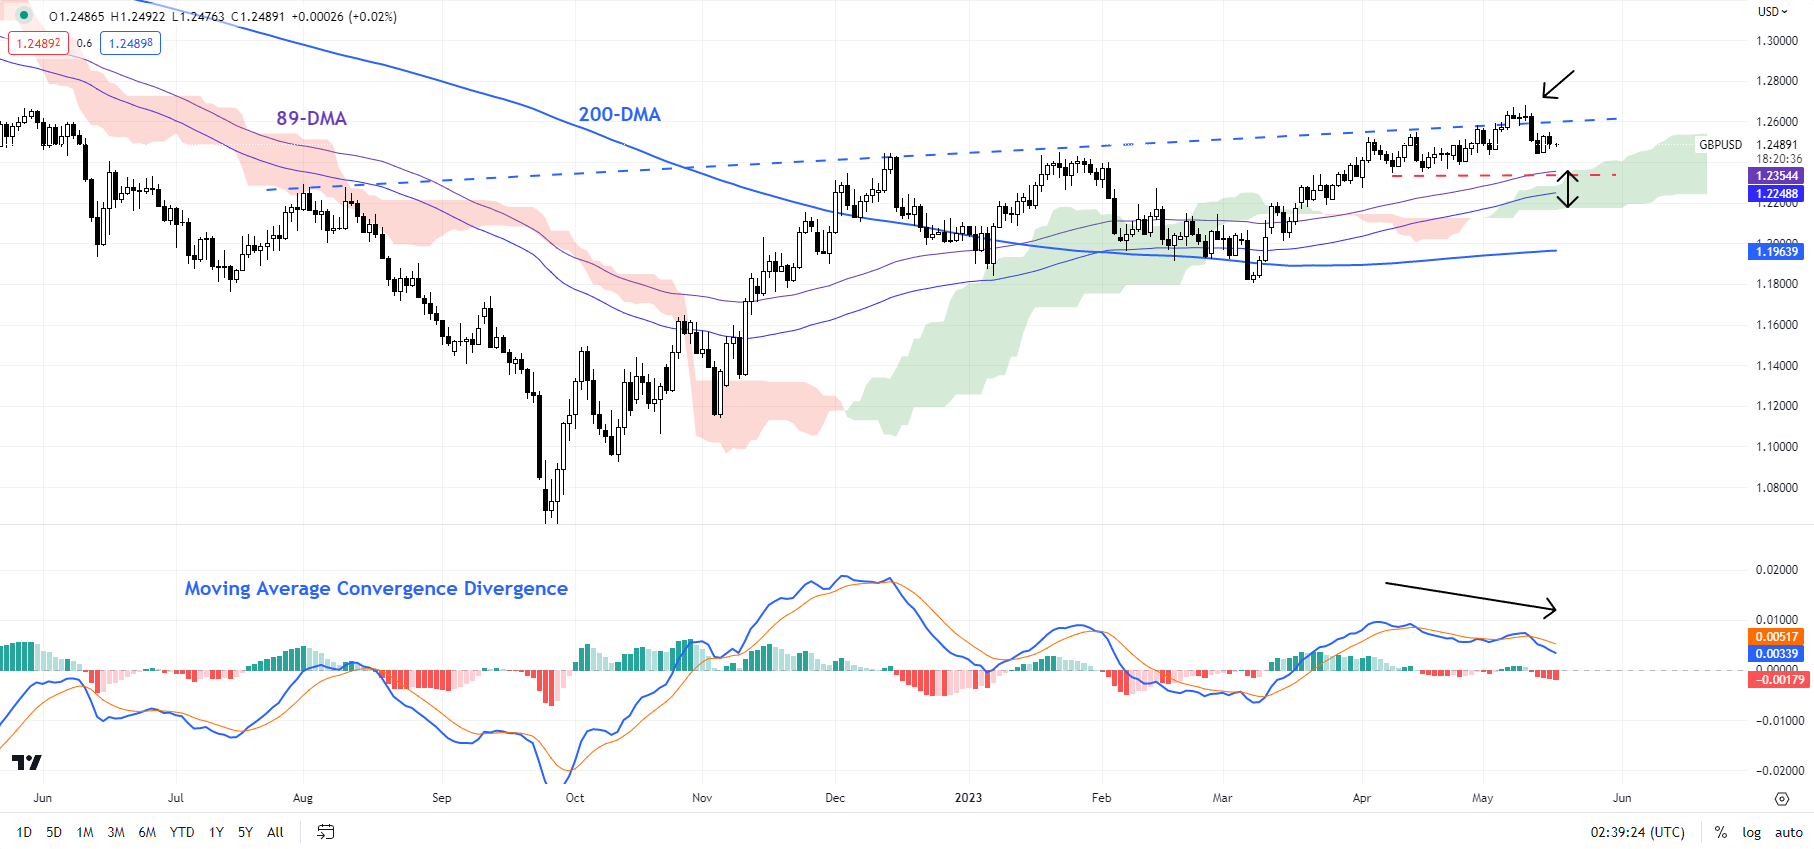
While the broader trend remains bullish (see “British Pound Buoyant Ahead of BOE: How Much More Upside?”, published May 8), the recent retreat from a slightly upward-sloping trendline, associated with weakening upward momentum, is a reflection of slight fatigue in the rally. Still, GBP/USD has quite a bit of cushion around 1.2200-1.2350 which could limit any further downside.

USD/JPY 240-minute Chart

image5.png

USD/JPY: Broad range looks set to continue

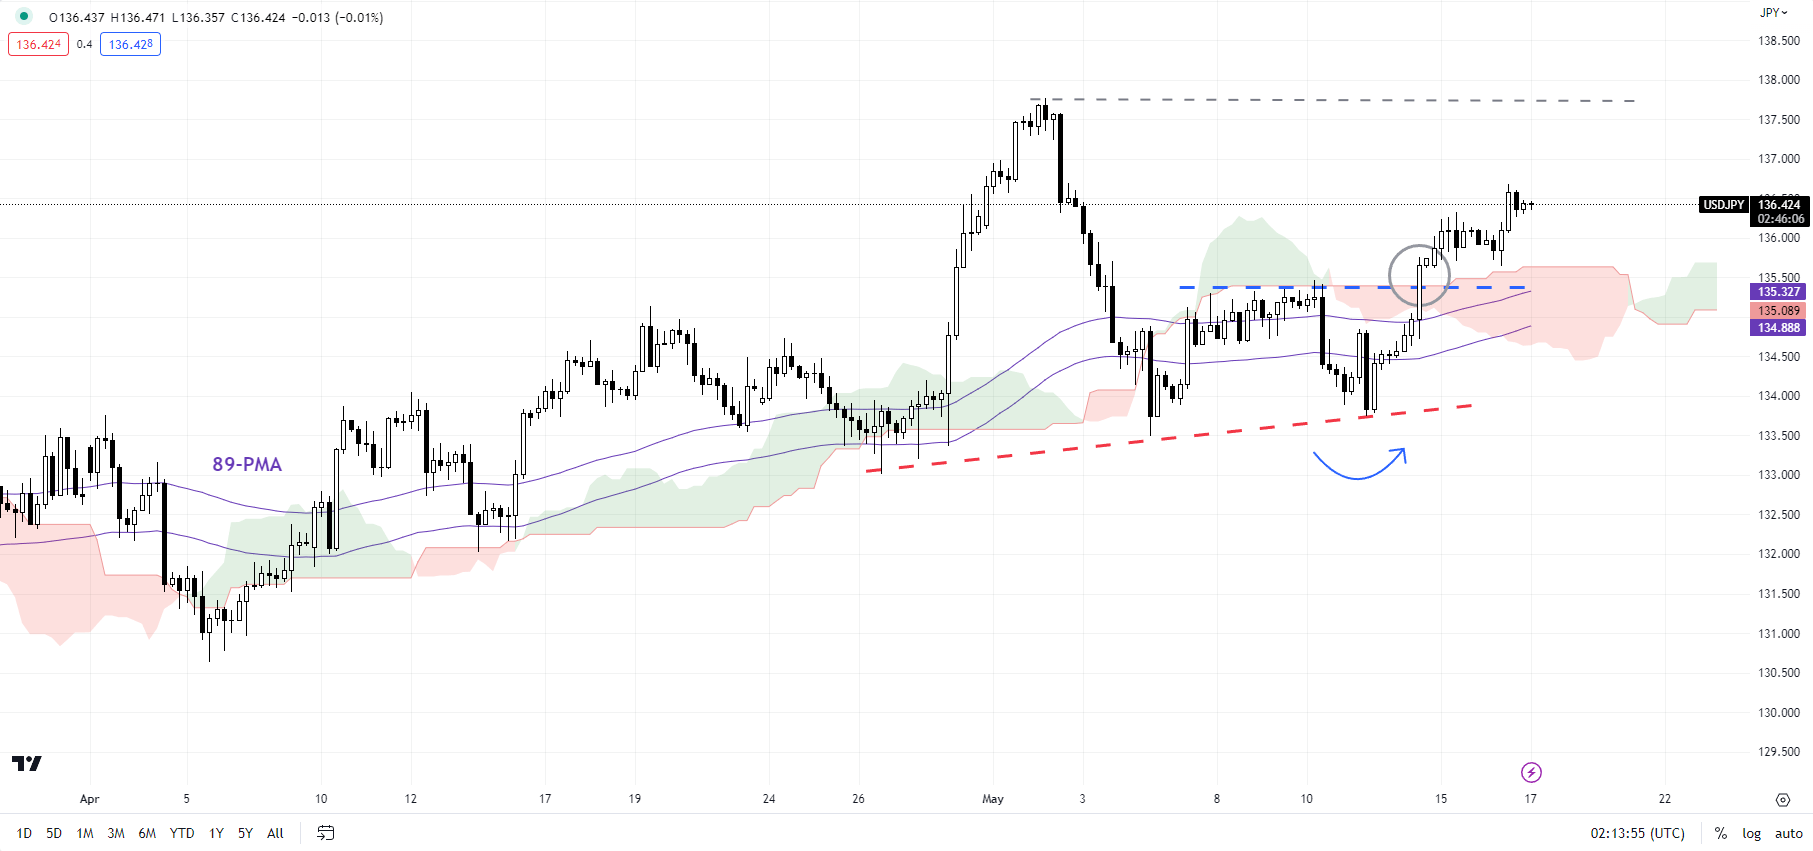
USD/JPY’s rise above the initial ceiling at the May 10 high of 135.50 confirms that the immediate downward pressure has faded. This coupled with the rebound from a stiff cushion on an upward sloping trendline from the end of April confirms that the pair remains in a broad 133.00-138.00 range for now.

Note: In the above colour-coded chart, Blue candles represent a Bullish phase. Red candles represent a Bearish phase. Grey candles serve as Consolidation phases (within a Bullish or a Bearish phase), but sometimes they tend to form at the end of a trend. Note: Candle colors are not predictive – they merely state what the current trend is. Indeed, the candle color can change in the next bar. False patterns can occur around the 200-period moving average, or around a support/resistance and/or in sideways/choppy market. The author does not guarantee the accuracy of the information. Past performance is not indicative of future performance. Users of the information do so at their own risk.

Euro Technical Outlook – Test of Trends and Potential Reversals for EUR/USD and EUR/JPY?

Euro Technical Outlook – Test of Trends and Potential Reversals for EUR/USD and EUR/JPY?

EUR/USD TECHNICAL ANALYSIS

EUR/USD remains within a long-term ascending trend channel from the September 2022 low and is examining a shorter-term ascending trend line today. A definitive break below it may open the way for a test of the longer-term trend line.

Looking closely at the price action this week, EUR/USD closed below the 21-day Simple Moving Average (SMA) based Bollinger Band last Friday. Yesterday it closed on the lower band. A close back inside the band may signal a pause in bearishness or a possible reversal.

The low this week has been 1.0843 which was seen on Monday. It is above a previous low at 1.0831 and this may continue to provide support. Below there, an April low of 1.0788 currently coincides with the ascending trend line and might lend support.

Further down, there could be support at the prior lows of 1.0713, 1.0525, 1.0516, 1.0483 and 1.0443. The 200- and 260-day SMA currently dissects the latter and may add support.

On the topside, resistance could be at the previous peaks in the 1.1075 – 1.1095 area ahead of the March 2022 high of 1.1185.

image1.png

Chart Created in TradingView

EUR/JPY TECHNICAL ANALYSIS

EUR/JPY made a 15-year high at the start of this month at 151.61 and has since retreated. This price action has seen a potential Head and Shoulders formation evolve.

A Head and Shoulders chart pattern has the potential to be a significant reversal signal. A clean break below the neckline may confirm the emergence of bearishness.

It should be noted though that past performance is not indicative of future results. The neckline is currently near 146.00 but it has a negative gradient and will nudge lower over time. A move above the recent high of 149.27 might call into question the validity of the reversal signal.

Resistance could be at the prior peaks of 146.27 and 151.61 as well as the breakpoint in between at 149.79.

On the downside, support may lie at the breakpoints of 145.67 and 145.57, which are just below the neckline.

image2.png


US April Retail Sales Forecast: Rebound expected, US Dollar hangs on debt ceiling

US April Retail Sales Forecast: Rebound expected, US Dollar hangs on debt ceiling

Retail Sales data in the United States (US) will be released by the US Census Bureau on Tuesday. The headline number is forecast to increase 0.7% in April after posting the second straight monthly drop in March.

The US Dollar (USD) has been on a sustained recovery following last week’s United States Consumer Price Index (CPI) figures for April. The US Retail Sales report could have a significant impact on the US Dollar’s valuation amid a lack of high-impact economic data releases from the US docket this week.

What to expect in the next US Retail Sales?

Tuesday’s US economic calendar features the release of the Retail Sales report for the fourth month of the year.

On a monthly basis, the headline Retail Sales are seen rebounding 0.7% during the reported month. Excluding autos, core Retail Sales are likely to have jumped 0.4% in April as against a 0.4% decline registered in March. US Retail Sales Control Group for April are foreseen at 0%, compared with March’s 0.3% decrease.

Economists expect the increase to be driven by robust spending on cars and fuel. Meanwhile, the Financial Times (FT) reported that “the outlook for retail sales is mixed as continued strength in the labor market and wages is likely to support consumer spending.”

According to analysts at BBH, “the data highlight will be April retail sales Tuesday. The headline is expected at 0.8% m/m vs. a revised -0.6% (was -1.0%) in March, while ex-autos is expected at 0.4% m/m vs. a revised -0.4% (was -0.8%) in March.  The so-called control group used for GDP calculations is expected at 0.3% m/m vs. -0.3% in March. In late April, the Census Bureau reported its annual revisions to the retail sales data.”

When is US April Retail Sales report released and how can they affect EUR/USD?

The Retail Sales data is scheduled for release at 12:30 GMT on Tuesday. With the US Dollar recovering ground to reach a monthly high in the wake of mounting US default fears and looming banking sector concerns, the EUR/USD pair remains vulnerable to more downside risks below the 1.0900 psychological mark. Stronger-than-expected US Retail Sales data is likely to help ease economic worries, in turn, lifting the main currency pair at the expense of the Greenback.

On the other hand, weaker Retail Sales details are likely to rekindle recession fears while reinforcing the market’s expectations of a US Federal Reserve (Fed) rate cut as early as July. Worries over a potential economic downturn could provide a fresh leg in the ongoing recovery of the safe-haven US Dollar.

At the moment, markets are pricing in an 82% chance of the Federal Reserve holding rates at the current level in June while maintaining a 33% chance of a rate cut in July.

Heading into the key release, the US Dollar is struggling to extend last week’s rally, as risk sentiment has somewhat improved after US President Joe Biden said over the weekend that the talks with Congress on raising the US government’s debt limit were moving along. President Biden added that more will be known about their progress in the next two days.

US President Biden will meet with the congressional leaders on Tuesday for talks on a plan to raise the nation’s debt limit and avoid a catastrophic default.

Meanwhile, Dhwani Mehta, Asian Session Lead Analyst at FXStreet, offers a brief technical outlook for the major and explains: “Having breached the critical 21-Day Moving Average (DMA) support last week, the selling interest around the EUR/USD pair remains unabated, as the pair took out the bullish 50 DMA cushion on Monday, The 14-day Relative Strength Index (RSI) is holding well below the midline, suggesting that there is more room to the downside.

Dhwani also outlines important technical levels to trade the EUR/USD pair: “On the upside, EUR/USD buyers need acceptance above the bullish 50 DMA support-turned resistance to initiate any meaningful recovery toward 1.0950 psychological level. Conversely, immediate support awaits at Tuesday’s low of 1.0845, below which a sharp sell-off toward the ascending 100 DMA at 1.0804 cannot be ruled out.”

About US Retail Sales

The Retail Sales released by the US Census Bureau measure the total receipts of retail stores. Monthly percent changes reflect the rate of changes in such sales. Changes in Retail Sales are widely followed as an indicator of consumer spending. Generally speaking, a high reading is seen as positive (or bullish) for the US Dollar, while a low reading is seen as negative (or bearish).

GBP/USD regains 1.2500 as US Dollar resumes correction

GBP/USD regains 1.2500 as US Dollar resumes correction

GBP/USD is trading back above 1.2500, reversing losses led by the mixed UK labor market report. The US Dollar has resumed its corrective downside amid a recovery in risk sentiment. Traders await the US data and debt ceiling updates.

The Relative Strength Index (RSI) indicator on the four-hour chart recovered to 50 but GBP/USD is yet to make a four-hour close above the 100-period Simple Moving Average (SMA), which acts as dynamic resistance at 1.2540.

If GBP/USD clears that level and starts using it as support, it could target 1.2570 (50-period SMA) and 1.2600 (psychological level, static level).

On the downside, first support aligns at 1.2500 (20-period SMA, psychological level, static level) ahead of 1.2480 (200-period SMA) and 1.2450 (static level, Fibonacci 23.6% retracement of the latest uptrend).

GBP/USD has regained its traction and climbed above 1.2500 after having dropped below that level in the early European morning. The pair, however, is having a difficult time gathering bullish momentum as the dynamic resistance at 1.2540 stays intact.

The data published by the UK’s Office for National Statistics revealed on Tuesday that the Claimant Count Change came in at +46.7K in April, compared to the market expectation for a decrease of -10.8K. Moreover, the ILO Unemployment Rate ticked up to 3.9% from 3.8%. Although these figures highlight looser conditions in the UK labor market, wage inflation remains relatively hot. Average Earnings Including Bonus rose 5.8% in the three months to March, matching the previous reading and surpassing analysts’ forecast of 5.1% by a wide margin and allowing Pound Sterling to stay resilient against its rivals.

According to Reuters, markets still see a 68% probability of a 25 basis points (bps) Bank of England (BoE) rate hike in June.

In the second half of the day, April Retail Sales and Industrial Production data will be featured in the US economic docket. On Monday, the disappointing Empire State Manufacturing survey forced the US Dollar (USD) to stay under bearish pressure. A similar reaction could be witnessed in case these data point to a weakening consumer activity and vice versa.

Meanwhile, US stock index futures turned flat on the day in the European morning after having stayed in the negative territory in the Asian session. In case risk flows continue to dominate the action, GBP/USD could gather recovery momentum. Nevertheless, investors could stay away from risk-sensitive assets ahead of US President Joe Biden’s meeting Republican House of Representatives Speaker Kevin McCarthy and three other top congressional leaders at 1900 GMT for the next round of debt limit negotiations.

Australian Dollar Dips on Soft China Data. Will AUD/USD Test Range Lows?

Australian Dollar Dips on Soft China Data. Will AUD/USD Test Range Lows?

The Australian Dollar dropped on doubts about the economic recovery for China after statistics revealed slowing activity.

Chinese data today saw industrial production come in at 5.6% year-over-year to the end of April against the 10.9% forecast and March’s print of 3.9%.

Retail sales for the same period were 18.4%, instead of the 21.9% expected and 10.6% previously. Fixed asset investment ex-rural and property investment also missed estimates printing at 4.7% and -6.2% respectively.

Today’s numbers come on the back of soft inflation data last week and the People’s Bank of China (PBOC) leaving the 1-year medium-term lending facility (MLF) rate unchanged yesterday at 2.75%. Although they did add CNY 25 billion of liquidity.

10-year Chinese government bond (CGB) yields continue to trade near 2.7%, the level they were at in November last year prior to Covid-19 restrictions being lifted.

AUD.USD had reclaimed 67 cents overnight on a weakening US Dollar but gave up some ground as concerns grow for Australia’s number one export destination.

Ahead of the Chinese data, RBA meeting minutes showed that the decision to raise rates at the May meeting was finely balanced and stated, “Members discussed two options: holding the cash rate unchanged or increasing the cash rate by 25 basis points.”

The case for keeping rates unchanged was based mostly on the recent deceleration in inflation. CPI was 7.0% year-on-year to the end of March, down from 7.8% at the end of December.

In the argument for hiking, it was noted that although price pressures appear to be decreasing, any reacceleration in inflation would extend the period that CPI remains above the target band of 2-3%. The bank’s current projections have this objective being met in mid-2025.

Australian jobs data will be released on Thursday and a Bloomberg survey of economists is anticipating the unemployment rate to remain unchanged at a 50-year low of 3.5%.

AUD/USD TECHNICAL ANALYSIS

AUD/USD has been in the 0.6565 – 0.6818 range for 12 weeks after making a false break to the topside last week.

A false break is characterised by the price moving outside the recent range before closing the session back inside it.

The 0.6785 – 0.6820 area might provide a resistance zone with several prior peaks in that region. On the downside, support may lie at the previous lows of 0.6636, 0.6574, 0.6565 and 0.6548.

The 10-, 21-, 34-, 55-, 100-, 200- and 260-day Simple Moving Averages (SMA) are all within 0.6685 and 0.6788. This clustering of SMAs could signal that a range trade environment might persist for the time being.

A definitive break above or below these SMAs may see momentum build in that direction in a potential volatility breakout.

image1.png


Gold Price Forecast: XAU/USD Faces Busy US Focused Trading Day

Gold Price Forecast: XAU/USD Faces Busy US Focused Trading Day

XAU/USD FUNDAMENTAL BACKDROP

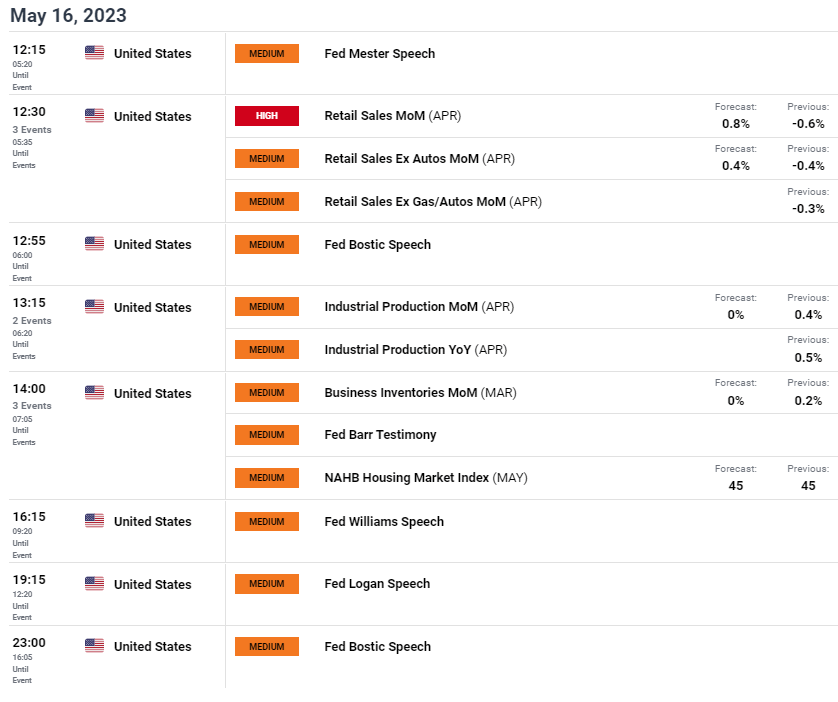
Gold prices remained relatively rangebound once again this Tuesday as markets anticipate the upcoming US debt ceiling meeting. Yesterday’s Fed officials revealed mixed views from maintaining aggressive monetary policy to becoming more vigilant and holding interest rates at current levels. Traditionally, Fed guidance has been highly respected by financial markets but of recent, this has dwindled and I believe incoming data will carry more weight for the USD and gold respectively. That being said, today holds yet more Fed speakers (see economic calendar below) throughout the trading day where we will see whether the majority favors another hike or not.

Retail sales data dominates the calendar as the only high impact event scheduled and is expected to come in higher than the March print leaving gold exposed to further downside.

ECONOMIC CALENDAR

image1.png

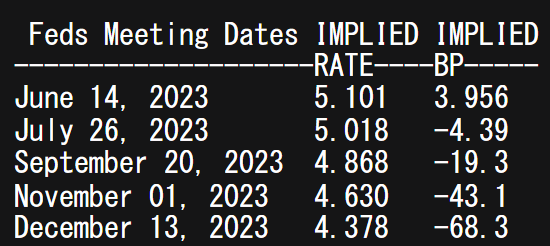
Money markets are expecting roughly 68bps of rate cuts by year end which I believe may be premature at this point. More data is needed and there is a high chance that this pricing may be revised (lesser rate cuts) and could weigh negatively on bullion.

FEDERAL RESERVE INTEREST RATE PROBABILITIES

image2.png

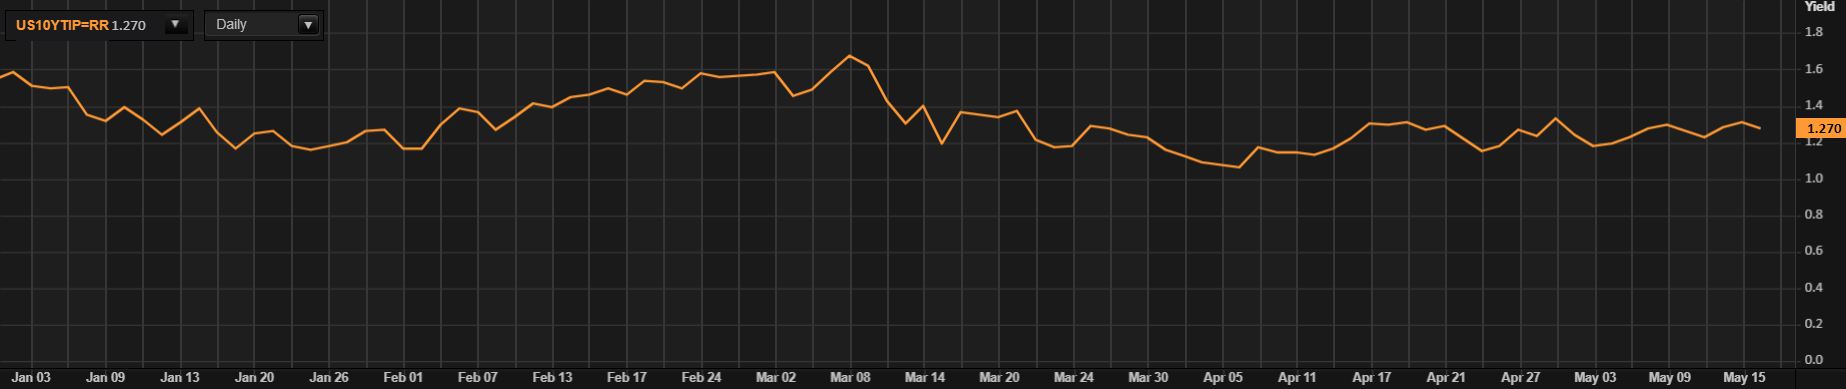
Real yields (refer to graph below) are reflective of a more cautious market and with so much uncertainty from a macro perspective, markets require direction before we see a convincing move. Real yields are highly correlated to gold prices as a higher real yield increases the opportunity cost of holding the yellow metal and vice versa.

US 10-YEAR REAL YIELDS

image3.png

TECHNICAL ANALYSIS

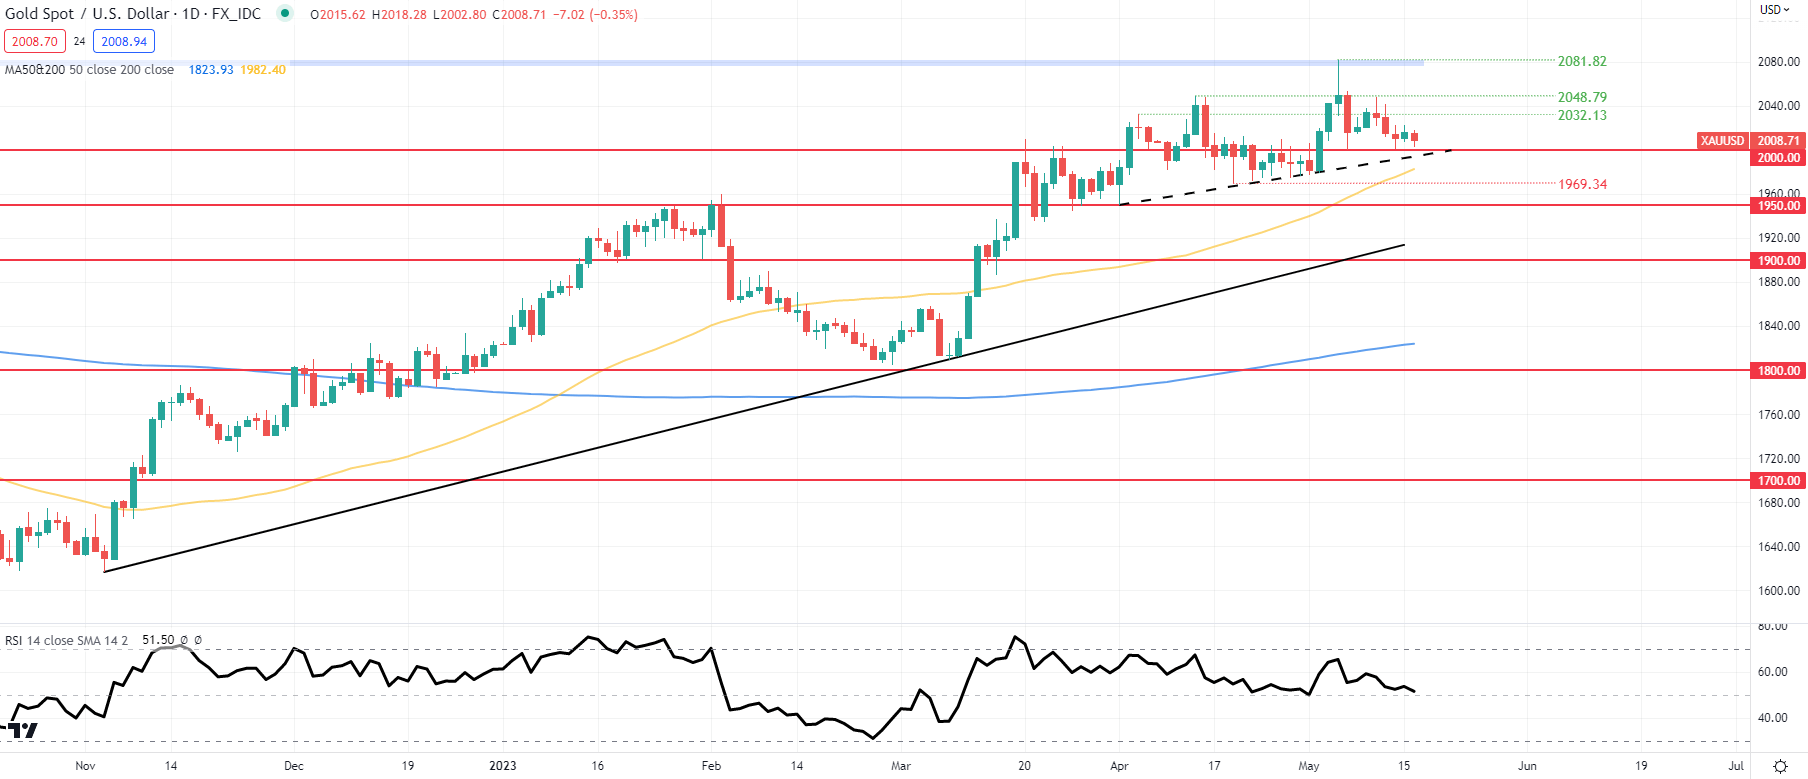
GOLD PRICE DAILY CHART

image4.png

Chart prepared by Warren Venketas, IG

Daily XAU/USD price action has been subdued lately as fundamental factors dictate. The $2000.00 psychological support handle still holds after a pullback from all-time-highs at $2081.82. As I mentioned in prior analysis, bearish/negative divergence has now gained some traction after the long upper wick on the 4th of May. The current Relative Strength Index (RSI) reading suggests no preference for bulls nor bears and reflects the aforementioned fundamental variables influencing gold prices.

Resistance levels:

  • 2081.82
  • 2048.39
  • 2032.13

Support levels:

  • 2000.00/Trendline support
  • 50-day MA (yellow)