Australian Dollar Dips on Soft China Data. Will AUD/USD Test Range Lows?

Australian Dollar Dips on Soft China Data. Will AUD/USD Test Range Lows?

The Australian Dollar dropped on doubts about the economic recovery for China after statistics revealed slowing activity.

Chinese data today saw industrial production come in at 5.6% year-over-year to the end of April against the 10.9% forecast and March’s print of 3.9%.

Retail sales for the same period were 18.4%, instead of the 21.9% expected and 10.6% previously. Fixed asset investment ex-rural and property investment also missed estimates printing at 4.7% and -6.2% respectively.

Today’s numbers come on the back of soft inflation data last week and the People’s Bank of China (PBOC) leaving the 1-year medium-term lending facility (MLF) rate unchanged yesterday at 2.75%. Although they did add CNY 25 billion of liquidity.

10-year Chinese government bond (CGB) yields continue to trade near 2.7%, the level they were at in November last year prior to Covid-19 restrictions being lifted.

AUD.USD had reclaimed 67 cents overnight on a weakening US Dollar but gave up some ground as concerns grow for Australia’s number one export destination.

Ahead of the Chinese data, RBA meeting minutes showed that the decision to raise rates at the May meeting was finely balanced and stated, “Members discussed two options: holding the cash rate unchanged or increasing the cash rate by 25 basis points.”

The case for keeping rates unchanged was based mostly on the recent deceleration in inflation. CPI was 7.0% year-on-year to the end of March, down from 7.8% at the end of December.

In the argument for hiking, it was noted that although price pressures appear to be decreasing, any reacceleration in inflation would extend the period that CPI remains above the target band of 2-3%. The bank’s current projections have this objective being met in mid-2025.

Australian jobs data will be released on Thursday and a Bloomberg survey of economists is anticipating the unemployment rate to remain unchanged at a 50-year low of 3.5%.

AUD/USD TECHNICAL ANALYSIS

AUD/USD has been in the 0.6565 – 0.6818 range for 12 weeks after making a false break to the topside last week.

A false break is characterised by the price moving outside the recent range before closing the session back inside it.

The 0.6785 – 0.6820 area might provide a resistance zone with several prior peaks in that region. On the downside, support may lie at the previous lows of 0.6636, 0.6574, 0.6565 and 0.6548.

The 10-, 21-, 34-, 55-, 100-, 200- and 260-day Simple Moving Averages (SMA) are all within 0.6685 and 0.6788. This clustering of SMAs could signal that a range trade environment might persist for the time being.

A definitive break above or below these SMAs may see momentum build in that direction in a potential volatility breakout.

image1.png

To What Extent Euro Could Fall? EUR/USD, EUR/GBP, EUR/JPY Price Setups

To What Extent Euro Could Fall? EUR/USD, EUR/GBP, EUR/JPY Price Setups

Overbought conditions, stretched positioning, and growing doubts about whether the US Federal Reserve will pause at its next meeting have triggered a pause in the euro’s rally. While the outlook differs across crosses, the retreat doesn’t suggest EUR/USD‘s uptrend is over.

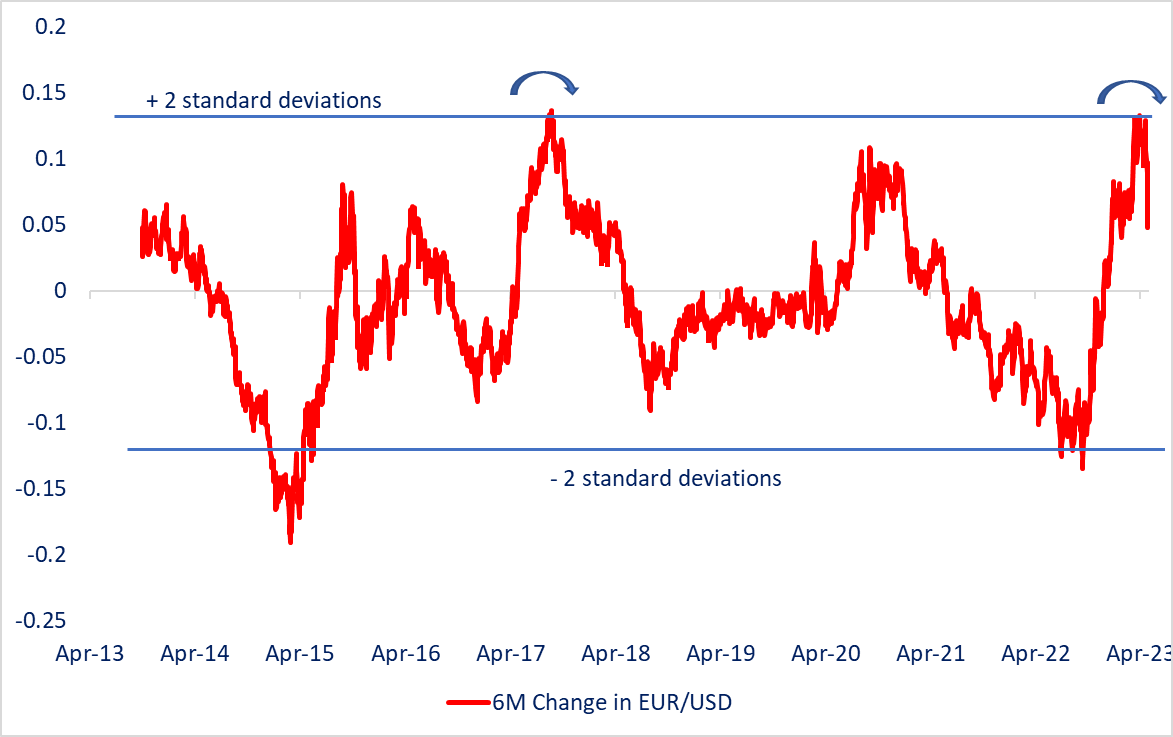
The pace of EUR/USD gains in recent months has been quite sharp – the six-month change is the highest at least since 2017. While the surge in momentum bodes well for the medium-term outlook, in the near-term chances are that the gains could slow or even reverse a bit, given the mean-reverting nature of the series (see the chart) – the drop in the pair could be a sign that this is already happening.

EUR/USD 6-Month Change

image1.png

Source Data: Bloomberg; Chart prepared in Microsoft Excel.

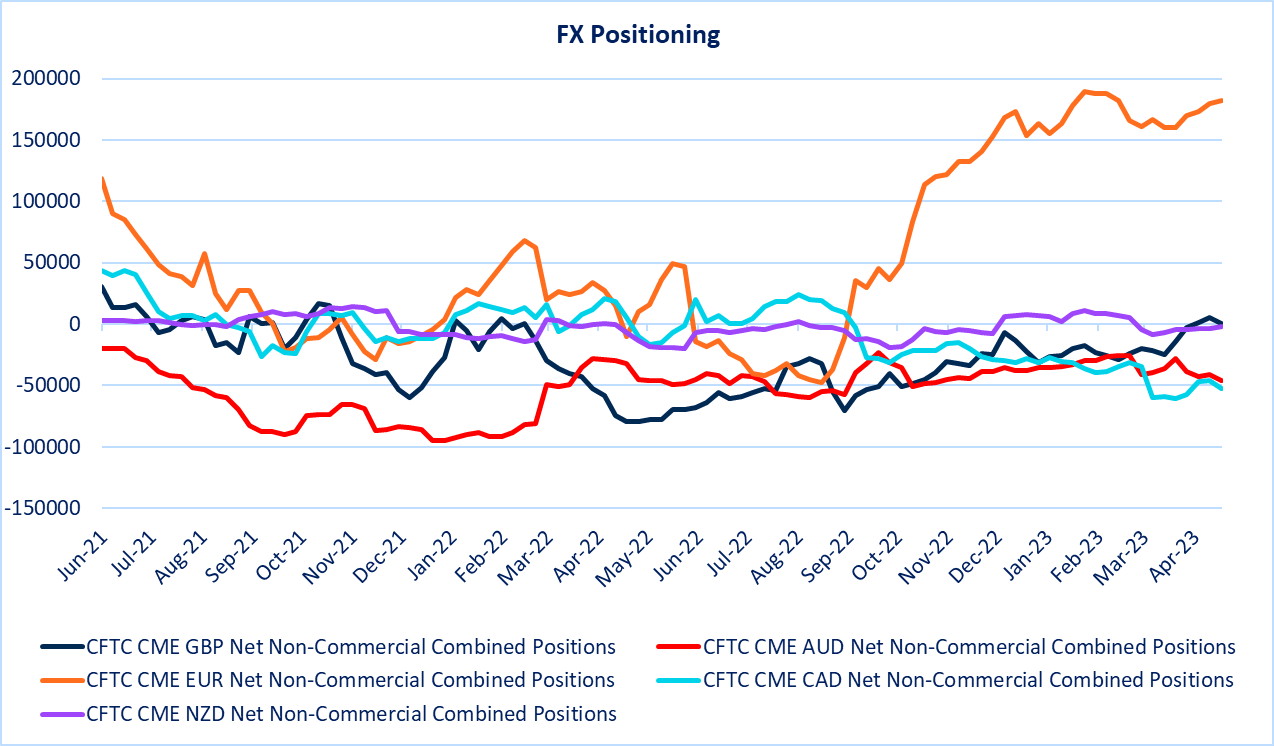
Long speculative EUR positioning has been the highest since 2020 and also within the major currency space (see chart), suggesting overcrowded conditions for the single currency.

Furthermore, Euro area macro data has underwhelmed since early February, suggesting ECB rate hikes are trickling through the economy. Data released yesterday showed Euro area industrial output fell more than expected in March as the output of capital goods dropped. The ECB maintained a hawkish stance at its last meeting earlier this month, and money markets see two more rate hikes by October.

FX Speculative Positioning

image2.png

Source Data: Bloomberg; chart prepared in Microsoft Excel.

Recent US Fed speak has tilted toward the hawkish side, leading to a reassessment of the pause priced in at the June meeting. Markets are pricing in a 20% chance of a 25 bps Fed rate hike at the June meeting up from 15% a week ago, according to the CME FedWatch tool.

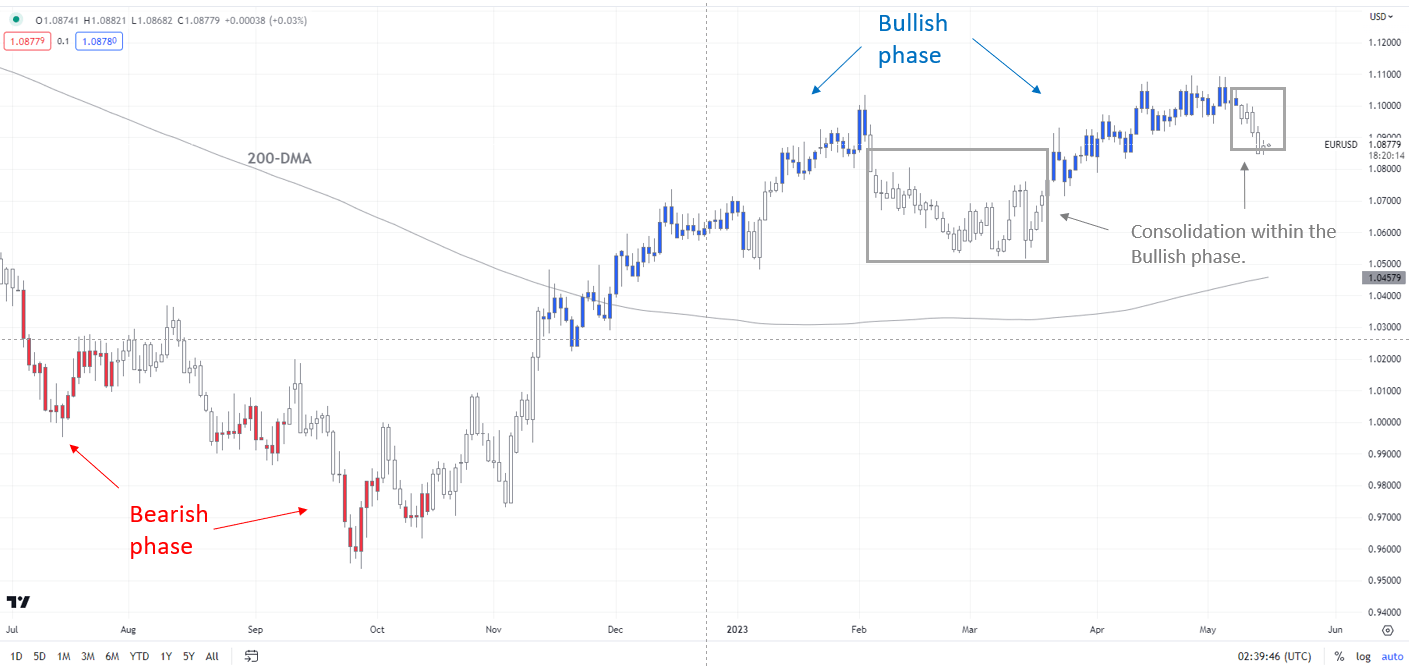
EUR/USD Daily Chart

image3.png

Chart Created by Manish Jaradi Using TradingView; Notes at the bottom of the page.

EUR/USD: A consolidation within the uptrend

As the colour-coded candlestick daily charts, based on trending/show, EUR/USD has moved to a consolidation phase recently within the broader uptrend – a risk that was highlighted in the previous update. See “Did ECB Just Put Brakes on Euro’s Rally? EUR/USD, EUR/AUD, EUR/JPY”, published May 5.

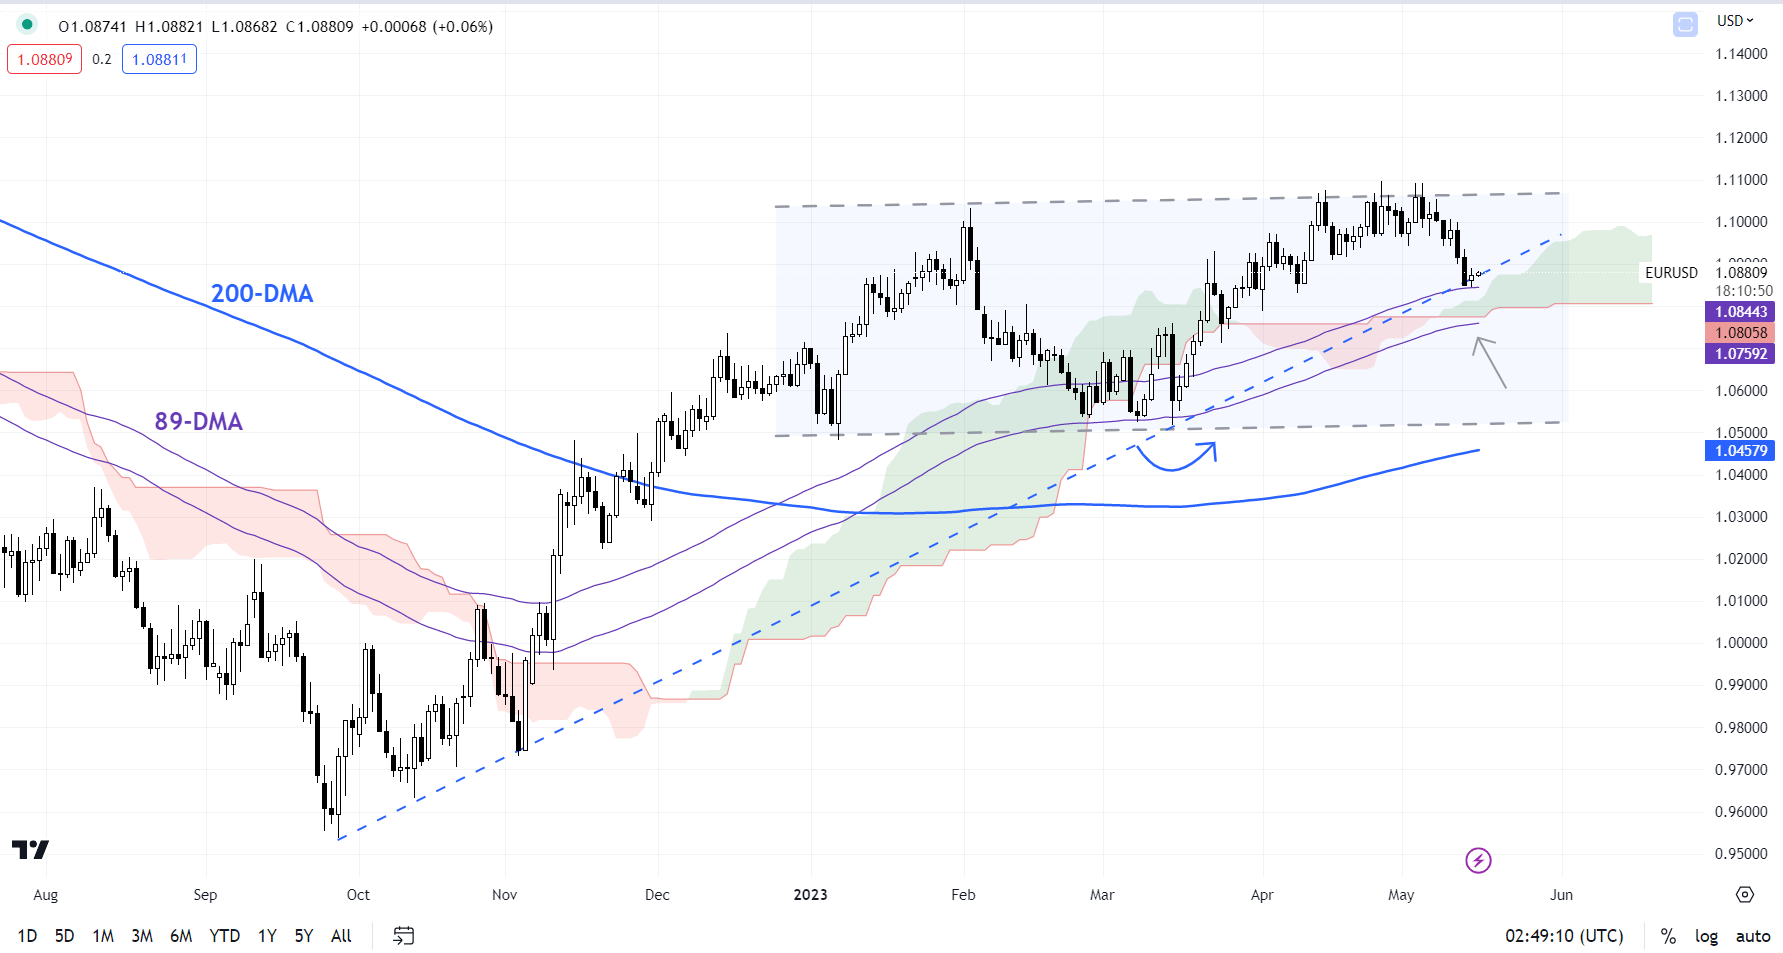
EUR/USD Daily Chart

image4.png

Chart Created by Manish Jaradi Using TradingView

EUR/USD’s break below minor support at the early-May low of 1.1000 indicates that the upward pressure has faded a bit. Still, there is fairly tough converged support on the 89-day moving average, coinciding with the lower edge of the Ichimoku cloud on the daily chart. A stronger cushion is at the March low of 1.0510.

EUR/GBP Daily Chart

image5.png

Chart Created by Manish Jaradi Using TradingView

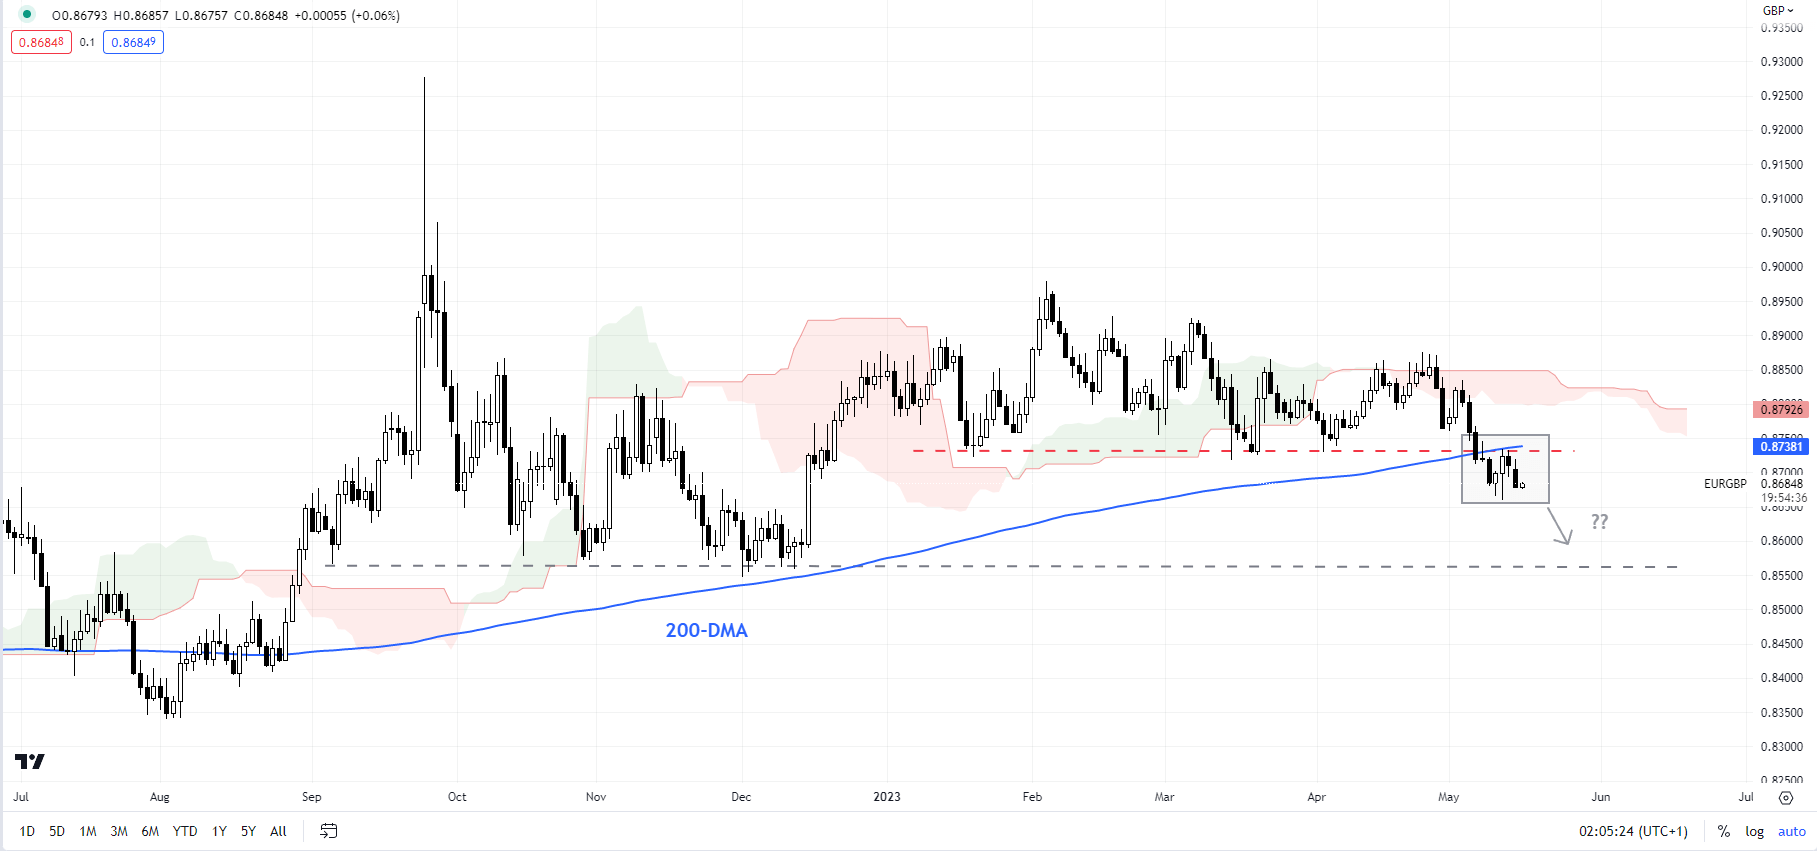
EUR/GBP: Crashes through support

EUR/GBP’s break below key horizontal trendline support at about 0.8725 has triggered a break from a multi-week sideways pattern. The break has opened the way toward the December low of 0.8545.

EUR/JPY 240-minute Chart

image6.png

Chart Created by Manish Jaradi Using TradingView

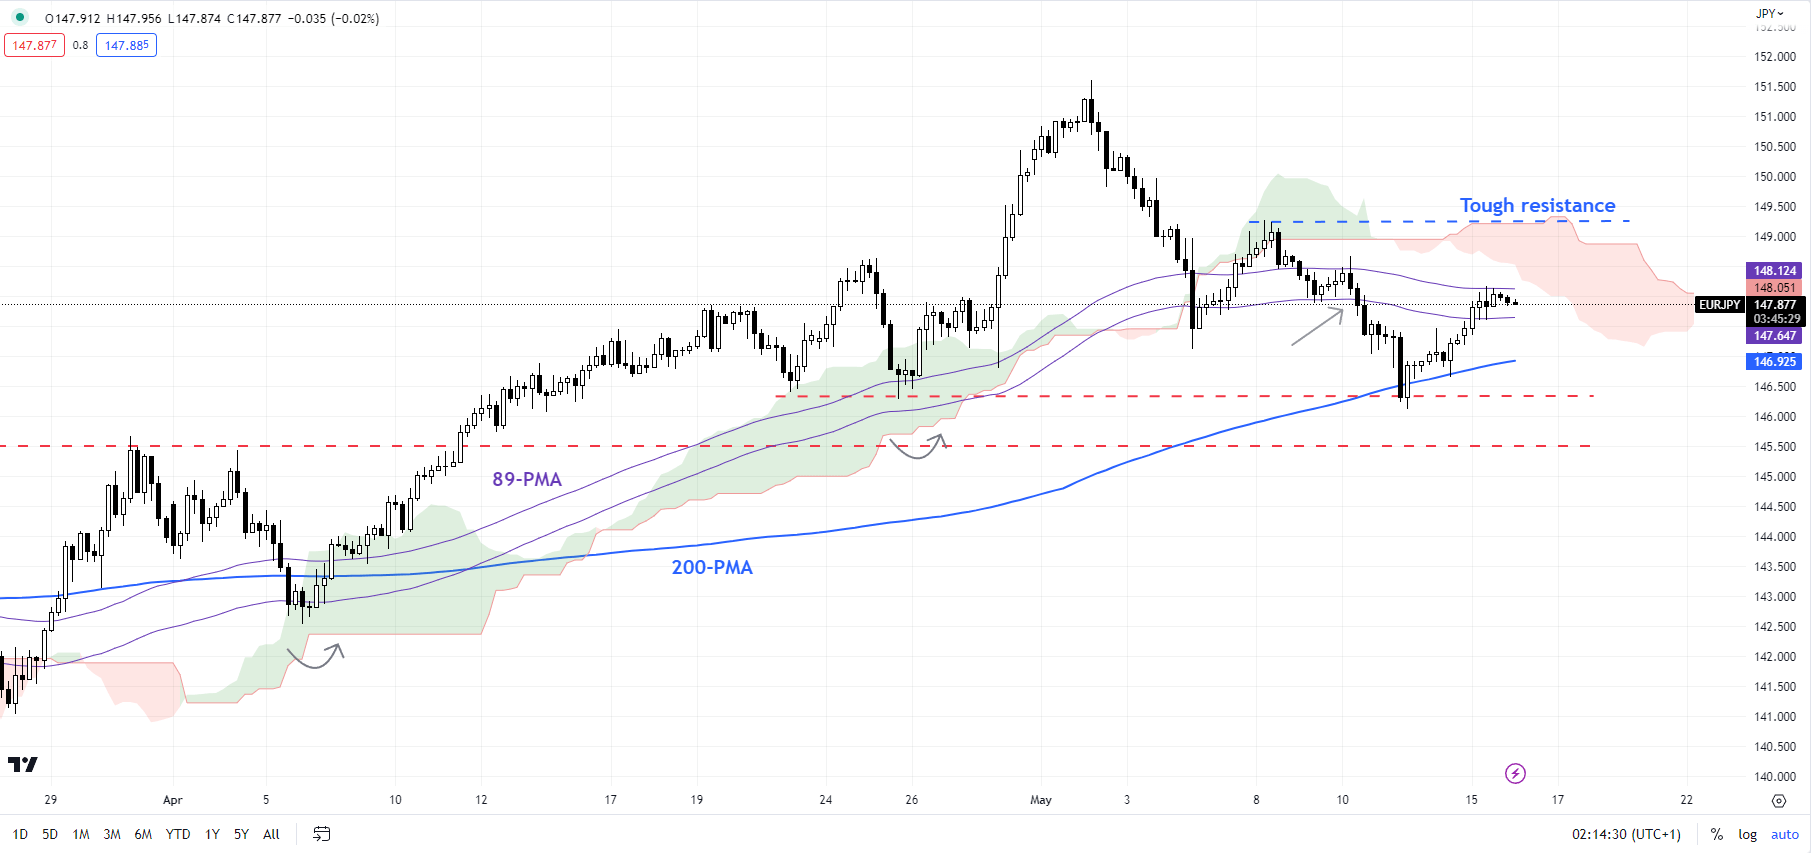
EUR/JPY: Upward pressure has faded a bit

EUR/JPY’s fall below the vital floor on the 89-period moving average and the Ichimoku cloud on the 240-minute chart confirms that the upward pressure has faded somewhat for now. A decisive break below the late-April low of 146.25 would confirm that the trend had changed from sideways to slightly down.On the upside, EUR/JPY could find it tough to crack the May 8 high of 149.25.

Note: In the above colour-coded candlestick chart, Blue candles represent a Bullish phase. Red candles represent a Bearish phase. Grey candles serve as Consolidation phases (within a Bullish or a Bearish phase), but sometimes they tend to form at the end of a trend. Note: Candle colors are not predictive – they merely state what the current trend is. Indeed, the candle color can change in the next bar. False patterns can occur around the 200-period moving average, or around a support/resistance and/or in sideways/choppy market. The author does not guarantee the accuracy of the information. Past performance is not indicative of future performance. Users of the information do so at their own risk.

Crude Oil Boosted by US SPR Buying and Defies Soft China Data. Higher WTI?

Crude Oil Boosted by US SPR Buying and Defies Soft China Data. Higher WTI?

Crude oil nudged slightly higher on Tuesday after notable gains in the North American session after it was announced 3 million barrels will be bought to replenish the depleted supplies at the Special Petroleum Reserve (SPR).

The WTI futures contract is near US$ 71.50 bbl while the Brent contract is a touch above US$ 75.50 bbl.

The rally was little impeded despite soft Chinese data revealing that the reopening from Covid-19 restrictions is yet to deliver the economic expansion that the government and the market had been hoping for.

Chinese industrial production came in at 5.6% year-over-year to the end of April against the 10.9% anticipated and 3.9% prior.

Retail sales for the same period were 18.4%, instead of the 21.9% forecast and 10.6% previously.

Fixed asset investment ex-rural and property investment also missed estimates printing at 4.7% and -6.2% respectively. There was a strong base effect across the data due to the economy being in Covid-19 lockdown restrictions at this time last year.

In the North American session, three Fed speakers gave three different perspectives. The relatively newly appointed Chicago Fed President Austan Goolsbee sounded a slightly dovish note when he said that he wasn’t keen on the last hike by the Fed.

Atlanta Federal Reserve President Raphael Bostic said that if he had to vote today, he would not change rates while Minneapolis Federal Reserve President Neel Kashkari believes that the Fed still has more work to do to bring down inflation.

In any case, Treasury yields were mostly unchanged through the short end of the curve but 10 years and beyond added less than a handful of basis points. Despite this, the US Dollar has given up some ground.

Similarly, equity markets were little fazed by the commentary, but the spotlight appears to be firmly focused on the debt ceiling issue.

House Speaker Kevin McCarthy has said that a deal is still some way off while Treasury Secretary continues to highlight the impending deadline of June 1st before the unthinkable of a US default becomes a possibility.

Amongst the uncertainty, gold continues to be seen as a potential haven, trading above US$ 2,010 an ounce. Japan’s TOPIX equity index traded at its highest level since 1990 but the rest of APAC equity indices were mixed without any major moves.

After UK jobs data and EU GDP figures, the US will see retail sales numbers and Canada will get the latest CPI readings.

WTI CRUDE OIL TECHNICAL ANALYSIS

WTI appears to be consolidating back in the range again after scoping out another run lower last week.

Resistance could be at the breakpoint of 73.93 which is just above the recent peak at 73.89. The 21-day Simple Moving Average (SMA) is just above these levels and may lend resistance. Further up, the 34- and 100-day SMAs might offer resistance, currently near 76.35.

On the downside, support might reside at the breakpoints of 66.82, 66.12 and 64.36 or further below at the prior lows of 63.64 and 62.43.

image1.png


Breaking News: UK Employment Data Mixed as Unemployment Rises, GBP/USD Slides

Breaking News: UK Employment Data Mixed as Unemployment Rises, GBP/USD Slides

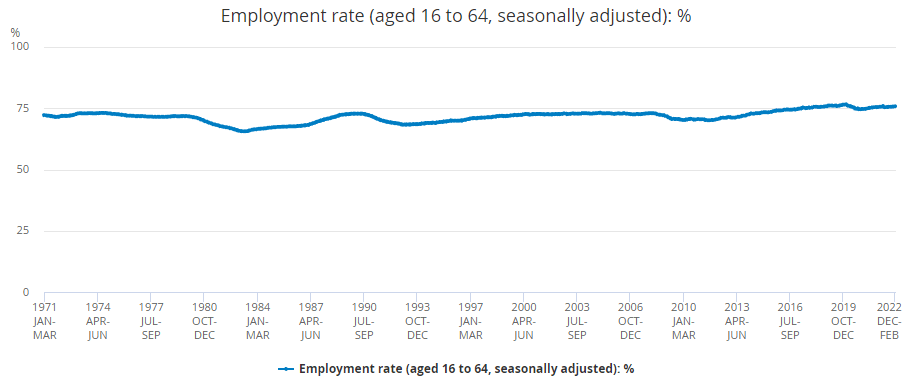
The latest labor market data out from the UK came in mixed as we had both signs of resilience and early signs of colling as the number of people working in the UK grew by 182k (3-month period to end of March 23) above the forecasted figure of 160k. The increase was largely driven by part-time employees and self-employed workers.

image1.png

Customize and filter live economic data via our DailyFX economic calendar

The unemployment rate increased 0.1% on the quarter to 3.9% which was largely attributable to people unemployed for over 12 months. This is the highest level since the November 2021 to January 2022 period. February to April 2023, the estimated number of vacancies fell by 55,000 on the quarter to 1,083,000. Vacancies fell on the quarter for the 10th consecutive period and reflect uncertainty across industries, as survey respondents continue to cite economic pressures as a factor in holding back on recruitment. The report by the ONS went further stating that the UK lost 556,000 working days to strikes in March.

Average Earnings Incl. Bonus in the UK came in at 5.8% and in line with estimates. Meanwhile average growth for the public sector came in at 5.6% in January to March 2023, such growth for the public sector was last seen in August to October 2003 (5.7%).

A picture containing text, screenshot, plot, line  Description automatically generated

UK OUTLOOK MOVING FORWARD

Looking we have had a bunch of high impact UK data over the past two weeks which have painted a rather mixed picture of the economy. Inflation remains uncomfortably high while the recently revised growth forecast from the BoE has seen some upward revisions made. However, this week’s GDP growth data showed an intriguing slowdown and contraction in GDP growth for the month of February and March respectively.

There is no denying the UK economy has remained resilience for the large part, however the recent GDP data may be cause for concern. We have seen retail sales also dip of late, a sign that that consumers continue to tighten their belts as cost of living continues to be an issue. I for one will be keeping a close eye on GDP data as it starts filtering through in Q2 and of course UK inflation.

The Bank of England (BoE) did leave the door open to further interest rate hikes. Another hike is possible but given the banks own inflation expectations it might be time for a wait and see approach. As the effects of the recent hiking cycle begin to take hold Central banks will want to ensure that overtightening does not become prevalent across the globe with the BoE no exception.

MARKET REACTION

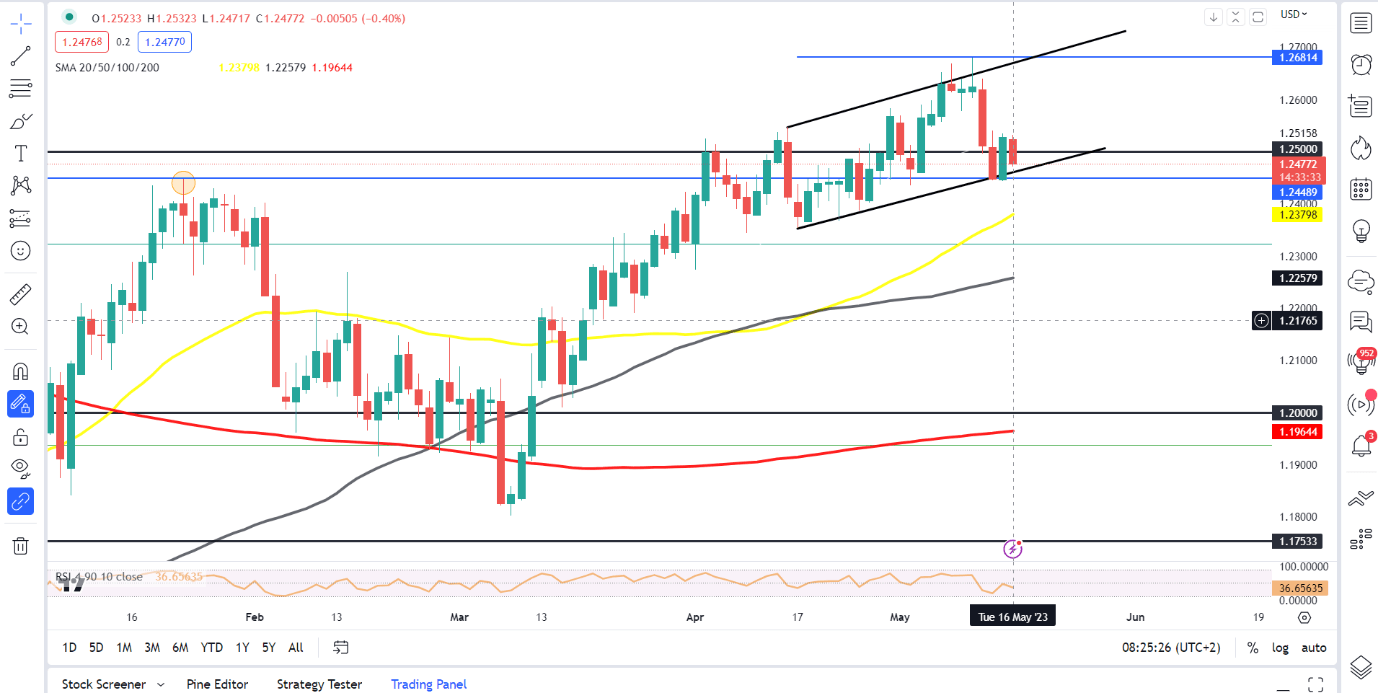
The initial market reaction following the news has seen GBPUSD decline around 50 pips, which is surprising given the recovery we saw yesterday. The strength of the slide post data release has also been helped by a slightly stronger USD this morning.

However, GBPUSD on a daily timeframe is attempting to break below the ascending channel which could open up a deeper retracement toward the support areas provided by the 50 and 100-day MAs at 1.2380 and 1.2260 respectively. Keep a close eye on developments around the US debt ceiling as that could have a significant bearing on the USD and thus GBPUSD.

GBPUSD Daily Chart, May 16, 2023

image3.png


Gold Price Latest: Waiting for the Fed’s Thoughts, $2K Currently Provides Support

Gold Price Latest: Waiting for the Fed’s Thoughts, $2K Currently Provides Support

Gold starts the week on the front foot after testing $2k support in the last couple of sessions. The precious metal continues to respect this level and with little in the way of high-impact economic data on the calendar this week, traders will look to commentary from a host of Federal Reserve speakers this week to provide some volatility. Today sees scheduled commentary from Fed members Bostic, Kashkari, Barkin, and Cook, while other board members speak throughout the week. The highlight of the week comes on Friday when Fed chair Jerome Powell is scheduled to speak at the Thomas Laubach Research Conference. According to the Fed’s website, this year’s conference will ‘highlight key issues in monetary policy and the economy and facilitate discussions on the challenges faced by monetary policymakers’.

This week’s Fed commentary will be closely followed by US Treasury traders for any clues about the central bank’s intentions going forward. According to one closely watched indicator, the Fed has finished tightening monetary policy and will start cutting interest rates at the end of the third quarter. This outlook is at odds with some of the more hawkish Fed members who continue to press their case for further rate hikes in the months ahead. The rate-sensitive US 2-year is currently trading with a yield of 4%, while the benchmark US 10-year changes hands at 3.48%.

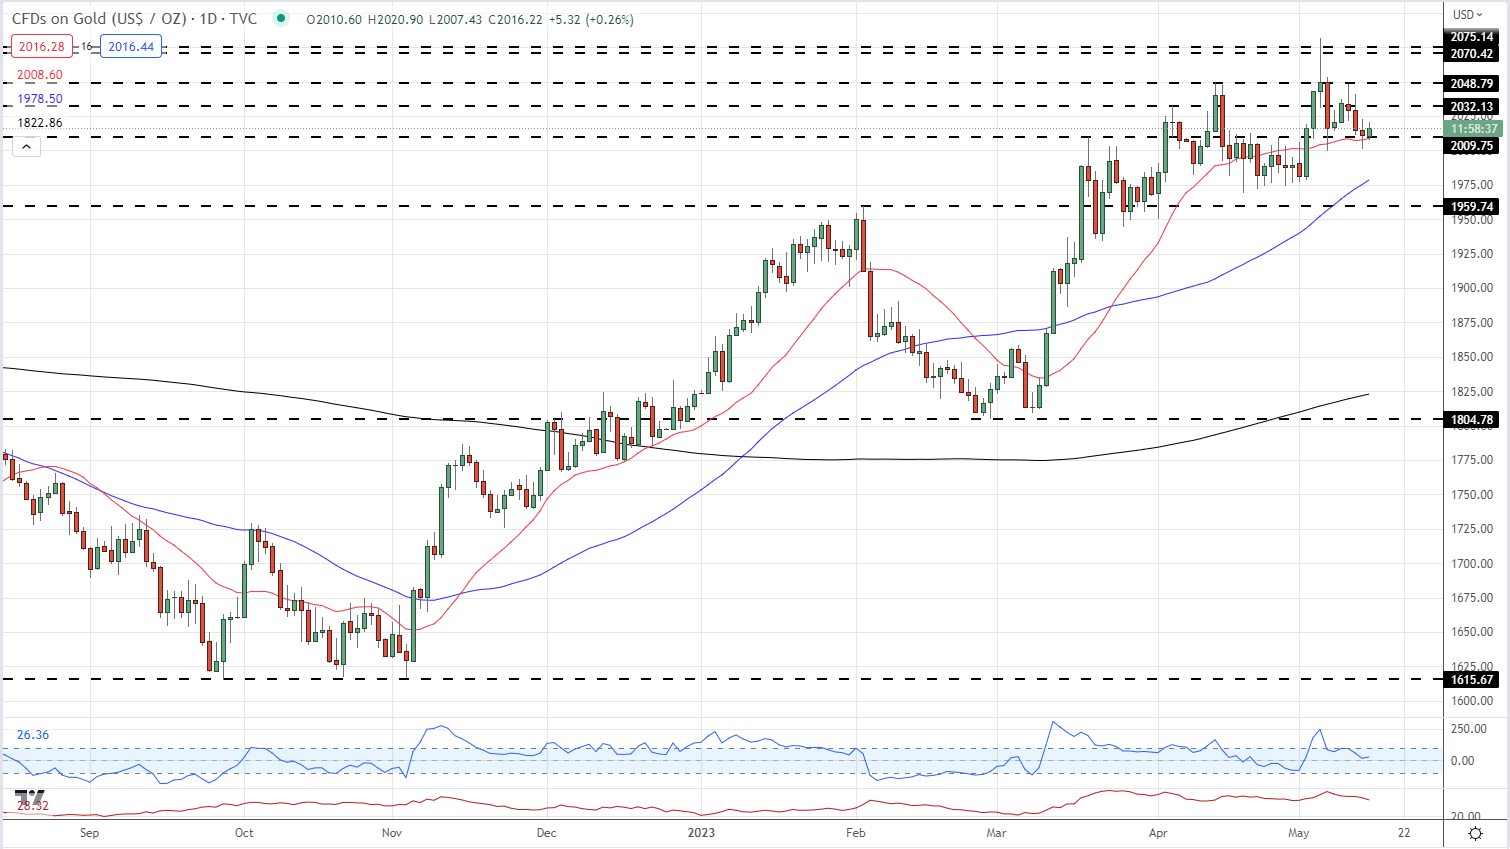
The precious metal remains bid above $2,000/oz. level and is looking to break back above Friday’s $2,022/oz. high. While support has held, a recent series of lower highs has compressed the price of gold, hinting at a breakout. Gold is being supported by the 20-day simple moving average, although this indicator remains under threat. If the 20-dma and the $2k level break then a cluster of prior lows down to $1,970/oz. should provide support.
Gold Price Daily Chart – May 15, 2023

Top 10 Candlestick Patterns To Trade the Markets

Top 10 Candlestick Patterns To Trade the Markets

Candlestick patterns are important tools in technical trading. Understanding them allows traders to interpret possible market trends and form decisions from those inferences. There are various types of candlestick patterns which can signal bullish or bearish movements. This article will briefly touch upon what candlestick patterns are and introduce the top 10 formations all traders should know to trade the markets with ease.

Try out our interactive trading quiz on forex patterns !

What are candlestick patterns?

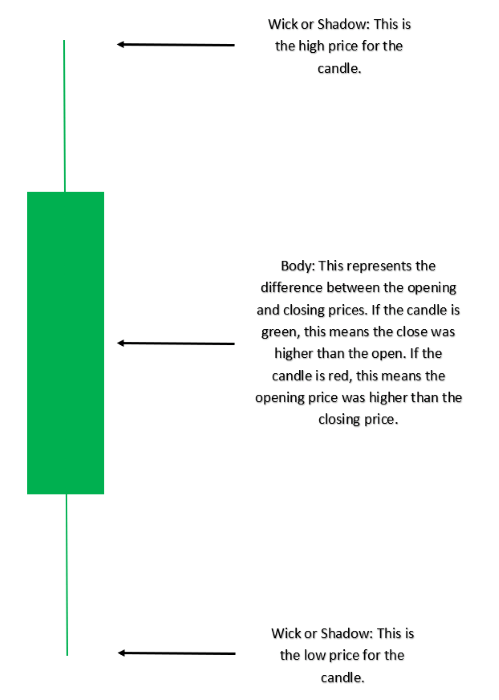
A candlestick is a single bar which represents the price movement of a particular asset for a specific time period. The information it displays includes the open, high, low and close for that time period.

candlestick pattern

Candlestick patterns take into account one or more candlesticks to assist technical traders in developing inferences about future movements and price patterns of the underlying asset. These are displayed graphically on a chart, which is utilized for market analysis. Our guide to reading candlestick charts is a great place to start to learn how to interpret candlesticks for trading.

Candlestick Patterns can be Bullish or Bearish

In order to recognize and apply the most commonly used candlestick patterns to a trading strategy, traders need to understand how the inclination of these patterns can affect the market direction (trend). The tables below summarize the two main categories of price movement that candlesticks can indicate. Many of these patterns are featured in our top 10 list below.

Bullish Candlestick Patterns:

Candlestick Pattern Direction
Morning Star Bullish (Reversal)
Bullish Engulfing Bullish (Reversal)
Doji Bullish/Bearish (Indecision)
Hammer Bullish (Reversal)
Bullish Harami Bullish (Reversal)
Piercing Pattern Bullish (Reversal)
Inside Bars Bullish (Continuation)
Long Wicks Bullish/Bearish (Reversal)

Bearish Candlestick Patterns:

Candlestick Pattern Direction
Evening Star Bearish (Reversal)
Bearish Engulfing Bearish (Reversal)
Doji Bearish/Bullish (Indecision)
Bearish Harami Bearish (Reversal)
Dark Cloud Cover Bearish (Reversal)
Inside Bars Bearish/Bullish (Continuation)
Long Wicks Bearish/Bullish (Reversal)
Shooting Star Bearish (Reversal)

Top 10 Candlestick Patterns Traders Should Know

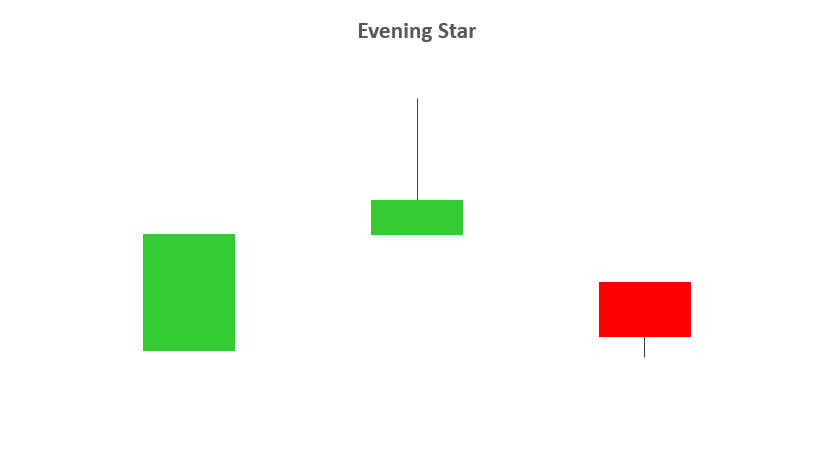
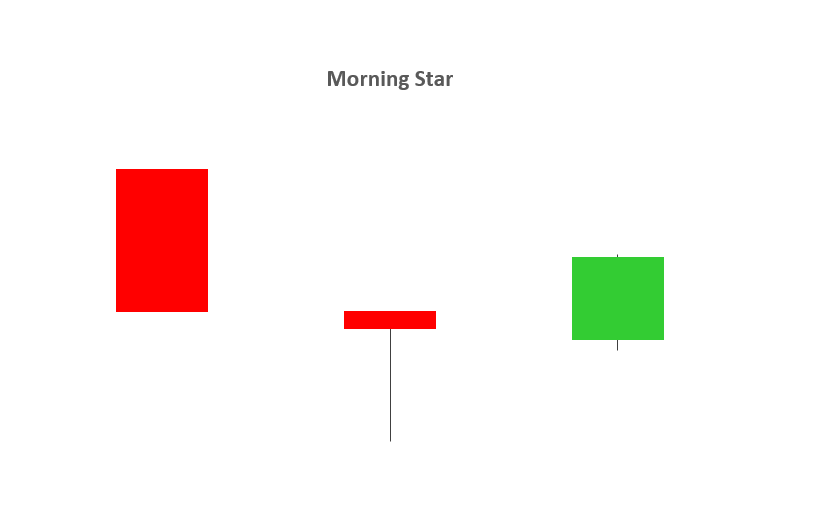
1 – EVENING STAR AND MORNING STAR

  • The evening and morning star candlestick patterns occur at the end of upwards/downward trends respectively and tend to indicate reversal patterns.
  • The names come from the star shaped formation of the arrangement.
  • As you can see from the image below, the first candlestick is in the direction of the trend, followed by a bullish or bearish candle with a small body. The third candlestick is seen in the direction of the reversal, ideally closing passed the halfway point of the first candlestick.
  • Trading this candlestick pattern will require a confirmation candle in the direction of the respective reversal – for example, traders will look for a bearish candle after the evening star.

evening star candlestickmorning star candlestick

2 – BULLISH & BEARISH ENGULFING

  • A bullish or bearish engulfing candlestick pattern may indicate reversal patterns.
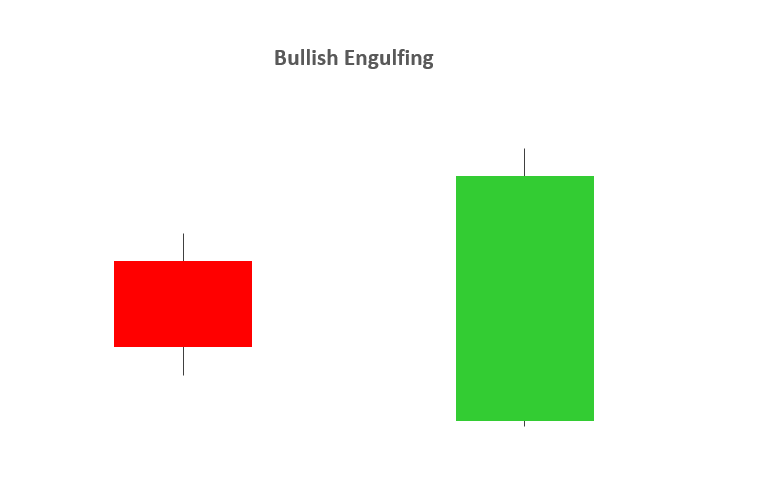
  • A bullish engulfing candlestick formation shows bulls outweigh bears. As the pattern below shows, the green body (bulls) covers completely the first candlestick (bears).
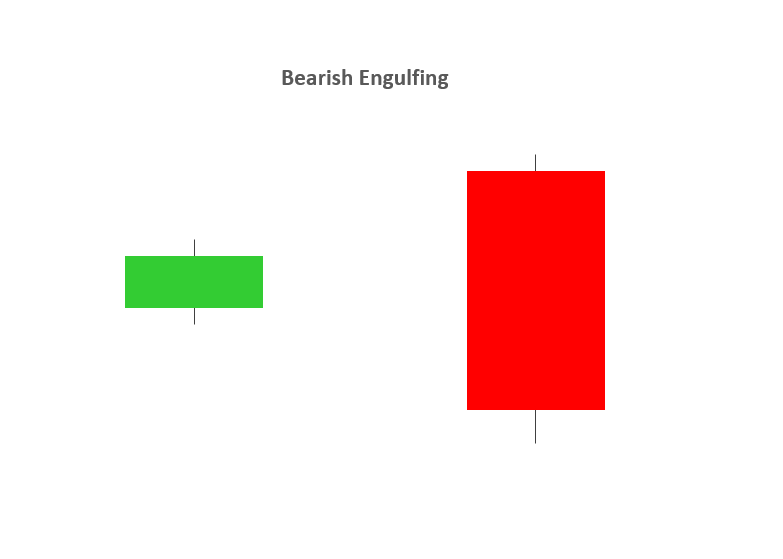
  • A bearish engulfing candlestick pattern is small green (or bullish) candle followed by a larger red (bearish) candle immersing the small green candle.

bullish engulfing candlestickbearish engulfing candlestick

3 – DOJI

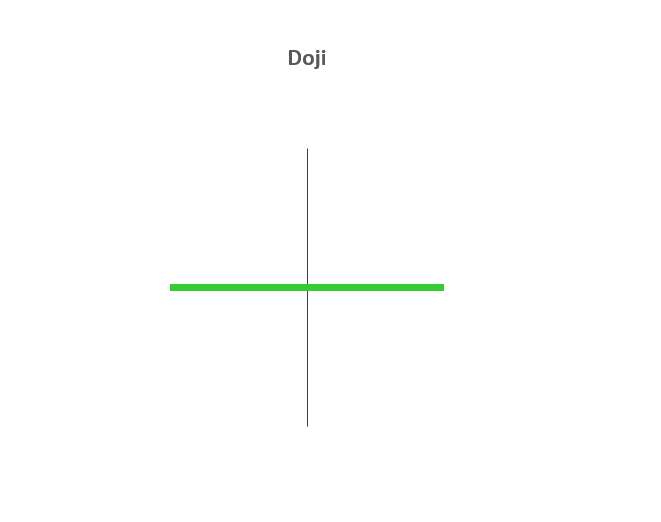
  • The Doji candlestick chart pattern is associated with indecision in the market of the underlying asset. This could mean potential reversal of the current trend or consolidation.
  • This pattern can occur at the top of an uptrend, bottom of a downtrend, or in the middle of a trend.
  • The candlestick itself has an extremely small body centered between a long upper and lower wick.

doji candlestick

4 – HAMMER

  • The Hammer candle is viewed as a bullish reversal usually occurring at the bottom of a downward trend.
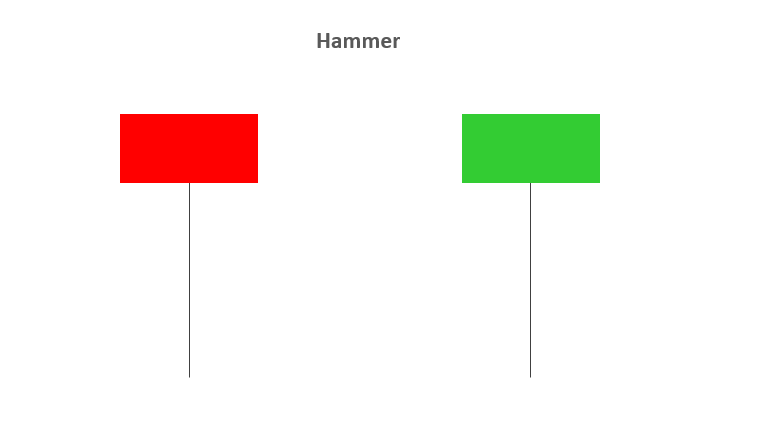
  • This candle formation includes a small body whereby the open, high, low and close are roughly the same. There is a long lower wick beneath the body which should be more than twice the length of the candle body. The body may be bullish or bearish, however bullish is considered more favorable.

hammer candlestick

5 – BULLISH & BEARISH HARAMI

  • A Bullish or Bearish Harami may indicate reversal patterns.
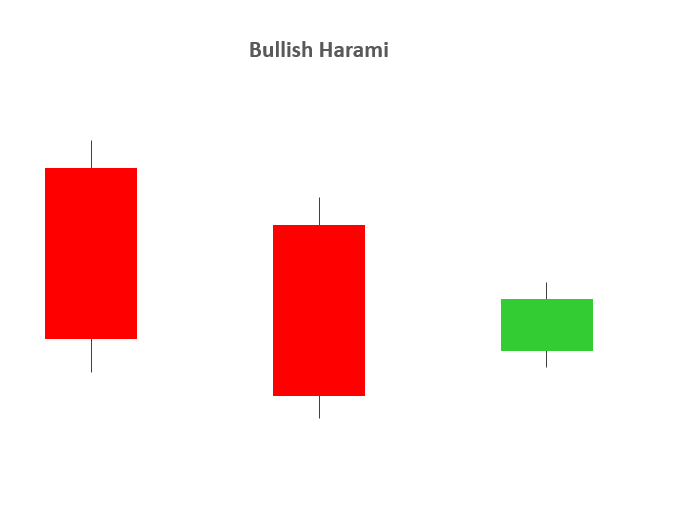
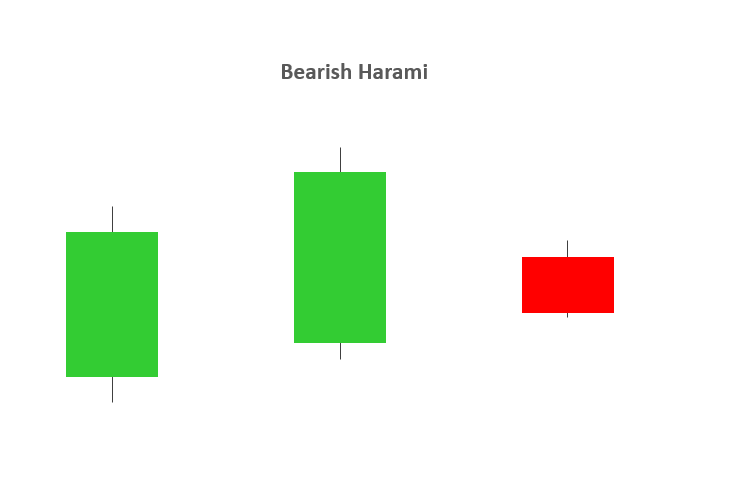
  • The word “Harami” means “pregnant” in Japanese, and the name has been given to this candlestick pattern because it resembles a pregnant woman. The second candle in the pattern must be contained within the body of the first candle as seen in the images below. This holds true for both bullish and bearish Harami’s.
  • A downtrend precedes a bullish Harami and an uptrend precedes that of a bearish Harami.

bullish harami candlestickbearish harami candlestick

6 – DARK CLOUD COVER

  • The Dark Cloud Cover pattern is seen as a bearish reversal pattern.
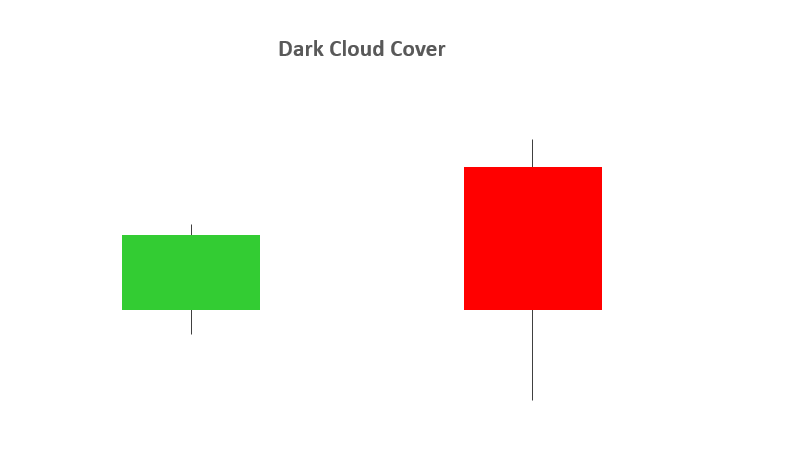
  • This candlestick pattern must occur during an uptrend. As seen in the image below, the bullish candle is followed by a bearish candle.
  • This bearish candle must confirm certain criteria to validate the Dark Cloud Cover pattern:

1. The opening price must by higher than the previous days close.

2. The closing price must close below the midpoint of the previous bullish candle.

  • The Dark Cloud Cover pattern looks similar to that of the Bearish Engulfing pattern. The difference between the two relates to the second candlestick. Bearish Engulfing pattern has the second candlestick opening above the close of the first, whilst the Dark Cloud Cover opens above the high of the first candle and closes below the midpoint of the first candlestick body.

dark cloud cover candlestick

7 – PIERCING PATTERN

  • The Piercing Pattern is viewed as a bullish candlestick reversal pattern, at the end of a downtrend or during a pullback within an uptrend, or at the support.
  • There are two components of a Piercing Pattern formation:

1. Bearish candle

2. Bullish candle

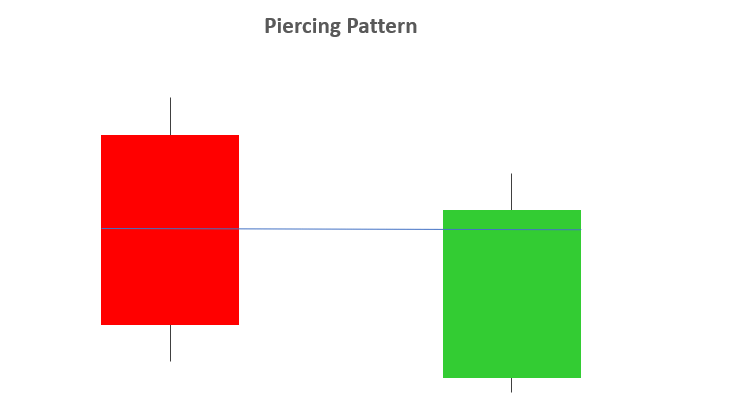
  • A Piercing Pattern occurs when a bullish candle (second) closes above the middle of bearish candle (first) in a downward trending market.
  • The open price of the second candle should gap down at market open and ensue by closing above the mid-point of the previous candle as indicated below.
  • Both the Piercing and Dark Cloud Cover patterns have similar characteristics. The difference is that the piercing line is a bullish reversal pattern as mentioned above, whilst the Dark Cloud Cover pattern is a bearish reversal pattern.

piercing pattern

8 – INSIDE BARS

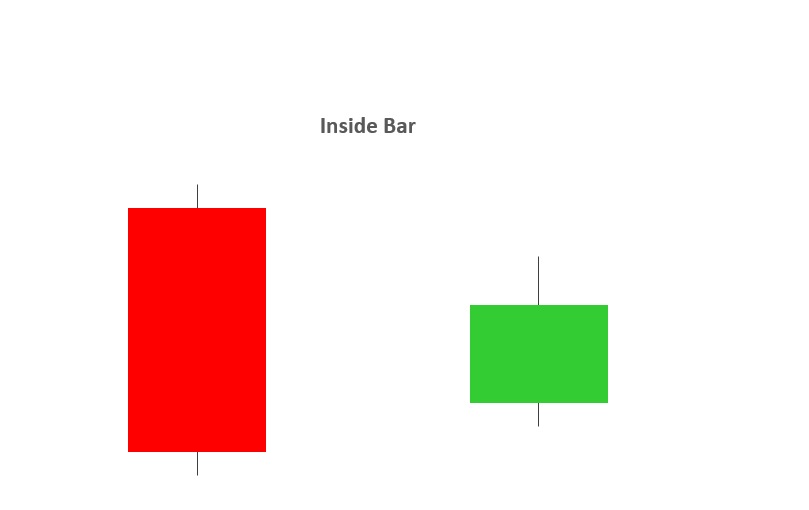
  • The Inside Bar pattern is utilized in trending markets whereby the high and low of the Inside bar is within the parameters of the previous candle or “mother bar”.
  • Inside Bars are traded within the direction of the trend – if the market is in a downtrend, the trader would look to continue with a short position with the presence of an Inside Bar. The same principal is applied in an uptrend.
  • Trading in the direction of the trend is not always a given as key levels of support/resistance can indicate a reversal. Classically, the entry points for traders is positioned above or below the high or low of the mother bar depending on the direction of the trade.
  • An inside bar is also similar to a bullish or a bearish harami candlestick pattern. The main difference being that with an inside bar, the highs and lows are considered while the real body is ignored.

inside bar candlestick

9 – LONG WICKS

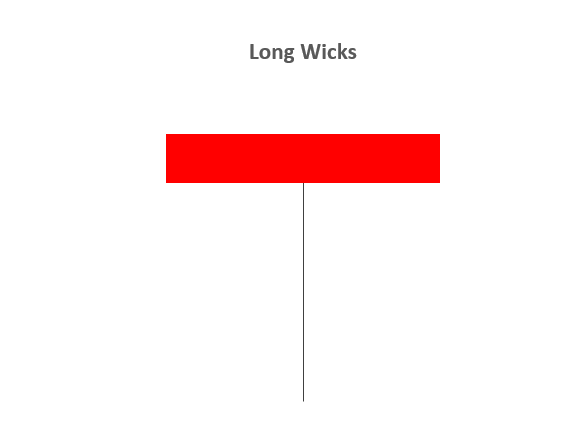
  • Long Wicks candlestick patterns often indicate a reversal in the trend.
  • Long Wicks occur when prices are tested and then rejected. The wick indicates rejected prices.
  • Identifying the trend is important to interpret the significance of the Long Wick.
  • Identifying key levels and price action is often used in conjunction with Long Wick patterns.

long wicks candlestick

10 – SHOOTING STAR

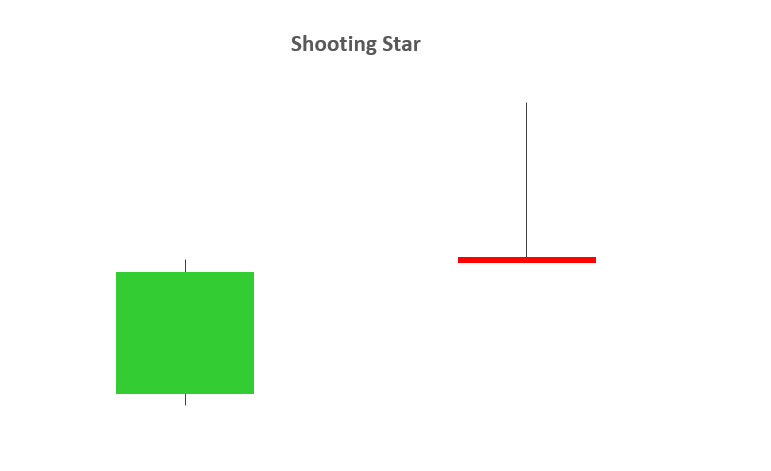
  • A Shooting Star is a bearish candle with a long upper wick, little or no lower wick and a small real body near the day’s low. It comes after an uptrend, and potentially indicates a trend reversal to the downside.
  • The distance between the high and opening price of the candle must be more than twice as large as the Shooting Star’s body. The distance between the lowest price for the day and the closing price must be very small or nonexistent.

shooting star candlestick

GBP/USD Price Forecast: Pound Fixated on US Factors

GBP/USD Price Forecast: Pound Fixated on US Factors

GBPUSD FUNDAMENTAL BACKDROP

The British pound carved out some marginal gains this Monday morning after positivity around the US debt ceiling emerged. There has been a tentative meeting scheduled for tomorrow with participants including President Joe Biden and House Speaker Kevin McCarthy to negotiate around avoiding a default. The President commented further stating that he believes a deal could be reached stoking risk sentiment with investors now marginally moving away from the safe haven USD. That being said, until markets receive more clarity around the situation, the greenback will remain the preferred currency against the pound.

Last week’s Bank of England (BoE) meeting expectedly raised interest rates by 25bps but money market pricing (see table below) showed a stark downward revision of upcoming rate hikes to a roughly 40bps from 70bps peak pre-announcement. The 40bps current view may be overenthusiastic as recessionary fears gain traction as well as the BoE’s inflation forecast suggesting lower inflation in the UK even at current rates. The aggressive monetary policy stance thus far should be sufficiently restrictive for the UK economy as signs of economic slowdown are starting to appear.

BANK OF ENGLAND INTEREST RATE PROBABILITIES

image1.png

Source: Refinitiv

Fed speakers will dominate the calendar today following on from officials last week who were less hawkish relative to prior commentary. Talks of data dependency and bank stress were mentioned but overall the preference remained restrictive. Fed speakers today (see below) could stoke some volatility for cable in what is a comparatively quiet day from an economic perspective.

ECONOMIC CALENDAR

image2.png

Source: DailyFX Economic Calendar

Foundational Trading Knowledge

Macro Fundamentals

Recommended by Warren Venketas

Start Course

TECHNICAL ANALYSIS

GBP/USD DAILY CHART

image3.png

Chart prepared by Warren Venketas, IG

Daily GBP/USD price action saw the 1.2500 handle (now resistance) being breached with 1.2400 not far off. The Relative Strength Index (RSI) fell to cautious levels favoring neither bullish nor bearish momentum short-term – this reflects the uncertain external environment influencing the pair.

EUR/USD: Break below 1.0800/1.00730 to hasten a retracement toward 1.05 – SocGen

EUR/USD: Break below 1.0800/1.00730 to hasten a retracement toward 1.05 – SocGen

The Euro retreated to the bottom spot in the G10 table after the marked selling on Friday. Economists at Société Générale expect EUR/USD to plummet toward 1.05  on a break under 1.0800/1.0730.

Profit-taking looks tactical

“The realignment of EUR/USD with bond spreads has run its course and hedge funds maintain their long position last week at 22.5% of OI, so the profit-taking looks tactical and does not suggest a more fundamental shift is afoot.”

“We can’t ignore the jeopardy of a deeper pullback of course, especially if US retail sales come in strong tomorrow.”

“Confluence of 100-DMA and the trendline going back to September 2022 near 1.0800/1.0730 is crucial support zone. A break would hasten a retracement towards 1.05.”

AUD/USD clings to gains near daily peak, just below 0.6700 amid modest USD downtick

AUD/USD clings to gains near daily peak, just below 0.6700 amid modest USD downtick

The AUD/USD pair regains positive traction on the first day of a new week and recovers a major part of Friday’s losses to a one-and-half-week low. Spot prices stick to strong intraday gains just below the 0.6700 mark through the first half of the European session and for now, seem to have stalled last week’s retracement slide from the highest level since February 24.

The US Dollar (USD) struggles to capitalize on its strong gains recorded over the past two days and eases from its highest level since early April touched this Monday, which, in turn, prompts some short-covering around the AUD/USD pair. A generally positive tone around the equity markets is seen undermining the safe-haven Greenback and benefitting the risk-sensitive Aussie. That said, any meaningful downside for the USD seems elusive amid reviving bets that the Federal Reserve (Fed) might stick to its hawkish stance in the wake of a rise in the US long-term inflation expectations.

In fact, the preliminary May reading from the University of Michigan released on Friday showed that consumers see prices over the next five years climbing at an annual rate of 3.2%  – the highest since 2011. This could force the Federal Reserve (Fed) to keep interest rates higher for longer, which continues to act as a tailwind for the US Treasury bond yields and supports prospects for the emergence of some USD dip-buying. This, along with worries about an imminent recession, could keep a lid on any optimism in the markets and contribute to capping the upside for the AUD/USD pair.

That said, the RBA’s hawkish outlook, indicating that some further tightening of monetary policy may be required to ensure that inflation returns to target in a reasonable timeframe, warrants caution for bearish traders. Moving ahead, the US economic docket, featuring the release of the Empire State Manufacturing Index, along with a scheduled speech by Minneapolis Fed President Neel Kashkari, might influence the USD price dynamics. Apart from this, the broader market risk sentiment might further contribute to producing short-term trading opportunities around the AUD/USD pair.