08166635848

Australian Dollar Skipped a Beat After Soft China CPI and PPI. Higher AUD/USD?

Australian Dollar Skipped a Beat After Soft China CPI and PPI. Higher AUD/USD?

The Australian Dollar briefly bumped up a touch after Chinese CPI came in at 0.1% year-over-year to the end of April against the 0.3% forecast and March’s print of 0.7%. PPI came in at -3.6%, instead of the -3.3% expected and -2.5% previously.

The data has led to speculation that the People’s Bank of China might bring forward plans to stimulate the economy. The post-pandemic re-opening has not delivered the boost to China’s economic activity that the government and the market had been looking for.

Last week saw a few mid-tier financial firms lower deposit rates and that has led to speculation that lending rates might also be moving south. It’s possible that the PBOC might be looking for a clearly marked Fed pause before cutting rates to ignite the economy

Chinese government bond (CGB) yields have been slipping across the curve. The 10-year bond dipped under 2.7% today for the first time since November last year.

China is a destination for many Australian exports and any stimulus measures that boost the Middle Kingdom’s economy could pave the way for a further lift to Australia’s trade balance, which is already running at record levels

Demand for industrial metals such as iron ore and copper may increase if China’s economy returns to robust growth levels.

Market sentiment had already been assisted by hopes of a less hawkish Federal Reserve after US inflation gauges also eased slightly overnight.

Headline CPI was 4.9% year-on-year to the end of April instead of the 5.0% estimated, and it appears to have emboldened the interest rate market to reinforce its view that the Fed will be cutting its target rate later this year.

Treasury yields also fell across the curve with the largest moves seen in the 1 to 5-year part of the curve. The US Dollar lost ground in the aftermath and is struggling to recover so far today.

If the central banks of the world’s 2 largest economies take a dovish tilt, the outlook for global growth might improve to some degree. The Aussie Dollar has historically been sensitive to sways in such notions.

AUD/USD has been in a 0.6565 – 0.6818 range for 11 weeks and a definitive break to the topside could see bullish momentum evolve.

AUD/USD, GOLD, COPPER, IRON ORE, DXY (USD) INDEX

image1.png


Psychological Levels & Round Numbers in Forex Trading

Psychological Levels & Round Numbers in Forex Trading

What are psychological levels and how do they work?

Psychological levels are market price levels which are often key levels in forex denoted by round numbers. These round numbers frequently act as levels of support and/or resistance.

Psychological support and resistance consistently work because of fundamental human disposition. Human beings value simplicity; from a trading perspective this means valuing whole numbers. Traders often use these numbers as entry, exit or stop levels. These stops and limits can alter order flow and price changes.

psychological levels in forex trading

Identifying psychological levels on forex charts

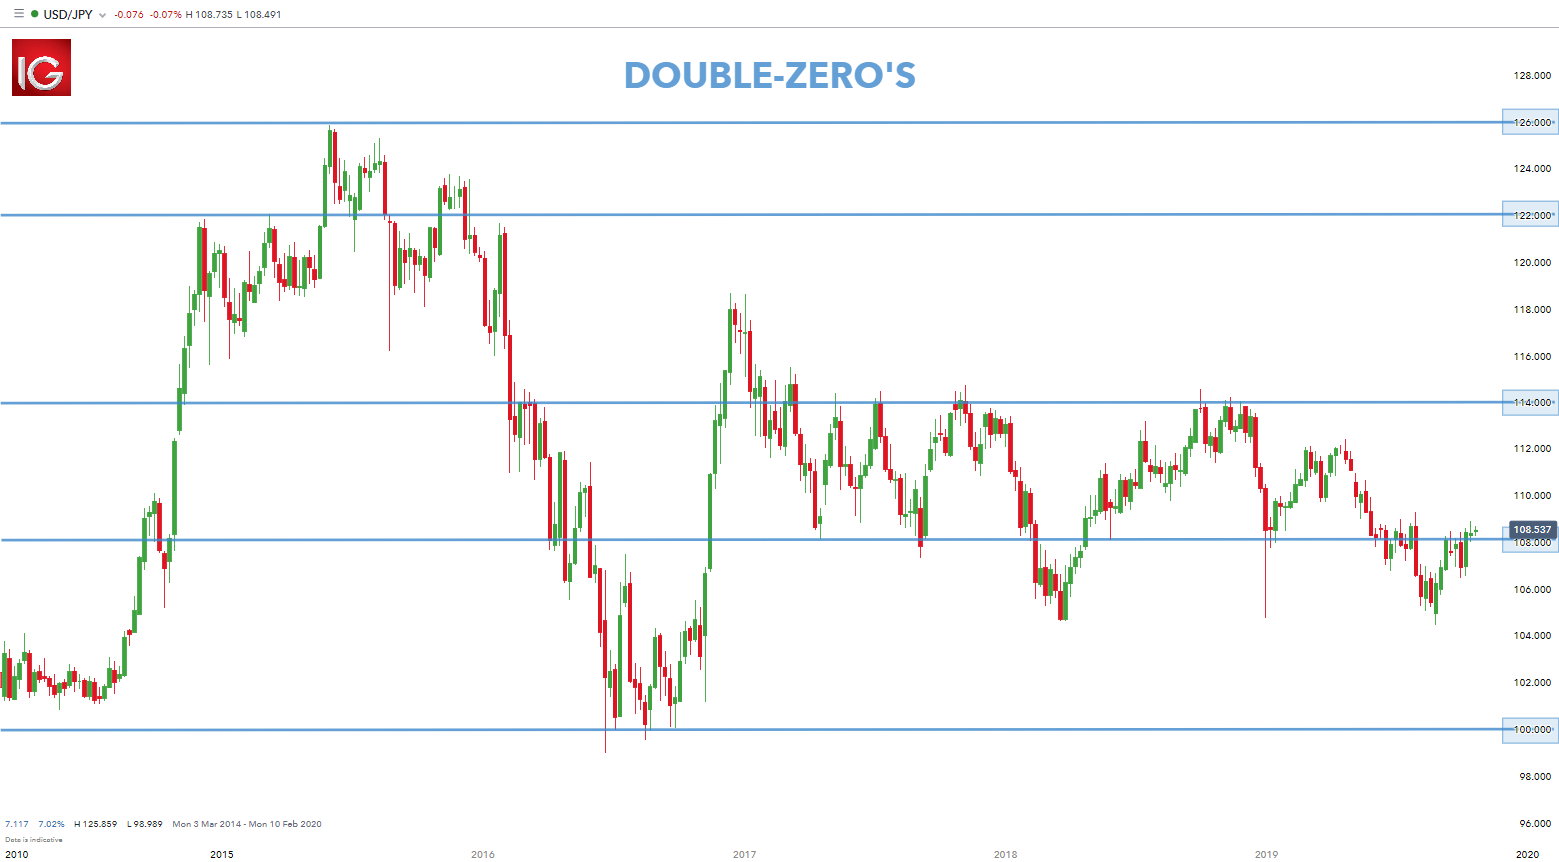
Traders will often call these whole number intervals ‘double-zeros,’ as these prices are at even numbers such as 1.31000 on EUR/USD, 1.57000 on GBP/USD or 132.00 on GBP/JPY. The chart below identifies the ‘double-zeros’ on the current USD/JPY chart.

psychological levels double-zero round numbers on USD/JPY chart

Some traders will take this a step further by looking at the number directly in the middle of these whole numbers or ‘the fifties.’ These levels, such as 1.31500 on EUR/USD or 131.50 on GBP/JPY can often come into play in the same manner as the ‘double-zeros.’

Traders will notice that there will often be some element of congestion at these key levels in forex as prices move up or down. The chart below illustrates USD/ZAR with ‘fifties’ denoted.

psychological levels the fifties USD/ZAR

Notice that many of the price swings on the above chart take place around one of these levels. Therefore, traders want to incorporate these levels into the support and resistance revisions. The chart below represents the initial USD/JPY chart with identified swing levels.

price swings at psychological levels

Consequently, these prices act as a psychological line which work well as support and resistance. Not every one of these prices act as a function of support or resistance, but enough do that these levels warrant the trader’s attention.

How to use psychological levels in forex trading

AUD/JPY weekly chart

forex inflection points

On the AUD/JPY chart above there are six strong inflections off the 75.00 price level. Each time price approached 75.00, the currency pair bounced back up. This is because:

  1. Traders saw the price of 75.00 and believed this is cheap which prompted long AUD trades off this level.
  2. As traders were opening short positions, profit targets were set at an even 75.00. This profit target order to close positions created demand in the market (traders were buying to cover, and this buying interest is considered ‘demand’).

After the first inflection, traders may not have been extremely bullish on the prospect of pushing price much lower than 75.000 as this price has already been exhibited as support.

In many ways, untested ‘psychological’ levels can be looked at like pivot points. An area where there maybe some element of support or resistance.

In general, round numbers such as 70.000 on AUD/JPY or 1.0000 on AUD/USD will garner more attention than a more pedestrian level like 71.000 on AUD/JPY. Most traders will often assign a higher degree of strength to the more rounded-intervals.

Where traders can really find value with these levels is when prices may have resisted or been supported there in the past. This tells the trader that others are noticing and acting on those prices, and the potential for the ‘self-fulfilling prophecy’ of technical analysis may potentially be considered with more strength.

Advantages and limitations of psychological levels

Key levels in forex should be assessed in line with the current trend and whether there is secondary technical suggestions in favor of the trade. Below are the advantages and limitations of psychological levels:

US Dollar Vulnerable Ahead of BoE Rate Call and ECB Speakers. Higher EUR/USD?

US Dollar Vulnerable Ahead of BoE Rate Call and ECB Speakers. Higher EUR/USD?

The US Dollar slid lower overnight after headline CPI printed at 4.9% year-on-year to the end of April instead of the 5.0% estimated and prior. Core CPI was in line with forecasts for the same period, coming in at 5.6%.

Rates markets have doubled down on bets that the Fed will be cutting its target rate by the end of the year. Futures and overnight index swaps (OIS) markets see almost 25 basis points (bp) shaved off monetary policy at the September Federal Open Market Committee (FOMC) meeting.

Treasury yields are lower across the yield curve from this time yesterday with the benchmark 2-year bond near 3.90%. It should be noted though that yields at all tenors are still comfortably above where they were in March post the collapse of SVB Financial.

US Treasury Secretary Janet Yellen spoke at the G-7 Finance Ministers meeting in Tokyo today. She reiterated many of her recent comments around the importance of solving the US debt ceiling issue,

China’s inflation read was also soft today with headline CPI coming in at 0.1% year-over-year to the end of April against the estimate of 0.3% in March’s print of 0.7%. PPI came in at -3.6%, instead of the -3.3% forecast and -2.5% previously.

Chinese government bond (CGB) yields dipped with the 10-year note submerging below 2.7% today for the first time since November last year. There are also market hopes for more dovishness from the People’s Bank of China (PBOC) and the back of easing price pressures.

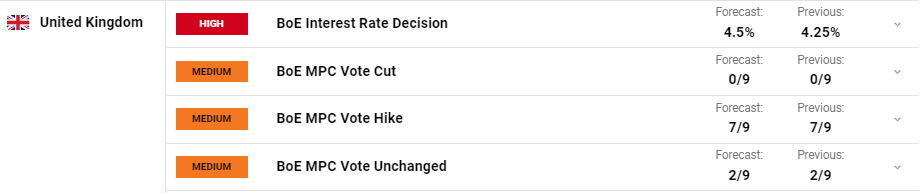
GBP/USD continues to linger near the 12-month high of 1.2680 seen yesterday with the Bank of England (BoE) rate decision today. A Bloomberg survey of economists is forecasting a 25 bp lift to 4.50%.

Japan’s current account surplus was abeat at ¥ 2,947 billion for March rather than the ¥ 2,278 anticipated. USD/JPY is little changed neat 134.25 at the time of going to print.

Gold and crude oil have eked out small gains so far today on the weak USD and APAC equity indices have seen a fairly stagnant day of trading.

A plethora of ECB speakers will be crossing the wires as well as the Fed’s Kashkari and Waller.

EUR/USD TECHNICAL ANALYSIS

EUR/USD appears to be precariously placed just above several potential support levels.

The 1.0910 – 1.0945 area has many breakpoints and prior lows as well as an ascending trend line. A clean break below this zone might see bearish momentum unfold.

If a sharp move below there were to evolve soon, the price would also go below the lower band of the 21-day simple moving average (SMA) based Bollinger Band. This might indicate a volatility breakout.

On the topside, resistance might be offered at the previous peaks in the 1.1075 – 1.1100 area.

image1.png


Traders bet on end to Fed rate hikes after April US inflation data

Traders bet on end to Fed rate hikes after April US inflation data

-An April inflation reading on Wednesday that was more benign than expected disrupted the modest momentum that had been building for an 11th straight U.S. interest rate hike in June.

Futures tied to the Federal Reserve’s policy rate rose after the Labor Department report, and now reflect less than a 10% chance that the U.S. central bank will raise its benchmark overnight interest rate from the current 5.00%-5.25% range at the June 13-14 meeting, with the bulk of bets on a pause. Traders earlier on Wednesday had priced in as much as a 25% chance of a rate hike next month.

The Consumer Price Index (CPI) rose 4.9% last month from a year earlier, after advancing 5.0% on a year-on-year basis in March. That’s still far above the U.S. central bank’s 2% target, but it was a touch less hot than the 5% economists had expected.

And importantly, inflation in core services excluding housing – a key metric for Fed Chair Jerome Powell because of its outsized contribution to overall inflation – eased from the prior month, according to estimates from several economists.

“We continue to see the data and financial conditions firmly supporting a pause in June,” Morgan Stanley economists wrote. Powell and other Fed policymakers have said they are watching credit conditions especially closely, as a drop in bank lending could slow the economy faster than the Fed rate hikes alone would do.

Still, Wednesday’s data is far from the final word for Fed policymakers, who have another month of data to parse before making their next interest rate decision.

Meanwhile, traders of interest-rate futures piled further into bets that the Fed will start cutting rates in September, with the policy rate seen ending the year in the 4.25%-4.50% range.


US inflation continues to run too hot, but there are glimmers of hope

US inflation continues to run too hot, but there are glimmers of hope

Inflation is tracking too high, but that could soon change

So both the headline and core US CPI month-on-month prints came in at 0.4% in April, as expected. Favourable rounding means that the annual rate of headline inflation slows to 4.9% from 5% (consensus 5%), while the annual rate of core inflation drops to 5.5% from 5.6% as predicted. Remember we peaked at 9.1% for headline inflation in June last year and 6.6% for core inflation in September, so we continue to move in the right direction. However, MoM CPI prints of 0.4% are well above the 0.17% MoM rate we need to average over time to bring the annual rate of inflation down to 2%, hence the Fed won’t be incentivised to sound dovish just yet.

Nonetheless, the encouraging story in the details is that services ex-energy, ex-housing appears to be softening with used cars the biggest upside driver of MoM inflation (rising 4.4% MoM). The Fed has made a big play of focusing on the services ex-energy and housing as this is where the tight labour market could keep upward pressure on wages and it is in these sorts of services where that is most likely to feed through into pricing. A quick number crunch suggests it came in at around the 0.2% MoM rate, which as mentioned previously, is a key metric that would allow the Fed to relax more about inflation.

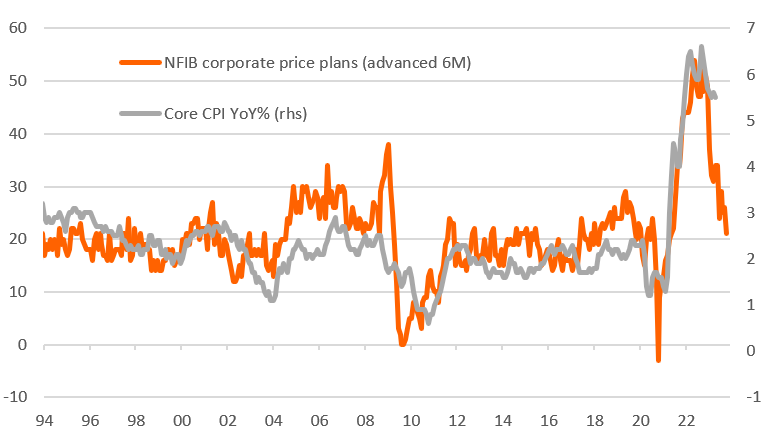
Weakening corporate pricing power points to core CPI returning to 2.5% by year-end

Source: Macrobond, ING
Macrobond, ING

Slowing shelter and weakening corporate pricing power to be the big themes in the second half of 2023

In terms of the outlook, while we don’t think the Fed will need to see 2% annual inflation achieved before considering rate cuts, we do need to be consistently hitting 0.2% or 0.1% MoM. That is possible, we think, late in the third quarter into the fourth quarter given the clear topping out in housing rents, which should be increasingly reflected in the shelter CPI components as we head into the third quarter (shelter is over 40% of the core CPI basket), and weakening corporate pricing power.

Indeed, yesterday’s National Federation of Independent Business survey of price plans for US businesses recorded another sharp slowdown – a five-point decline in the proportion of companies expecting to raise prices in the coming three months, with the index back at historical long-run averages – with the index consistent with core CPI dropping to around 2.5% year-on-year by year-end. That may be a little optimistic, but if unemployment is starting to rise at the same time as 0.2% MoM core CPI prints, the Fed’s dual mandate of price stability and maximum employment can justify moving interest rates lower from restrictive levels.

If, as we fear, the combination of lagged effects of 500bp of Fed rate hikes and significantly reduced credit availability, as highlighted by the Fed’s Senior Loan Officers’ survey on Monday, do slow the economy sharply and unemployment starts to rise, the momentum will increasingly swing towards rate cuts. Right now markets are pricing a 25bp cut as soon as September. That may be a little early, but we think November and December are looking decent bets for the Fed moving policy to a more neutral setting.

Oil Technical Update: WTI and Brent Crude Recovery on Hold after US CPI

Oil Technical Update: WTI and Brent Crude Recovery on Hold after US CPI

WTI Finds Resistance – Potentially Halting 4-Day Recovery

WTI prices have partially recovered from the panic selling that ensued in the wake of another flare up in the US regional banking sector. In fact, the prior four trading days were market by green candles as the oil market attempted to move away from last Thursday’s low of $63.64.

The market has appeared to find intra-day resistance in line with the February 22nd low of this year around $73.90. The MACD indicator ought to be observed in the event there is a bullish crossover, which may suggest further upside to come. The RSI is making its way higher after just falling short of oversold conditions. Points to consider when assessing the potential for further upside include: the downward sloping trendline acting as resistance and the $75.75 level – which represents the underside of the gap, inspired by OPEC’s surprise cuts which came into effect this month. The 50 day SMA adds another potential upside barrier.

Support resist at the psychological level of $70.

Crude Oil (WTI) CL1 Daily Chart – Continuous Futures

image1.png

Brent Crude Oil Attempts to Trade Back Within its Defined Range

Brent crude oil attempted to break above the zone of resistance with a mid-point of $76.50, but has moved lower as of the US CPI data release. Appearing to find resistance around yesterday’s high, brent prices have moved through the 50% retracement of the major 2020 to 2022 move at $77, with an approach towards the descending trendline which served as prior resistance, now support.

The lower side of the support zine at $75.20 is the next level of support followed by last week’s low at $71.40. However, like with WTI, keep an eye out for a bullish crossover which could signal more upside to come. Resistance levels beyond $77 include the 50 SMA and the rough midpoint of the larger zone at $82.00, with the upper side of the larger zone at $89.00 a fair distance away.

image2.png

USD Breaking News: Humdrum US CPI Leaves DXY on Offer

USD Breaking News: Humdrum US CPI Leaves DXY on Offer

DOLLAR FUNDAMENTAL BACKDROP

US CPI (refer to economic calendar below) was released largely in line with expectations with the headline print marginally lower at 4.9%. No real surprises here and from a Fed perspective, a welcomed release. A CPI beat may have ‘hawkishly’ repriced Fed rate hike expectations after the strong US jobs report last week. Higher gasoline prices contributed to an elevated read leaving the inflation figure distanced from the target rate of 2%.

US ECONOMIC CALENDAR

Implied Fed funds futures pricing for year end have increased almost 8bps post-announcement now anticipating 71bps of cumulative rate cuts. The immediate reaction by the USD as shown via the Dollar Index (DXY) saw bears jump back in and drive prices lower.

FEDERAL RESERVE INTEREST RATE PROBABILITIES

MARKET REACTION – TECHNICAL ANALYSIS

U.S. 10-YEAR TREASURY YIELD DAILY CHART

The U.S. 10-year Treasury yield consequently fell below the 3.5% mark in conjunction with the death cross (red) signal that may suggest yields are heading towards the 3.253% swing low.

U.S. DOLLAR INDEX DAILY CHART

Chart prepared by Warren Venketas, IG

The daily DXY chart has pierced the 101.42 swing low heading towards symmetrical triangle support. A break below coinciding with the 101.00 psychological handle could subsequently expose the 100.00 level and beyond.

EUR/GBP Latest: Support Breaks Ahead of BoE Rate Decision

EUR/GBP Latest: Support Breaks Ahead of BoE Rate Decision

A recent Bloomberg report using Reed Recruitment Jobs data shows that the UK jobs market remains buoyant with people changing jobs seeing a 10% boost to their wages on average. This is markedly higher than last month’s official UK data that showed average earnings including bonus (3Mnth/Year) rising by 5.9% in February, while average earnings excluding bonus rose by 6.6% over the same time frame.

The Bank of England: A Forex Trader’s Guide

The Bank of England is set to hike the UK Bank Rate by a further 25 basis points to 4.50% tomorrow. Recent inflation data has shown price pressures remaining stubbornly high and today’s Reed Report, while not an official data point, will have many in Threadneedle Street worried that a robust wage market may keep inflation higher for longer. The post-decision commentary and press conference should see BoE governor Andrew Bailey point towards the jobs market as an area of ongoing concern.

image1.png

The latest UK GDP data will be released on Friday this week and is expected to show that the UK missed going into a technical recession in the first three months of this year. Preliminary year-on-year Q1 data is expected to show growth of 0.2%, compared to 0.6% in Q4 2022, with year-on-year growth slowing to 0.4% in March from 0.5%.

image2.png

For all market-moving data releases and events, see the DailyFX Economic Calendar

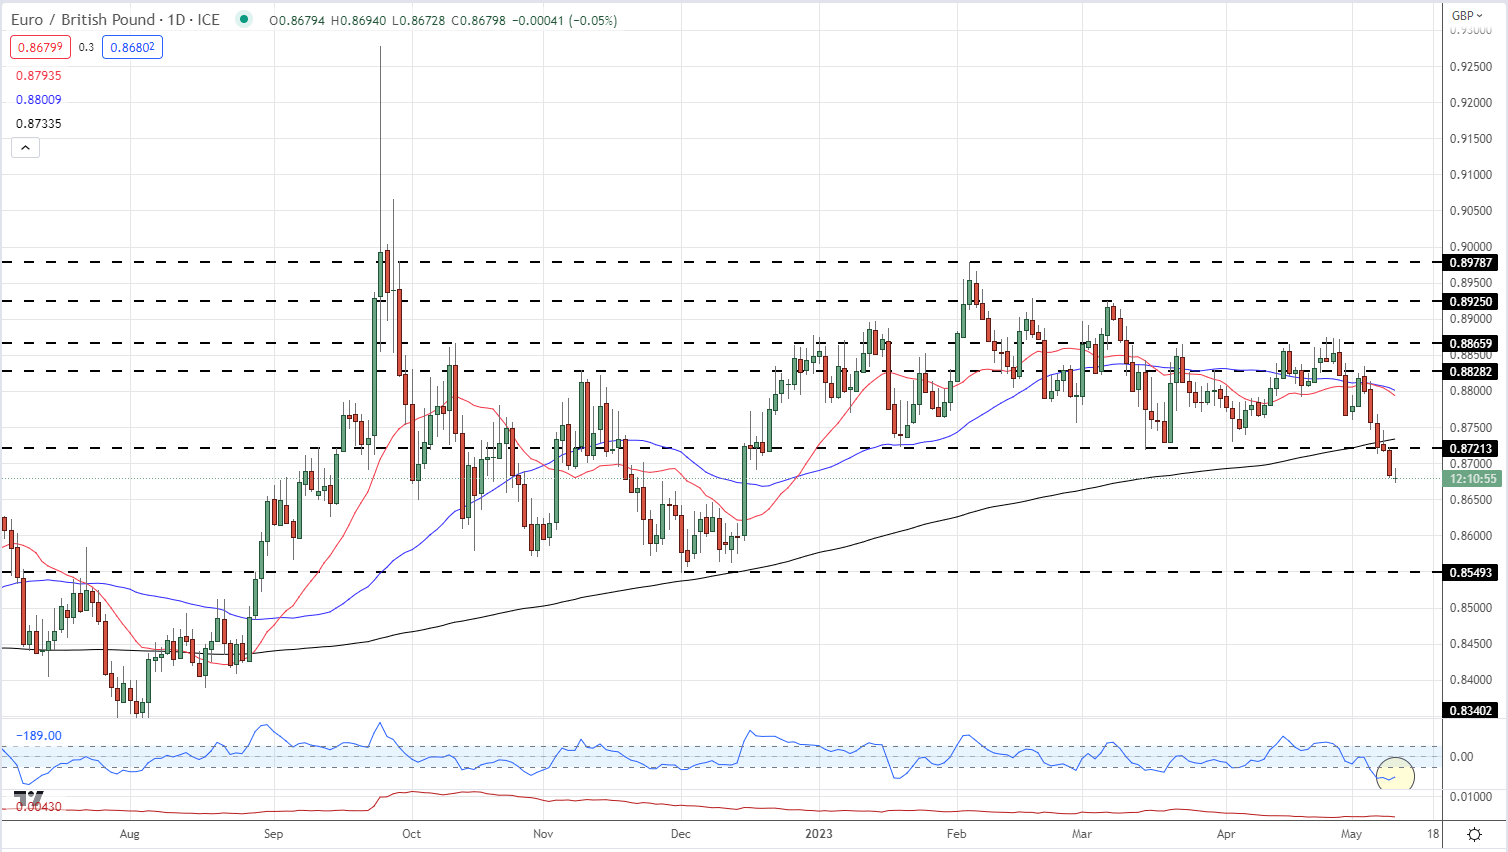
EUR/GBP broke below a multi-month level of horizontal support on Tuesday, and with it opened below the 200-day moving average for the first time since August 2022. The range-break move happened despite hawkish commentary from a number of ECB board members who see further rate hikes in the months ahead. This commentary should act as a level of support for the Euro but it seems that this is not the case currently. The pair sit squarely in oversold territory, using the CCI indicator, while volatility in the pair remains low. If EUR/GBP continues to fade lower, support should be seen around 0.8600 and 0.8550.

EUR/GBP Daily Price Chart – May 10, 2023

image3.png

Chart via TradingView

AUD/USD Trapped in Lateral Channel, US CPI Could Spark Volatility Later this Week

AUD/USD Trapped in Lateral Channel, US CPI Could Spark Volatility Later this Week

AUD/USD has lacked strong directional conviction since early March, trading largely sideways, with the exchange rate moving flawlessly within the confines of a lateral channel – a clear sign of consolidation ahead of the next explosive move.

Ranging markets can predictable and easy to trade at times, but the whole premise is to establish a long position when prices of the underlying asset move toward support in anticipation of a rebound or to go short at resistance in preparation for possible a pullback.

Looking at Aussie’s daily chart, range trading strategies would’ve been effective recently as the pair has respected the upper (0.6800) and lower limits (0.6500) of the interval it has been trapped in for more than two months. While the setup could still work, caution is warranted, with volatility seen surging in the coming days due to a high-impact event on the economic calendar: the U.S. CPI report from April.

U.S. inflation data set to be released Wednesday at 8:30 am ET could spark wild FX market swings, so traders should exercise restraint when it comes to trading and, more importantly, pay attention to price action to better predict the near-term market bias.

In terms of possible scenarios, if AUD/USD gets rejected from resistance at 0.6800, the 200-day simple moving average and the rising trendline extended off the October 2022 lows should fend off bears, but if they get taken out decisively, sellers could launch an assault on the 2023 lows near 0.6575.

Alternatively, if price action consolidation resolves to the upside with a clean break of resistance at 0.6800, additional buyers are likely to step in, creating the right conditions for a rally toward 0.6880. On further strength, the focus shifts higher to dynamic resistance at 0.7000.

AUD/USD TECHNICAL CHART

A picture containing screenshot, line, diagram, plot  Description automatically generated

Crude Oil Prices Rally Ahead of US Inflation Data as Retail Traders Turn Bearish

Crude Oil Prices Rally Ahead of US Inflation Data as Retail Traders Turn Bearish

WTI crude oil prices gained for a fourth consecutive day, matching the longest winning streak since the beginning of April. Adding an extra 24 hours to this victory streak would mean the longest since early March. Since finding a recent bottom earlier this month, crude oil is up about around 8 percent.

The rally comes as the Biden administration announced it would plan to begin purchasing the commodity to replenish the nation’s Strategic Petroleum Reserves (SPR). The latter is sitting around a 40-year low in the aftermath of withdrawals that began when Russia invaded Ukraine more than a year ago.

Heading into the remaining 24 hours, all eyes will turn to April’s US CPI report. Headline inflation is seen unchanged at 5 percent y/y while the core gauge is expected to weaken slightly to 5.5% from 5.6% y/y. Further signs of sticky price pressures, coupled with last week’s healthy jobs report, could further cool near-term Federal Reserve rate cut bets.

That could dampen future demand prospects for crude oil. However, in recent days, retail traders have responded to oil’s rise by increasing their downside exposure. This can be seen by taking a look at IG Client Sentiment (IGCS).

Crude Oil Sentiment Outlook – Bullish

The IGCS gauge shows that about 76% of retail traders are net-long crude oil. Since the majority remains biased to the upside, this hints prices may continue falling down the road. But, downside exposure has increased by 3.44% and 37.98% compared to yesterday and last week, respectively. With that in mind, recent changes in positioning hint that the price trend may reverse higher despite overall positioning.

Oil - US Crude Client Positioning

Crude Oil Daily Chart

On the daily chart, crude oil has extended a bounce off the wide 64.40 – 67.93 support zone. Near-term resistance seems to be the 38.2% Fibonacci retracement level at 75.60. Beyond that sits the 200-day Simple Moving Average (SMA). This could hold, maintaining the dominant downside focus.

WTI crude oil prices gained for a fourth consecutive day, matching the longest winning streak since the beginning of April. Adding an extra 24 hours to this victory streak would mean the longest since early March. Since finding a recent bottom earlier this month, crude oil is up about around 8 percent.

The rally comes as the Biden administration announced it would plan to begin purchasing the commodity to replenish the nation’s Strategic Petroleum Reserves (SPR). The latter is sitting around a 40-year low in the aftermath of withdrawals that began when Russia invaded Ukraine more than a year ago.

Heading into the remaining 24 hours, all eyes will turn to April’s US CPI report. Headline inflation is seen unchanged at 5 percent y/y while the core gauge is expected to weaken slightly to 5.5% from 5.6% y/y. Further signs of sticky price pressures, coupled with last week’s healthy jobs report, could further cool near-term Federal Reserve rate cut bets.

That could dampen future demand prospects for crude oil. However, in recent days, retail traders have responded to oil’s rise by increasing their downside exposure. This can be seen by taking a look at IG Client Sentiment (IGCS).

Crude Oil Sentiment Outlook – Bullish

The IGCS gauge shows that about 76% of retail traders are net-long crude oil. Since the majority remains biased to the upside, this hints prices may continue falling down the road. But, downside exposure has increased by 3.44% and 37.98% compared to yesterday and last week, respectively. With that in mind, recent changes in positioning hint that the price trend may reverse higher despite overall positioning.

Oil - US Crude Client Positioning

Crude Oil Daily Chart

On the daily chart, crude oil has extended a bounce off the wide 64.40 – 67.93 support zone. Near-term resistance seems to be the 38.2% Fibonacci retracement level at 75.60. Beyond that sits the 200-day Simple Moving Average (SMA). This could hold, maintaining the dominant downside focus.

image2.png

Shopping Basket
Chat now!
1