Profit-Taking in Big Tech Overnight, as US Earnings Remain Centre Stage: US Dollar, Nikkei 225, AUD/JPY

Profit-Taking in Big Tech Overnight, as US Earnings Remain Centre Stage: US Dollar, Nikkei 225, AUD/JPY

Market Recap

Earnings from Netflix and Tesla have triggered some profit-taking in big tech companies overnight, as pockets of weaknesses in their results seem to give rise to concerns for other upcoming big tech results as well. Given the stellar tech rally since the start of the year, market participants may be pricing for not just an earnings beat, but a strong guidance in corporate earnings over the coming quarters with current ‘soft landing’ hopes. Any signs to challenge that narrative may call for some re-rating in their present lofty valuation.

Wall Street ended mixed overall (DJIA +0.47%; S&P 500 -0.68%; Nasdaq -2.05%), with further catch-up gains in value sectors as the DJIA delivered its nineth day winning streak. Weaker-than-expected read in the Philadelphia Fed Manufacturing Index (-13.5 versus -10 forecast) and a deeper contraction in the Conference Board Leading Economic Index have been largely shrugged off, with the earnings season taking centre stage and expectations well-positioned for the last rate hike from the Fed next week. Treasury yields largely headed higher, with the 10-year yields jumping 10 basis-point (bp) overnight.

One to watch may be the US dollar, which is back to retest its previous support-turned-resistance level at the 100.50 level. For now, the broader trend of lower highs and lower lows could still suggest sellers largely in control, while there are the odds that the recent upmove is a near-term moderation from oversold technical conditions following a hefty 4% sell-off over the past two week. Failure to reclaim the 100.50 level over the coming days could leave its July 2023 low on watch at the 99.00 level for a retest.
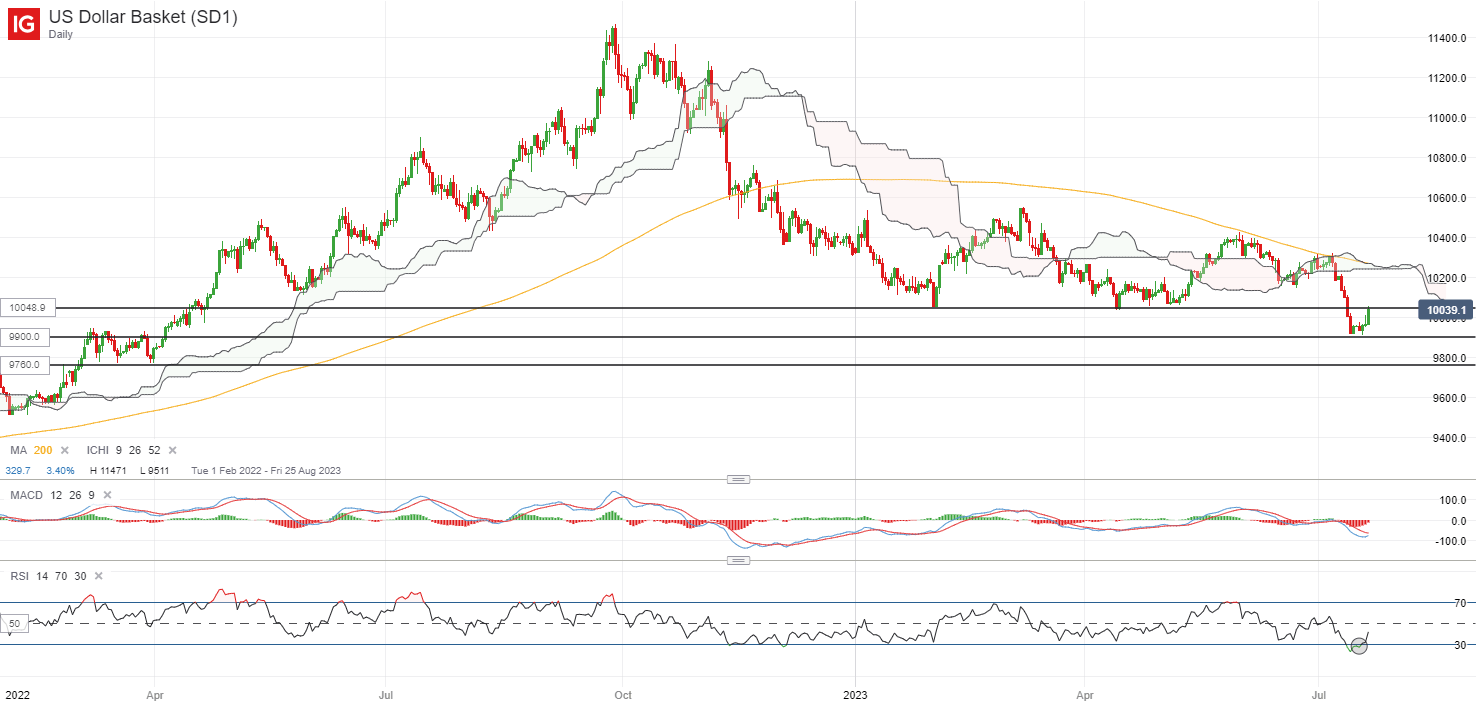
image1.png

Asian stocks look set for a negative open, with Nikkei -0.69%, ASX -0.22% and KOSPI -0.75% at the time of writing. The economic calendar is relatively quiet to end the week, with focus this morning revolving around the Japan’s inflation data for June. The headline print was lower than expected (3.3% versus 3.5% year-on-year), but the core aspect continue to show some persistence with a match of consensus at 4.2%.

That may still keep speculations of a policy adjustment from the Bank of Japan (BoJ) in place, with the Japanese 10-year bond yields hovering near its two-month high into the BoJ meeting next week. While there has been some pushback from authorities lately for a July move, the consensus remains that a policy shift will be a matter of when and could eventually take place by the end of this year.

Any hawkish shift in policy settings may be negative for the Nikkei 225 index, as seen from the 2% sell-off back in December 2022 on the BoJ’s surprise yield curve control (YCC) tweak. But while that is still perceived to be a few meetings away, the index is currently attempting to defend a key double-top neckline at the 32,400 level. The recent lower highs on its Relative Strength Index (RSI) point to some exhaustion in upward momentum for now, while the index attempts to stay above its 100-day moving average (MA) for now. Failure to defend the 32,400 level may potentially pave the way towards the next line of support at the 31,400 level.
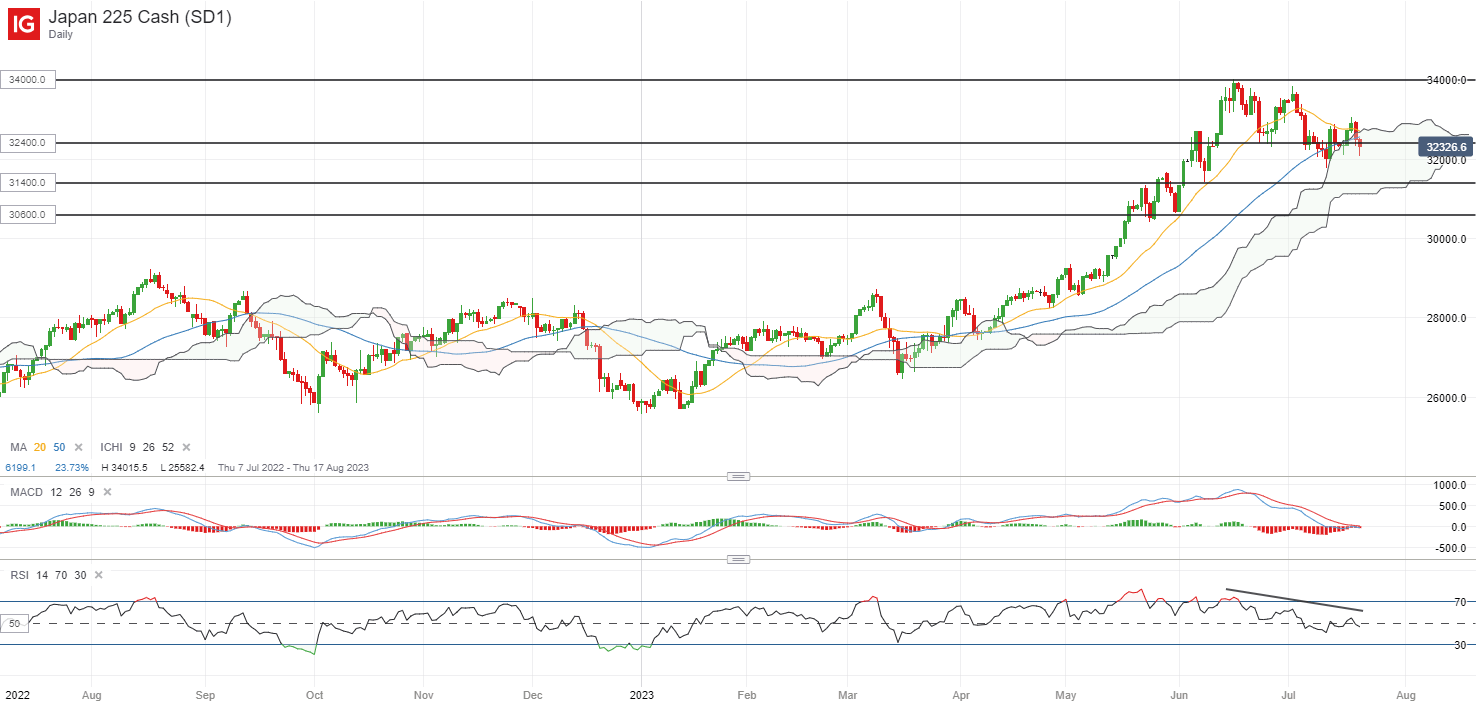
image2.png

A hotter-than-expected jobs data out of Australia yesterday has prompted a hawkish recalibration in rate expectations for the Reserve Bank of Australia (RBA), as market participants price for a higher odds of a 25 bp move from the central bank next month. That triggered an initial jump in the AUD/JPY before the more subdued risk environment dampened some optimism around the risk-sensitive AUD.

With that, the AUD/JPY is once again back to retest its key resistance at the 95.34 level, with a near-term ascending triangle pattern in place on the four-hour chart. Buyers may have to overcome the 95.34 level to provide greater conviction for a move to retest its June 2023 high, but for now, the risks of a lower high is still present, with any downside potentially leaving the 93.20 level on watch as immediate support.
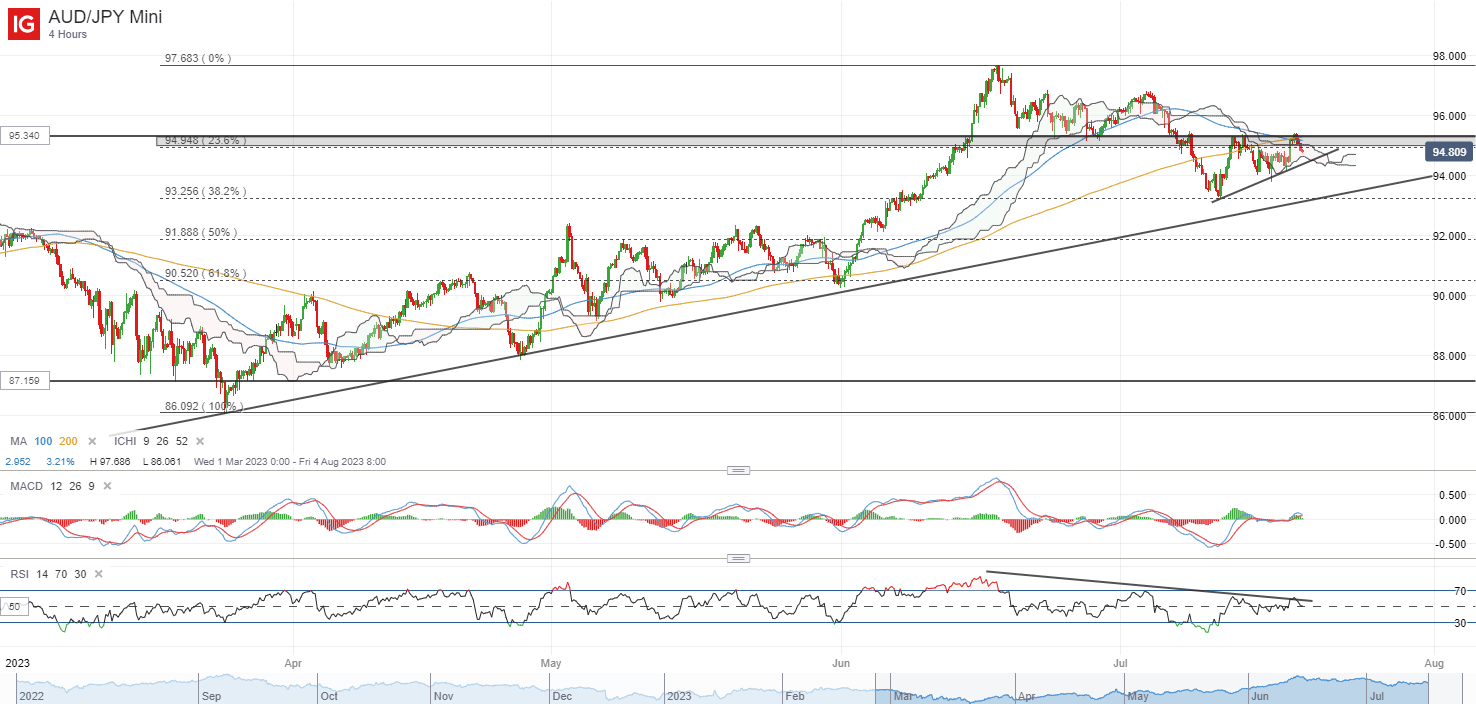
image3.png

Euro Technical Outlook – A Retreat from Lofty Levels. Will EUR/USD Reverse?

Euro Technical Outlook – A Retreat from Lofty Levels. Will EUR/USD Reverse?

EUR/USD TECHNICAL ANALYSIS

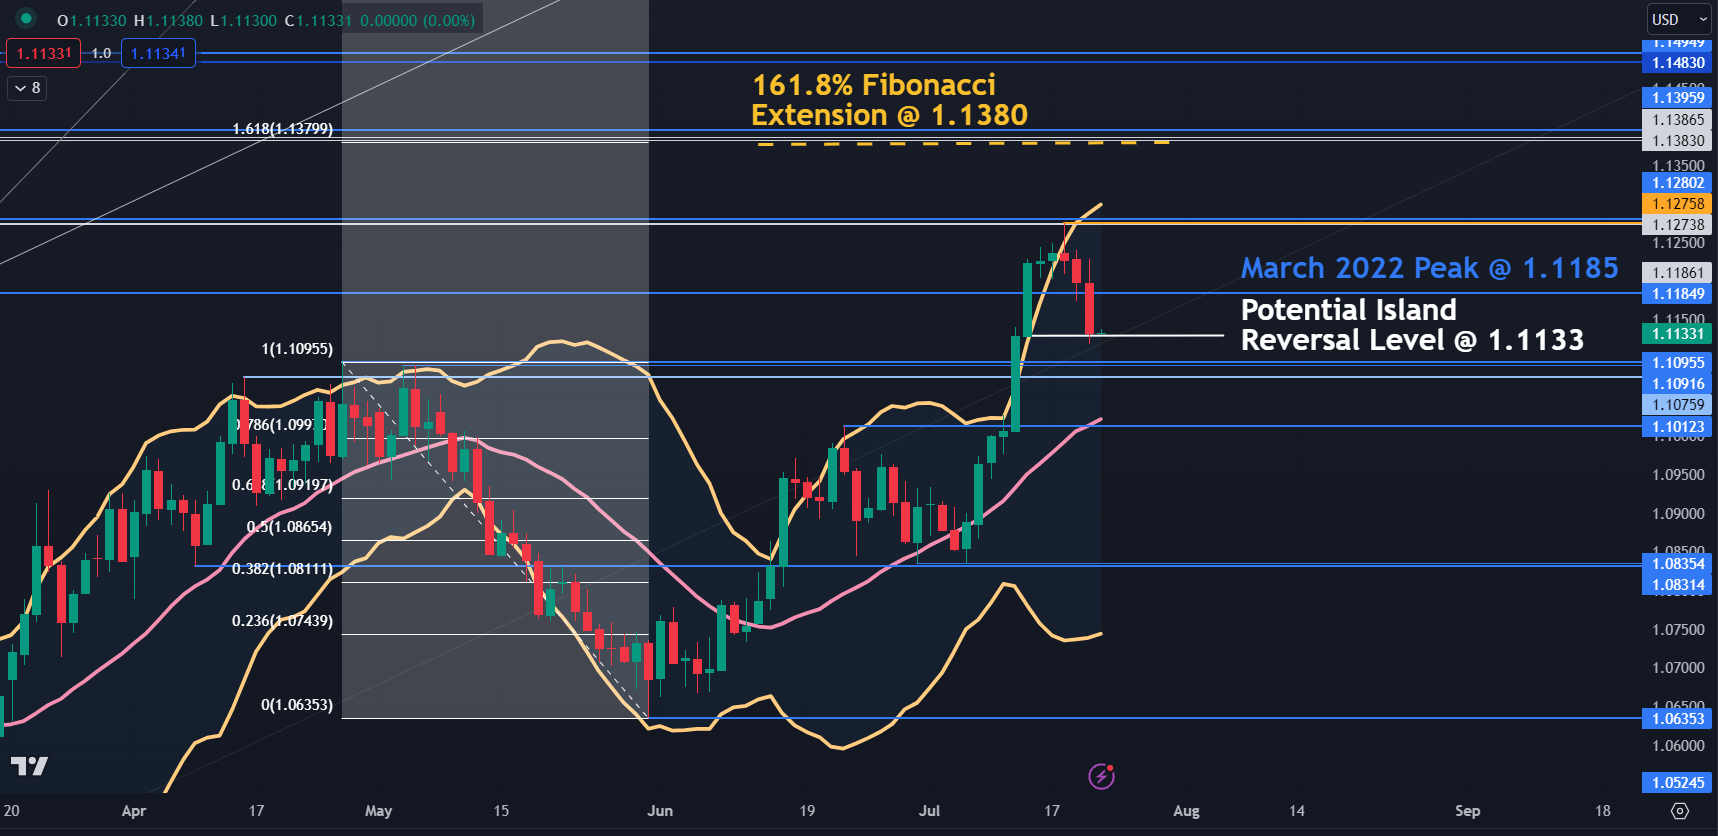
Last week’s rally has broken above the upper band of the 21-day simple moving average (SMA) based Bollinger Band.

When it closed back inside earlier this week, it opened up a bearish run over the next few days as discussed here on Tuesday.

The bears may look to add exposure if there is a close below 1.1133, as it would set up an island reversal candlestick pattern.

An Island Reversal occurs when there is a gap in price action that extends the bullish or bearish trend. After the price reaches its zenith or nadir, the price action then makes another gap in the price in the opposite direction to where the first gap occurred.

Strictly speaking, it is rare for an Island Reversal to occur in free-floating foreign exchange markets as they do not close during the working week.

The continuous trading of currencies means that the daily close and next open are almost identical. In general, the change in price reflects the interest rate differential between the two currencies.

Exchange-traded financial market products, such as equities and futures, generally close for a period each day. This allows new information to be disseminated before the next open and the price may move significantly from where it closed, enabling a gap.

So, for EUR/USD, a close below 1.1133 may indicate that an Island Reversal has evolved. If it does close below that level, the further below 1.1133 that it occurs, the more comfort the bears might find.

Support could be at the breakpoints in the 1.1075 – 1.1095 zone and lower down at 1.1010.

On the topside, resistance could be at the breakpoint from the March 2022 high at 1.1185 or the recent peak at 1.1275, which coincides with two historical breakpoints.

Further above those levels, resistance might be at the Fibonacci Extension of the move from 1.1095 to 1.0635 at 1.1380. Just above there are some more breakpoints in the 1.1385 – 95 area.

EUR/USD DAILY CHART

image1.png


Japanese Yen Steady After CPI; USD/JPY, AUD/JPY, CAD/JPY, MXN/JPY Price Action

Japanese Yen Steady After CPI; USD/JPY, AUD/JPY, CAD/JPY, MXN/JPY Price Action

The Japanese yen was steady even as price pressures in Japan re-accelerated last month amid the growing view that inflation is peaking.

Nationwide core CPI rose 3.3% in June from 3.2% in May. The so-called core-core inflation gauge (which excludes both food and energy) slowed to 4.2% on-year from 4.3% in May. This follows a slower-than-expected Tokyo June inflation report as cost-push factors subside, providing some space for the Bank of Japan (BOJ) to persist with the ultra-easy monetary policy for now.

USD/JPY Daily Chart

image1.png

BOJ is widely expected to keep its policy settings unchanged when it meets next week, but the key focus will be on fresh quarterly projections and discussions regarding phasing out the controversial yield curve control (YCC) policy after BOJ summary of opinions at the June policy meeting quoted one board member saying the central bank should debate tweaking YCC to improve market function and mitigate its “high cost”.

BOJ Governor Kazuo Ueda has emphasized that the central bank is still some way off from achieving its 2% target, warranting a continuation of the ultra-soft monetary policy for the time being.

USD/JPY 240-minute Chart

image2.png

USD/JPY: Rally could soon run out of steam

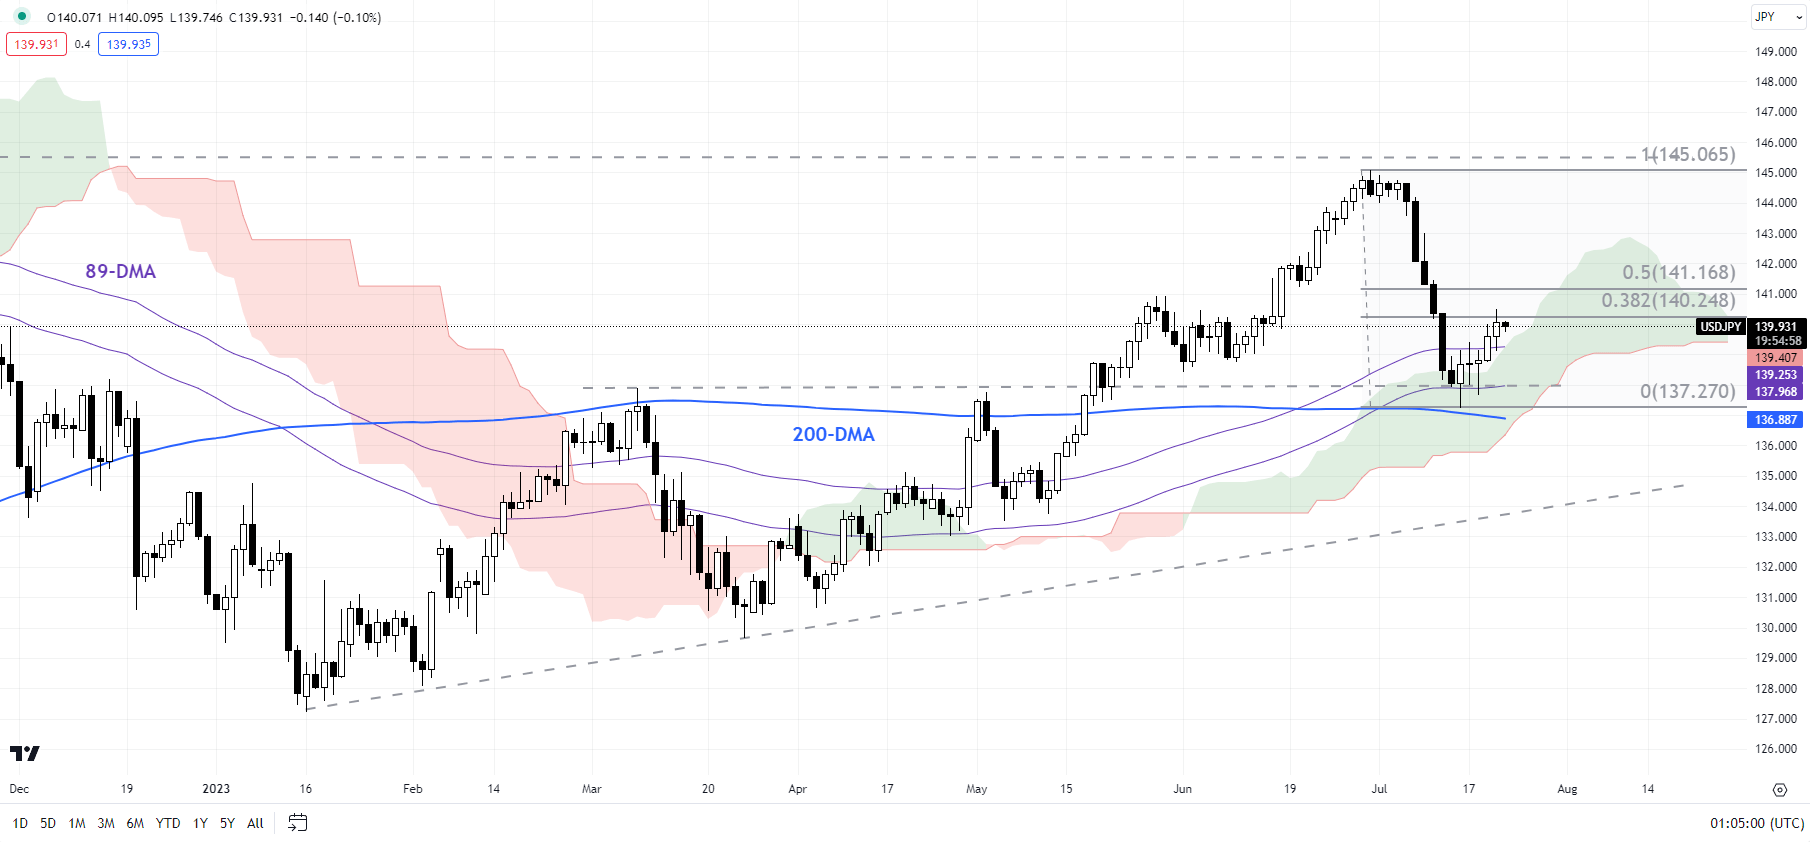
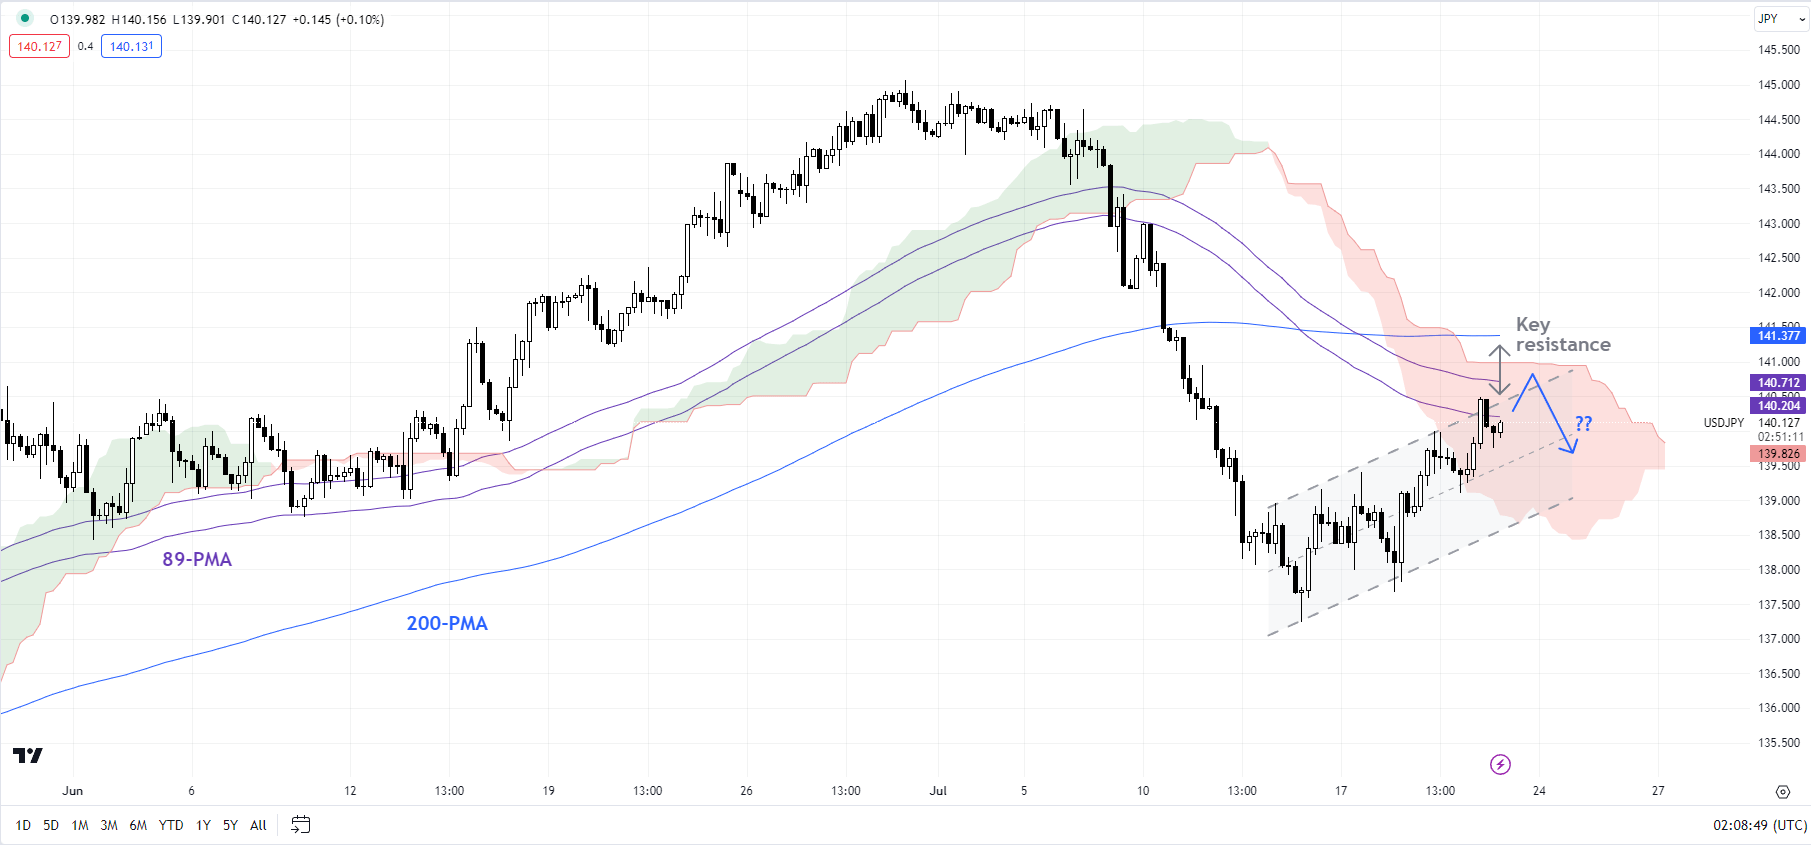
On technical charts, USD/JPY is approaching a strong converged cap, including the 200-period moving average, the 89-period, and the upper edge of the Ichimoku cloud on the 240-minute charts. This coincides with the 38.2%-50% retracement of the fall since early July. The sharp slide has raised the odds that USD/JPY’s uptrend since the start of 2023 is cracking. For more on this see “Cracks Emerge in Japanese Yen’s Downtrend; USD/JPY, CAD/JPY, MXN/JPY Price Setups,” published July 10. A retest of last week’s low of 137.25 appears to be likely.

AUD/JPY Weekly Chart

image3.png

AUD/JPY: Upside capped

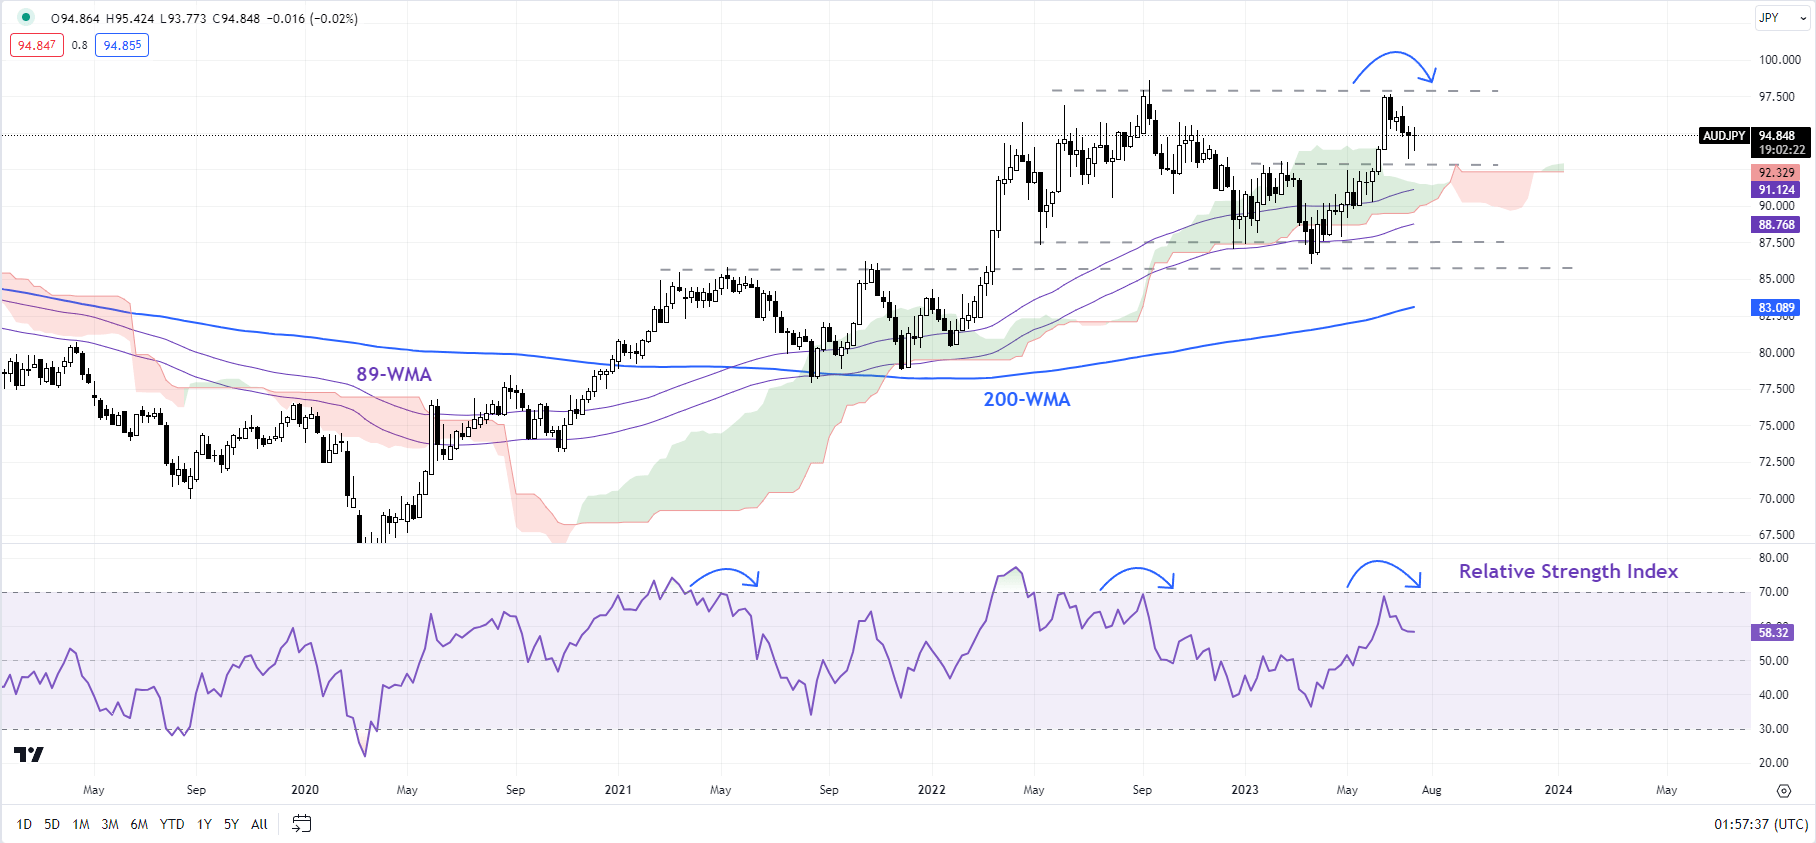
AUD/JPY has failed to extend gains following the sharp rise in mid-June to the crucial ceiling at the 2022 high of 98.40. The turn lower of the 14-week Relative Strength Index (RSI) from the upper ceiling at 70 raises the odds of some weakness in the cross if history is any guide (see the chart). Any break below immediate support at the mid-February high of 93.00 could expose the downside toward 89.00.

CAD/JPY Monthly Chart

image4.png

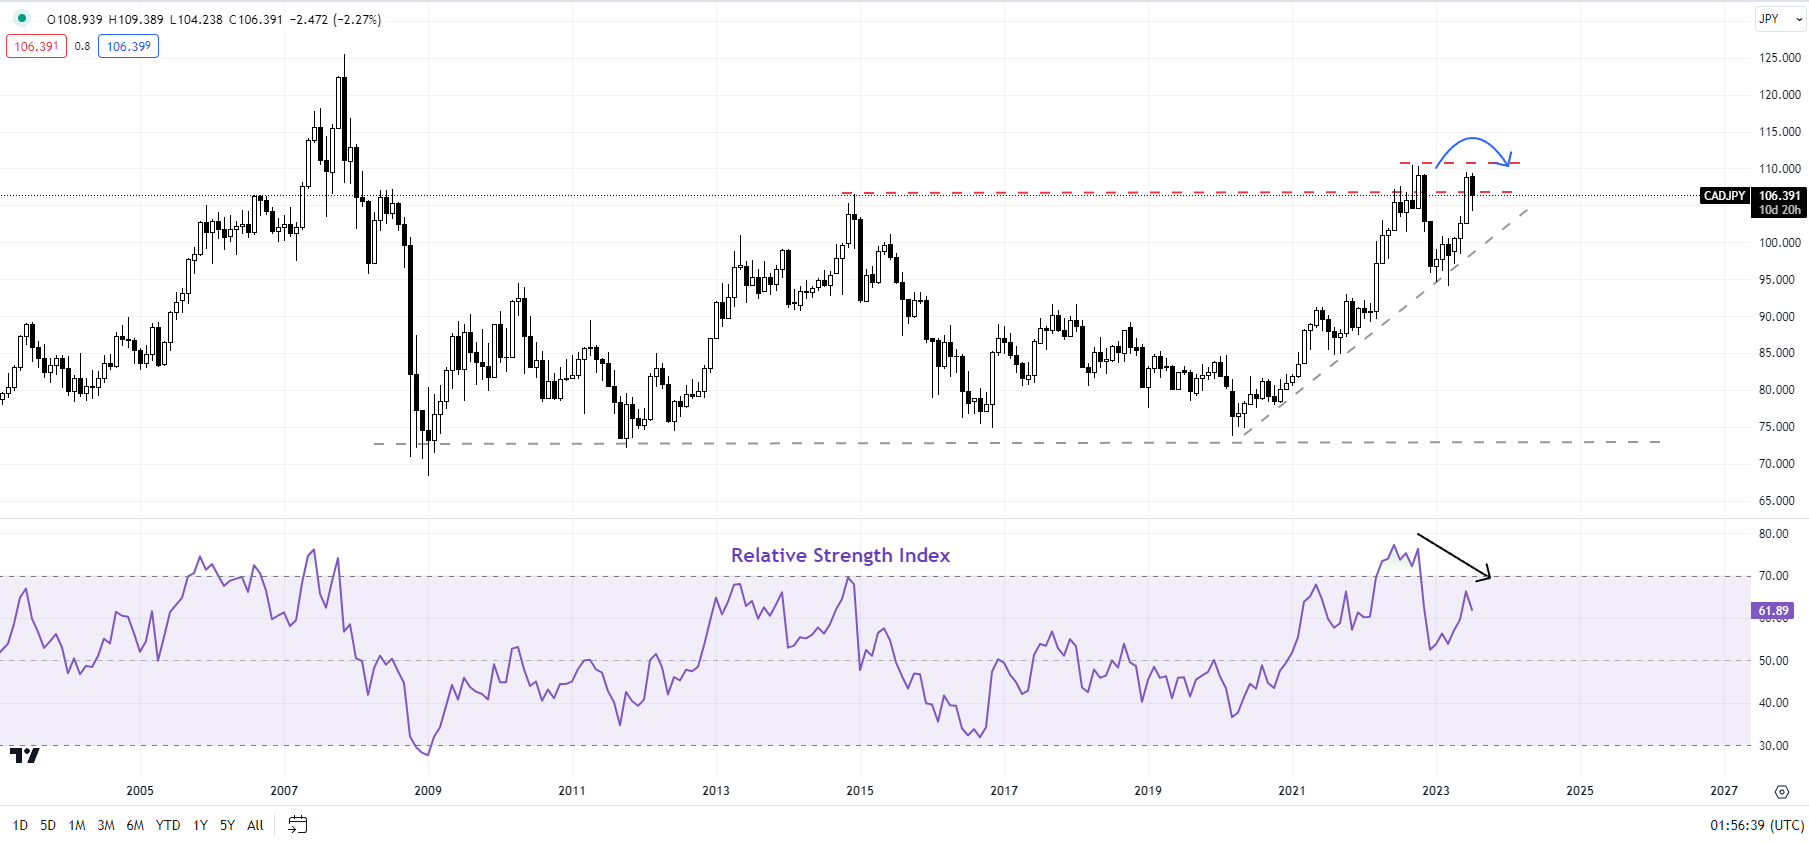
CAD/JPY: Retreat possible

The feeble rebound in the 14-month RSI even as CAD/JPY is back to the late 2022 highs is a strong sign that the cross’ rebound from April is running out of breath. CAD/JPY faces initial resistance at 106.85 (the 50% retracement of the fall from the end of June), and a stronger barrier at 107.50 (the 61.8% retracement).

MXN/JPY Monthly Chart

image5.png

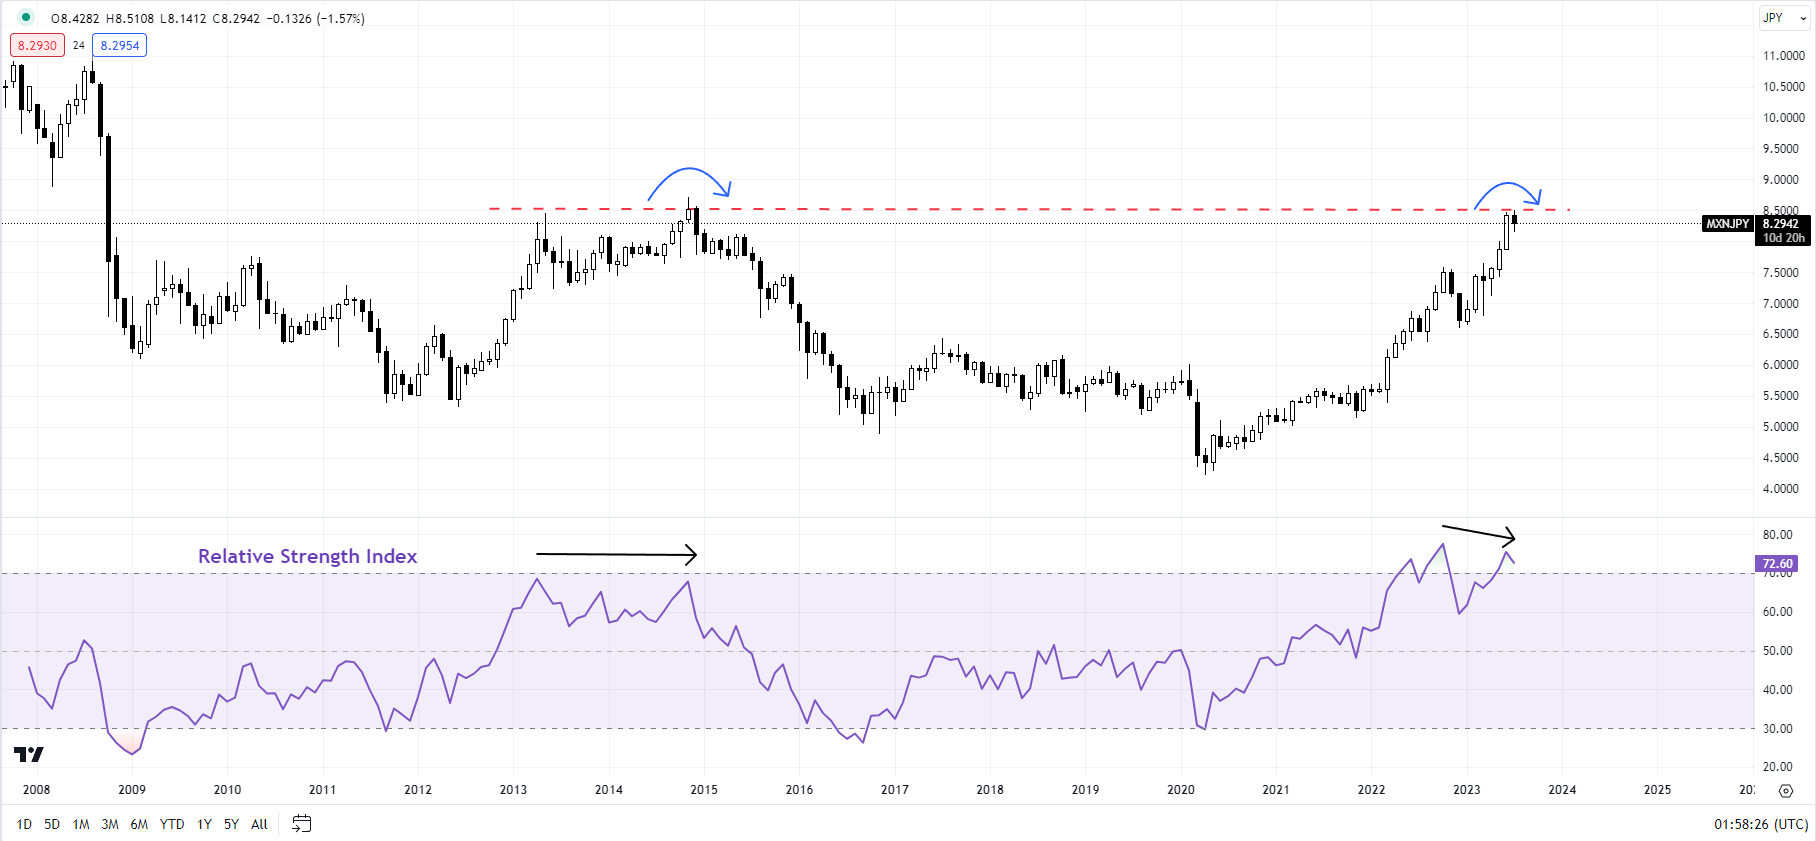
MXN/JPY: Rally fatigue

A negative momentum divergence (rising price associated with a stalling in the 14-month RSI) suggests MXN/JPY’s multi-month rally is losing momentum as it tests a major hurdle at the 2014 high of 8.72. At the very least some sort of consolidation is likely especially given low market diversity. For more details, see “Cracks Emerge in Japanese Yen’s Downtrend; USD/JPY, CAD/JPY, MXN/JPY Price Setups,” published July 10. A drop toward the 89-day moving average (now at about 7.85) can’t be ruled out.

GBP/USD Price Forecast: Positive Retail Sales Temporarily Lifts the Pound

GBP/USD Price Forecast: Positive Retail Sales Temporarily Lifts the Pound

Cable saw Wednesdays drop extend into Thursday on the back of a stronger dollar as market participants position ahead of next weeks FOMC meeting. The US Dollar is facing some stern resistance while positive UK retail sales data this morning could keep cable moving higher in the short term.

UK RETAIL SALES DATA AND US LABOR MARKETS

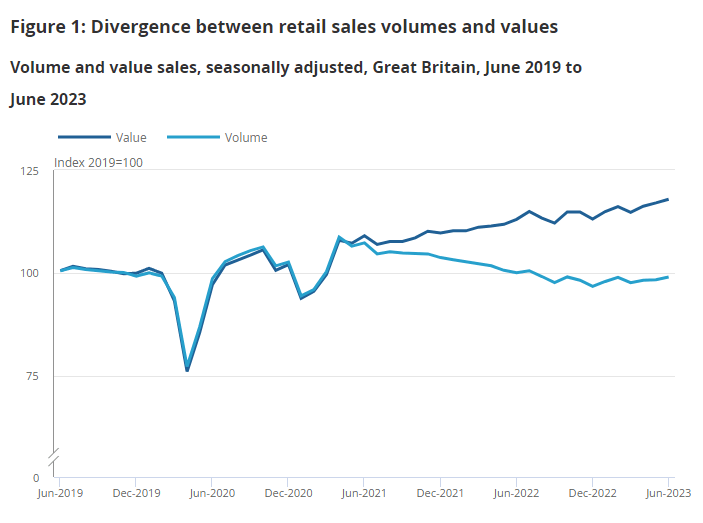
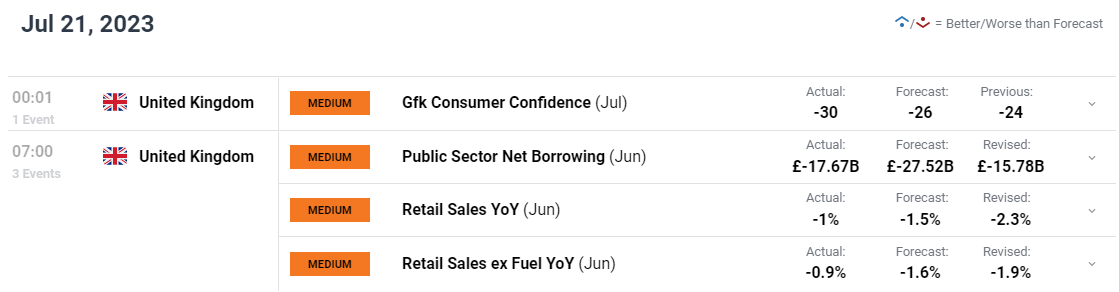
UK retail sales surprised to the upside this morning in what will likely serve as a positive indicator for the Bank of England (BoE) as it looks to hike rates at the September meeting. A positive retail sales print will reinforce the idea that UK consumers could handle higher rates as the fight against inflation continues. There were positive signs this week regarding UK inflation, but a lot still needs to be done with UK Chancellor Hunt stating that the UK will start to see results if they stick to their plan to halve inflation. The British Retail Consortium measured retail spending in June at 4.9% higher YoY with Barbeque food and garden furniture in high demand as the UK much like Europe grappled with one of the hottest months on record.

image1.png

*Figure 1 shows the continued divergence between the quantity bought (volume) and amount spent (value) in retail sales over time because of price increases.

Source: Monthly Business Survey, Retail Sales Inquiry from the Office for National Statistics

US labor data remained robust yesterday adding a stamp of approval on a 25bps hike next week from the US Federal Reserve. The question on everyone’s lips however, is where will the Fed rates top out? At the moment the consensus seems to be for a 25bps hike next week before another pause. I for one had harbored hope that the Fed might spring a real big surprise and do something they haven’t done before and opt for a smaller rate hike of 10-15bps. However, the Fed have historically opted to hike rates in increments of 25-50bps which would make such a move even more controversial.

A dovish rhetoric and a 25bps hike next week could leave the US Dollar vulnerable to further losses and could work in favor of further upside for cable.

image2.pngimage3.png

For all market-moving economic releases and events, see the DailyFX Calendar

TECHNICAL OUTLOOK AND FINAL THOUGHTS

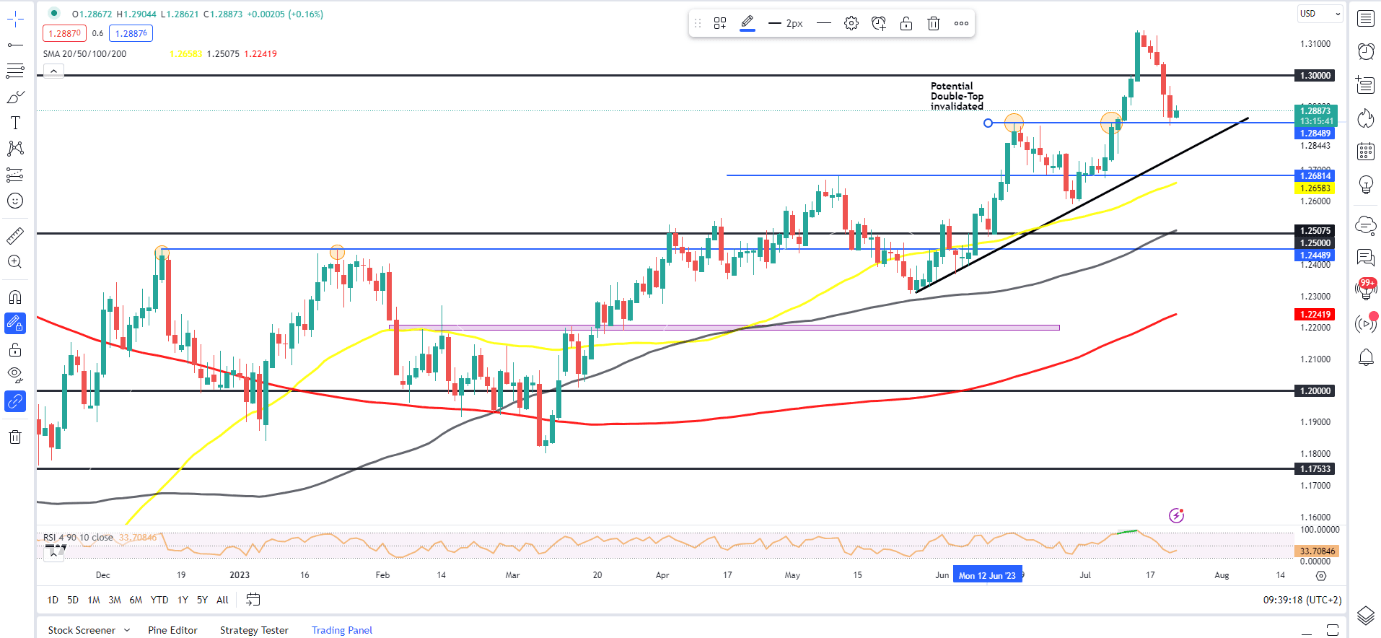
GBPUSD has been ticking lower since refreshing its YTD high on July 13. This morning’s bounce will be a welcome one as cable looks to snap a 5-day losing streak. Cable has found support at the June 16 swing high around the 1.2850 handle with the ascending trendline resting below and could provide dynamic support should we see further downside.

Looking at the overarching macro picture and we could be in for further downside heading into the FOMC meeting next and ahead of the Bank of England (BoE) in early August. As market participants price in a pause from the Fed following next weeks meeting and the BoE looking poised to deliver 2 more hikes at least the medium-term outlook for cable looks promising. Any attempted pullback toward the ascending trendline should excite potential given the lineup of different confluences. The 50-day MA provides further support currently hovering around the 1.2658 mark with a daily candle close below the 1.26000 mark invalidating the bullish trend.

Key Levels to Keep an Eye On:

Support levels:

  • 1.2850
  • 1.2700
  • 1.2658 (50-day MA)

Resistance levels:

  • 1.2900
  • 1.3000 (psychological level)
  • 1.3150 (YTD High)

GBP/USD Daily Chart

image4.png

IG CLIENT SENTIMENT DATA

IGCSshows retail traders are currently SHORT on GBPUSD, with 54% of traders currently holding SHORT positions. At DailyFX we typically take a contrarian view to crowd sentiment, and the fact that traders are short suggests that GBPUSD may enjoy a short pullback before continuing to head higher toward the 1.3000 psychological level.

Dow Makes Progress and Nasdaq 100 Edges Lower, but Nikkei 225 Comes Under Pressure​​​​

Dow Makes Progress and Nasdaq 100 Edges Lower, but Nikkei 225 Comes Under Pressure​​​​

Dow Jones, Nasdaq 100, Nikkei 225 Prices, Charts, and Analysis

​​​Dow at new 2023 highs

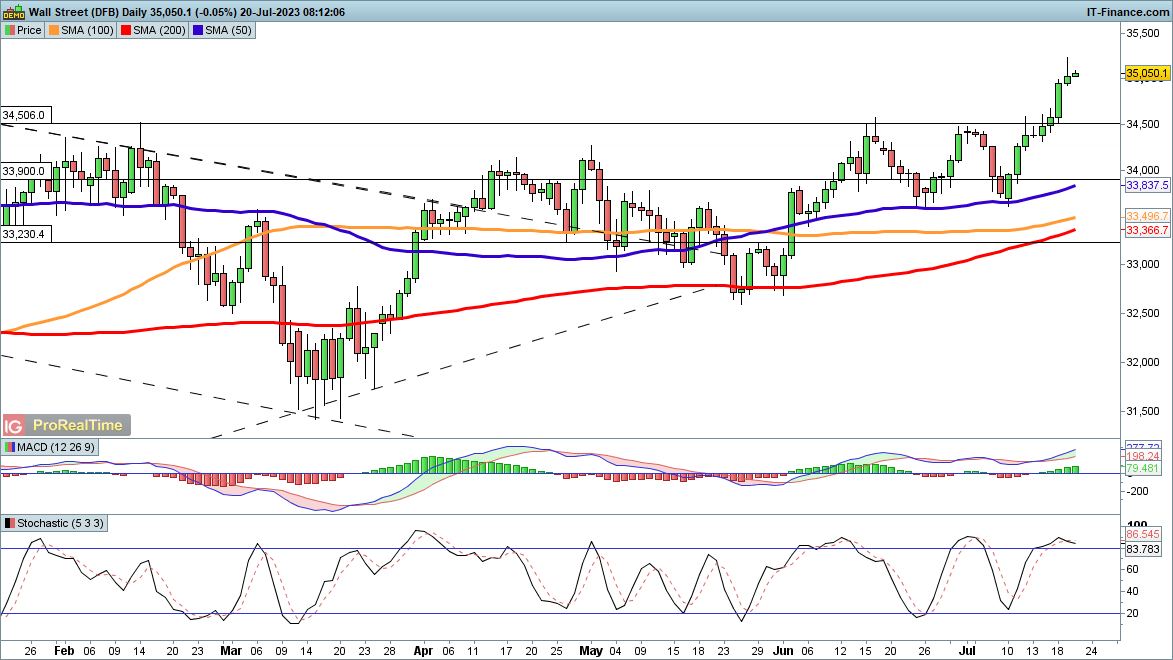
​The index surged to a new high for the year on Wednesday, as earnings continued to support the bullish view. ​Having enjoyed a strong performance over the past week, some consolidation might not be surprising, perhaps even seeing the index head back to retest 34,500 while leaving the breakout intact.

​​A close back below 34,500 might signal that another drop to the 50-day SMA was in the offing.

​Dow Jones Daily Price Chart

​Nasdaq 100 muted after Tesla and Netflix earnings

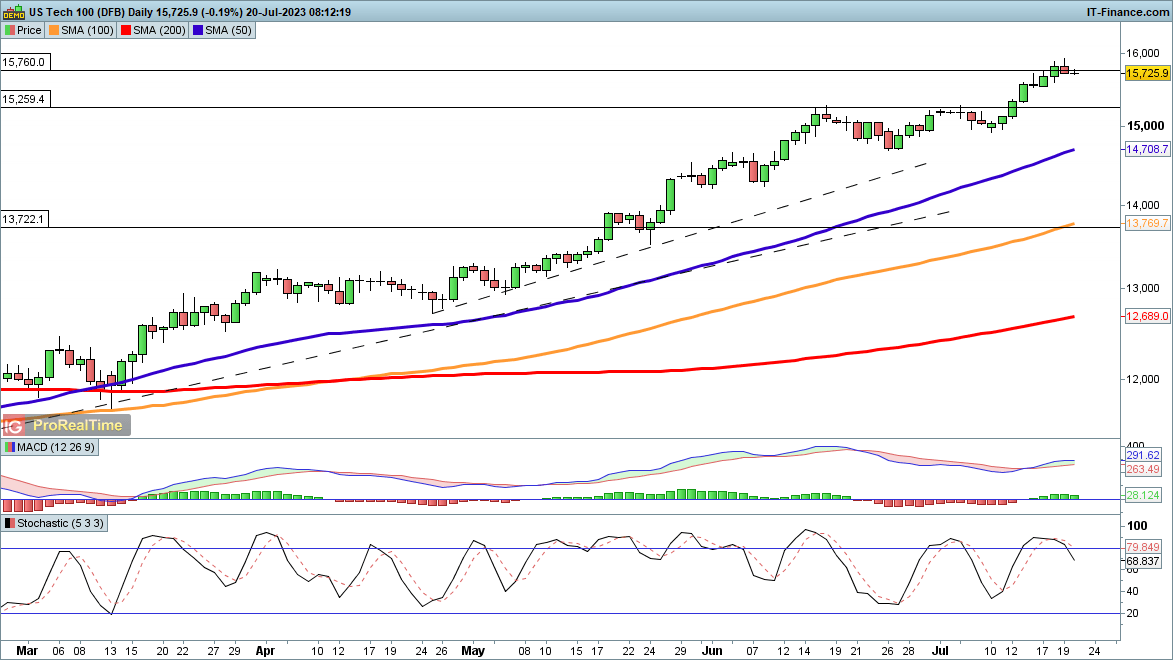
​Further strength has been seen in this index over the week so far. ​Dip buyers continue to step after the slightest weakness. The June peak was followed up by a brief drop that then turned into a new move higher. The all-time highs at 16,630 are back in play once again.

​A move back below 15,000 is needed to dent the bullish view overall.

Nasdaq 100 Daily Price Chart​

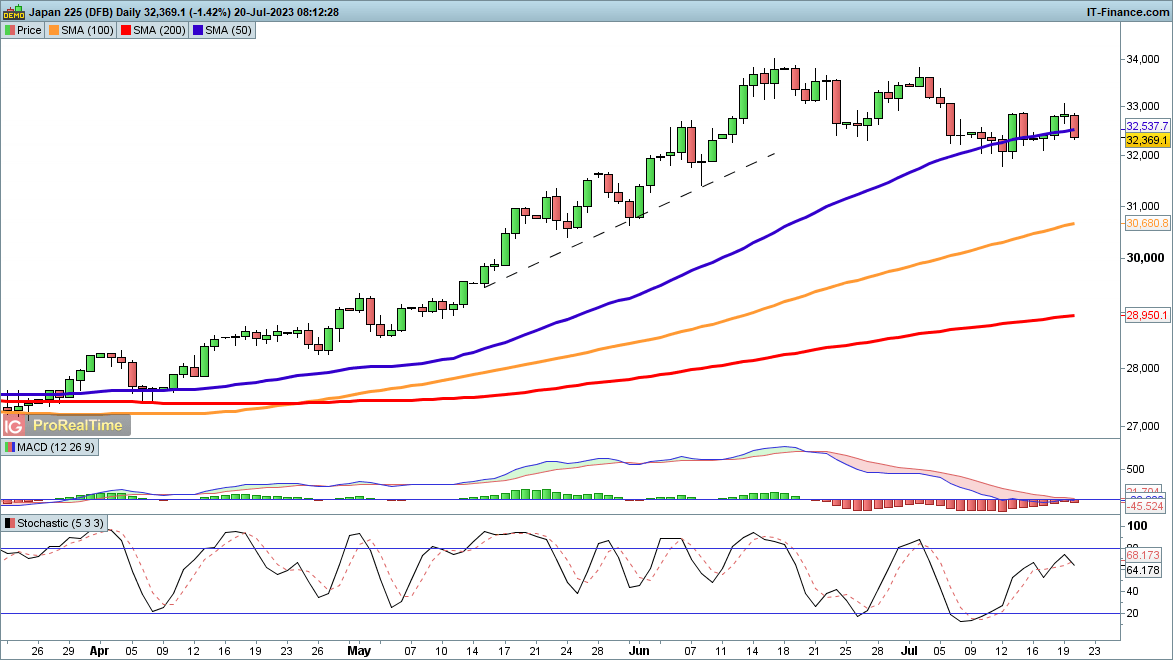
​Gains above 33,000 proved impossible to sustain on Wednesday and the index reversed course on Thursday.​The close back below the 50-day SMA would negate the bullish outlook for the time being, and would then bring 31,800 into play once more, the low from earlier in July.

​Bulls will want to see a recovery above 33,000 to suggest that a low is in place.

Nikkei 225 Daily Price Chart

Treasury Sanctions Drug Traffickers Operating Across Europe and North America

Treasury Sanctions Drug Traffickers Operating Across Europe and North America

WASHINGTON — Today, the Department of the Treasury’s Office of Foreign Assets Control (OFAC) sanctioned three Belgian nationals and one Mexican national for international drug trafficking, including cocaine and fentanyl. Those designated today are involved in the importation and distribution of narcotics destined for U.S. and European markets.

“Today’s actions underscore the importance of our collective efforts to disrupt the global illicit drug trade,” said Under Secretary of the Treasury for Terrorism and Financial Intelligence Brian E. Nelson. “Treasury, in close coordination with our law enforcement partners, will continue to target the drug facilitators that threaten the lives of hundreds of thousands in the United States and around the globe every year.”

OFAC’s actions are the result of ongoing collaboration with U.S. government partners, including the Drug Enforcement Administration’s (DEA) Belgium, San Diego, and Atlanta Field Offices.  Additionally, today’s actions were coordinated closely with the Antwerp prosecutor’s office, Federal Judicial Police Antwerp (Belgium), and the Government of Mexico’s La Unidad de Inteligencia Financiera (Mexico’s Financial Intelligence Unit).

DISRUPTING Cocaine-RELATED TRAFFICKING IN BELGIUM

Today, OFAC sanctioned three Belgian nationals, including Othman El Ballouti, who is a high-level drug trafficker, as well as his younger brother, Younes El Ballouti, and his associate, Youssef Ben Azza. Othman El Ballouti manages an international criminal organization that smuggles significant quantities of cocaine via shipping containers through the Port of Antwerp in Belgium for wider distribution throughout Europe. Othman El Ballouti’s money laundering and narcotics supply chain networks are linked to businesses based in the People’s Republic of China (PRC), as well as South American cocaine suppliers, to include Ecuadorian national Wilder Emilio Sanchez Farfan, who OFAC designated in February 2022. Sanchez Farfan was arrested in Colombia in February of this year.

Younes El Ballouti serves a manager in his brother’s narcotics trafficking organization. In January 2023, Younes El Ballouti was sentenced, in absentia, to an 8-year prison term in Belgium for his involvement in multiple drug shipments. Youssef Ben Azza, who has been involved in drug trafficking for over a decade, assists Othman El Ballouti in establishing ostensibly legitimate companies, which are created to conceal the organization’s involvement in illicit activities.

Currently, Othman El Ballouti, Younes El Ballouti, and Youssef Ben Azza are wanted by Belgian authorities for cocaine trafficking. They are believed to be living in Dubai, United Arab Emirates, in an attempt to evade prosecution. They were designated by OFAC pursuant to E.O. 14059 for having engaged in, or attempted to engage in, activities or transactions that have materially contributed to, or pose a significant risk of materially contributing to, the international proliferation of illicit drugs or their means of production.

DISRUPTING FENTANYL-RELATED TRAFFICKING IN MEXICO

Today, OFAC also sanctioned Mexican national, Franco Tabarez Martinez, a narcotics trafficker operating in Guerrero, Mexico, who works in alliance with La Nueva Familia Michoacana drug trafficking organization, which was designated by OFAC in November 2022 pursuant to E.O. 14059. Tabarez Martinez distributes cocaine, fentanyl, and methamphetamine to the United States, including Atlanta, Georgia and Houston, Texas. In addition, Tabarez Martinez manages methamphetamine laboratories in Mexico and has received fentanyl powder from the PRC.

On July 7, 2023, an indictment charging Tabarez Martinez with drug trafficking, among other charges, was unsealed in the Northern District of Georgia. Tabarez Martinez was previously imprisoned in the United States for drug trafficking.

OFAC designated Tabarez Martinez pursuant to E.O. 14059, for having engaged in, or attempted to engage in, activities or transactions that have materially contributed to, or pose a significant risk of materially contributing to, the international proliferation of illicit drugs or their means of production.

LA NUEVA FAMILIA MICHOACANA

As noted above, OFAC sanctioned La Nueva Familia Michoacana in November 2022 pursuant to E.O. 14059. La Nueva Familia Michoacana operates in approximately 35 Mexican municipalities in the states of Michoacán, Guerrero, Morelos, and the Estado de Mexico. Of note, the organization is engaged in the trafficking of various illicit drugs—including methamphetamine, heroin, cocaine, and fentanyl—from Central America to the United States, as well as the sale of rainbow fentanyl. In addition to drug trafficking, La Nueva Familia Michoacana generates revenue from other illicit activities, such as illegal mining and extortion.

La Nueva Familia Michoacana is the successor of the original La Familia Michoacana, which was originally designated in 2009 pursuant to the Foreign Narcotics Kingpin Designation Act, and designated again in December 2021 pursuant to E.O. 14059.

SANCTIONS IMPLICATIONS

As a result of today’s action, all property and interests in property of the designated individuals and entities that are in the United States or in the possession or control of U.S. persons must be blocked and reported to OFAC. In addition, any entities that are owned, directly or indirectly, 50 percent or more by one or more blocked persons are also blocked. OFAC’s regulations generally prohibit all dealings by U.S. persons or within the United States (including transactions transiting the United States) that involve any property or interests in property of designated or otherwise blocked persons.

These actions are the latest part of a whole-of-government effort by the Biden-Harris Administration to combat the illicit opioid epidemic, including by going after the criminal networks manufacturing and trafficking illicit fentanyl. In addition to sanctions, the United States brought together almost 100 countries and international organizations to form a Global Coalition to Address Synthetic Drug Threats and has partnered with law enforcement around the world to disrupt and dismantle transnational criminal organizations, as well as providing support to more than 20 million Americans in recovery, and offering over 30 rewards—totaling over $75 million—for information to help bring fentanyl traffickers to justice through the Narcotics and Transnational Organized Crime Rewards Programs.

Treasury’s action demonstrates the Administration’s strengthened approach to saving lives by disrupting the trafficking of illicit fentanyl and its precursors into American communities. OFAC, in coordination with its U.S. Government partners and foreign counterparts, will continue to target and pursue accountability for foreign illicit drug actors.

In addition, persons that engage in certain transactions with the individuals and entities designated today may themselves be exposed to sanctions or subject to an enforcement action.

The power and integrity of OFAC sanctions derive not only from OFAC’s ability to designate and add persons to the Specially Designated Nationals and Blocked Persons List (SDN List), but also from its willingness to remove persons from the SDN List consistent with the law. The ultimate goal of sanctions is not to punish, but to bring about a positive change in behavior.

Japan posts 1st trade surplus in nearly 2 yrs in June

Japan posts 1st trade surplus in nearly 2 yrs in June

TOKYO (Kyodo) — Japan posted a 43 billion yen ($300 million) trade surplus in June, returning to the black for the first time in nearly two years amid robust U.S.-bound exports and falling energy import costs, government data showed Thursday.

For the first six months of 2023, resource-poor Japan ran a trade deficit of 6.96 trillion yen, though it was almost 13 percent lower than a year ago.

In June, robust U.S. demand for cars and construction machinery boosted Japan’s overall exports by 1.5 percent to 8.74 trillion yen, the largest ever for the month. Imports dropped 12.9 percent to 8.70 trillion yen as those of crude oil, coal and liquefied natural gas all fell.

Exports tend to rise in June after overseas shipments slow in May when Japan has its Golden Week holiday period, according to analysts.

“It’ll be difficult for export growth to accelerate when demand from China as well as the United States and Europe is all expected to stagnate,” said Kota Suzuki, an economist at Daiwa Securities.

“China’s recovery, in particular, has been slower than previously expected and it’s unlikely that increased China-bound shipments will drive growth in Japanese exports,” he added

Japan’s trade surplus with the United States expanded 37.4 percent to 817.50 billion yen as exports rose 11.7 percent to 1.74 trillion yen, a record for June, the Finance Ministry said in a preliminary report.

Imports slipped 4.2 percent to 921.29 billion yen as those of crude oil and wheat fell.

The country had a trade deficit of 442.83 billion yen with China, down 7.6 percent, as exports fell more than imports due to slackening demand for steel and chips in the world’s second-largest economy.

Japan’s trade balance with the rest of Asia came to its first surplus in two months of 280.80 billion yen while a trade deficit of 26.24 billion yen was reported with the European Union.

Japan has been at the mercy of surging energy import costs that have been magnified by the yen’s weakness. The dollar has been strong against the yen, reflecting the widening interest rate gap between the United States and Japan.

Crude oil prices dropped 25.0 percent in June from a year ago in yen terms.

“The value of imports will likely be on a downtrend in line with falling commodity prices while export growth slows. In such an environment, Japan will likely report trade deficits going forward,” Suzuki added.

Ongoing monetary tightening by the United States and other major economies has fueled worries about a global economic slowdown, which would be a blow to Japanese exporters that form the backbone of the world’s third-largest economy.

For the first half of 2023, exports gained 3.1 percent to 47.35 trillion yen, buoyed by cars, construction machinery and ships. Imports rose 0.7 percent to 54.31 trillion yen, with coal a major contributor.

Japan’s first-half trade surplus increased 20.7 percent to 3.49 trillion yen with the United States while it saw a roughly 1.5-fold increase in its trade deficit to 3.65 trillion yen with China, according to the ministry data.

China’s state banks seen selling US dollars offshore to slow yuan declines

China’s state banks seen selling US dollars offshore to slow yuan declines

SHANGHAI : China’s major state-owned banks were seen selling dollars to buy yuan in the offshore spot market in early Asian trades on Thursday, two people with direct knowledge of the matter said.

Such state bank dollar selling was meant to slow the pace of yuan declines, one of the sources said.

China’s central bank on Thursday also announced a relaxing of a cross-border financing rule, making it easier for domestic firms to raise funds from overseas markets and easing depreciation pressure on the yuan currency.

China’s offshore yuan strengthened more than 0.7 per cent to a high of 7.1812 per dollar before last trading at 7.1890 as of 0249 GMT.

In the onshore market, the yuan followed a similar upward bounce, but it is still down about 4 per cent against the dollar year-to-date, making it one of the worst performing Asian currencies for 2023.

Reports that China is considering easing mortgages – to help the property sector

Reports that China is considering easing mortgages – to help the property sector

Chatter about the place, no further details at this stage but if true would be supportive of risk assets at the margin.

The aim would be to spur residential property buying to help prop up the troubled sector.

Added – ok here we go, a little more (info via Bloomberg, gated):

  • Regulators are weighing scrapping rules that disqualify people who’ve ever had a mortgage – even if fully repaid – from being considered a first-time homebuyer in major (tier-1) cities
  • Currently homebuyers with a mortgage record who don’t own a property are still subject to the higher down-payment and more restrictive borrowing limits applied to those buying a second home.
china property 06 January 2023
EUR/USD Price Forecast: Euro Fading Into Central Bank Week?

EUR/USD Price Forecast: Euro Fading Into Central Bank Week?

EURO FUNDAMENTAL BACKDROP

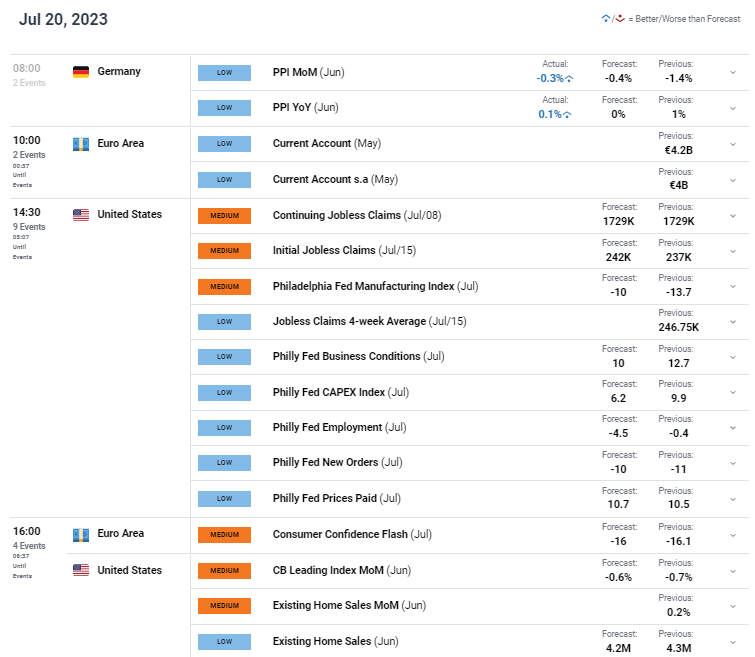
The euro picked up some support ahead of the European session as German PPI data (see economic calendar) beat estimates that could point to continued inflationary pressures within the German economy. This falls in line with yesterday’s CPI report but the tone set out by ECB officials seems to be more dovish as economic growth concerns in the region ramp up.

EUR/USD ECONOMIC CALENDAR (GMT +02:00)

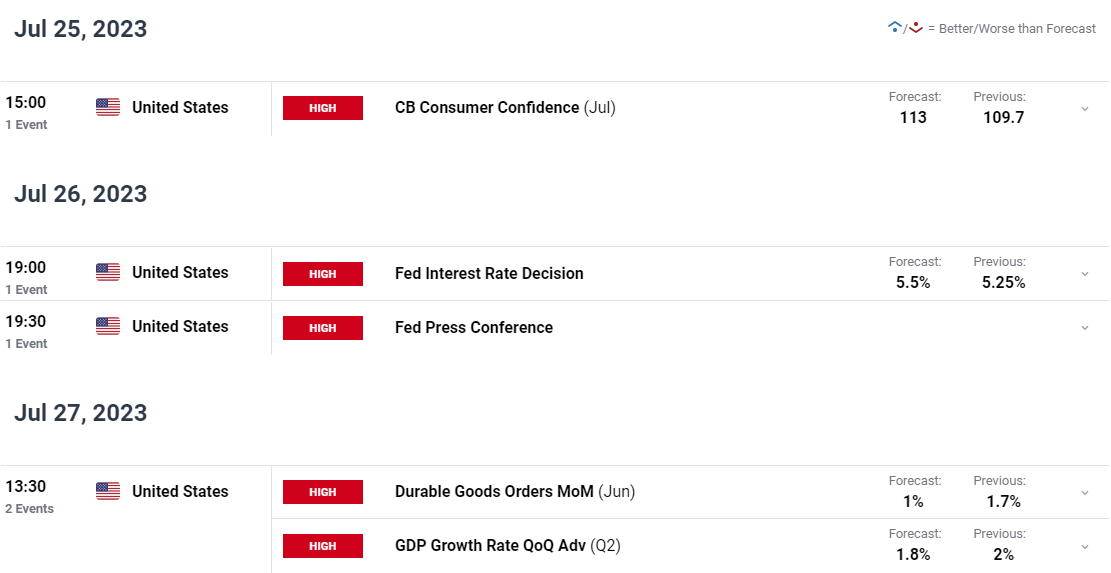
image1.png

With roughly two additional interest rate hikes expected (see below) between now and year end, the likelihood of a 25bps increment next week is almost certain. What markets will focus on is forward guidance post-July which could provide some clarity as to the ECB’s thinking and where to next for EUR/USD. The ECB’s Governing Council member Yannis Stournaras already stated that the eurozone may not be able to withstand further monetary policy tightening after July leaving the door open for a weaker euro should this come to fruition.

Later today, US jobless claims and EZ consumer confidence data will drive interest and add yet another notch to the overall economic picture for the respective regions.

EUROPEAN CENTRAL BANK INTEREST RATE PROBABILITIES

image2.png

TECHNICAL ANALYSIS

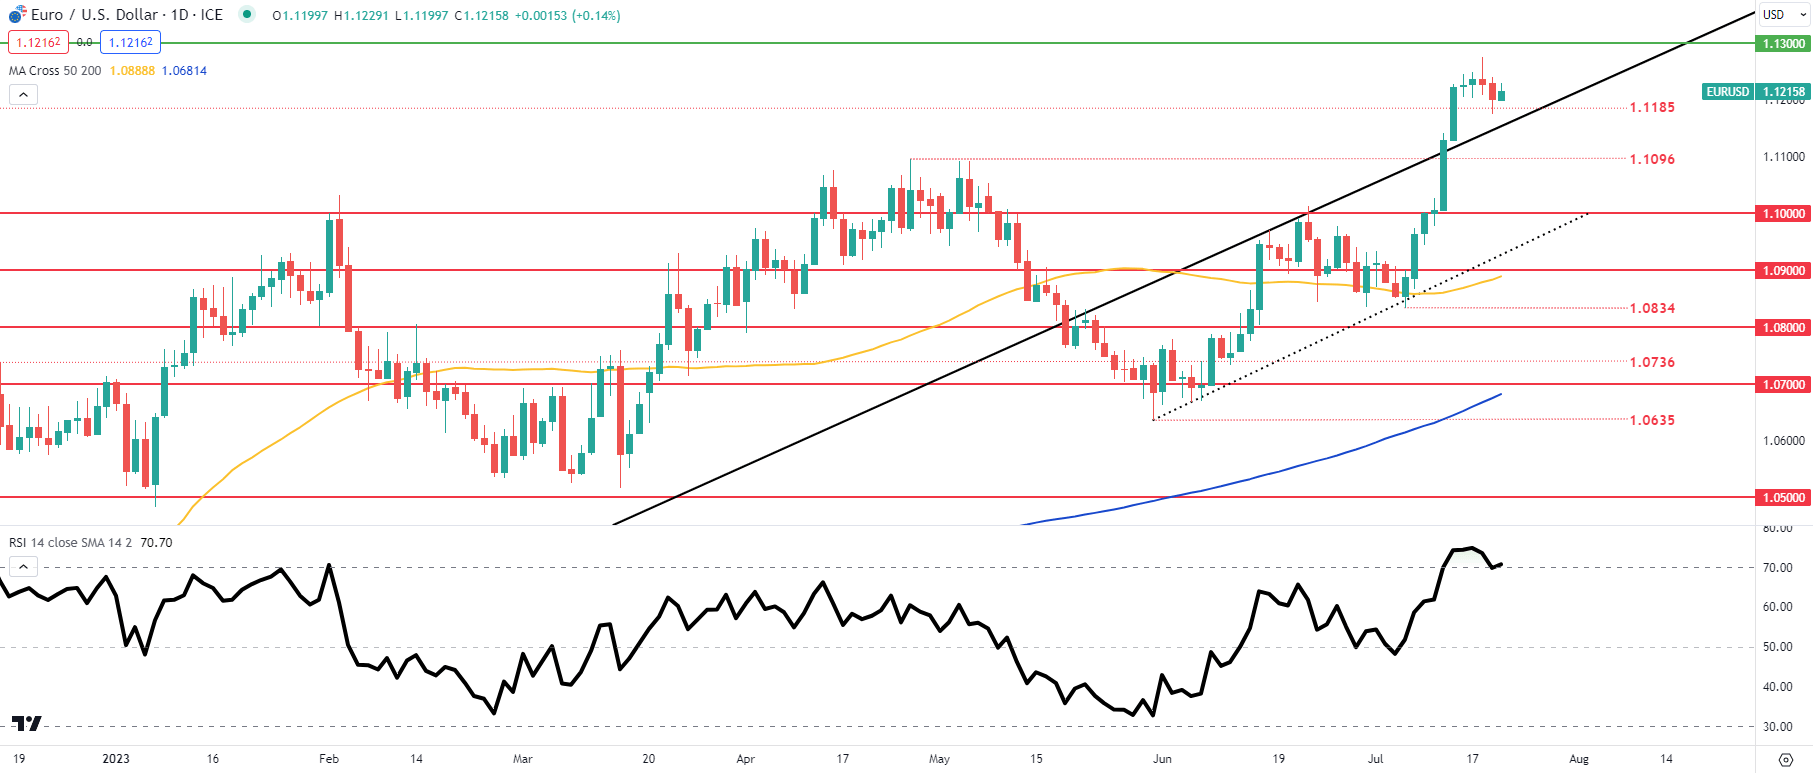
EUR/USD DAILY CHART

image3.png

Daily EUR/USD price action hovers around overbought territory as indicated by the Relative Strength Index (RSI) and with recent candlesticks including today’s early movement shows long upper wicks that could hint and impending downside to come.

Resistance levels:

  • 1.1300

Support levels:

  • 1.1185
  • 1.1096
  • 1.1000

IG CLIENT SENTIMENT DATA: MIXED

IGCS shows retail traders are currently SHORT on EUR/USD, with 75% of traders currently holding short positions (as of this writing). At DailyFX we typically take a contrarian view to crowd sentiment but due to recent changes in long and short positioning we arrive at a short-term cautious bias.