Is Canadian Dollar Getting Ripe for a Bounce? USD/CAD, EUR/CAD, GBP/CAD Price Action

Is Canadian Dollar Getting Ripe for a Bounce? USD/CAD, EUR/CAD, GBP/CAD Price Action

The Canadian dollar looks set to resume its rise against some of its peers, thanks to a still-hawkish Bank of Canada (BoC) and a potential base building in oil prices.

BoC hiked its key overnight rate by 25 basis points to a 22-year high of 5.0% last week and left the door open for further tightening as it doesn’t expect inflation to return to its 2% target before the middle of 2025. Headline inflation slowed to 2.8% on-year in June from last year’s high of over 8%.

BoC’s preferred measures of core inflation, CPI-median, and CPI-trim, however, continue to remain sticky at 3.8% and 3.9% respectively. Markets are pricing in around 20% odds of another rate hike at its next meeting in September.

CAD has lagged in the recent rally in commodity currencies but has the scope to rise. Besides, a still-hawkish BoC, CAD has also been supported by a potential base building in oil prices as OPEC+ output cuts start to spill over. As a result, speculative positioning in CAD has turned to longs for the first time since late 2022. Moreover, technical charts agree.

USD/CAD Daily Chart
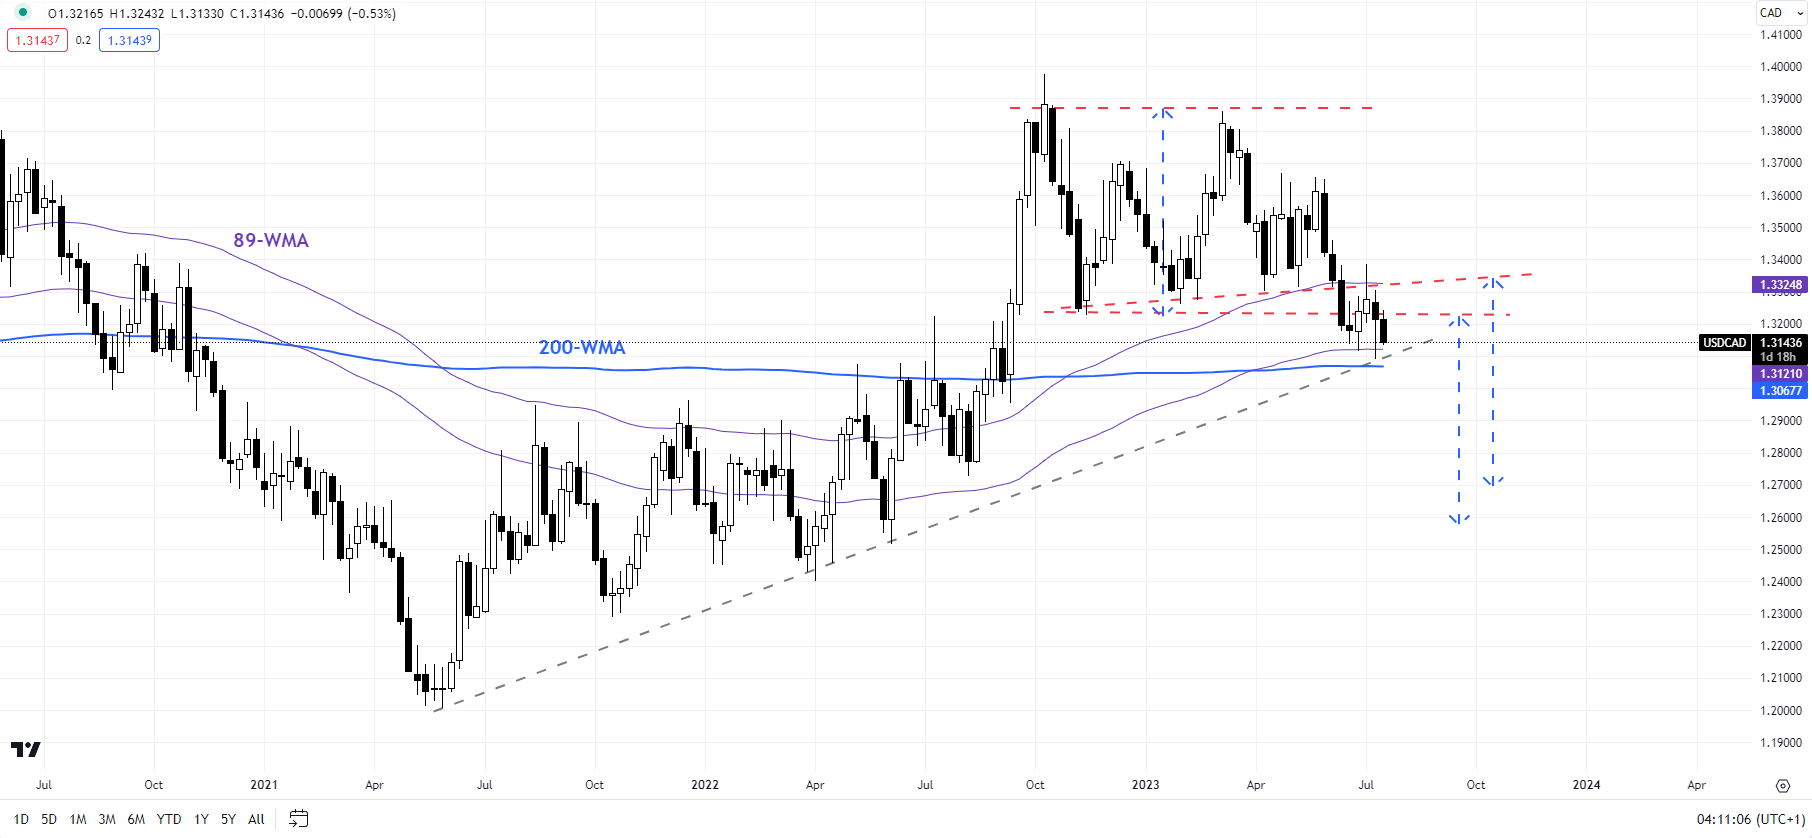
image1.png

USD/CAD: Looming bearish break

USD/CAD’s minor rebound appears to be running out of steam, as highlighted in the previous update. See “Q3 Top Trade: Canadian Dollar Could Rise Further Against the US Dollar in the Third Quarter,” published July 5. The fall last week below the early-July low has opened the door for further weakness in USD/CAD. That’s because the pair’s fall in June below vital converged support around 1.3220-1.3320 has initially opened the gates toward the psychological 1.3000, potentially toward the August low of 1.2725.

GBP/CAD Daily Chart
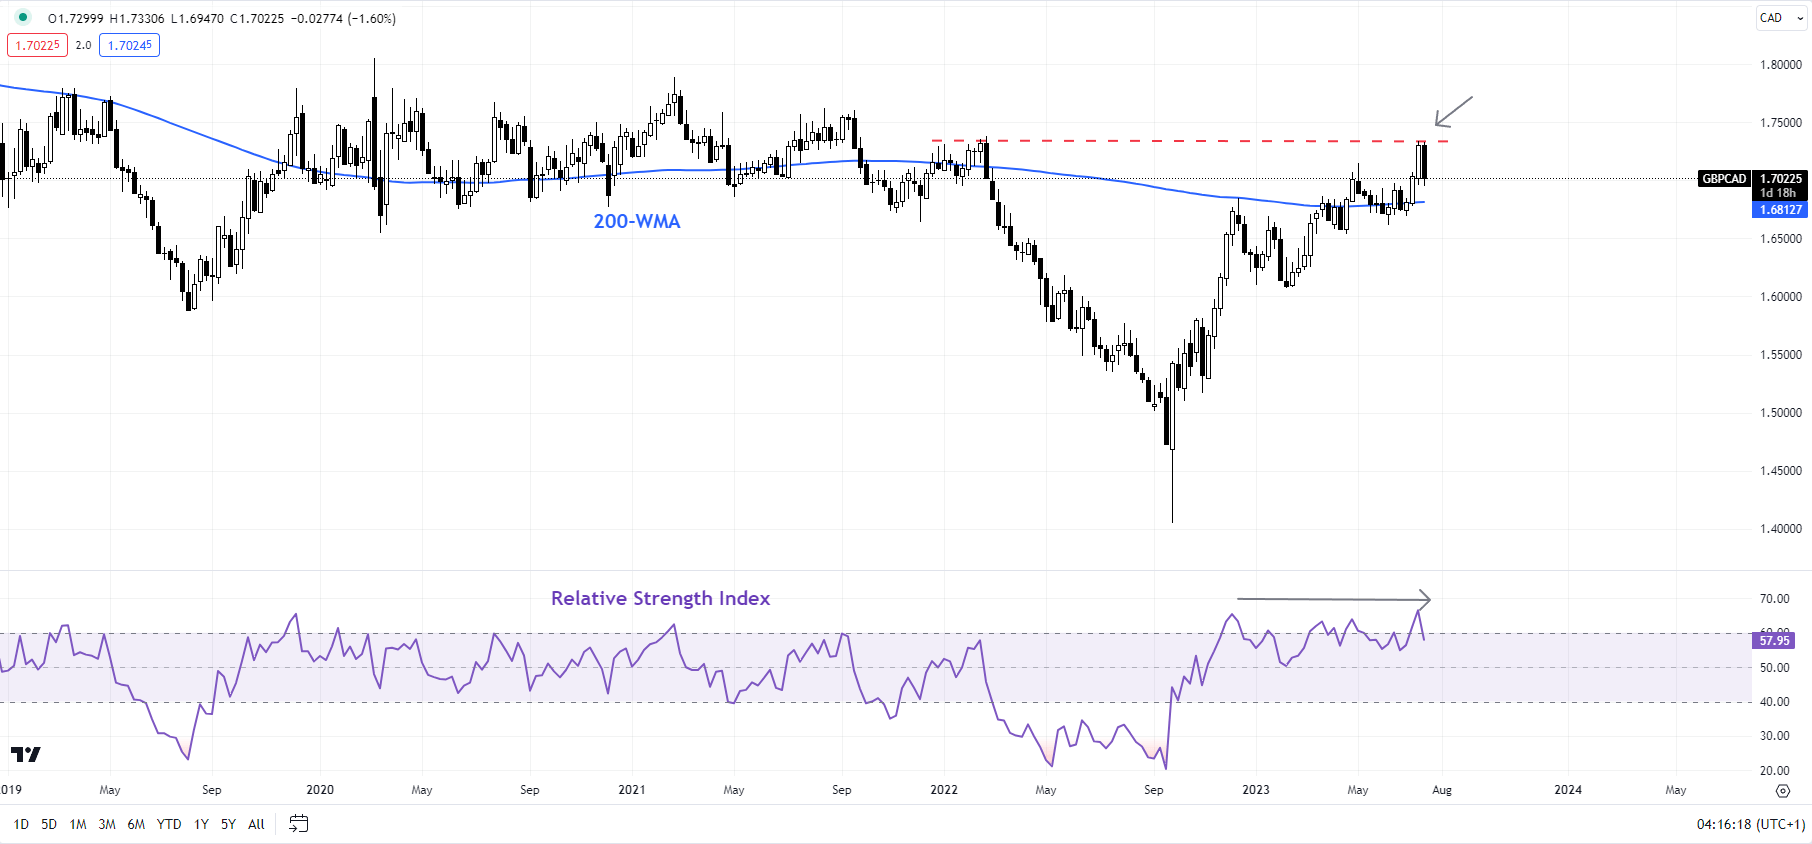
image2.png

GBP/CAD: Stiff barrier ahead

GBP/CAD’s rally has succumbed to resistance at the early-2022 high of 1.7375, slightly above major resistance on the 200-week moving average. Moreover, the retreat below immediate support at the May high of 1.7140 suggests the bullish pressure has faded in the short term. The odds of a drop toward the June low of 1.6620 are rising.

EUR/CAD Daily Chart
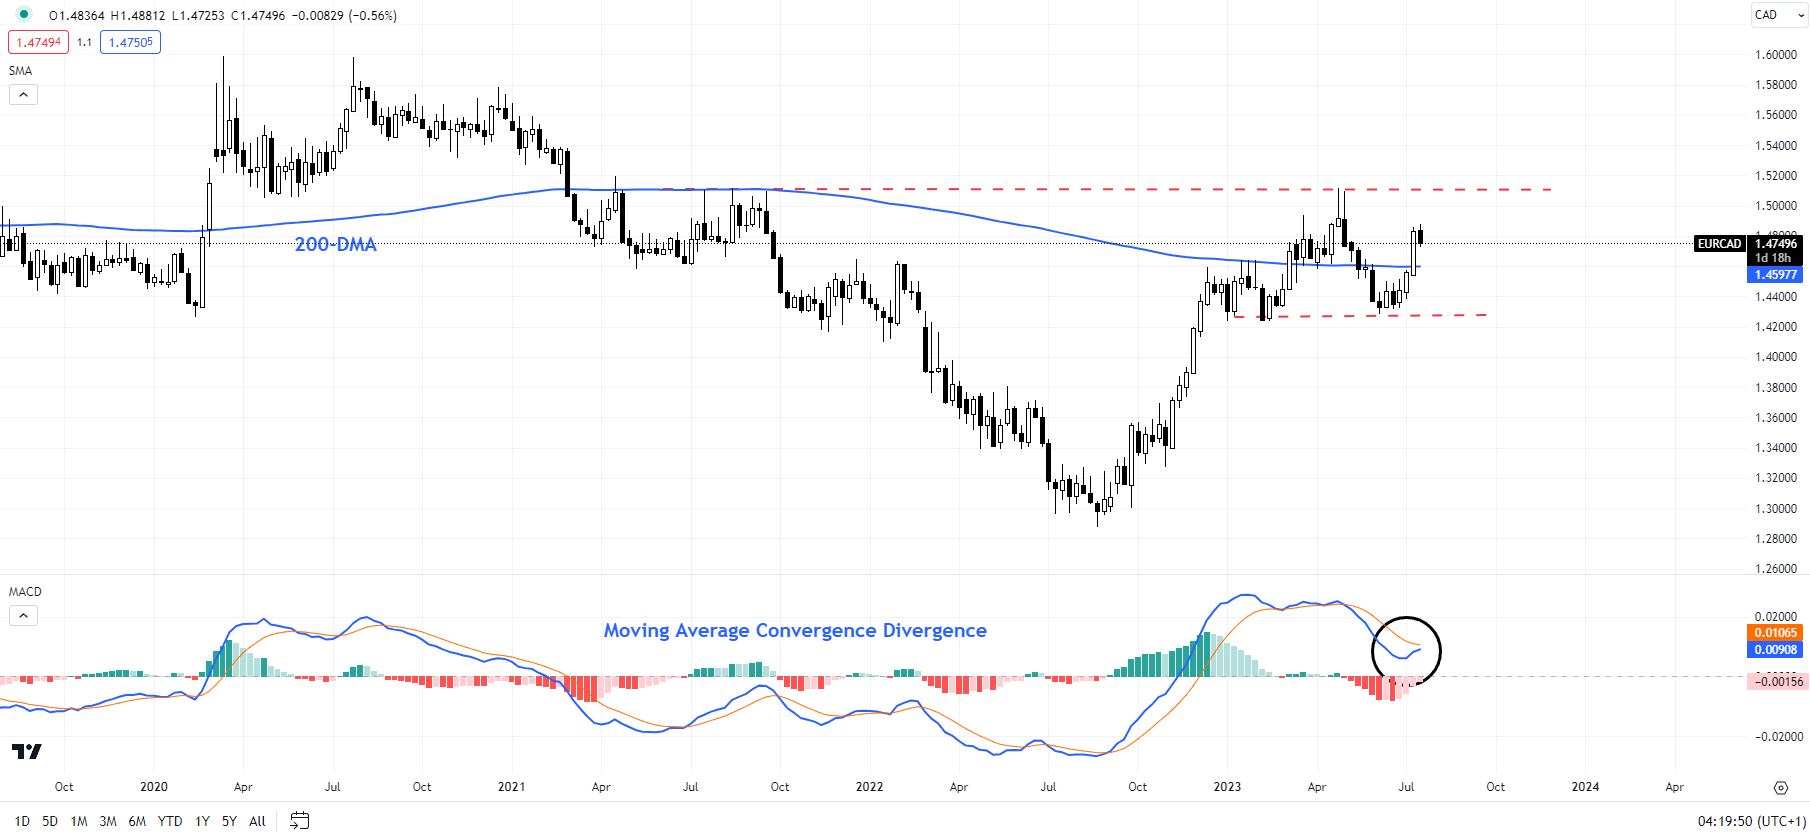
image3.png

Chart Created Using TradingView

EUR/CAD: Feeble momentum on the rebound

EUR/CAD’s rebound from June has lacked steam – the Moving Average Convergence Divergence (MACD) indicator has barely budged even as the cross is near its 18-month high of 1.5100. The lack of upward momentum is a sign that the cross’ multi-month rally is showing signs of fatigue. This follows a failed attempt to rise past a tough hurdle at the late-2021 high of 1.5100. A retreat back toward the June low of 1.4280 can’t be ruled out.


Top Trading Opportunities in Q3

Top Trading Opportunities in Q3
Recommended b
Moneta Markets Expands to Dubai, Aims to Dominate Middle East Financial Brokerage Market

Moneta Markets Expands to Dubai, Aims to Dominate Middle East Financial Brokerage Market

This milestone marks the start of an exciting new chapter as Moneta Markets seeks to become a major financial brokerage player in the Middle East region.

Moneta Markets Founder and CEO David Bily commented on the company’s growth, “We are incredibly proud to announce that Moneta Markets is spreading its wings into Dubai. Securing an operational license in this vibrant global business hub is a significant step forward in our ambition to offer unparalleled brokerage services worldwide. This development not only enriches our global footprint but also underpins our commitment to being a locally embedded partner to our clients across regions.”

In line with this expansion, Moneta Markets will be relocating key members of its management team to Dubai. The move is part of a larger strategic plan aimed at cultivating strong regional relationships, growing its presence, and ultimately establishing itself as a top brokerage firm in the Middle East.

David adds, “Our decision to move key management to Dubai signifies the importance we attach to this region. We believe that having a local presence will enable us to better understand and serve the unique needs of our clients here.”

In addition, Moneta Markets is committed to fostering local talent and contributing to Dubai’s growing status as a global financial powerhouse. The company will soon launch a comprehensive recruitment drive to attract the brightest minds in the region.

“We see tremendous potential in Dubai’s talented pool of industry professionals. By recruiting top local talent, we aim to build a team that understands the pulse of the region, and thereby ensure we provide the best-in-class services that Moneta Markets is known for. If you’re in the area and reading this, and have experience as a BDM or Country Manager in the FX industry, I encourage you to reach out via LinkedIn for a chat about how we can work together,” said David.

Moneta Markets is excited about this new journey and looks forward to shaping the financial brokerage landscape in Dubai and the wider Middle East region.

USDJPY resumes advance; prepares to test a key resistance area

USDJPY resumes advance; prepares to test a key resistance area

USDJPY is trading higher again today following a significant correction that muted the growing intervention talk. The pair is preparing to enter a very busy area as the bulls are trying to regain market control and take advantage of the continued simple moving averages (SMAs) convergence for their own benefit. 

The momentum indicators appear to be mostly on the bulls’ side at this stage. The Average Directional Movement Index (ADX) is edging lower today, confirming a much weakened bearish trend in the market but still remaining at elevated levels compared to its recent history. Crucially, the stochastic oscillator is attempting to break above both its oversold territory and moving average. If successful, a strong bullish signal will be sent.


Having said that, the bulls are ready for another upleg. They would have to clear the resistance set by the lower boundary of the recent upward trend channel and the busy 139.38-140.37 area. This is populated by the July 14, 2022 high, the 23.6% Fibonacci retracement level of the March 9, 2022 – October 21, 2022 uptrend and the 50-day SMA. The path then looks clear until the September 7, 2022 high at 144.99.


On the flip side, the bears are trying to avoid a return to the recent USDJPY highs. They appear willing to defend the 139.38-140.37 range and, if successful, stage a move towards the 136.88-137.00 area that is defined by the 100- and 200-day SMAs. Even lower, the January 31, 2002 high at 135.19 is unlikely to trouble them.


To sum up, the bulls are trying to reassert their dominance, but the stochastic oscillator’s next move will play a key role in the next USDJPY leg. 

Bitcoin lagging gold despite weakening dollar: A Bitcoin, gold, USD analysis

Bitcoin lagging gold despite weakening dollar: A Bitcoin, gold, USD analysis

The dollar continues to get hammered.

After dominating virtually every currency throughout the COVID pandemic, the DXY index, which measures the strength of the greenback against a basket of major currencies, hit a twenty-year high in Q4 of last year. Since then, however, it has shed 12.5% of its value.

The fall comes as inflation continues to cool, with the most recent CPI data putting year-over-year inflation at 3%. While core inflation remains a little stickier, the market is nonetheless betting that one of the fastest rate-hiking cycles in recent history is finally coming to a close.

Why did the dollar perform so well during the pandemic? The dollar strengthens in times of uncertainty because correlations go to one in a crisis, while there is a flight to safety as investors peel back on the risk curve. And there is no safer asset than the global reserve currency, so the dollar picks up steam in such turbulent periods. In the next chart, I have plotted the dollar’s performance between 1972 and 2022 with periods of recession highlighted, demonstrating its stout performance during such pullbacks.

While the last couple of years do not quantify as a recession, the turbulent climate which has arisen out of rampant inflation and spiking interest rates (not to mention a once-in-a generation global pandemic and all the bespoke economic fallout that entailed) has caused mass uncertainty. This in turn has increased the attractiveness of the dollar.

Additionally, the faster pace of interest rates in the US compared to many nations worldwide has encouraged capital to flow into the greenback. But with inflation cooling off and the market betting the rate hiking cycle is now nearing its conclusion, the climate has changed – and the dollar has pulled back as a result.

How are other assets affected by the dollar?

This is all relatively straight-forward, but what does this mean for other assets?

Well, as mentioned above, the dollar is the global reserve currency, meaning it is also the lifeblood of the global financial system. In such a way, the effects are widespread. If we look at the classic example of gold, a falling dollar means it takes more dollars to purchase the same amount of gold (and vice-versa). So we tend to see gold rise when the dollar falls, even if it may be nothing to do with gold itself.

In the next chart, I have plotted the correlation between the dollar index and gold over the last year, which shows a strong negative relationship in the -0.8 to -0.9 range for much of the period (albeit with a recent weakening).

Let’s now look at Bitcoin, gold’s wannabe best friend. Below I have added Bitcoin’s relationship to the dollar index onto the previous chart. We see a similar pattern but it is more prone to bouts of volatility and periodic breaks in the relationship. With Bitcoin far more volatile as an asset than gold, and given the numerous crypto-specific scandals (Terra, Celsius, FTX etc) of the past year, this is unsurprising.

In general, while the relationship may not be as symbiotic as it is for gold, it is fair to say that there has been somewhat of a negative correlation between Bitcoin and the dollar over the past year. Additionally, the pattern has followed gold’s correlation.

Until this week, that is. On the tail end of the prior chart, gold and Bitcoin’s relationship with gold have moved in opposite directions. I have zoomed in on this timeframe below to show it in more detail:

China-US trade war slows down a bit – baby steps?

China-US trade war slows down a bit – baby steps?

In a bid to ease tensions with Beijing, the United States will limit the scope of its coming investment curbs against China to the semiconductor, artificial intelligence and quantum computing sectors – not extending those sanctions into biotechnology and clean energy industries.

The restrictions will be “narrowly targeted”; they will not be broad controls that would affect US investment broadly in China or have a fundamental impact on the investment climate for China, US Treasury Secretary Janet Yellen said in an interview with Bloomberg Television on Monday.

Bloomberg reported that the investment curbs against China will be announced by the end of August but won’t take effect until next year as “the policy grinds through Washington’s bureaucracy.”

The tone of the response from Chinese officials, while far from enthusiastic, is milder than that of Beijing’s response on April 21, which called the US “selfish” and its move a “blatant act of economic coercion and sci-tech bullying.”

“China opposes US politicizing and weaponizing of trade and tech issues,” Mao Ning, a spokesperson at China’s Foreign Ministry said on Tuesday. “It is in no one’s interest to place arbitrary curbs on normal technology cooperation and trade, violate the market economy principles and destabilize global industrial and supply chains.”

Mao said China hopes that the US will follow through on President Joe Biden’s commitment of not seeking to “decouple” from China, halt China’s economic development or contain China. It should create a sound environment for China-US economic cooperation and trade, Mao said.

The Semiconductor Industry Association (SIA), representing the US chips industry, in a statement called on both the Chinese and US governments to ease tensions and seek solutions through dialogue.

“Repeated steps to impose overly broad, ambiguous, and at times unilateral restrictions risk diminishing the US semiconductor industry’s competitiveness, disrupting supply chains, causing significant market uncertainty, and prompting continued escalatory retaliation by China,” said the SIA.

XAU/USD Price Forecast: Gold Seeks Fundamental Catalyst

XAU/USD Price Forecast: Gold Seeks Fundamental Catalyst

XAU/USD FUNDAMENTAL BACKDROP

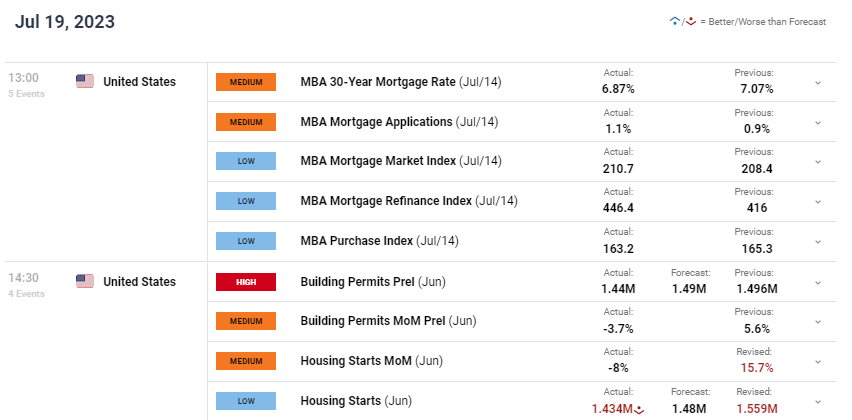
Gold prices are relatively muted this Wednesday after yesterday’s rally as markets mull over weakening US economic data this week in the form of retail sales and building permits (see economic calendar below). Mortgage applications supplemented the current dovish slant with recent figures slipping further due to the Fed’s aggressive monetary policy.

GOLD ECONOMIC CALENDAR (GMT +02:00)

image1.png

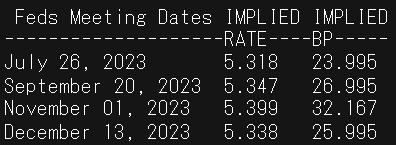
This brings into question the likelihood of another rate hike by the Federal Reserve next week. Currently, money market are favoring a 25bps hike with 96% probability (refer to table below) but may well move closer towards a 50/50 split considering recent data. With no additional economic data scheduled for today, there may be more rangebound moves evident.

FEDERAL RESERVE INTEREST RATE PROBABILITIES

image2.png

TECHNICAL ANALYSIS

GOLD PRICE DAILY CHART

image3.png

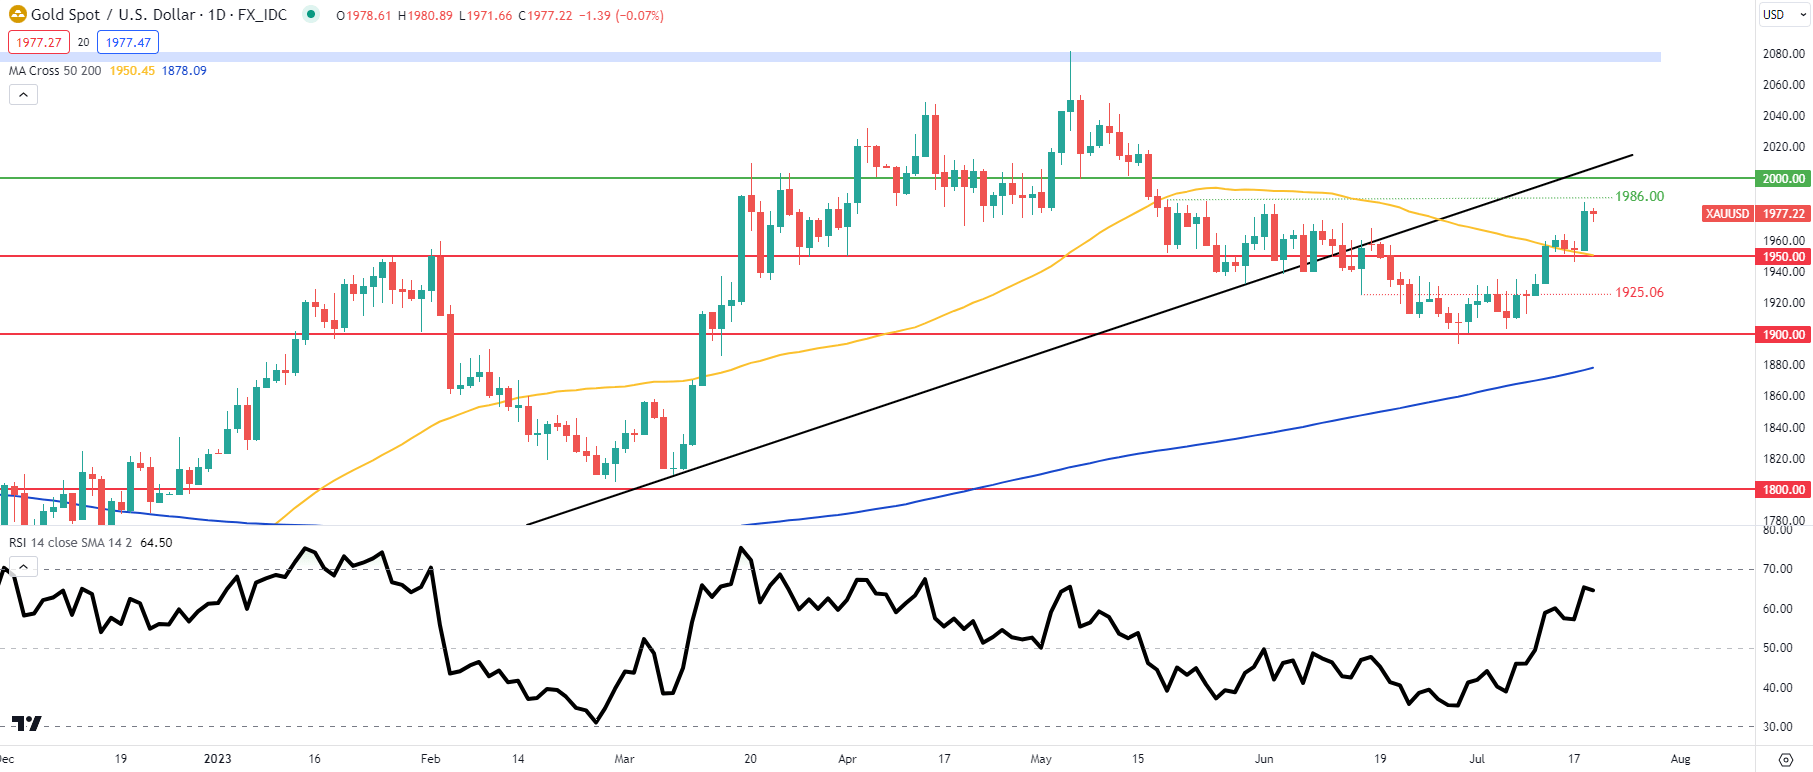
XAU/USD price action is looking to push up towards the 1986.00 swing high in mid-May. Prices are above the 50-day moving average (yellow), favoring short-term bullish momentum. The Relative Strength Index (RSI) is nearing overbought levels so there is still room for further upside to come but traders should be wary closer to the 2000.00 psychological mark.

Resistance levels:

  • 2000.00
  • 1986.00

Support levels:

  • 1950.00/50-day moving average

IG CLIENT SENTIMENT: BULLISH

IGCS shows retail traders are currently distinctly LONG on gold, with 62% of traders currently holding long positions (as of this writing). At DailyFX we typically take a contrarian view to crowd sentiment but due to recent changes in long and short positioning, we arrive at a short-term upside disposition.

Dollar Index (DXY) Eyes Deeper Recovery with USD/CHF at 12-Year Lows

Dollar Index (DXY) Eyes Deeper Recovery with USD/CHF at 12-Year Lows

US DOLLAR BACKDROP

The US Dollar and Dollar Index (DXY) has been hovering around last week’s lows for the majority of the week thus far before edging higher today above the 100.00 mark. Mixed data out of the US yesterday coupled with positive US earnings by and large has seen the dollar remain supported. Surprising though as I would have expected further selling pressure on the USD should equities continue their advance.

READ MORE: Retail and Institutional Sentiment in EUR/USD and GBP/USD Diverges Further

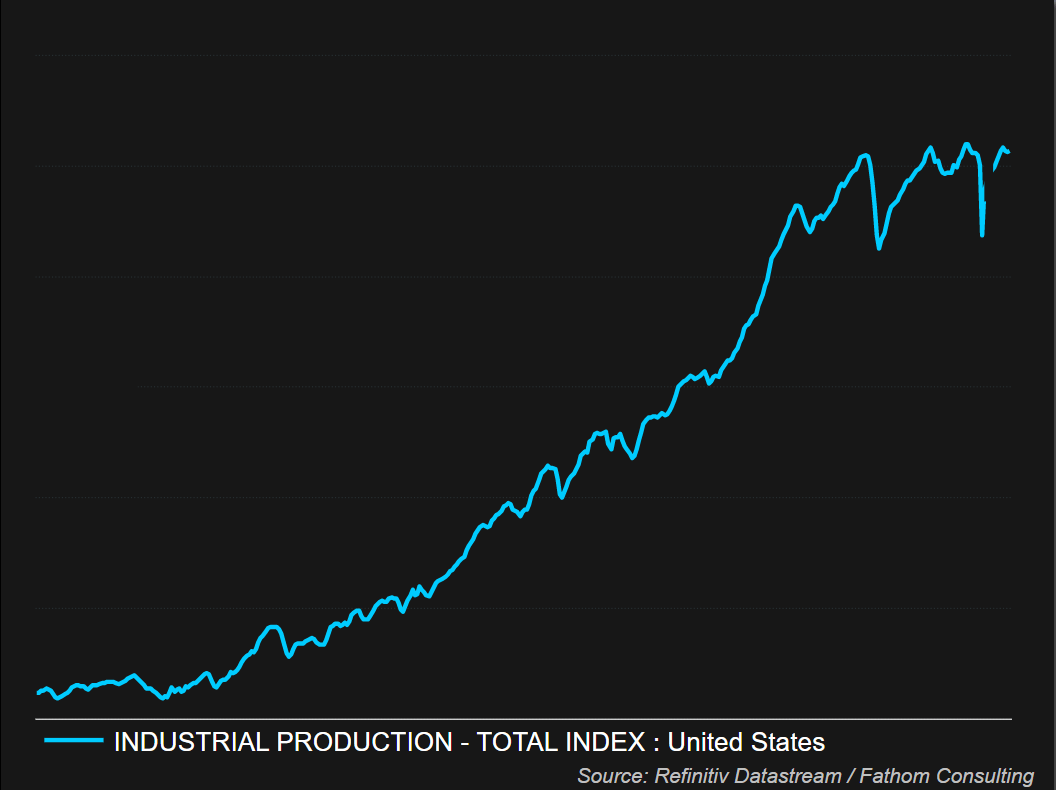
June’s headline retail sales data came in below estimates yesterday, however it is important to note that the control group which excludes volatile components came in above forecasts, with a print of 0.6% MoM. Industrial production was the concern however, falling more than expected MoM providing further evidence of a slowdown in the US economy.

image1.png

At the moment we are seeing sigs across the board of a slowdown in the US economy with US employment data the last point of contention. Unemployment improved over the past month with a 0.1% decrease back to 3.6% with average hourly earnings remaining robust. Market participants will no doubt have noticed the similarities between developed economies with the UK in particular struggling with wage growth as well.

As attention slowly begins to shift to next week FOMC meeting markets appear resigned to a 25bps hike by the Fed with the majority of that priced in already. More important to the DXY direction moving forward is actually where market participants see rates peaking from the US Federal Reserve with some of the opinion that a July hike will be the last hike of the current cycle. We have seen constant repricing of probabilities in this regard with markets growing ever more sensitive to data releases the closer we get to the Feds peak rate. Following once of the most aggressive hiking cycles in history are we really approaching the end? Only time will tell.

image2.png

USD/CHF OUTLOOK

The Swiss Franc has been on an impressive run against the greenback which stretches back to November 2022 when USD/CHF traded just above the 1.0000 level. Since then, the pair has been on an aggressive decline currently trading at levels last seen in 2011 (discounting the 2015 spike). A large portion of the move has been down to the haven appeal of the Swiss Franc as market participants feared a recession may be on its way in the second half of 2023. Comments from the Swiss National Bank (SNB) regarding potential FX intervention had also added further to the franc and its continued resilience in 2023.

It will be interesting to see how this pair develops from a macro standpoint moving forward as the potential for a ‘soft landing’ (which should see risk-on sentiment rise) grows. Having said that the Dollar is also expected to face selling pressure as it has largely benefitted from safe haven appeal as well with market participants likely to pivot back into equities should the overall environment continue to improve. Are we in for an extended period of consolidation in USDCHF for the remainder of 2023? We will take a closer look at the technical which might give us a better picture.

ECONOMIC CALENDAR

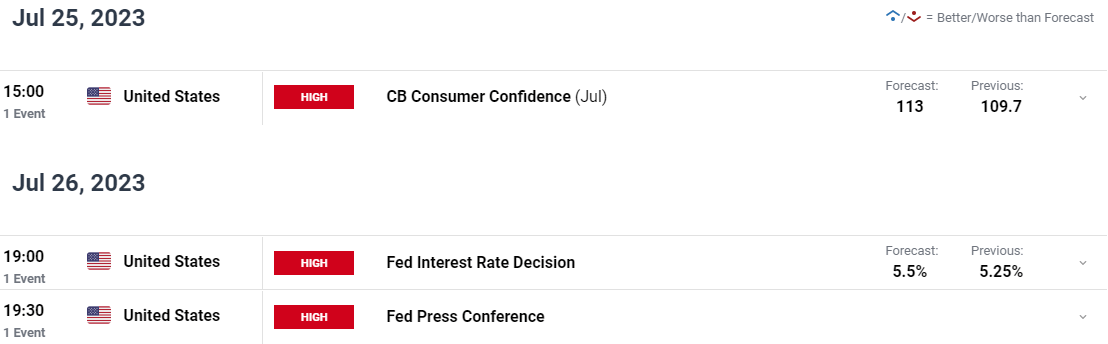
There is not a lot left this week in terms of high impact risk events on the calendar from a USD perspective. Later today we do have US building permits before CB Consumer Confidence and the FOMC meeting both due next week. Once again it will not be the rate decision that holds the key but rather the comments by Fed Chair Powell as well as any updates on the Fed projections for the rest of the year.

A close-up of a white background  Description automatically generatedA screenshot of a computer  Description automatically generated

TECHNICAL OUTLOOK AND FINAL THOUGHTS

US DOLLAR

DXY Daily Chart

image5.png

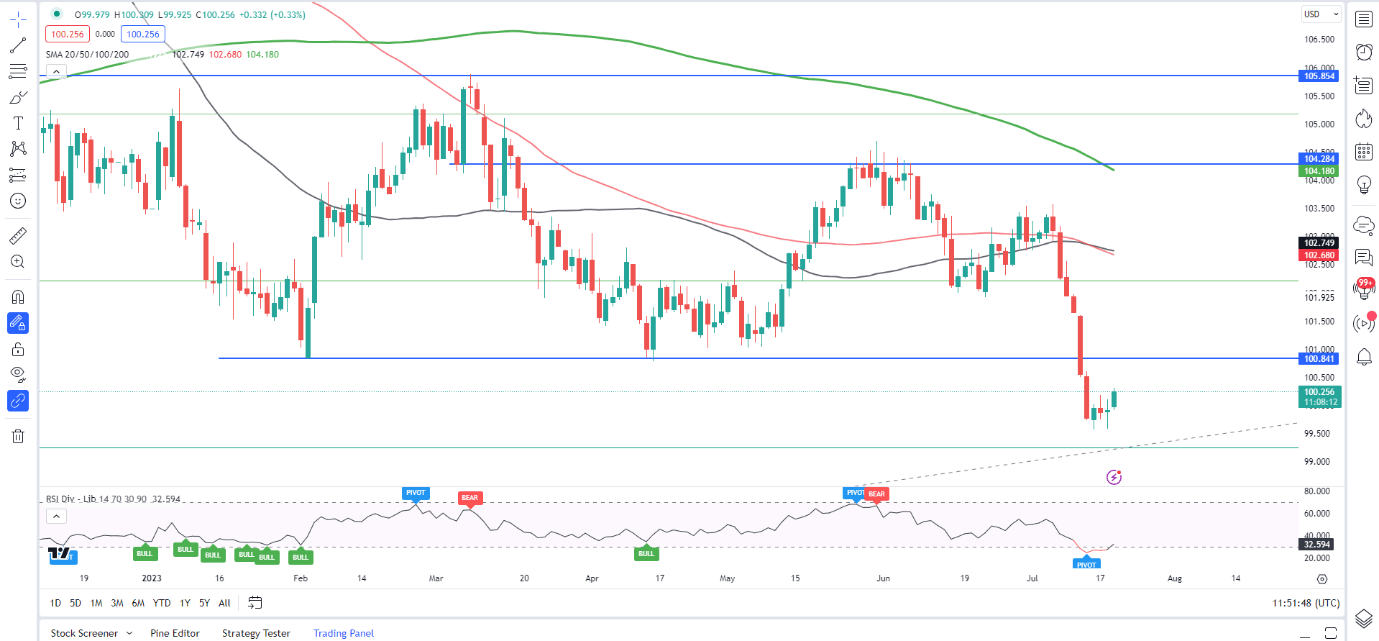
Looking at the Dollar Index and last week’s dally candle close below the 100.00 mark for the first time since April 2022. However, bears have failed to push on since with a test of the lows around 99.60 taking place yesterday before bulls took control pushing the index to a fresh weekly high. I would like to see a retest of key resistance around the 100.84 mark before a continuation of the bearish move to the downside. Given the lack of high impact data this week I do believe such a move is likely to materialize with a break and candle close above the 100.84 handle opening up the possibility of a deeper retracement toward the 102.00 handle.

USD/CHF

USDCHF Daily Chart

image6.png

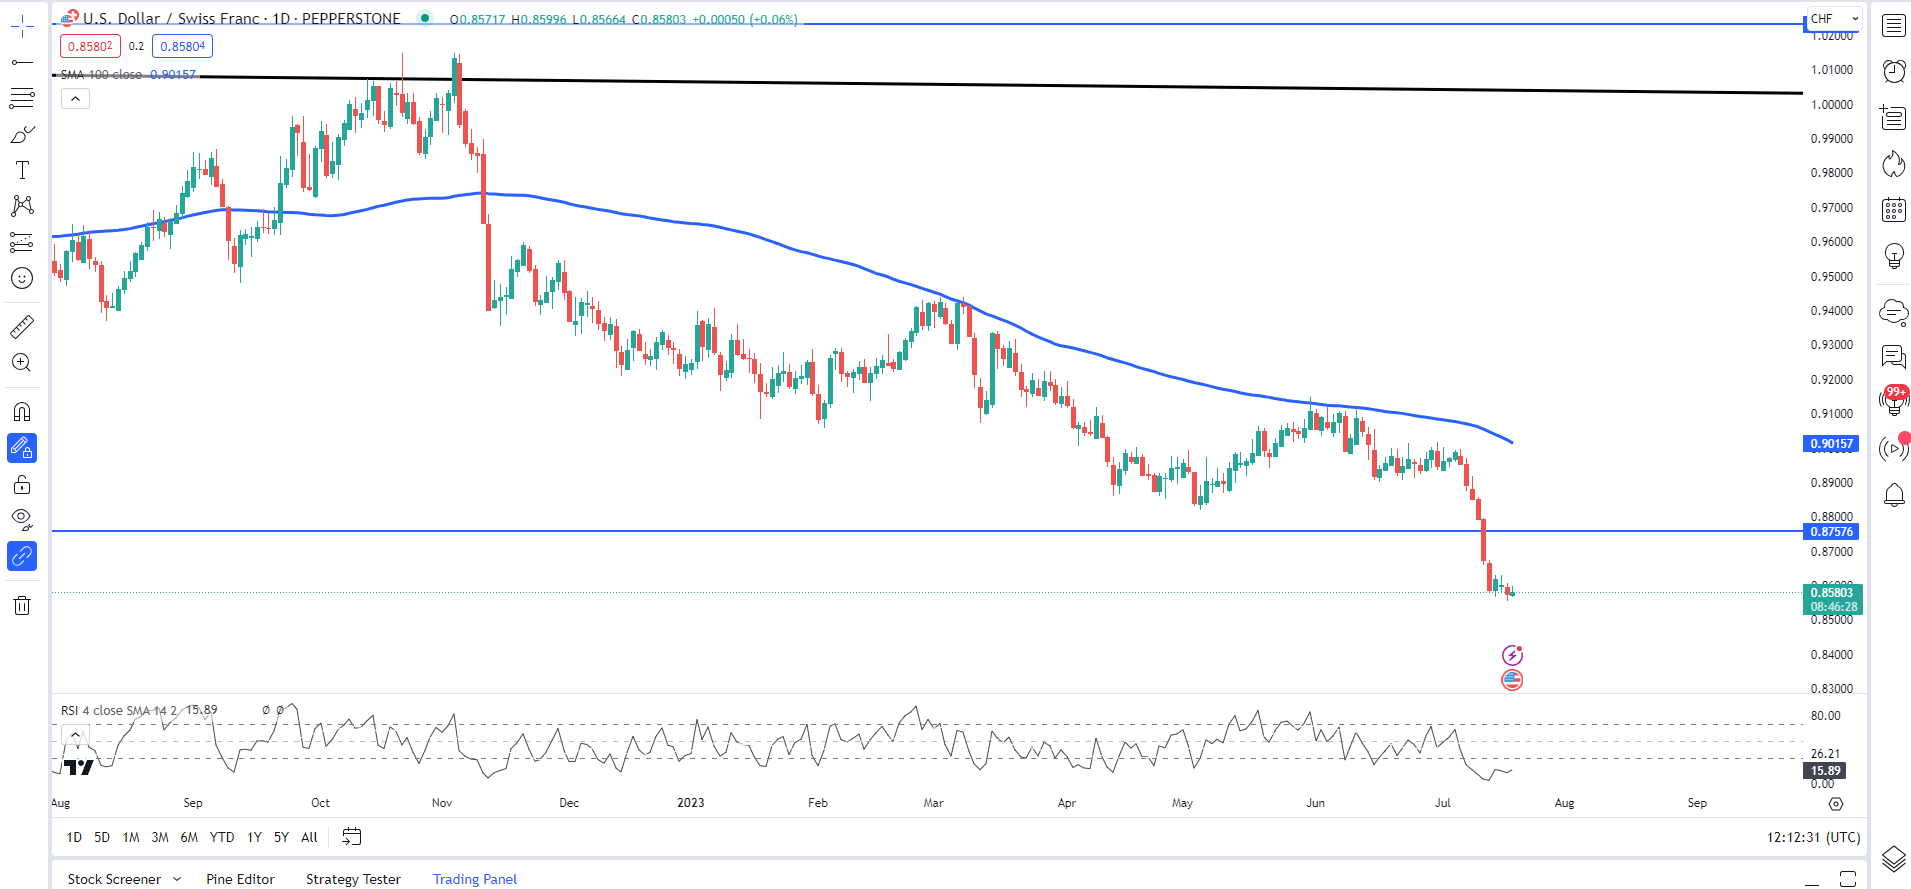
Looking at the technical picture on USDCHF and we are trading at 2011 lows (if we ignore the 2015 spike). The daily chart and selloff over the last 10 days or so almost mirrors that of the DXY which continues to be the driving force behind the pair.

On the daily timeframe we are seeing a bit of consolidation around the 0.8600 mark with the RSI (4) hovering in overbought territory as well. A continued recovery in the DXY could facilitate a retest of the key support turned resistance area around the o.8750 mark. Similar to the DXY a candle break and close above 0.8750 could facilitate a run up to the recent swing highs around the 0.9000 area which lines up with the 100-day MA.

Taking a look at the IG client sentiment data and we can see that retail traders are currently net LONG on USDCHF with 88% of traders holding long positions (as of this writing). At DailyFX we typically take a contrarian view to crowd sentiment meaning we could see USDCHF prices continue to decline following a short upside rally.

Australia Roundup: ASX 200 Rises on Weaker AUD, Iron Ore Reversal Potential

Australia Roundup: ASX 200 Rises on Weaker AUD, Iron Ore Reversal Potential

Measured Approach by RBA sees the Aussie Trade Lower

The Reserve Bank of Australia (RBA) decided to keep rates on hold earlier this month, flagging a slowing economy and relatively calm inflation as the main reasons for holding rates steady. The balanced message also cited that further tightening of “clearly restrictive” rates may be required.

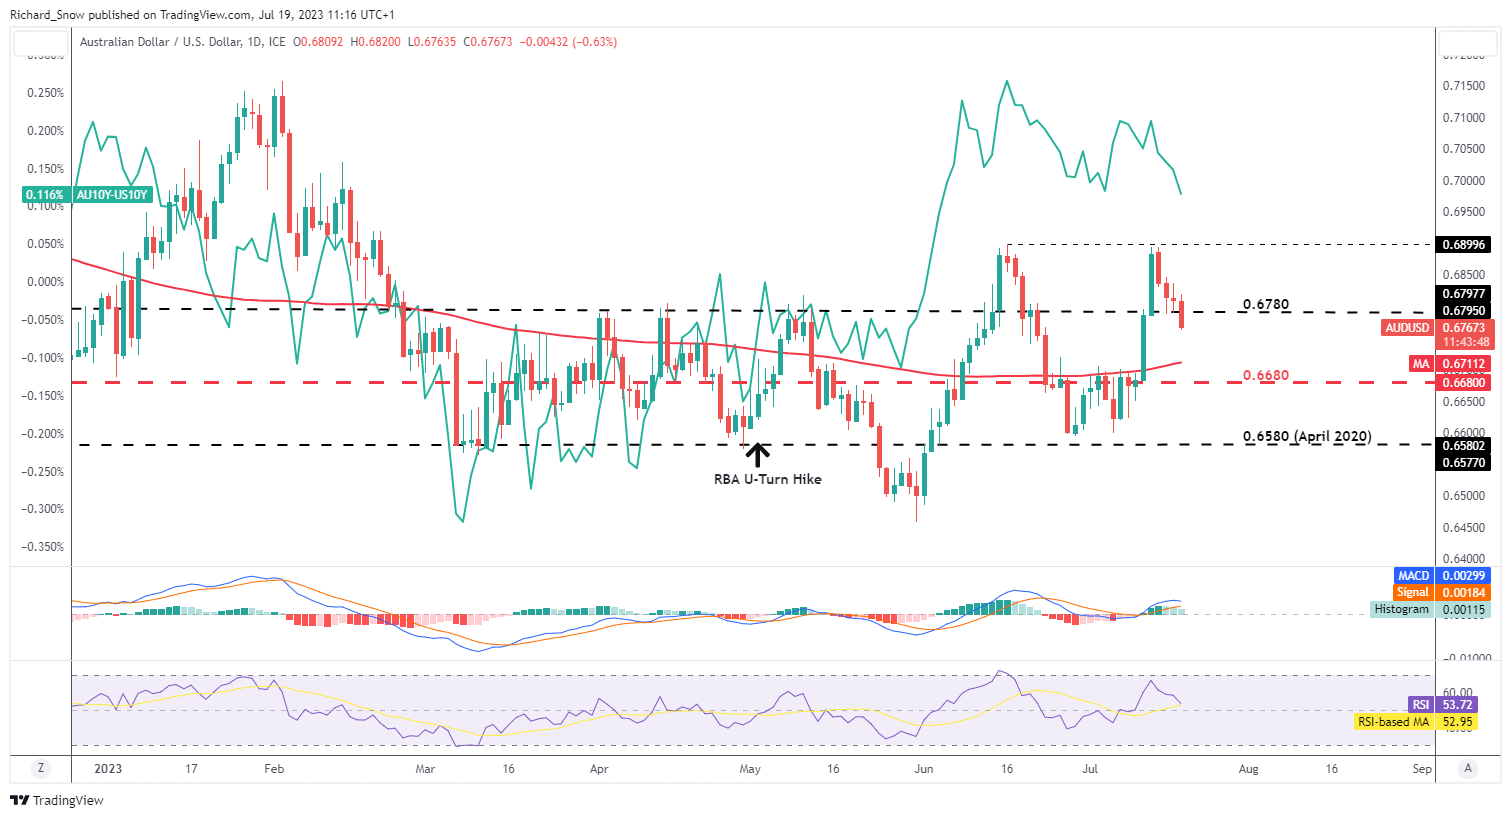
AUD/USD appears to be unwinding the effects of the sharp USD selloff, retracing around half of the prior move. Today, prices trade below the prior influential 0.6780 level, where a close below here eyes the 200 simple moving average (SMA) and 0.6680 which has coincidentally acted as the mid-line of the broader trading range that had largely contained price action since March this year.

The green line denotes the differential between the 10 year Australian and US government bond yields, which retains a notable correlation with unfolding price action. With the RBA on hold for now and the US anticipating another 25 basis point hike next week, further AUD/USD declines cannot be ruled out.
AUD/USD Daily Chart

image1.png

Fundamentals for the Aussie have deteriorated as China’s appetite for industrial metals has cooled. The Asian nation grapples with reopening the economy during a global growth slowdown, evidenced by Q2 data reported at the start of this week which revealed weaker than expected growth.

Iron Ore Prices Hold up, but for how long?

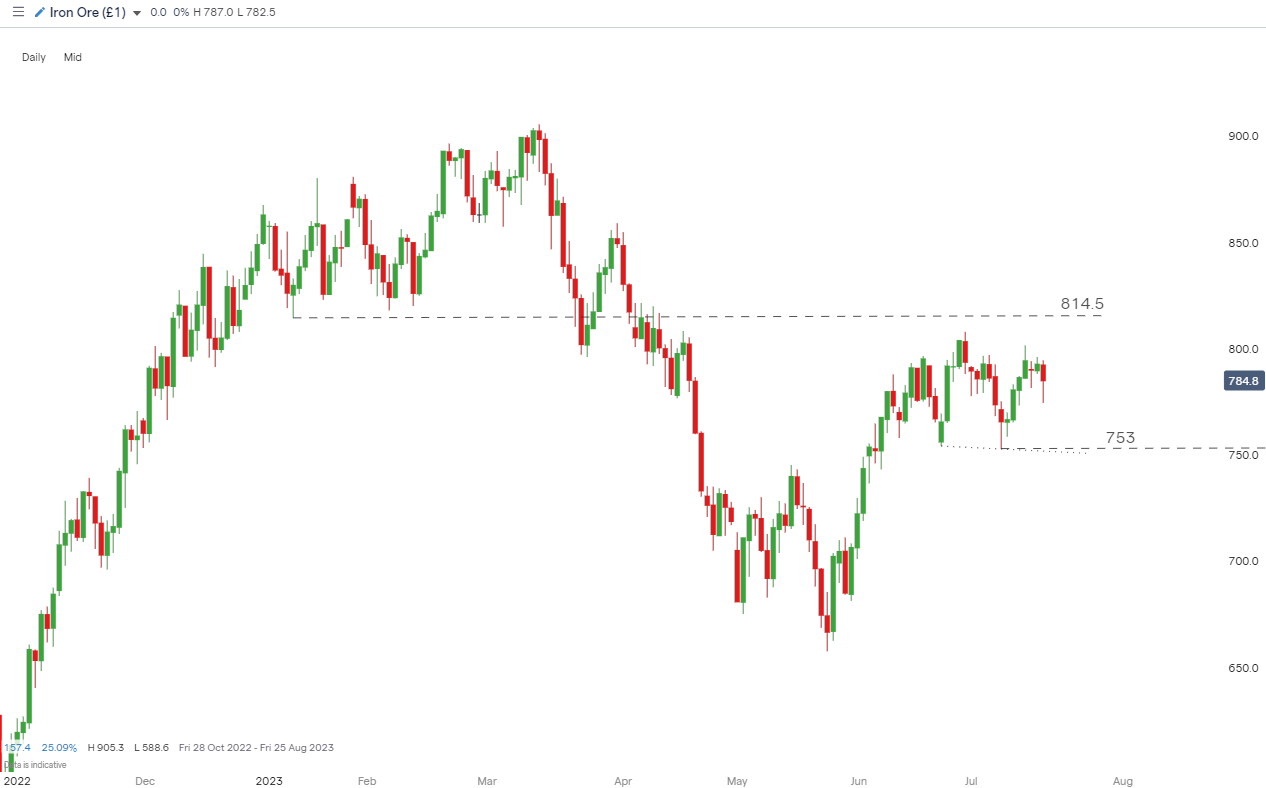
Prices for iron ore, Australia’s main export have actually held up recently but the emergence of a potential head and shoulders reversal patters threatens the status quo. Since Australia’s economic prosperity is closely tied to that of China, it makes sense to monitor scheduled event risk for both countries. Read more about the connection between Australia and China via the core-perimeter relationship.

image2.png

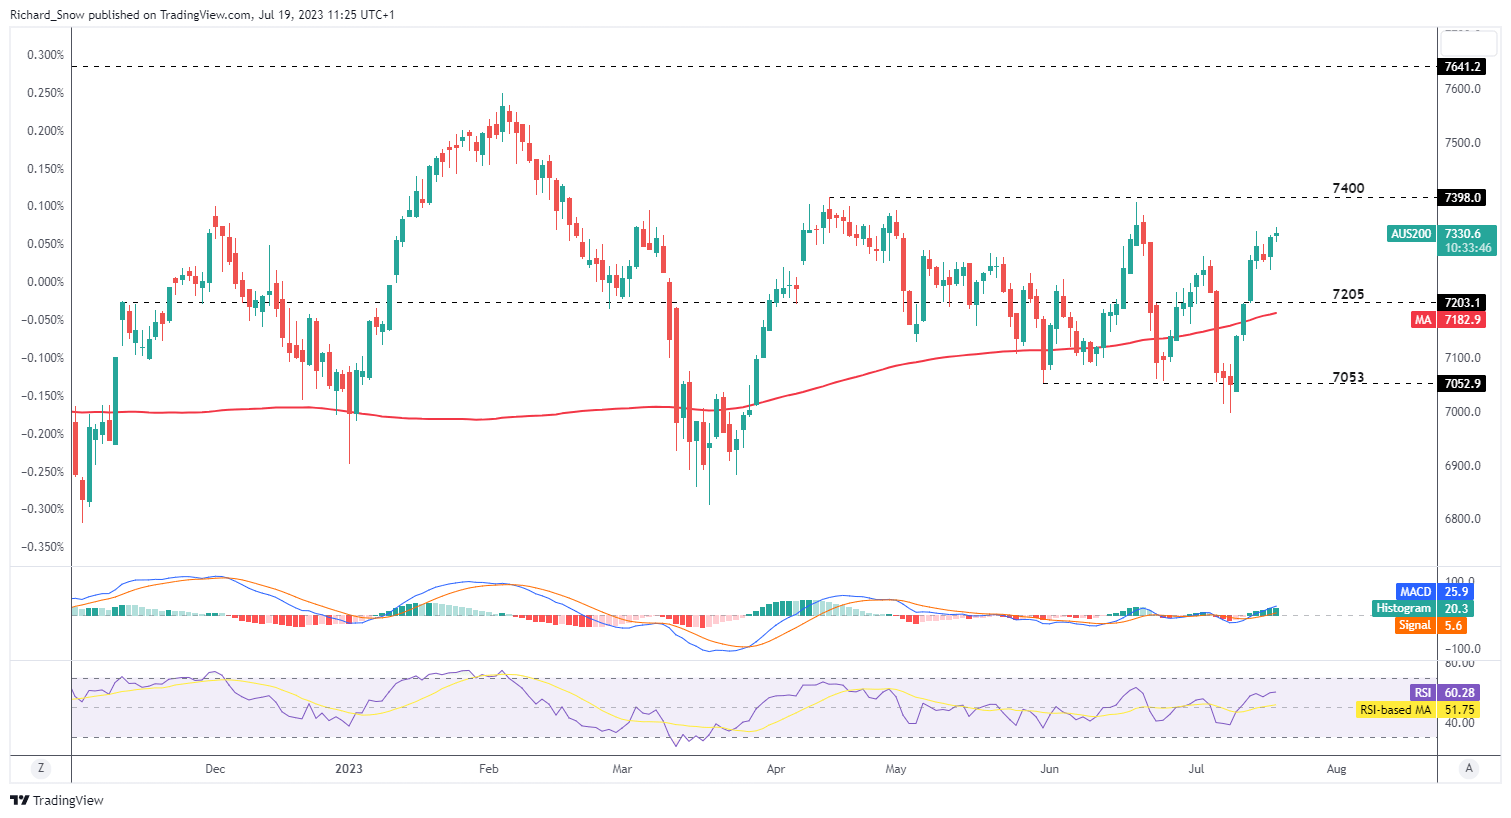
The ASX 200 index trades slightly higher today, on the back of a great trading week and positive US earnings reports which have been effective in maintaining global risk appetite. The declining Aussie dollar is likely to provide support for the index. After US market close today, Netflix and Tesla are due to release their second quarter trading updates – providing insight into the first of the traditional ‘big tech’ stocks. Resistance lies at 7400 with support at 7205. Bolstering 7205 is the 200 SMA.

ASX 200 Daily Chart

image3.png

Japanese Yen Latest: GBP/JPY Slides Lower After UK CPI Miss

Japanese Yen Latest: GBP/JPY Slides Lower After UK CPI Miss

GBP/JPY is in the process of printing a fourth lower high on the daily chart after the British Pound edged lower after the latest UK inflation report. The lower-than-expected CPI release saw UK terminal rate expectations dialed back from around 6.25% to just below 6%.

UK (GBP) Breaking News: UK CPI Miss Troubles Pound

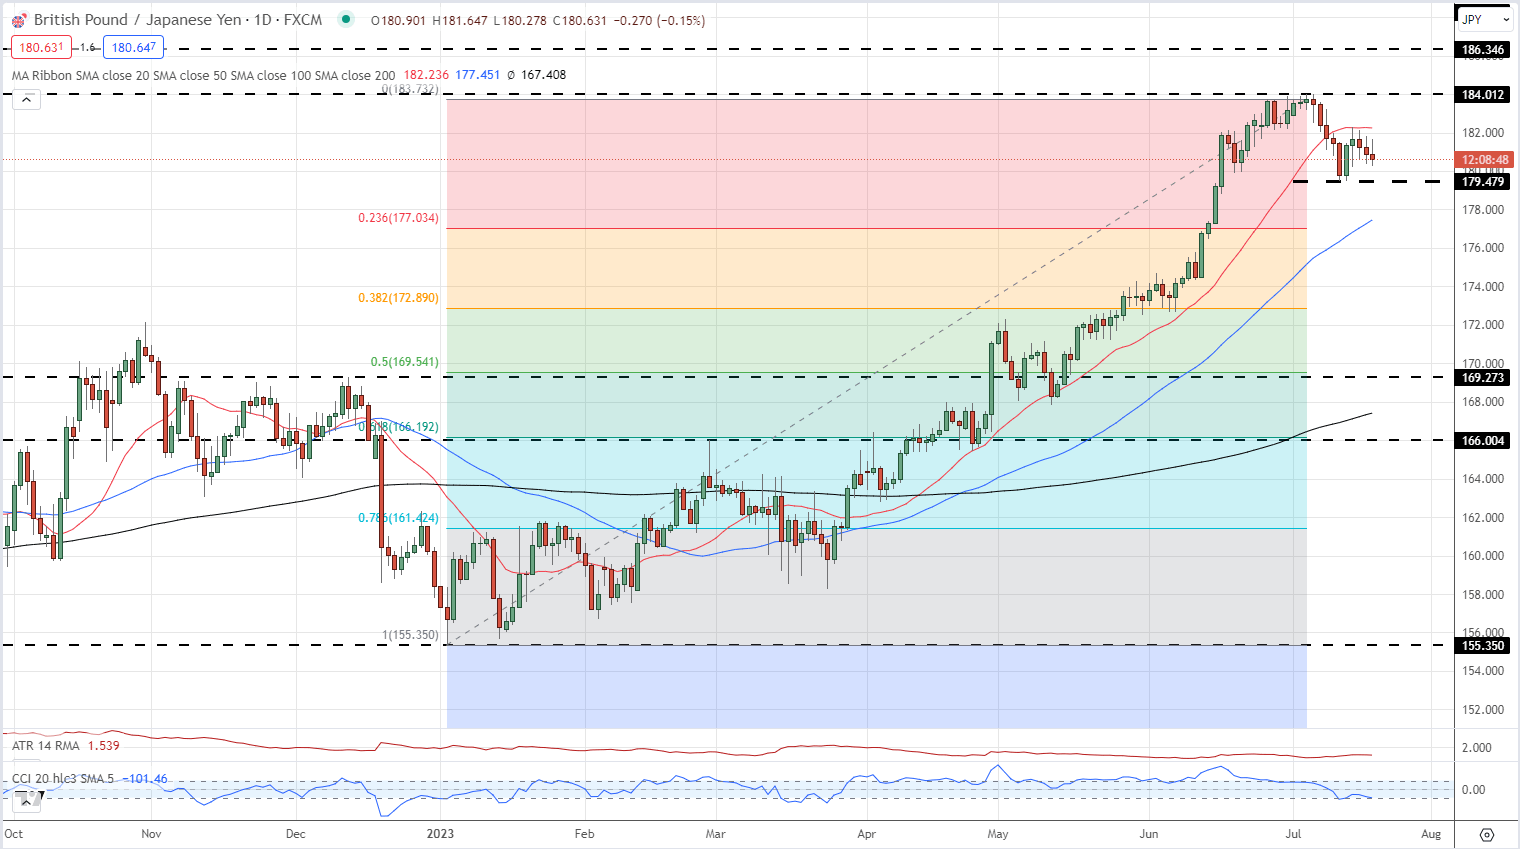
The technical outlook for GBP/JPY remains negative in the short-term with the daily chart showing the pair rolling over from the recent multi-year high. GBP/JPY has rallied by just under 18% this year on a combination of ultra-loose Japanese monetary policy and ongoing UK monetary tightening. While the former is still in play, the latter may be changing after today’s inflation data and the expectations that July’s inflation reading will be even lower as the Ofgem energy price cap – reduced from £2,500 to £2,074 – comes into play.

The daily chart shows GBP/JPY moving lower after multi-touches, and rejections, of the 184 level. The pair are also now below the 20-day simple moving average, in the process of making a fourth lower high in a row and heading back towards short-term support at 179.48. A confirmed break below here would bring the 50-day sma, currently at 177.45, and the 23.6% Fibonacci retracement of the January 3rd – July 5th move at 177.03 into play.

GBP/JPY Daily Price Chart – July 19, 2023

image1.png

GBP/JPY Retail Sentiment is Mixed

Retail trader data shows 28.30% of traders are net-long with the ratio of traders short to long at 2.53 to 1.The number of traders net-long is 7.08% lower than yesterday and 8.25% higher than last week, while the number of traders net short is 2.21% lower than yesterday and 14.05% lower than last week.

We typically take a contrarian view to crowd sentiment, and the fact traders are net-short suggests GBP/JPY prices may continue to rise. Positioning is more net-short than yesterday but less net-short from last week. The combination of current sentiment and recent changes gives us a further mixed GBP/JPY trading bias.