AUD/USD Price Forecast: RBA Minutes Unable to Prevent Thinning Aussie Dollar

AUD/USD Price Forecast: RBA Minutes Unable to Prevent Thinning Aussie Dollar

AUSTRALIAN DOLLAR FUNDAMENTAL BACKDROP

The Australian dollar stays depressed after Chinese GDP data yesterday but managed to claw back some lost gains immediately after the RBA Minutes were released. The prior Reserve Bank of Australia (RBA) interest rate announcement resulted in a rate pause to review both local and external factors impacting the economy before reassessing the path forward. The Minutes revealed the decision was not unanimous with many in favor of a 25bps hike; however, the door was left open for future monetary policy tightening. Money markets currently expect another 25bps hike by year end and while the RBA Minutes did not change the markets views, emphasis will remain on the tight labor market and inflationary pressures.

There has been a steady long-term decline by the Aussie dollar against the greenback since February and fears of a slowing Chinese economy has been a key contributor barring US factors. I believe any positivity from China in terms of fiscal and monetary stimulus could have a greater impact on AUD upside than the already priced in China slowdown.

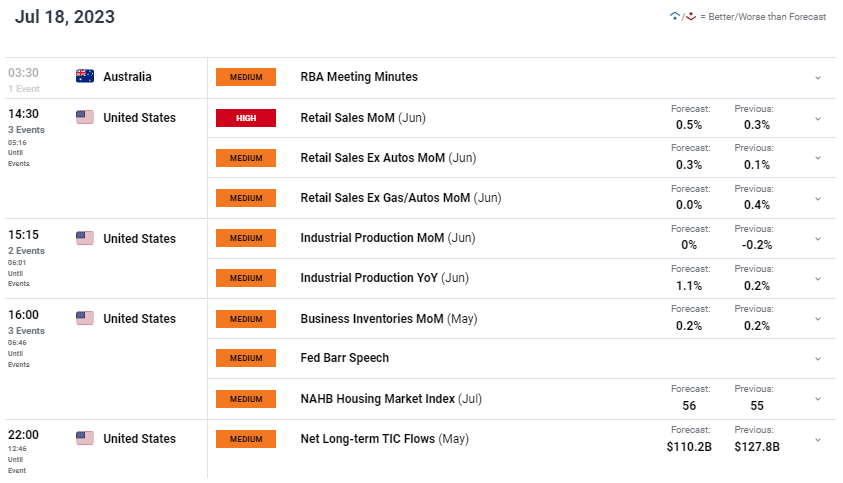
Later today, US retail sales data will dominate headlines (see economic calendar below) and is projected to push higher in June. Industrial production follows a similar estimation and may support the US dollar should actual data fall in line.

AUD/USD ECONOMIC CALENDAR (GMT +02:00)

image1.png

TECHNICAL ANALYSIS

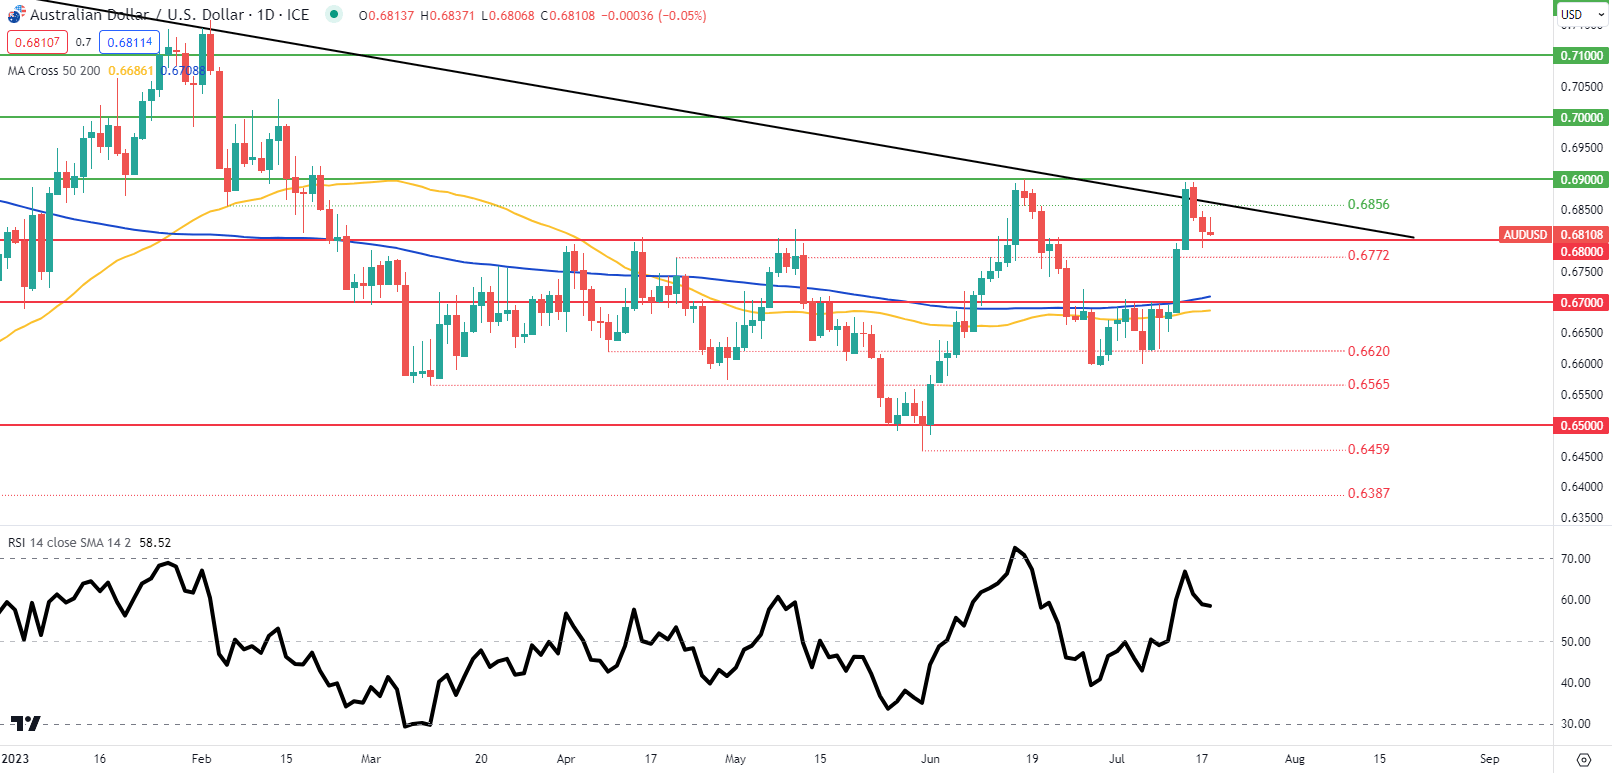
AUD/USD DAILY CHART

image2.png

Daily AUD/USD price action has been on the backfoot ever since the rejection at trendline resistance (black) last week with bears now looking to pierce below the 0.6800 psychological handle once more. That being said, both short and long-term momentum remains in favor of bulls due to price action trading above the 50 and 200-day moving averages respectively.

Currently, today’s daily candle presents with a long upper wick and should it close in this fashion, it could be a technical indication to further downside to come for AUD/USD.

Key resistance levels:

  • 0.6900
  • 0.6856/ Trendline resistance

Key support levels:

  • 0.6800
  • 0.6772

IG CLIENT SENTIMENT DATA: MIXED

IGCS shows retail traders are currently net LONG on AUD/USD, with 52% of traders currently holding long positions. At DailyFX we typically take a contrarian view to crowd sentiment but due to recent changes in long and short positioning we arrive at a short-term cautious disposition.

Sentiment Awaiting Cues from Key US Earnings Releases Ahead: Brent crude, AUD/JPY, Natural Gas

Sentiment Awaiting Cues from Key US Earnings Releases Ahead: Brent crude, AUD/JPY, Natural Gas

Wall Street started the new trading week on a positive footing, as risk appetite rose ahead of several key earnings releases this week, single-handedly uplifted by the technology (+1.3%) and financial (+1.0%) sectors. A surprise expansion in the New York Empire State Manufacturing Index (1.1 versus -4.3%) overnight added to the list of positive surprises thus far in pushing back against recession concerns, further validated by comments of a no-recession from US Treasury Secretary Janet Yellen. The US economic surprise index has touched its highest level since March 2021.

While the collapse of the Ukraine grain deal overnight may raise the risks of more persistent food prices by restricting global food supplies, sentiments seem to be taking it in stride for now, potentially as moderating pricing pressures across the globe has been more broad-based.

The US retail sales will be in focus today, with resilience still the story as expectations look for a 0.5% month-on-month gain, up from the 0.3% in May. Likewise, industrial production is expected to show an uptick from May, heading to 1.1% from a year ago compared to the 0.2% in May.

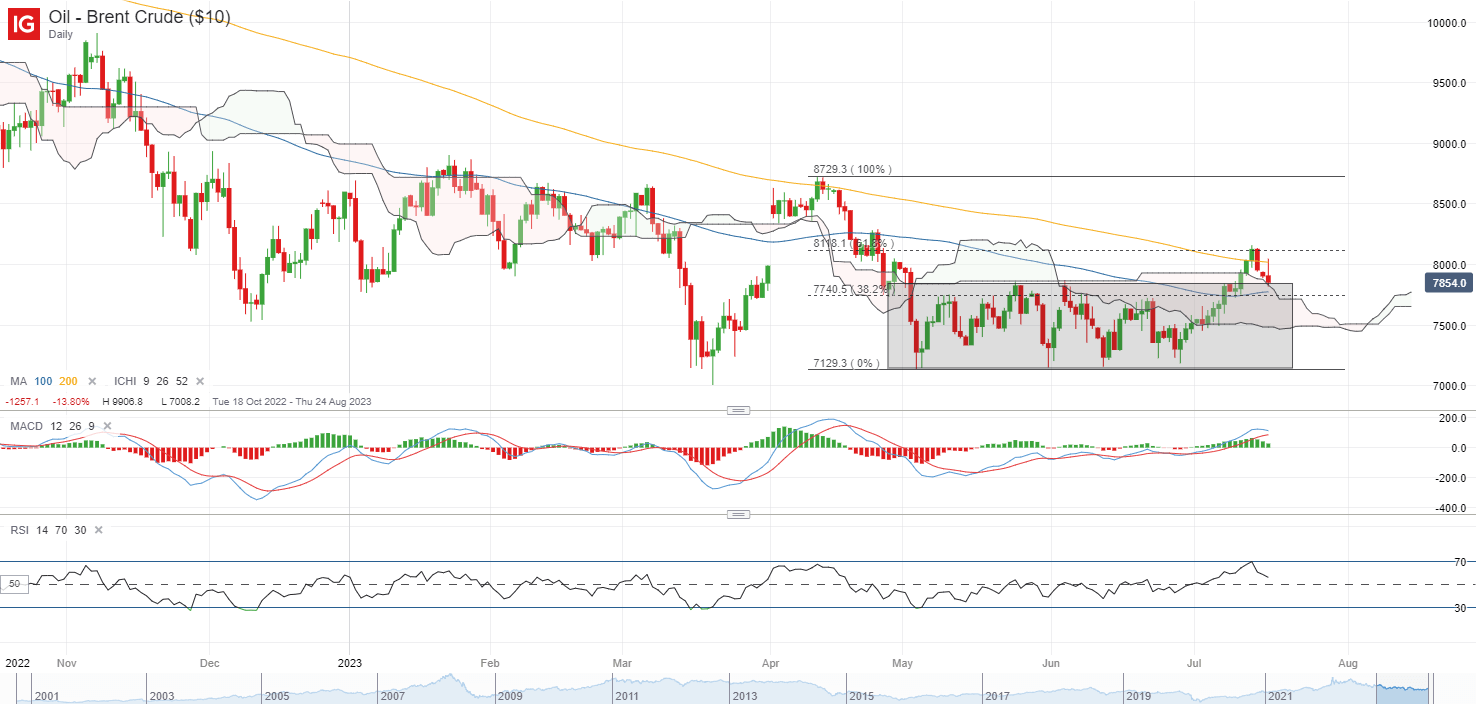
Perhaps one to watch will be Brent crude prices, which saw a negative reaction to China’s lackluster GDP data yesterday on a potentially weaker oil demand outlook. That said, having broken above a near-term consolidation last week, prices are back to retest a previous resistance-turned-support at the US$78.40 level, where its key 100-day moving average (MA) stands as well. Any formation of a new higher low will be on watch to provide some conviction for a continuation of the near-term upward bias.

image1.png

Asian stocks look set for a mixed open, with Nikkei +0.81%, ASX -0.19% and KOSPI -0.31% at the time of writing. After being back online from its holiday break, the Nikkei is riding on the strength in Nasdaq for some gains to start the week, as buyers seek to overturn the double-top formation on the daily chart. A reclaim of its 20-day MA may provide greater conviction, but for now, the 32,700 level stands as immediate resistance to overcome.

The light economic calendar in Asia will put the Reserve Bank of Australia (RBA) meeting minutes on the radar, with the minutes closely watched for clues on the potential for a rate hike at the upcoming meeting in two weeks. The RBA has previously showed their intent for some wait-and-see by keeping rates on hold, but rate expectations remain unconvinced for an extended pause by leaning slightly towards another 25 basis-point hike by October this year. Therefore, views from policymakers will be sought from the minutes to anchor down some expectations.

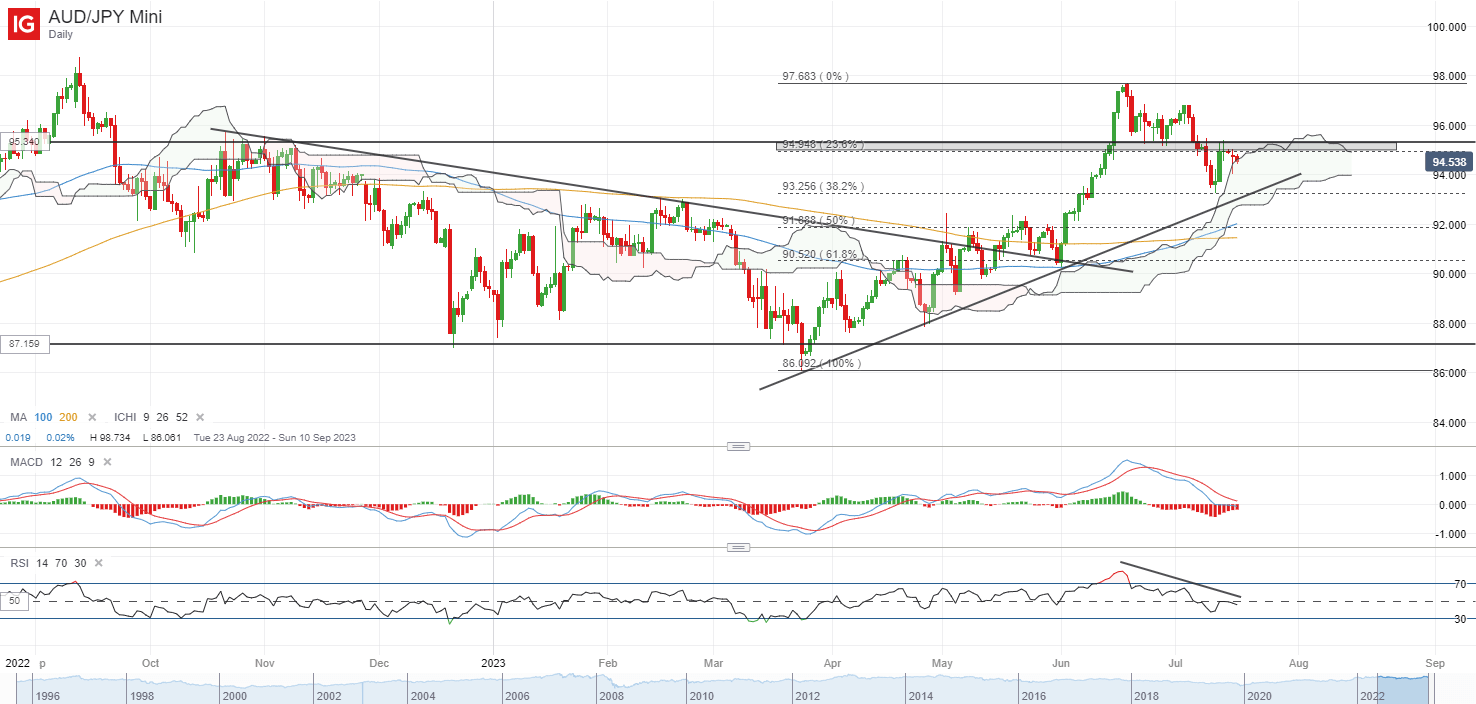
For the AUD/JPY, a recent retest of its previous support-turned-resistance at the 95.34 level was marked with some resistance, with lower highs on Relative Strength Index (RSI) pointing to some moderating upward momentum. Perhaps greater conviction for the bulls will depend on any move back above the key resistance of 95.34 level. On the downside, the 93.25 level could be on watch for near-term support. This level marked a 38.2% Fibonacci retracement level, in confluence with an upward trendline support and its Ichimoku cloud (daily).

image2.png

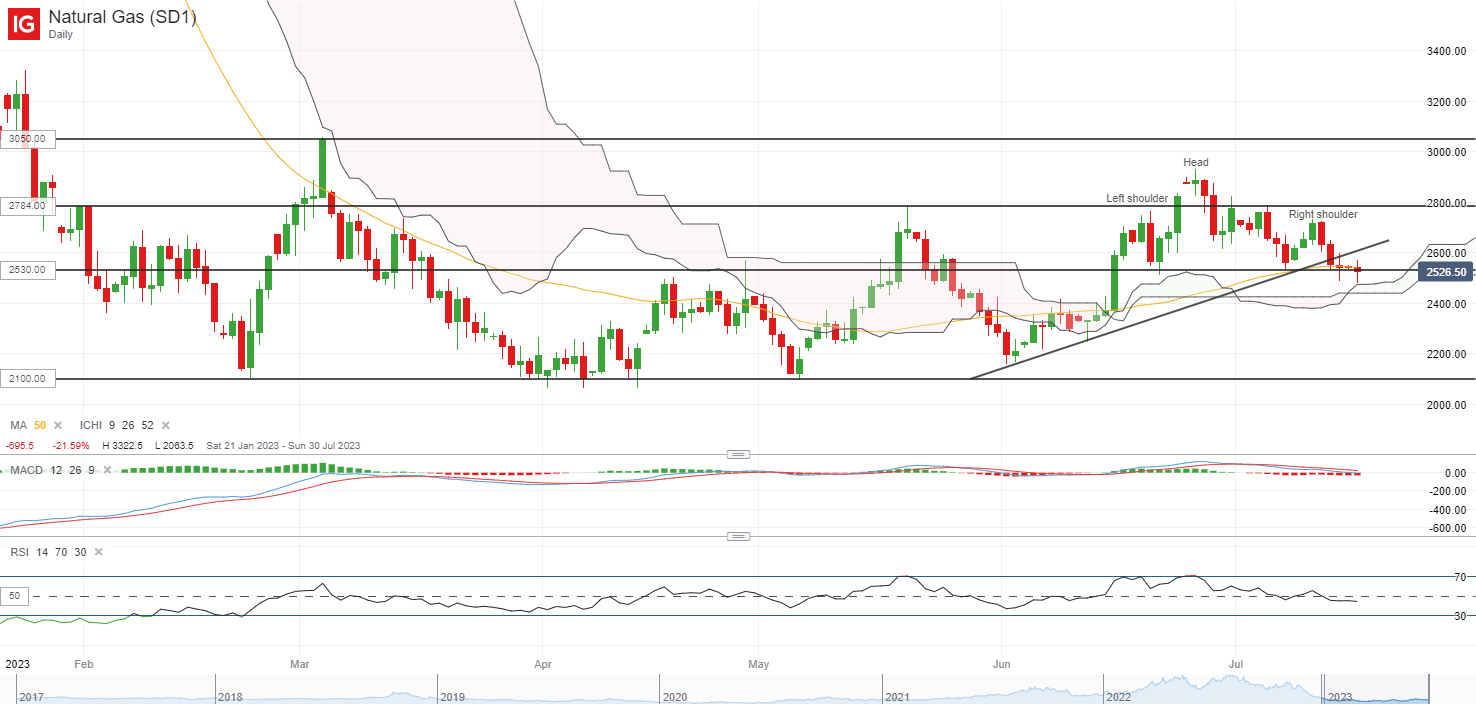
On the watchlist: Natural gas prices hanging at neckline of minor head-and-shoulder formation

Recovering natural gas supply has prompted prices to take a dip lately to its one-month low, with a close to 14% retracement from its recent June 2023 peak. For now, the daily chart seems to display a minor head-and-shoulder formation, as buyers are attempting to defend the neckline around the 2.530 level. Much still awaits with a series of spinning tops pointing to some near-term indecision.

Any subsequent breakdown of the neckline could potentially pave the way to retest the 2023 bottom at the $2.100 level, given the price projection from the height of the pattern. The current $2.530 level also marked its 50-day MA while the RSI hovers slightly below the key 50 level. On the upside, the $2.784 will serve as immediate resistance to overcome.

image3.png


British Pound Ahead of UK CPI: GBP/USD, EUR/GBP, GBP/JPY Price Action

British Pound Ahead of UK CPI: GBP/USD, EUR/GBP, GBP/JPY Price Action

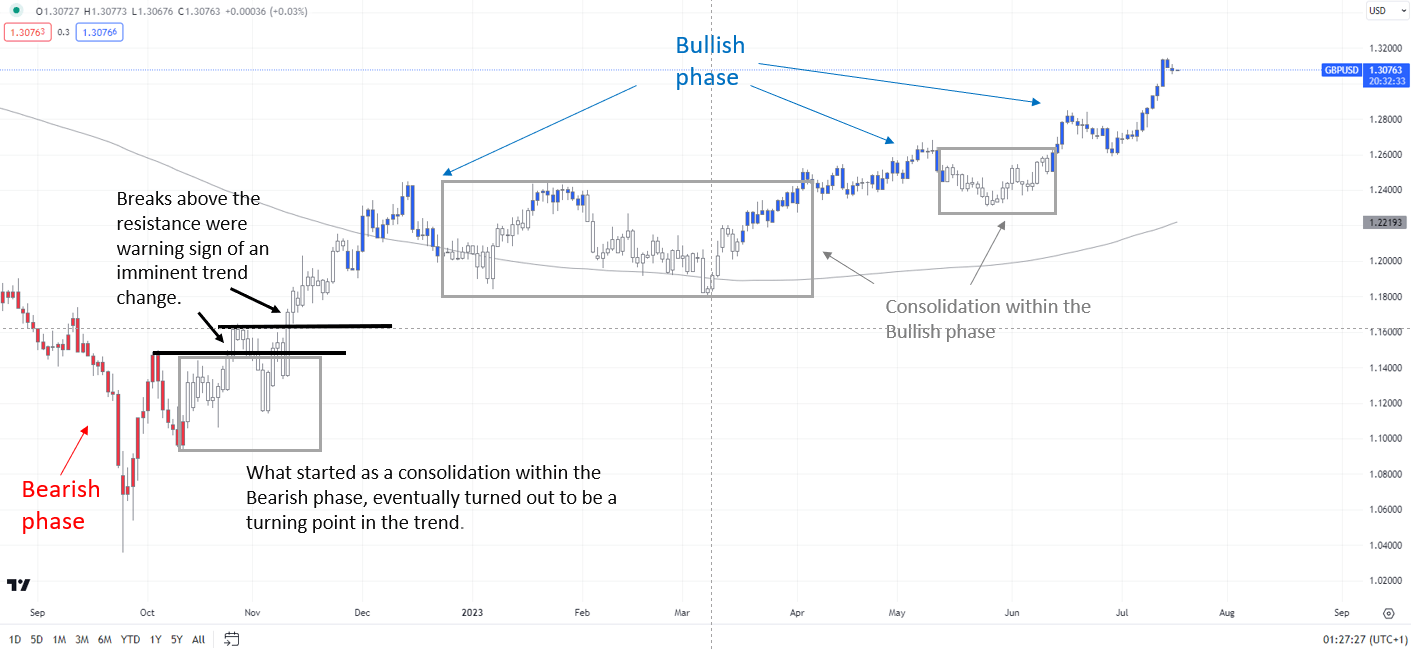
The British pound is holding on to its recent gains ahead of the key UK inflation data due on Wednesday. UK CPI is expected to have eased a bit to 8.2% on-year in June from 8.7% in May. Core inflation is expected to be flat at 7.1% on-year. On a monthly basis, inflation eased to 0.4% on-month from 0.7% in May.

Inflation has remained stubbornly high, boosting expectations of higher for longer UK rates. BOE has responded by maintaining its aggressive stance on interest rates, hiking by more than expected in June, taking rates to the highest level since 2008. The market is pricing rates rising above 6% from the current 5%. As a result, net speculative long GBP positions have hit the highest level since 2014, according to CFTC data.

However, aggressive tightening could dent prospects for next year, raising the risk of a recession, and undermining the overbought GBP. On the other hand, the recent stimulus measures in China could help cushion some of the downside risks to economic growth in the world’s second-largest economy, providing a tailwind to European growth.

GBP/USD Daily Chart

image1.png

Chart Created by Manish Jaradi Using TradingView; Notes at the bottom of the page

GBP/USD: Holding gains

From a trend perspective, GBP/USD’s broader trend remains up, as the colour-coded daily candlestick charts show. Beyond the daily timeframe, from a medium-term perspective, the rise this month to a one-year high in May confirmed the higher-tops-higher-bottom sequence since late 2022, leaving open the door for some medium-term gains. (see “British Pound Buoyant Ahead of BOE: How Much More Upside?”, published May 8).

GBP/USD Weekly Chart

image2.png

Chart Created by Manish Jaradi Using TradingView

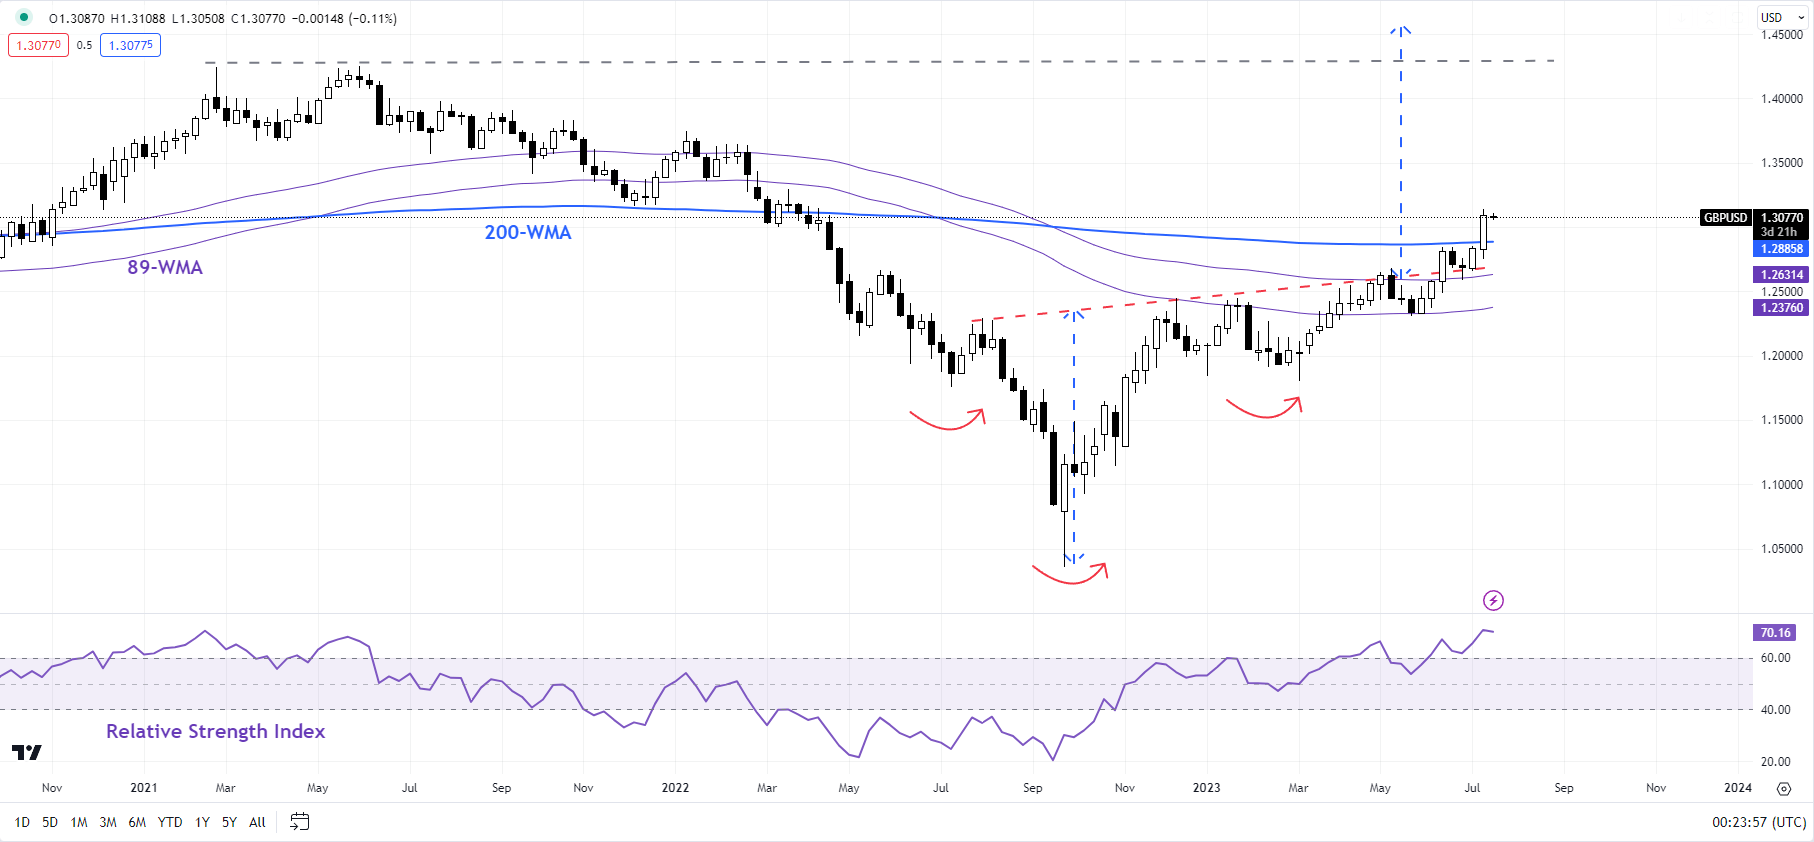
The rise to a 15-month high last week has pushed GBP/USD above a vital hurdle on the 200-week moving average. A decisive break (two straight weeks of close above) could open the gates for further gains. That’s because the rise above a slightly upward-sloping trendline from late 2022 has triggered a reverse head & shoulders pattern (the left shoulder is at the July 2022 low, the head is at the September 2022 low, and the right shoulder is at the Q1-2023 low), pointing to a move toward 2021 high of 1.4250 over the longer term.

EUR/GBP Daily Chart

image3.png

Chart Created Using TradingView

EUR/GBP: Still holding above key support

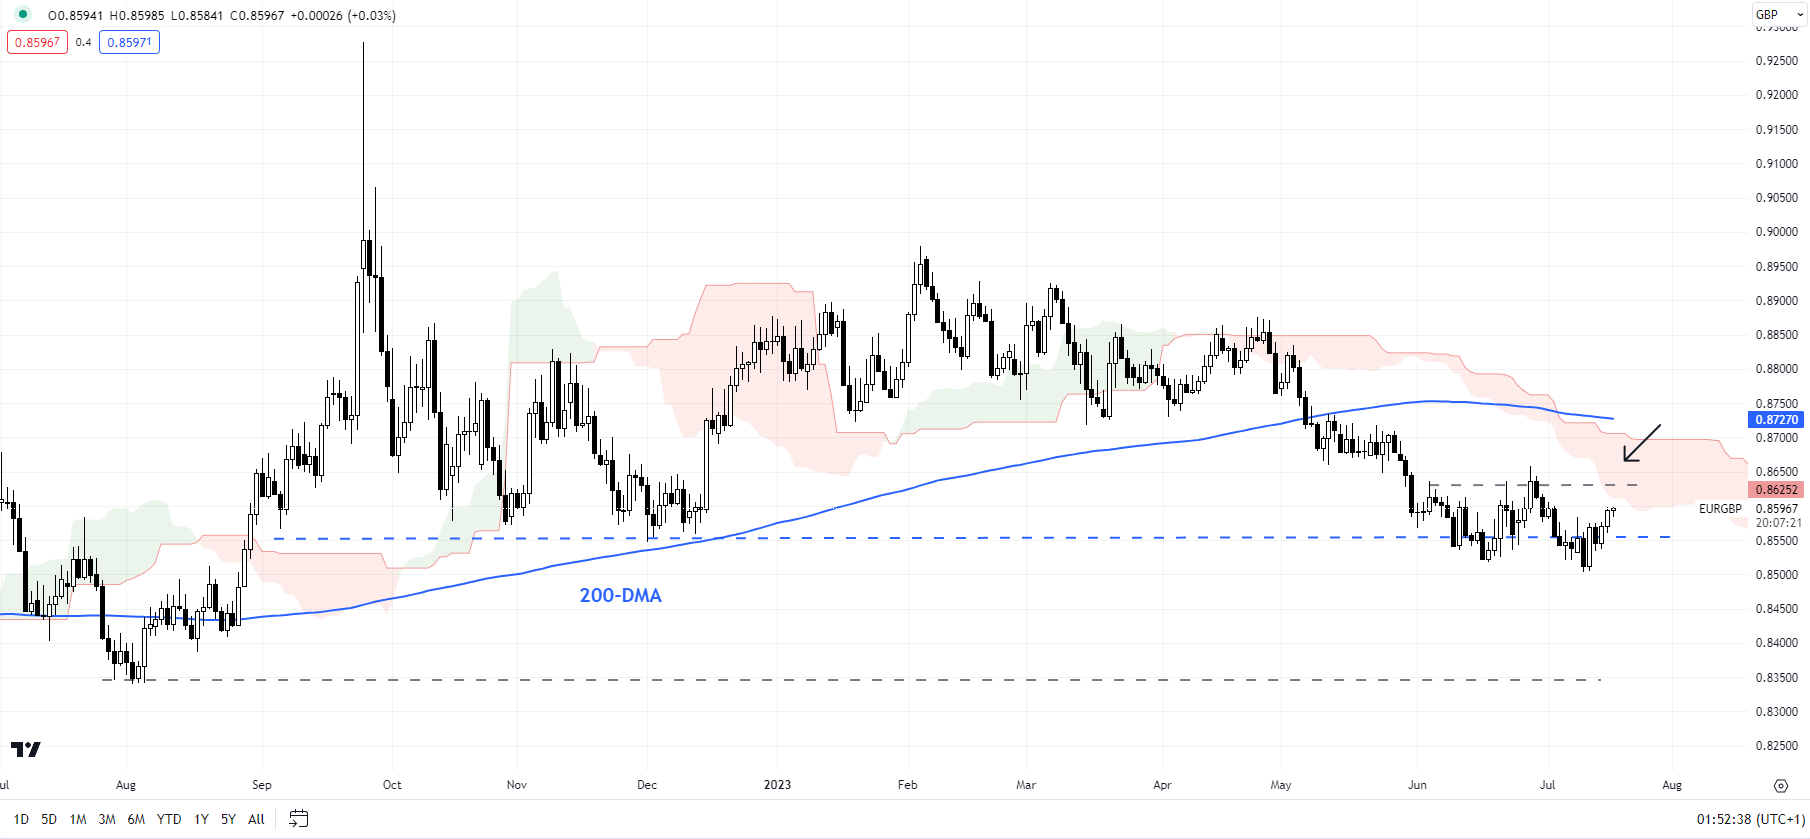
EUR/GBP’s slide has stalled in recent weeks around key support at the December low of 0.8545, with a potential minor double bottom unfolding (the June low and the early-July low). Still, the bias remains down while the cross remains below the end-June high of 0.8635. However, a break above 0.8635 would trigger the bullish pattern, pointing to a rise toward 0.8750, confirming that the immediate downward pressure had faded.

GBP/JPY Monthly Chart

image4.png

Chart Created Using TradingView

GBP/JPY: On the way toward the 2015 high

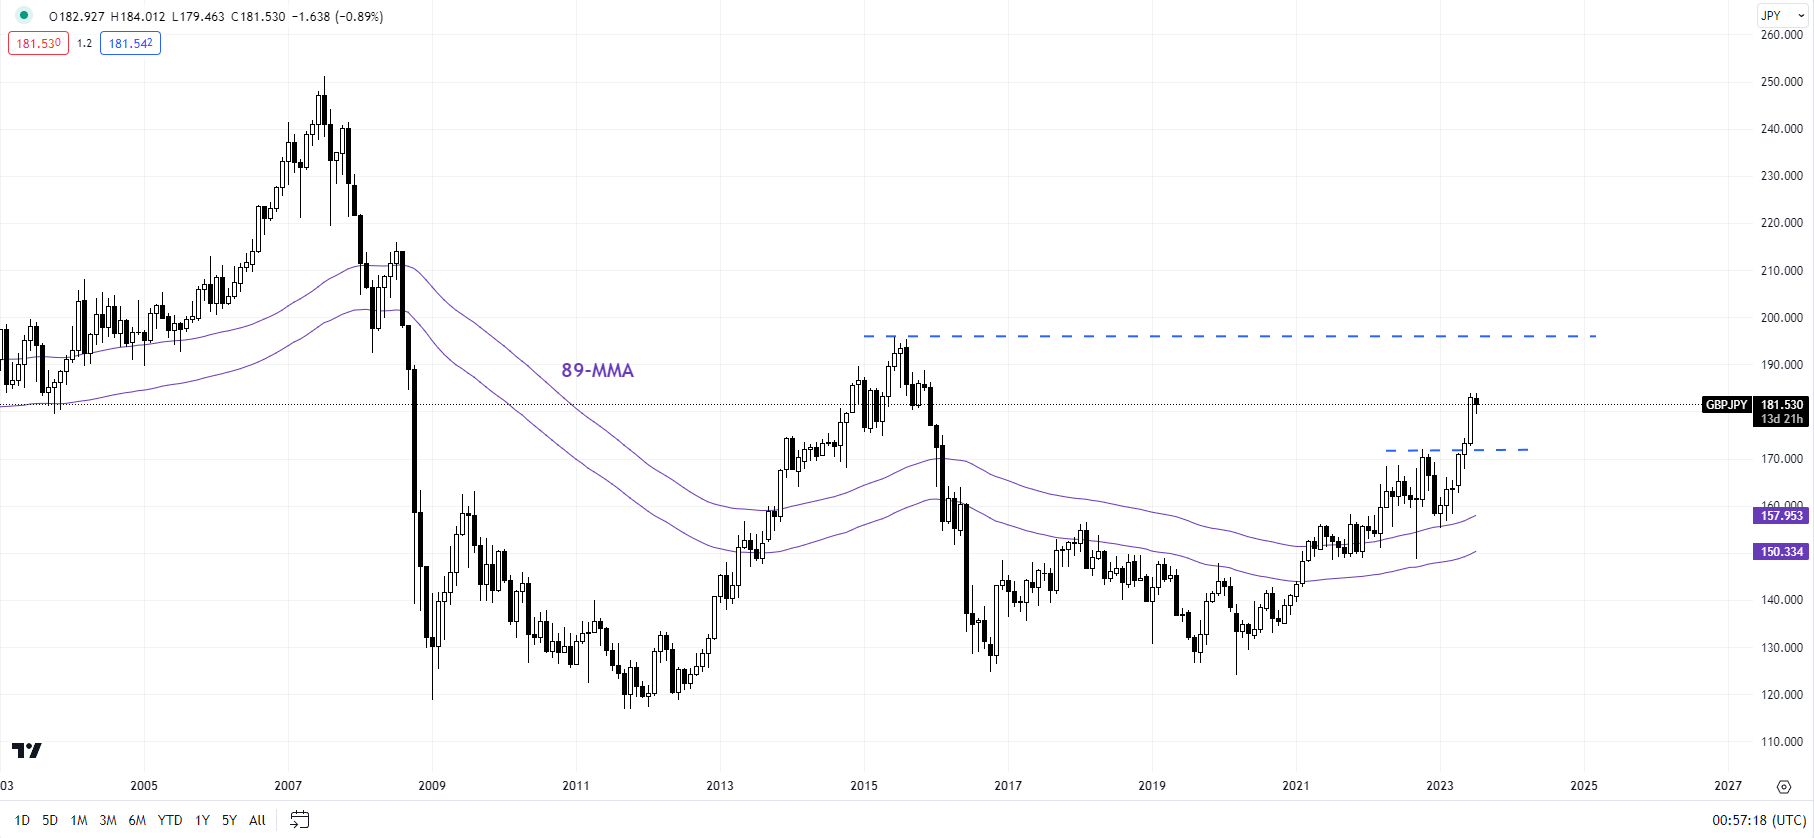
GBP/JPY’s break above the October high of around 172.00 has opened the door toward the 2015 high of 196.00 in the coming weeks/months. In the near term, however, the cross looks a bit overbought. Hence some sort of consolidation/minor retreat can’t be ruled out. The broader upward pressure is unlikely to fade away while the cross holds above the 89-day moving average (now around 173.10).

Note: The above colour-coded chart(s) is(are) based on trending/momentum indicators to minimize subjective biases in trend identification. It is an attempt to segregate bullish Vs bearish phases, and consolidation within a trend Vs reversal of a trend. Blue candles represent a Bullish phase. Red candles represent a Bearish phase. Grey candles serve as Consolidation phases (within a Bullish or a Bearish phase), but sometimes they tend to form at the end of a trend. Candle colors are not predictive – they merely state what the current trend is. Indeed, the candle color can change in the next bar. False patterns can occur around the 200-period moving average, around a support/resistance, and/or in a sideways/choppy market. The author does not guarantee the accuracy of the information. Past performance is not indicative of future performance. Users of the information do so at their own risk.

Euro Ekes Out Gains as the US Dollar Reins in the Bears for Now. Where to for EUR/USD?

Euro Ekes Out Gains as the US Dollar Reins in the Bears for Now. Where to for EUR/USD?

The Euro made a fresh 17-month peak against the US Dollar on Tuesday as the bullish run continues for the single currency.

The move above 1.1250 comes as the market prepares for an easing in tomorrow’s Euro-wide CPI with a Bloomberg survey of economists estimating a final reading of 5.5% year-on-year to the end of June.

The European Central Bank will be meeting next week and the interest rate market has a 25 basis point hike priced in.

Bundesbank President and ECB Governing Council member Joachim Nagel agreed with this assessment in an interview yesterday.

On the soft commodity front, Russia announced that they will end the agreement to allow the safe passage of Ukrainian crops from its key port of Odesa. There has been little reaction in futures markets to the news.

APAC equities have had a mixed day with the exception of Hong Kong’s Hang Seng Index (HSI) that fell over 2%.

The demise could be attributed to it being closed for business yesterday due to a typhoon on a day that saw China’s mainland indices slide lower after disappointing GDP figures.

US Treasury Secretary Janet Yellen was speaking at the G-20 in India yesterday, and she said China’s slowdown risks rippling across the globe, but she doesn’t see a recession for the US

Treasury yields have been relatively steady so far week after rolling over last week on data that showed an easing of price pressures in both the CPI and PPI gauges.

The US Dollar has also paused in its bearish run as the market looks toward next week’s Federal Open Market Committee (FOMC) meeting on July 26th.

The Reserve Bank of Australia’s (RBA) meeting minutes were released today and noted that the debate centred on keeping rates on hold, which they did, or raising them by 25 basis points.

The board saw no change as the stronger argument given the tightening that had been done already and that there will be several key data points ahead of the August gathering.

The market will be focused on the second quarter Australian CPI that will be released on July 26th.

Crude oil has steadied so far on Tuesday after starting the week on the back foot. The WTI futures contract is near US$ 74.25 bbl while the Brent contract is a touch below US$ 79 bbl.

EUR/USD TECHNICAL ANALYSIS

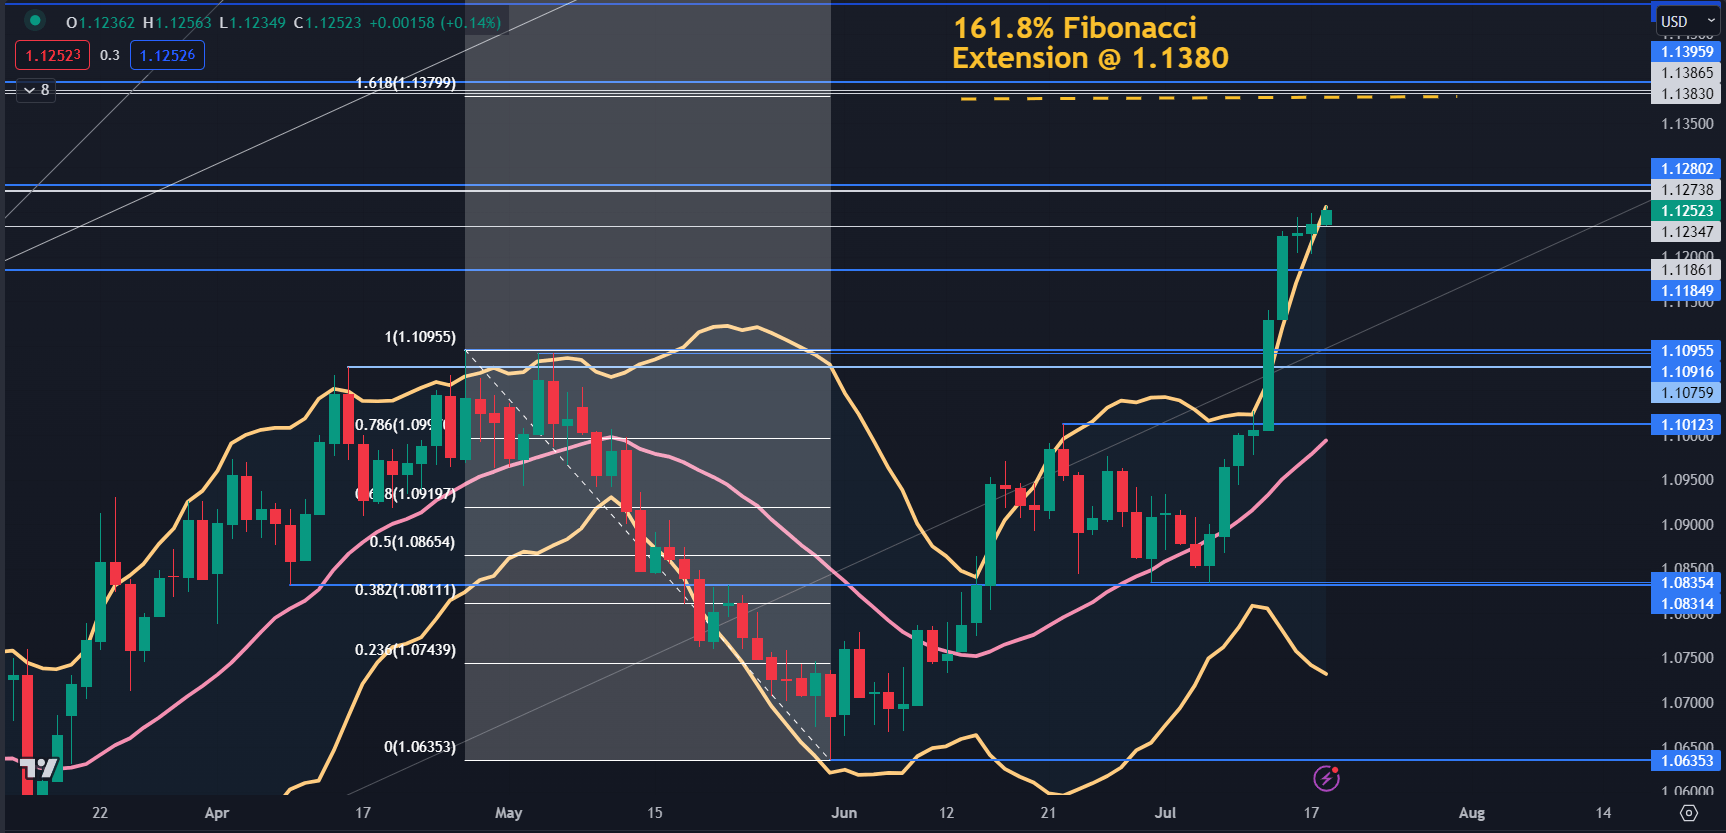
The CURRENT rally has broken above the upper band of the 21-day simple moving average (SMA) based Bollinger Band. A close back inside the band might signal a pause in the bullish run or a potential reversal.

Resistance could be at the historical breakpoints in the 1.1270 – 80 area ahead of the Fibonacci Extension of the move from 1.1095 to 1.0635 at 1.1380.

On the downside, support may lie at the breakpoint of 1.1185 or further below at the breakpoints in the 1.1075 – 1.1095 zone.

image1.png

S&P 500 Outlook Over Next 1-2 Months: Broadening Participation Points to Further Gains

S&P 500 Outlook Over Next 1-2 Months: Broadening Participation Points to Further Gains

Improving market breadth points to further gains in the S&P 500 index in the coming weeks as the earnings season picks up steam.

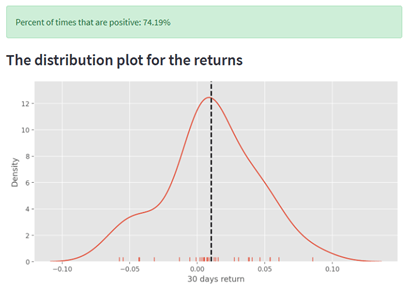
As of Monday, slightly over 83% of the members in the S&P 500 index were above their respective 10-week moving average (WMA). Data from 1996 onwards suggests that when 83%-84% of the members were above their respective 10-WMAs, the index has been up 74% of the time over the subsequent 30 days. That is, in such instances, 74% of the time the index returns have been positive over the subsequent one-month period based on historical performance (see the distribution plot).

Distribution plot of S&P 500 index returns when 83%-84% of members are above their respective 10-week moving average

Data Source: Bloomberg; Chart Created by Manish Jaradi in Python

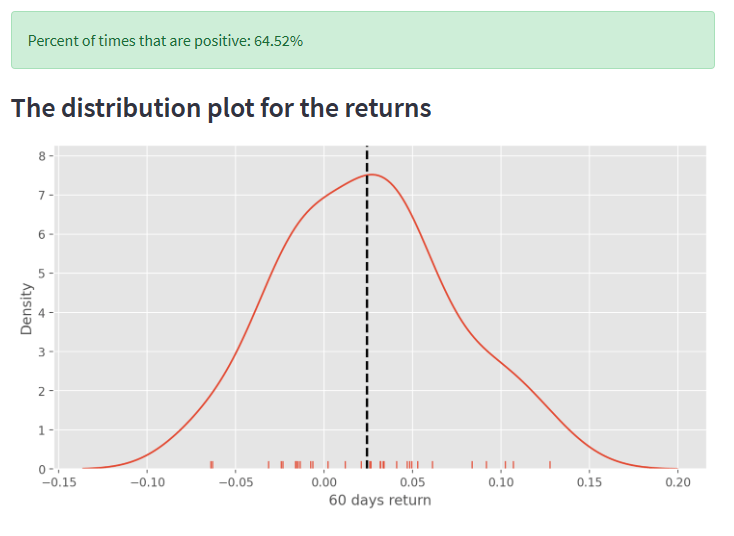
Similarly, data from 1996 onwards suggests that when 83%-84% of the members were above their respective 10-WMAs, the index has been up 64% of the time over the subsequent 60 days. That is, in such instances, 64% of the time the index returns have been positive over the subsequent two-month period based on historical performance (see the distribution plot).

Distribution plot of S&P 500 index returns when 83%-84% of members are above their respective 10-week moving average

image2.png

Data Source: Bloomberg; Chart Created by Manish Jaradi in Python

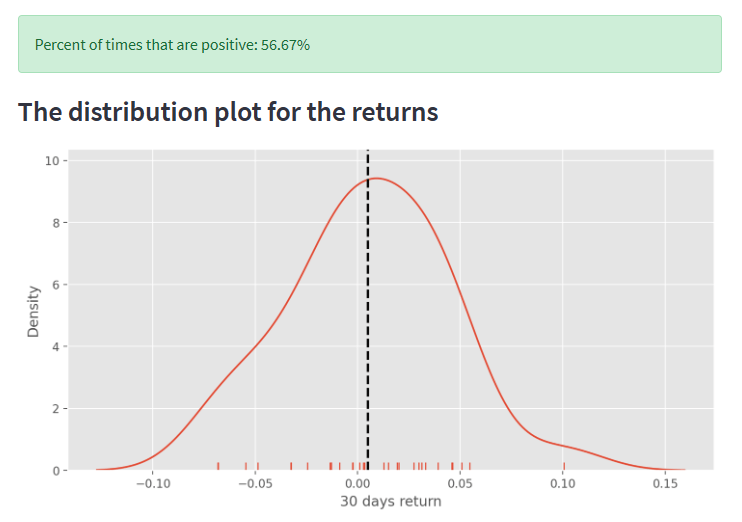
Furthermore, as of Monday, the Moving Average Convergence Divergence indicator (MACD) of 84% of the members in the S&P 500 index was zero. Data from 1996 onwards suggests that when 83%-84% of the members had their MACDs above zero, the index has been up 57% of the time over the subsequent 30 days. That is, in such instances, 57% of the time the index returns have been positive over the subsequent one-month period based on historical performance (see the distribution plot).

Distribution plot of S&P 500 index returns when 83%-84% of members have MACD above zero

image3.png

Data Source: Bloomberg; Chart Created by Manish Jaradi in Python

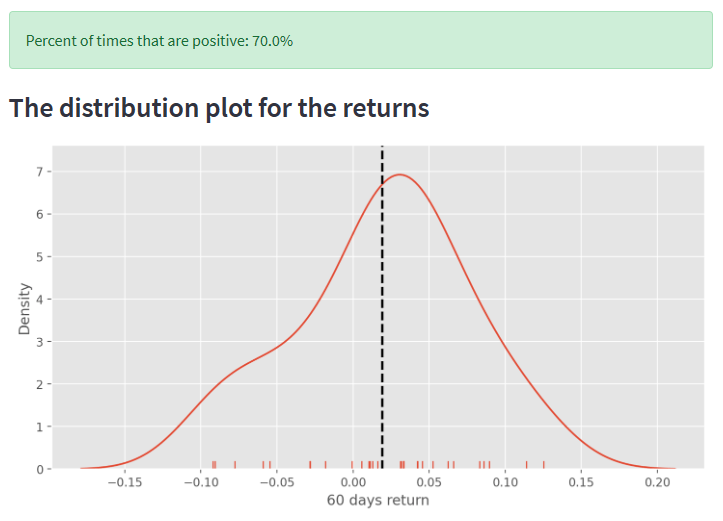
Similarly, data from 1996 onwards suggests that when 83%-84% of the members had their MACDs above zero, the index has been up 70% the time over the subsequent 60 days. That is, in such instances, 70% of the time the index returns have been positive over the subsequent two-month period based on historical performance (see the distribution plot).

Distribution plot of S&P 500 index returns when 83%-84% of members have MACD above zero

image4.png

Data Source: Bloomberg; Chart Created by Manish Jaradi in Python

China Warns Youth Unemployment to Worsen After Hitting Record

China Warns Youth Unemployment to Worsen After Hitting Record

China’s youth unemployment rate hit a record in June — marking a third consecutive month above 20% — and the government warned the situation may get even worse as new graduates start looking for work.

The jobless rate for people aged between 16 and 24 was 21.3% last month, the National Bureau of Statistics said Monday. That’s the highest on record in data that goes back to 2018, and NBS spokesman Fu Linghui said the number for July would likely be higher still.

Young people are finishing their studies and looking for jobs, adding to upward pressure on the unemployment rate, Fu told a press briefing Monday. The government has said it expects a record of nearly 12 million students to graduate from colleges and universities this year.

Youth unemployment has been at high levels for more than a year as Covid disruptions and a property slump add to existing structural problems in the labor market. The flagging recovery in the world’s second-biggest economy is now likely making employers reluctant to hire.

The youth rate continued to climb even as the national urban jobless rate remained at 5.2% over the past three months.

The central government attaches high importance to youth employment and has striven to put job creation for young people in a “more prominent position,” Fu said, adding that they were focusing their efforts on college graduates and young people starting their own businesses.

China still needs to work at stabilizing the employment situation, Fu said. He added that the youth rate will likely start trending back down after August.

For more on China Second-Quarter GDP, Key Data, Liquidity Operations, click here for our TOPLive blog.

Will China GDP spoil the party?

Will China GDP spoil the party?

The macro and market week in Asia starts with a bang on Monday, with a raft of top-tier economic indicators from China culminating in second-quarter GDP growth data.

Just how weak has the world’s second largest economy been recently, and will that be enough to dampen the growing optimism that the U.S. economy is heading for a ‘soft landing’?

A raft of Chinese economic indicators for June – investment, retail sales, industrial production and unemployment – will be released on Monday, as well as the second-quarter GDP report.

A Reuters poll of economists suggests growth slowed significantly. The consensus view of 0.5 per cent expansion over the first quarter is much lower than the 2.2 per cent quarter-on-quarter growth in the January-March period, which captured the initial bounce after lockdown restrictions were lifted.

Year-on-year growth is expected to come in at a more impressive 7.3 per cent, but that is inflated by base effects from the low level of growth in the same period last year.

Any optimism there was early this year has evaporated. Activity has slowed, the economy is sliding towards deflation, and investors have shunned China’s stocks, bond and currency. China’s economic surprises index last week hit a one year-low.

Later in the week China’s central bank sets its key one- and five-year lending rates. A sub-consensus Q2 GDP print on Monday could tilt expectations toward further easing.

Looking beyond China, inflation data from Japan and New Zealand on Friday and Wednesday, respectively, and unemployment figures from Australia on Thursday will be the most important points on the regional calendar for investors this week.

These come amid a renewed wave of bullish sentiment across local and world markets, in large part stemming from surprisingly tame U.S. inflation data. The dollar and U.S. bond yields have slumped, stocks and risk appetite have taken off.

According to Goldman Sachs’s financial conditions indexes, global financial conditions are the loosest since April last year, and emerging market financial conditions are now the loosest since February last year.

Little wonder the MSCI World stock index jumped 3.4 per cent last week, its best week since March, and the MSCI Asia ex-Japan index rallied 5.6 per cent, its best week since November and finally showing signs of catching up after underperforming all year.

The early stages of the second-quarter U.S. earnings season have also helped sustain the positive mood. Bank of America, Morgan Stanley, Goldman Sachs, Tesla and Netflix are among the big names reporting in a busier reporting schedule this week.

USD/JPY Bears Eye Sub-137.50 on China Q2 GDP Numbers

USD/JPY Bears Eye Sub-137.50 on China Q2 GDP Numbers

It is a quiet morning for the USD/JPY. There are no economic indicators from Japan to influence the Bank of Japan and the ultra-loose monetary policy stance.

However, economic indicators from China will set the tone, with Q2 GDP, industrial production, and retail sales in focus. To date, the markets have avoided a flight-to-safety, with expectations of a stimulus package from Beijing limiting the impact of weak data from China.

Trading Derivatives carries a high level of risk to your capital and you should only trade with money you can afford to lose. Trading Derivatives may not be suitable for all investors, so please ensure that you fully understand the risks involved, and seek independent advice if necessary. A Product Disclosure Statement (PDS) can be obtained either from this website or on request from our offices and should be considered before entering into a transaction with us. Raw Spread accounts offer spreads from 0.0 pips with a commission charge of USD $3.50 per 100k traded. Standard account offer spreads from 1 pips with no additional commission charges. Spreads on CFD indices start at 0.4 points. The information on this site is not directed at residents in any country or jurisdiction where such distribution or use would be contrary to local law or regulation.

Particularly weak GDP and industrial production numbers could question how much Beijing can support the economy.

The US Session

It is a quiet day on the US economic calendar. NY Empire State Manufacturing numbers for July will be in focus. However, barring a sharp decline, we do not expect the report to influence market risk sentiment.

According to the ISM survey, the US manufacturing sector contracted for the eighth consecutive month in June. The numbers from New York State would have to be particularly weak to draw interest.

While the economic calendar is on the light side, there are no FOMC member speeches to consider. The Fed went into the blackout period on July 15.

After a tumultuous week for the greenback, the markets are betting on a final 25-basis point Fed rate hike on July 26. According to the CME FedWatch Tool, the probability of a 25-basis point July Fed rate hike was 96.1% versus 93.0% one week earlier. Significantly, the chances of the Fed lifting rates to 5.75% in September stood at 15.4%, down from 24.2% one week earlier.

USD/JPY Price Action

Daily Chart

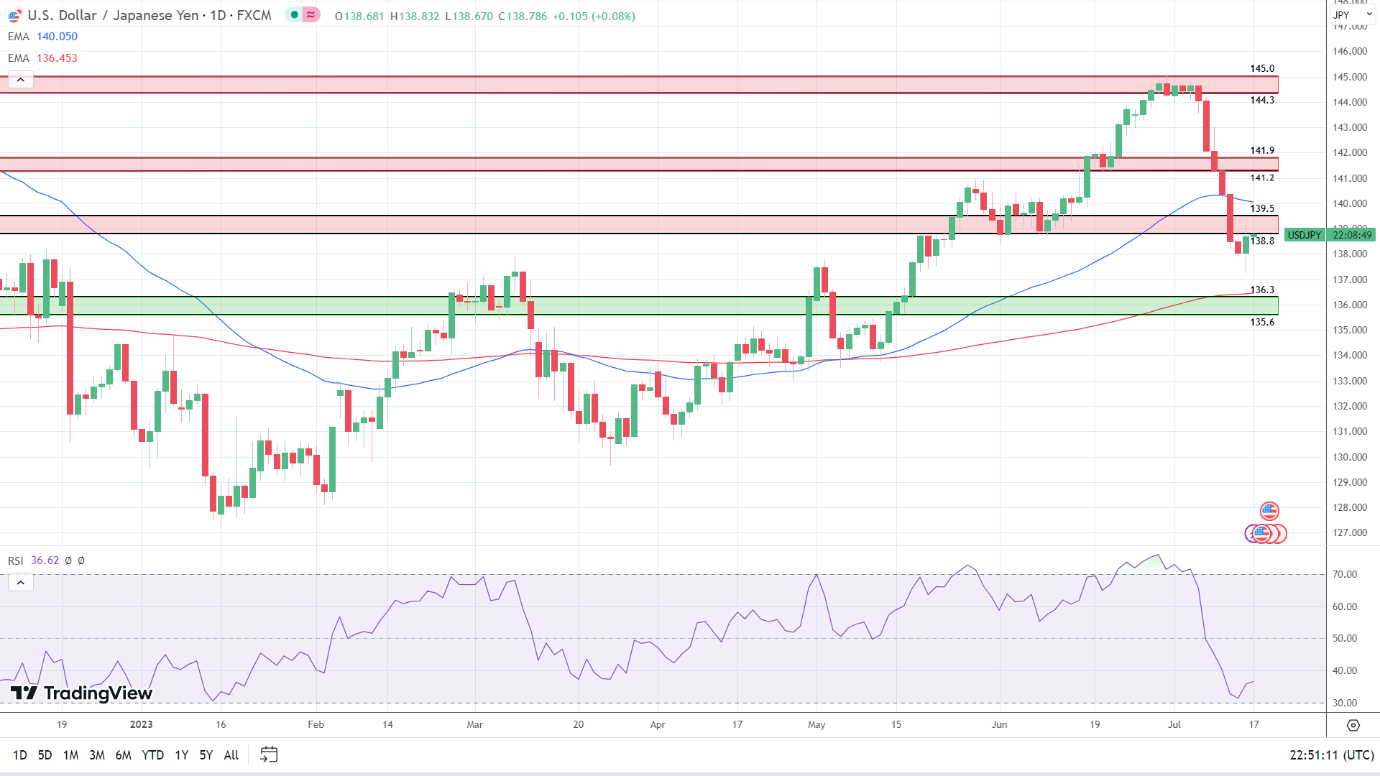
The Daily Chart showed the USD/JPY briefly fell through the 138 psychological level and remained below the 139.5 – 138.8 resistance band. Significantly, the USD/JPY also fell back from the 50-day EMA (140.050). However, the USD/JPY remained above the 200-day EMA (136.453), signaling bearish momentum over the near term but bullish momentum over the longer-term time horizon.

Notably, the 50-day EMA narrowed on the 200-day EMA and reflected bearish momentum.

Looking at the 14-Daily RSI, the 36.62 reading signals a bearish outlook, aligning with the 50-day EMA (140.050) to target sub-137.50 and the 136.3 – 135.6 support band. However, a USD/JPY move through the lower level of the 138.8 – 139.5 resistance band would bring 139.5 and the 50-day EMA (140.050) into view.

USD/JPY Daily Chart signals sub-137.5
USDJPY 170723 Daily Chart

4-Hourly Chart

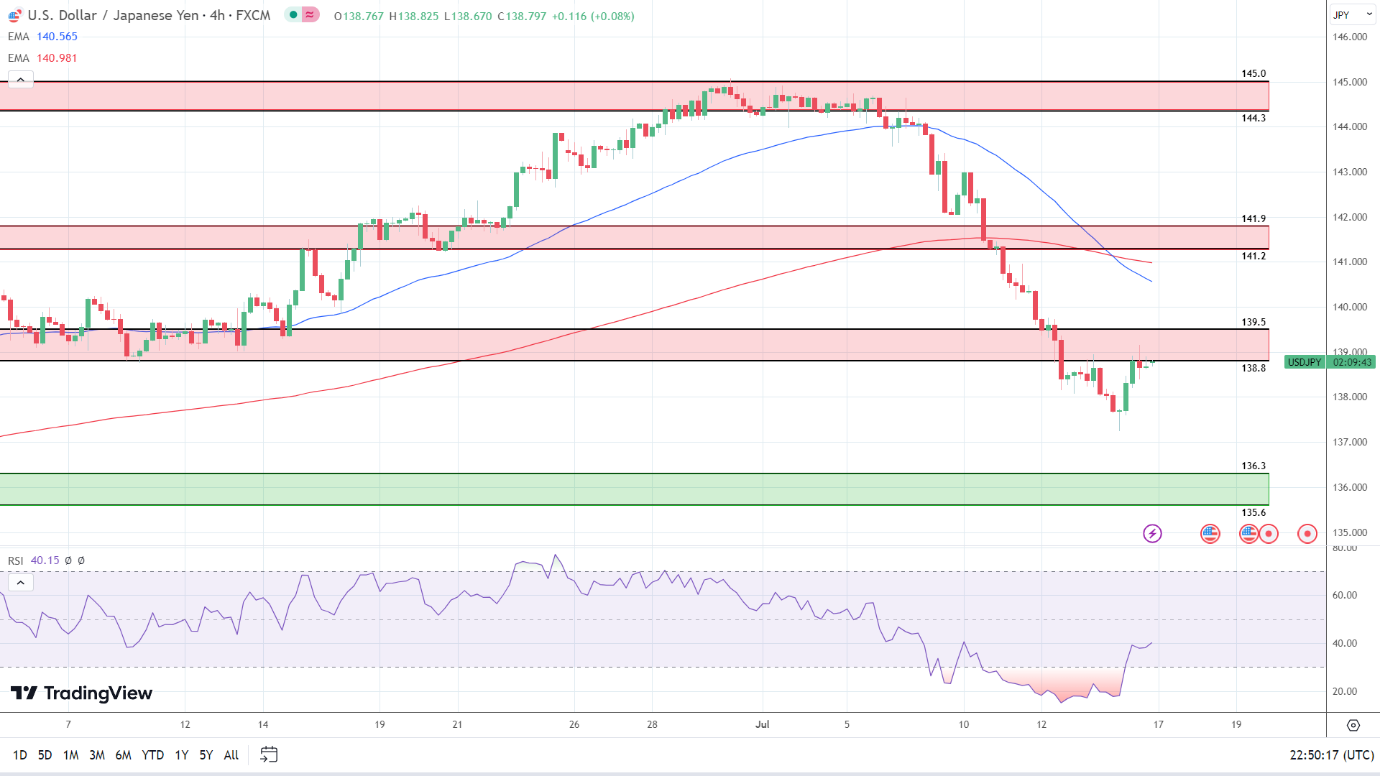
Looking at the 4-Hourly Chart, the USD/JPY faces strong resistance at 139. The USD/JPY remained below the 50-day (140.565) and 200-day (140.981) EMAs, sending bearish signals.

Significantly, the 50-day EMA pulled back from the 200-day EMA, signaling a return to sub-138 to bring the 136.3 – 135.6 support band into view.

The 14-4H RSI reading of 40.15 sends bearish signals, with selling pressure outweighing buying pressure. Notably, the RSI bearish aligned with the 50-day EMA, signaling a fall to sub-137.5 to target the 136.3 – 135.6 support band.

4-Hourly Chart sends bearish signals.
USDJPY 170723 4 Hourly Chart
US dollar’s Busted Bull Run Has Doomsayers Calling End of an Era

US dollar’s Busted Bull Run Has Doomsayers Calling End of an Era

The greenback’s worst slump since November has a bevy of strategists and investors saying a turning point is finally at hand for the world’s primary reserve currency. If they’re right, there will be far-reaching consequences for global economies and financial markets.

The US currency is teetering at the lowest level in more than a year after signs of cooling inflation bolstered bets that the Federal Reserve will soon stop hiking interest rates. Dollar bears are looking even further ahead, to what they say are inevitable rate cuts, something the market consensus sees happening at some point in 2024.

“Our call for the dollar to enter a multi-year downtrend is partly based on the fact that the Fed’s tightening cycle will morph into an easing cycle, and this will pull the dollar down even as other central banks cut as well,” Steven Barrow, head of G-10 strategy at Standard Bank, said in a note on Friday.

The Bloomberg dollar gauge was little changed in early Asian trading Monday. It tanked 2% last week, the biggest weekly drop since the five days through Nov. 11.

It’s hard to overstate the potential ripple effects from a long-term greenback slide. It would reduce import prices for developing nations, helping ease their inflation pressures. A greenback reversal also stands to bolster currencies like the yen, which has been tumbling for months, and upend popular trading strategies tied to a weaker yen. More broadly, a softer US currency would tend to boost American firms’ exports at the expense of their counterparts in Europe, Asia and elsewhere.

The Bloomberg dollar index’s 2% decline last week also contributed to gains in greenback-priced commodities such as oil and gold.

Many investors have been waiting for a downtrend in the dollar for months and the selloff has fund managers from M&G Investments to UBS Asset Management bracing for an outperformance in the likes of the yen and emerging-market currencies.

“The most likely path forward is the dollar remains weak throughout the coming months,” said Peter Vassallo, a fund manager at BNP Paribas Asset Management. He’s betting on gains for the Australian dollar, New Zealand dollar and Norwegian krone.

What Bloomberg Strategists Say:

The prevailing downwards trend in the dollar is primed to remain intact while the real yield curve flattens. One of the best leading indicators for the dollar, for instance, is the real yield curve. The intuition is the dollar is driven at the margin by the real return of foreign investors into US yields.

– Simon White, macro strategist.

Of course, there’s a long history of investors getting burned by premature bets on Fed rate cuts that would sink the dollar. That was the case early this year, when the currency seemed to be on the verge of a protracted downtrend only to stabilize as US economic data drove home that the Fed wasn’t about to stop hiking.

For the bears, the threat is that dynamic repeats itself, especially with the Fed likely to tighten further as soon as this month.

At Invesco Asset Management, Georgina Taylor isn’t prepared to reduce her dollar exposure just yet. Still firmly in data-watching mode, she’s not ready to conclude the battle to tame inflation is over.

“The interest-rate differential story is wavering but I wouldn’t give up on the dollar,” she said, given that the absolute difference in real yields remains high.

US economic resilience is the reason Michael Cahill at Goldman Sachs Group Inc. expects any dollar downturn will likely be shallower than in past cycles. Dollar support could crumble, however, if the Fed calls an end to its inflation fight even as the European Central Bank is compelled to keep rates higher for longer.

“The biggest risk that could lead to more dollar downside is that the inflation picture diverges,” said Cahill, a G-10 FX strategist. The bank forecasts the dollar will weaken to $1.15 per euro in 2024, from about $1.12 now, and that the yen will strengthen to 125 per dollar, from roughly 139 now.

Dollar bears can also lean on valuation measures. The currency’s strength has been particularly pronounced against the yen, to the point where the real effective exchange rate has Japan’s currency trading near its lowest level in decades.

‘From a valuation perspective, the dollar is still very overvalued,” said Paresh Upadhyaya, director of currency strategy at Amundi Asset Management. “I think markets are going to start to fade that.”

He points to the US’s twin deficits — its trade and budgetary shortfalls — as structural headwinds. But he also has in mind another dynamic that market watchers often cite, the dollar smile theory.

Read More: Wall Street Is Buying Into Dollar Smile Theory at a Frantic Pace

The thinking there is that the greenback typically gains when the US is either in a severe slump or a robust expansion — and falters in times of moderate growth.

“If the US engineers a soft landing, that is probably the best case for a weaker dollar you can ask for,” Upadhyaya said.

Things to watch: China GDP, US yields fall

Things to watch: China GDP, US yields fall

US Bonds and Stocks Halt Rally Amid Inflation Concerns

As Monday dawned, Asian equity markets were met with resistance following a pause in the rally of US bonds and stocks last Friday. The halt was primarily driven by worries that the Federal Reserve may not be able to control inflation effectively.

Australian equities futures barely budged while Hong Kong registered a drop of 0.7%. A similar trend was observed among Chinese stocks listed in the US which declined over 2%. Notably, Japanese markets remained closed due to a holiday.

Meanwhile, contracts for S&P 500 and Nasdaq 100 saw marginal decreases as trading kicked off on Monday in Asia. These indexes had reported minor losses on Friday as traders pointed towards consolidation after an upswing that propelled S&P 500 towards its best week since mid-June this year.

Japanese yen maintained stability post comments made by Bank of Japan Governor Kazuo Ueda expressing high uncertainty about the state of both the US and global economies after attending a Group-of-Seven meeting. He further indicated no significant change regarding Japan’s bond-market functionality since June’s monetary policy meeting.

The US bond market responded swiftly on Friday when consumer sentiment surged unexpectedly close to two-year highs alongside rising short-term price expectations – leading two-year Treasury rates upwards by fourteen basis points against earlier declining trends during previous days’ trades.

Market swaps suggest a strong likelihood for Fed raising the benchmark rate again later this month followed potentially one more time before ending the current cycle – based on positive pricing data outcomes. Investors also cheered earnings results from several major players including JPMorgan Chase & Co (NYSE:JPM), Wells Fargo & Company (NYSE:WFC), Citigroup Inc (NYSE:C), all surpassing lowered analyst estimates comfortably while UnitedHealth Group Incorporated (NYSE:UNH) profits eased concerns surrounding escalating medical costs.

China’s Economy Faces Headwinds as Post-Pandemic Surge Fades

Fresh economic figures from China set to be released this week are expected to reveal that its post-pandemic rebound is rapidly losing steam, leading to fresh calls for stimulus initiatives.

Earlier this year, China saw robust economic performance following the easing of stringent COVID-19 restrictions. However, recent indicators highlight a significant decline in economic momentum due to soft domestic and international demand coupled with an ongoing downturn in its traditionally influential property market.

According to financial experts surveyed by Reuters, China – the globe’s second-largest economy – probably achieved just 0.5% growth in Q2 compared with Q1 on a seasonally adjusted basis. Separate June data is anticipated to show continued cooling trends across industrial production, retail sales, and fixed asset investment sectors.

Some financial analysts attribute this slowdown to lingering impacts from long-term strict COVID measures and regulatory constraints on key sectors such as property and technology – despite government attempts at reversing some curbs recently for economic support.

Amidst prevailing uncertainties, households and private businesses are adopting conservative strategies focusing more on increasing savings or reducing debts rather than making fresh purchases or investments. The issue of youth unemployment has reached unprecedented levels.

On an annual comparison basis, however, GDP may have seen 7.3% growth between the April-June period versus last year’s figure which represented only a 4.5% increase.

Meantime, data revealed last Thursday showed that Chinese exports dipped most sharply within three years during June; registering a worse-than-expected fall of 12.4%, reflecting global cooling demands.