China’s futures market sees higher trading in first six months

China’s futures market sees higher trading in first six months

BEIJING, July 16 (Xinhua) — China’s futures market posted strong year-on-year growth in both transaction volume and turnover in the first half of 2023, according to the China Futures Association.

The trading volume surged by 29.71 percent year on year to over 3.95 billion lots in the January-June period, bringing the total turnover to 262.13 trillion yuan (about 36.76 trillion U.S. dollars) in the period, the data showed.

China’s futures market was relatively active in the first half of the year, thanks to a recovery of the economy and the orderly development of production and operation of enterprises, said Jiang Hongyan with Yinhe Futures.

As of the end of June 2023, 115 futures and options products were listed on the Chinese futures market, data from the association showed.

US Dollar Finds Traction While China GDP Misses Estimates. Where to for USD?

US Dollar Finds Traction While China GDP Misses Estimates. Where to for USD?

The US Dollar nudged higher against the Aussie and Kiwi Dollars today but lost ground to the Japanese Yen and Swiss Franc in a risk-off type of currency move.

It may reflect the disappointing data from China today that was soft overall with the economy growing at 6.3% year-on-year in the second quarter against forecasts of 7.3% and 4.5% in the previous quarter.

Retail sales grew 3.1% year-on-year to the end of June versus estimates of 3.2% and 12.7% for May.

There were some bright spots though. Industrial production in the world’s second-largest economy expanded by 4.4% year-on-year to the end of June, well above the 2.7% anticipated and 3.5% prior.

Fixed asset investment also grew 3.8% over the January to June period rather than the 3.5% expected.

China’s CSI 300 equity index was down more than 1% but other APAC markets have had a subdued start to the trading week. Tokyo was out for a holiday and typhoon Talim closed markets in Hong Kong as well as Taiwan. Futures are pointing to a slightly negative start to the Wall Street cash session.

G-20 Finance Ministers and central bankers are gathering today in India and while there are likely to be numerous headlines emanating from the conference, we won’t be hearing from any Federal Reserve speakers.

They have gone into a communications blackout ahead of the Federal Open Market Committee (FOMC) meeting on July 26th. The market has almost fully priced in a 25 basis point lift at the conclave.

Crude oil has slipped going into Monday’s session with both the WTI and Brent futures contracts down around 1%. Gold is little changed trading near the middle of its range just above USD 1950.

Several European central bank voting members will be crossing the wires today, including President Christine Lagarde.

The full economic calendar can be viewed here.

The

Quiz
Discover what kind of forex trader you are
Start Quiz

DXY (USD) INDEX TECHNICAL ANALYSIS

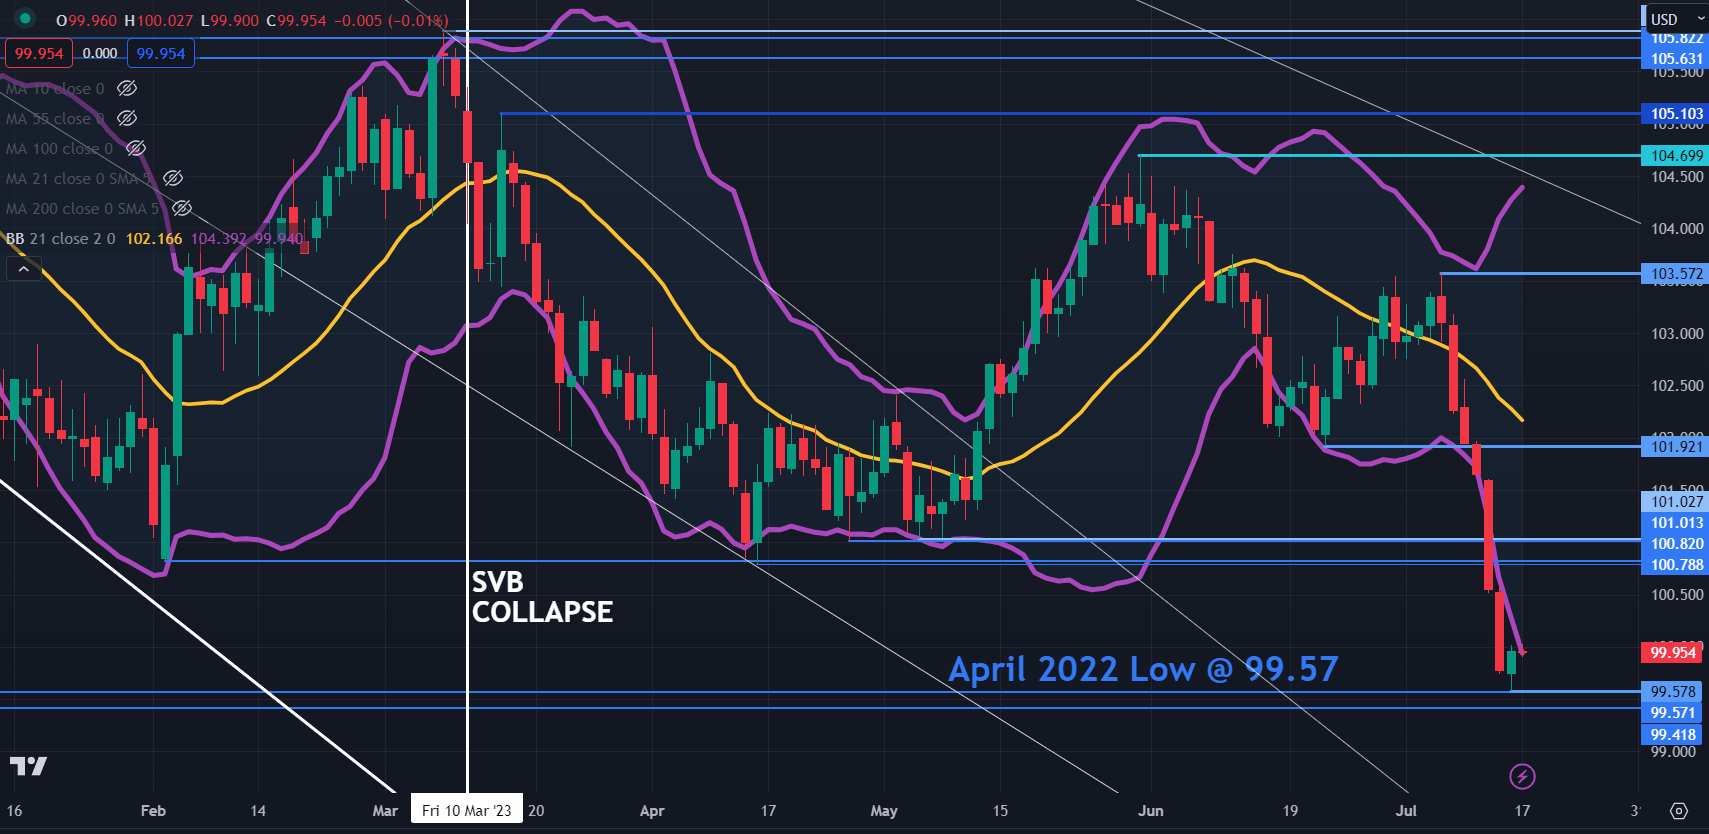
The DXY (USD) index made a 15-month low on Friday after breaking below prior support levels in the 100.80 – 101.00 area.

That zone might now become a breakpoint resistance zone ahead of another breakpoint at 101.92, and the peak of 103.57.

The recent sell-off broke below the lower band of the 21-day simple moving average (SMA) based Bollinger Band. A close back inside the band might signal a pause in the bearish run or a potential reversal.

The low on Friday was 99.58 just above the April 2022 low of 99.57. Those levels could provide support ahead of a break point at 99.42.

image1.png

Chart created in TradingView

Foreign trade and import prices – May 2023

Foreign trade and import prices – May 2023

In May 2023 seasonally-adjusted data, compared to April 2023, decreased by -0.3% for exports and by -3.0% for imports. Exports decreased by -1.7% for EU countries and increased by +1.2% for non-EU countries. Imports dropped both for EU countries (-1.7%) and for non-EU countries (-4.5%).

Over the last three months, seasonally-adjusted data, compared to the previous three months, dropped both for exports (-3.3%) and for imports (-5.9%).

In May 2023, compared with the same month of the previous year, exports increased by +0.9% and imports dropped by -7.6%. Outgoing flows decreased by -1.9% for EU countries and rose by +4.0% for non-EU countries. Incoming flows decreased by -2.1% for EU area and by -13.8% for non-EU area.

In May 2023, trade balance registered a surplus of +4,711 million Euros (+267 million Euros surplus for EU countries and +4,444 million Euros surplus for non-EU countries). Excluding energy, trade balance surplus reached +9,542 million Euros.

In May 2023, import prices decrease by 1.5% on monthly basis (-0.8% for the euro zone, -2.1% for the non-euro zone). Over the last three months, compared to the previous three months, import prices decreased by 4.9% (-1.0% for the euro zone, -8.1% for the non-euro zone).

Import prices, compared to the same month a year ago, decrease by 7.8% in May 2023 (-0.3% for the euro zone and -13.7% for the non-euro zone).

Australian Dollar Skips a Beat on New RBA Governor Michele Bullock’s Appointment

Australian Dollar Skips a Beat on New RBA Governor Michele Bullock’s Appointment

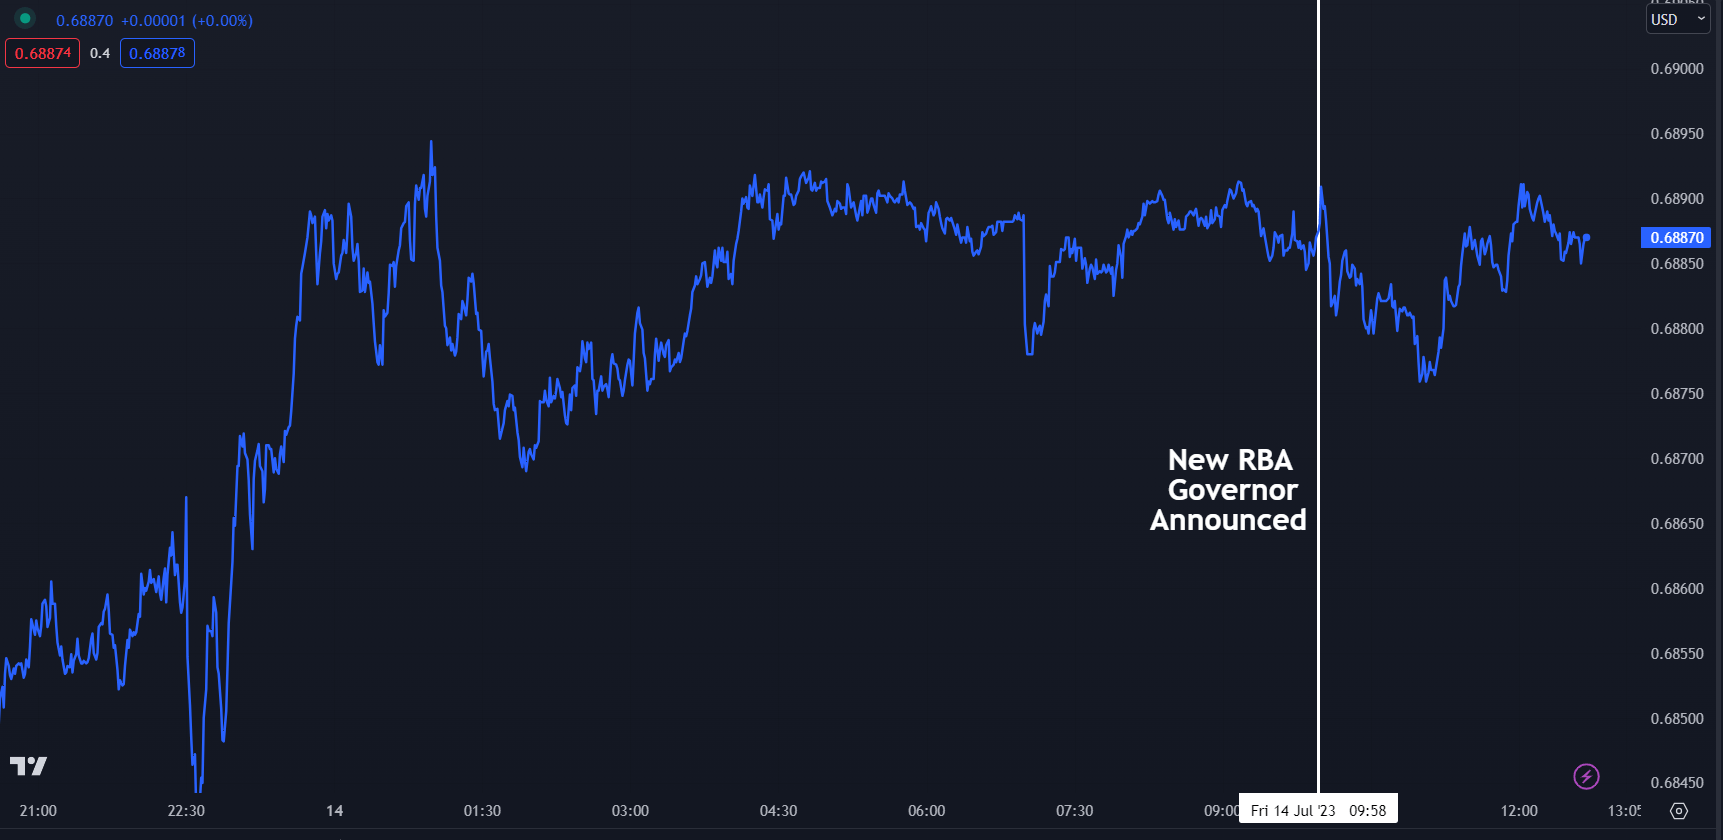
The Australian Dollar eased after Australian Treasurer Jim Chalmers announced that Michele Bullock will take over as RBA Governor in September, replacing Mr Philip Lowe.

The currency has since recovered, and Australia’s S&P/ASX 200 equity index steadied to higher ground after a positive lead from Wall Street.

Ms Bullock has been the Deputy Governor of the bank since April 2022 and has been with the institution since 1985. She has a reputation as a leading economist in her own right.

The appointment is mostly viewed as a steady transfer of leadership at a critical time for monetary policy at the RBA.

Some monetary policy tourists in mainstream media have said that the bank has hiked rates unnecessarily aggressively. They might be disappointed with the new Governor if some of her recent comments reflect policy going forward.

In a recent speech, she remarked that the unemployment rate may need to get to 4.5% in order to take the heat out of inflation. It is currently 3.6%.

The implication for markets is that Australian monetary policy is likely to be managed in a similar fashion to the way that it has been for several decades, representing a steady hand at the wheel.

Interest rate futures tilted to a less hawkish outlook earlier this week with the six-month part of the curve erasing 25 basis points of tightening.

The markets now see only a slim chance of a hike by the RBA at its August meeting but a 25 basis point lift by year-end is anticipated.

AUD/USD INTRADAY CHART

image1.png

AUD/USD CHART

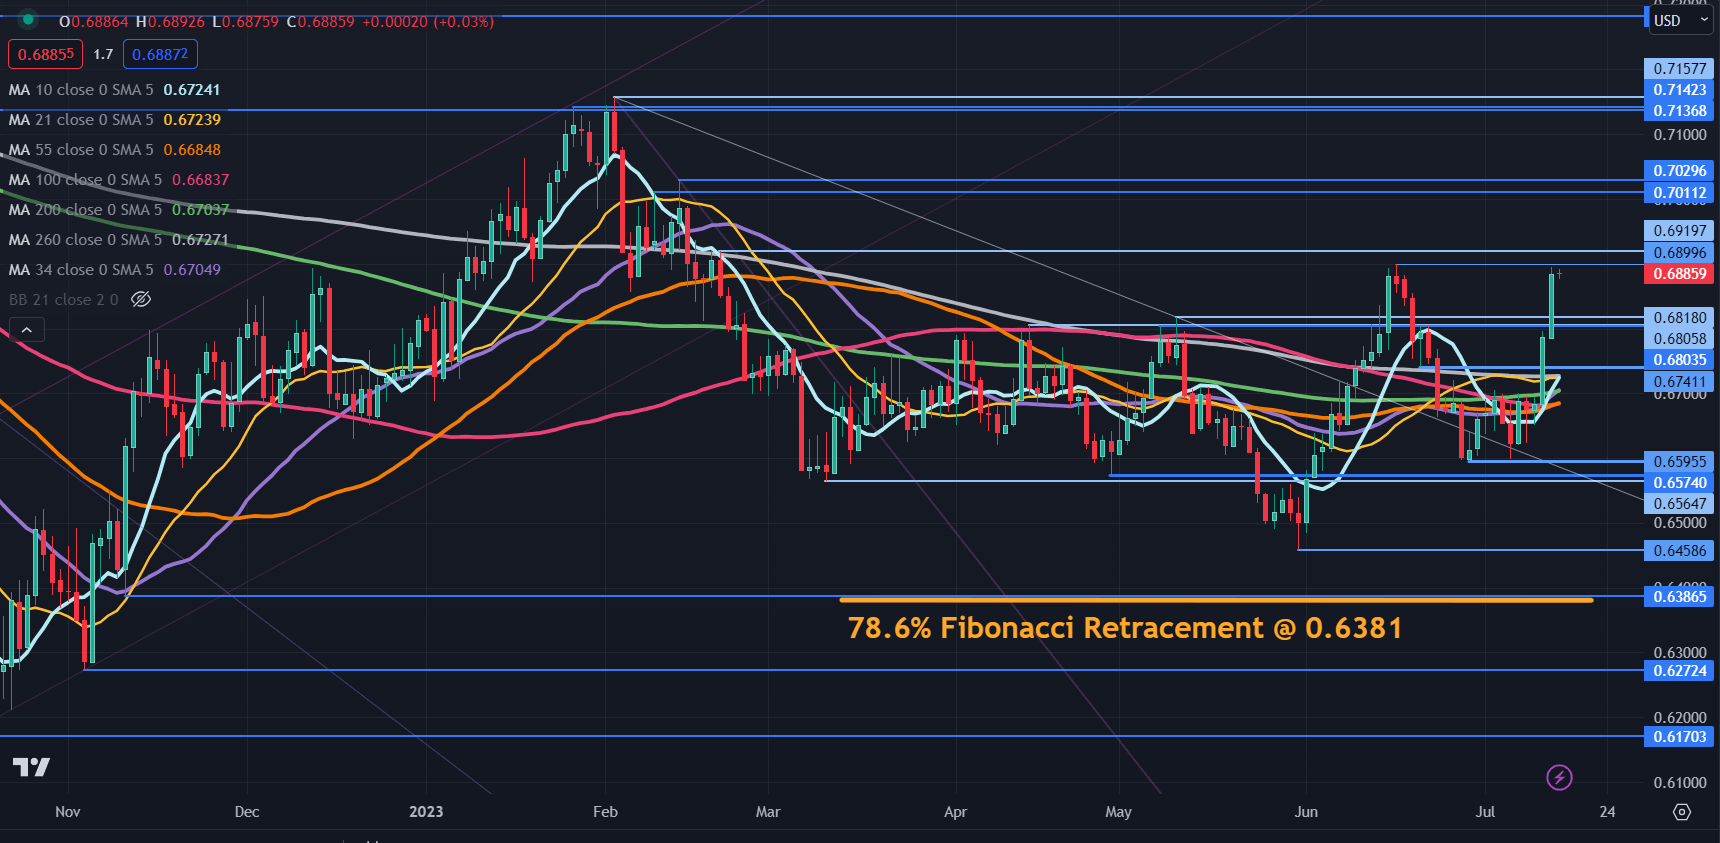
AUD/USD has been in a five-month trading range of 0.6459 – 0.6900 and it is testing the upper bound going into Friday’s trading session.

Resistance could be at the previous peak of 0.6900 and 0.6920 ahead of possible resistance in the 0.7010 – 0.7030 area.

On the downside, support might be at the breakpoints of 0.6818, 0.6806. 0.6803 and 0.6741 ahead of the prior low of 0.6595.

The latest rally saw the price break cleanly above all period daily Simple Moving Averages (SMA). This might indicate that bullishness could evolve.

Those SMAs may provide support in the 0.6880 – 0.6920 area. It is rare for all of these SMAs to be clustered so close together and this might be hinting toward an emerging trend.

image2.png


USD/JPY in Downward Spiral as Yields Tank, GBP/USD Soars to Fresh 2023 Highs

USD/JPY in Downward Spiral as Yields Tank, GBP/USD Soars to Fresh 2023 Highs

USD/JPY deepened losses on Thursday, dragged down by falling U.S. Treasury rates. Since Monday, the 10-year yield has fallen nearly 30 basis points to the edge of 3.8%, erasing all gains from the previous week, with the slump accelerating over the past couple of sessions following weaker-than-expected U.S. consumer costs and wholesale inflation.

While market expectations remain in a state of flux, rapidly softening price pressures in the economy could nudge the Fed to end its tightening campaign sooner than projected. This means that the fully discounted quarter-point hike for the July FOMC meeting could be the last of the cycle before a long pause, a situation that could undermine the U.S. dollar in the FX space.

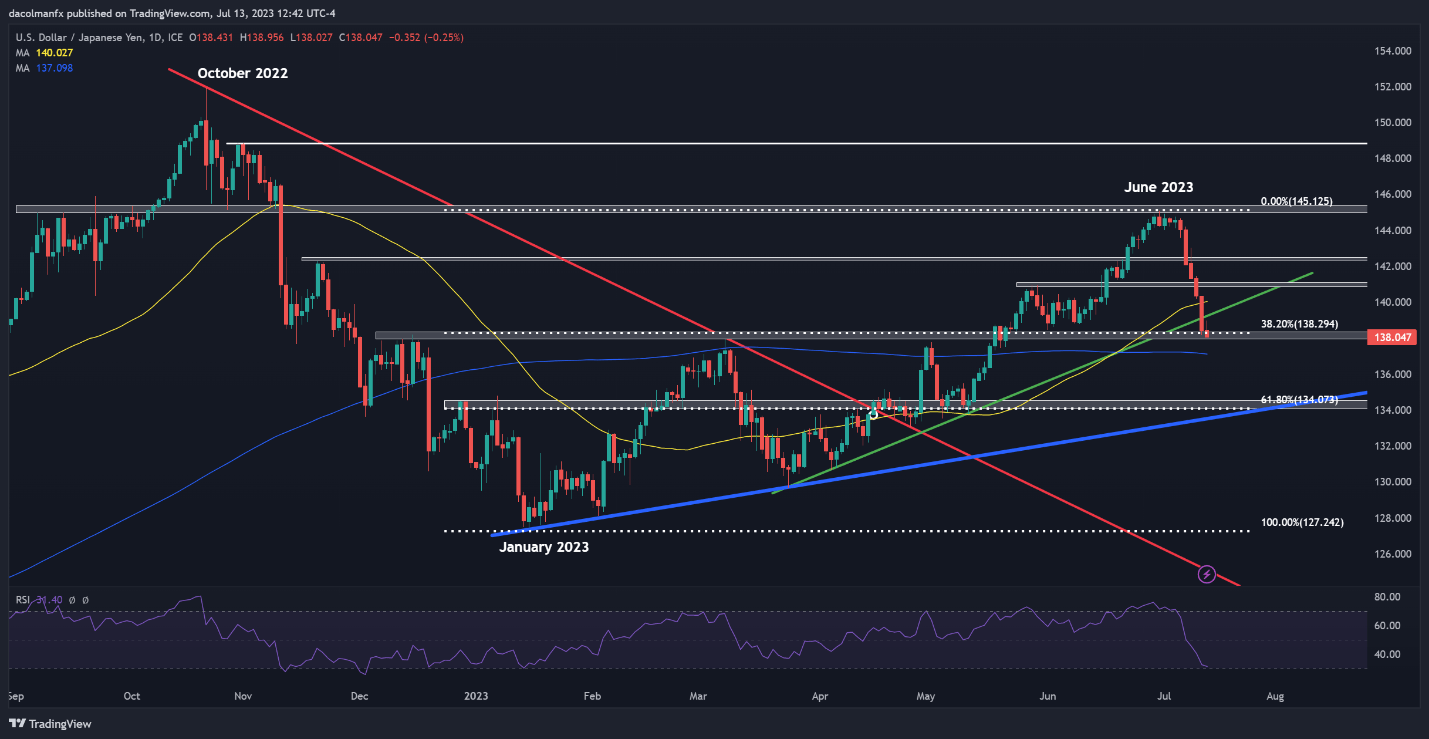
Turning to price action analysis, USD/JPY has fallen sharply in recent days after breaking below its 50-day simple moving average and the trendline extended from the March lows. Following this pullback, the pair has reached an important support area: the 38.2% Fibonacci retracement of the Jan-Jun rally. If this floor taken out, we could see a move towards the 200-day simple moving average, followed by 134.00.

On the flip side, if USD/JPY establishes a base off current levels and resumes its ascent, initial resistance appears at 139.25 and 140.00 thereafter. Clearance of these two technical barriers could spark follow-through buying and restore bullish impetus, setting the stage for a rally toward the psychological 141.00 mark.

USD/JPY TECHNICAL CHART

A screenshot of a graph  Description automatically generated

GBP/USD TECHNICAL ANALYSIS

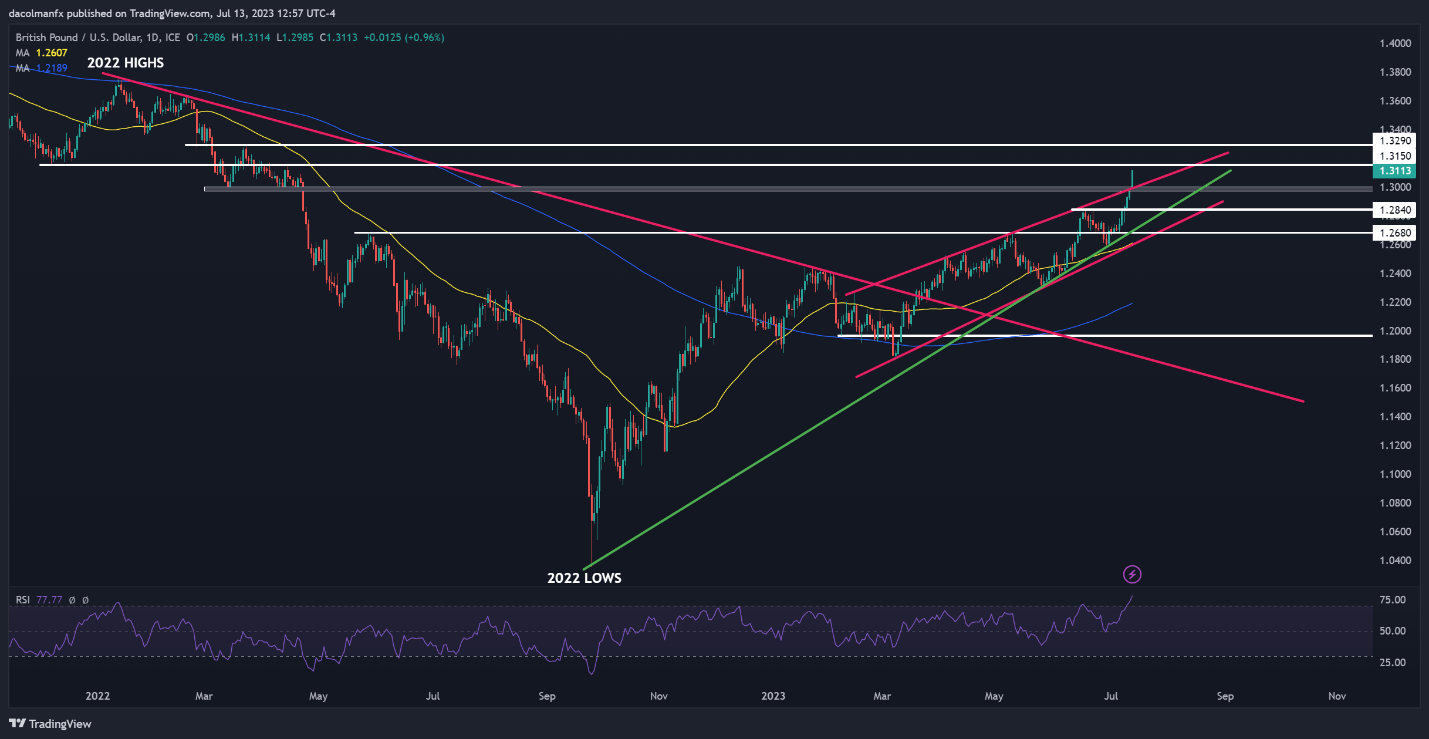
GBP/USD breached an important technical resistance at 1.3000 on Thursday, reaching its best levels since April 2022 and easily surpassing the 1.3100 handle. After this solid advance, the pair is approaching a key ceiling near 1.3150, as shown on the daily chart below. Buyers may struggle to get over this hurdle given stretched markets and overbought conditions, but a bullish breakout remains possible and, if confirmed, could pave the way for a move towards 1.3290.

In contrast, if upward momentum begins to fade and prices reverse lower, initial support rests at the psychological 1.3000 mark, but further losses could be in store on a push below this zone, with the next downside target located at 1.2840, followed by 1.2680.

GBP/USD TECHNICAL CHART

A screen shot of a graph  Description automatically generated

US Dollar Forecast: Sentiment Positive on AUD/USD, NZD/USD, Bearish on USD/CAD

US Dollar Forecast: Sentiment Positive on AUD/USD, NZD/USD, Bearish on USD/CAD

AUD/USD IG CLIENT SENTIMENT OUTLOOK – BULLISH

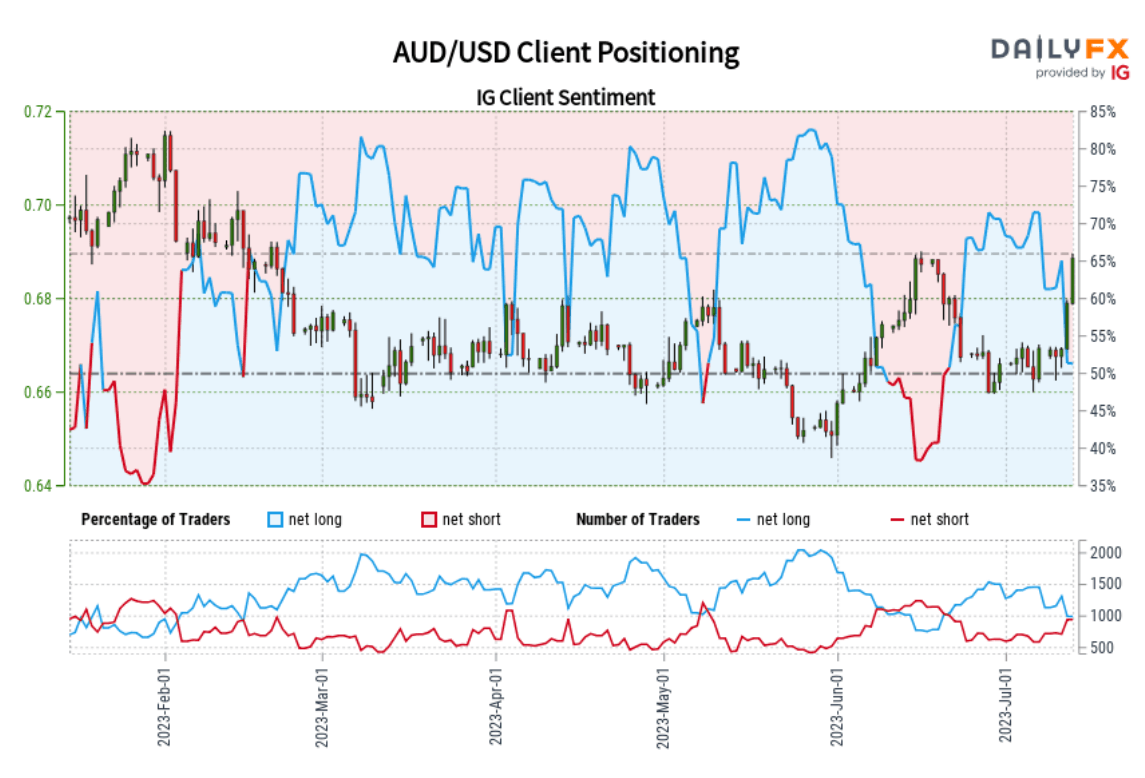
IG client sentiment data shows 45.50% of traders are net-long AUD/USD, with the ratio of short to long sitting at 1.20 to 1. The number of traders who are net-long is 21.36% below yesterday’s levels and 39.21% lower from last week, while the number of traders net-short is 38.32% higher than yesterday and 64.44% above what was recorded in the previous week.

We typically take a contrarian view to crowd sentiment, and the fact that shorts are overwhelming longs suggests AUD/USD may remain on an upward trajectory. Overall, traders betting against AUD/USD are rising compared to yesterday and last week, and the combination of current sentiment and recent changes in positioning gives us a stronger AUD/USD-bullish contrarian trading bias.

image1.png

NZD/USD IG CLIENT SENTIMENT OUTLOOK – BULLISH

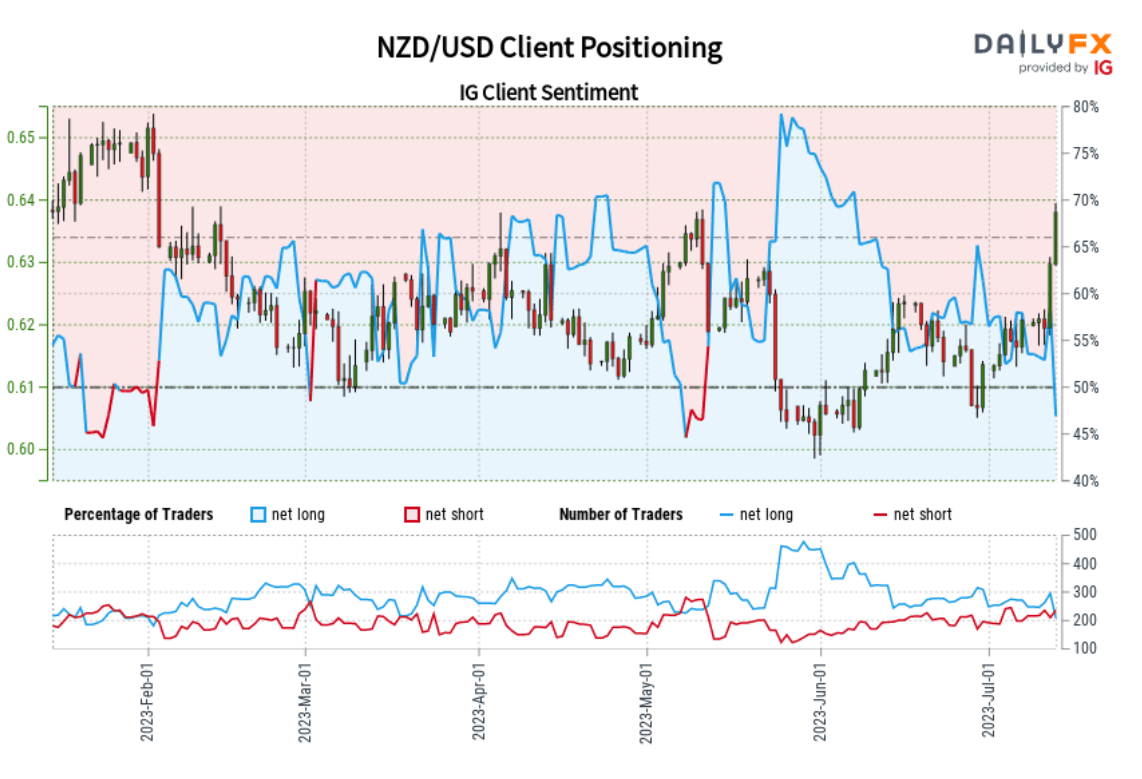
IG Client Sentiment data shows 41.85% of traders are net-long NZD/USD, with the ratio of short to long standing at 1.39 to 1. Further, data reveals that traders are now at their least net-long since Dec 27 when the pair traded around 0.63. Overall, the number of traders net-long is 17.75% lower than yesterday and 34.71% below last week’s level, while the number of traders net-short is 28.78% higher than yesterday and 20.00% above what was observed last week.

We typically take a contrarian view to crowd sentiment, and the fact traders are net-short in aggregate suggests NZD/USD may continue to rise. Traders are further net-short than yesterday and last week, and the combination of current sentiment and recent changes in positioning gives us a stronger NZD/USD-bullish contrarian trading bias.

image2.png

USD/CAD IG CLIENT SENTIMENT OUTLOOK – BEARISH

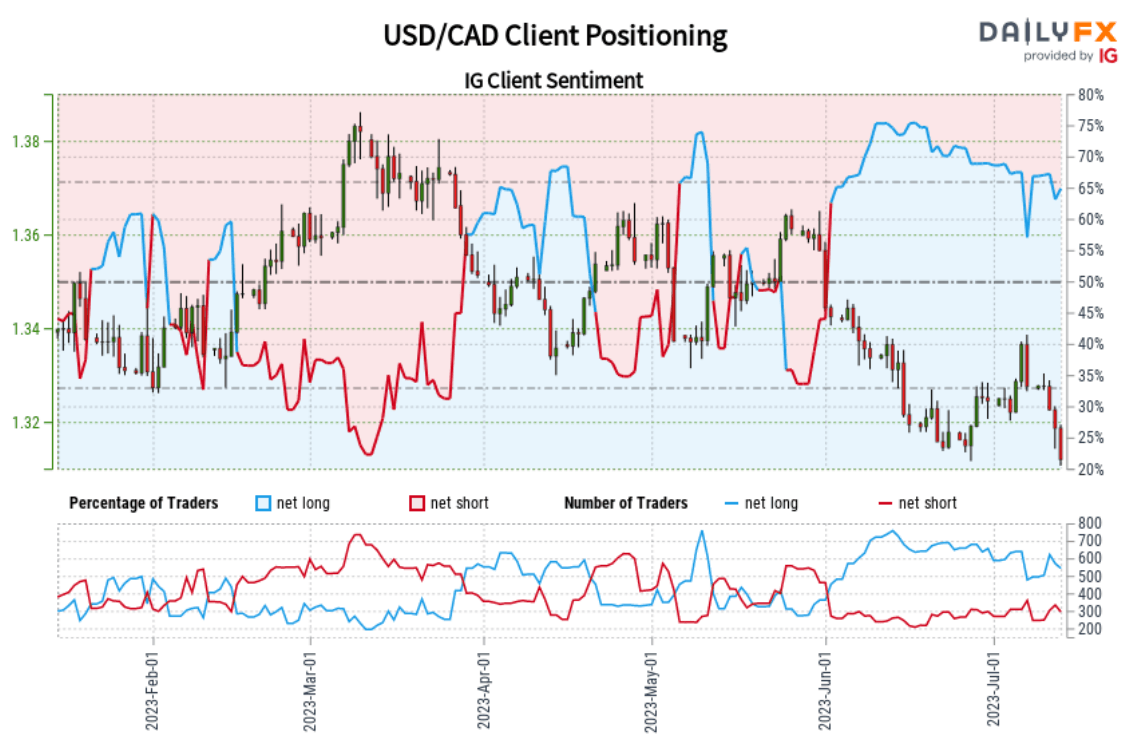
IG Client Sentiment data shows 66.59% of traders are net-long with the ratio of long to short at 1.99 to 1. The number of traders net-long is 0.36% higher than yesterday and 10.43% below last week’s prevailing level, while the number of traders net-short is 16.67% lower than yesterday and 3.78% lower from last week.

We typically take a contrarian view to crowd sentiment, and the fact traders are overwhelmingly net-long suggests USD/CAD may continue to retreat. Positioning is more net-long than yesterday but less net-long from last week. All in all, the combination of current sentiment and recent changes in the balance of shorts and longs gives us a bearish trading bias.

image3.png


Asia Day Ahead: US Mega-Cap Tech Build on Gains; Singapore Avoids Technical Recession

Asia Day Ahead: US Mega-Cap Tech Build on Gains; Singapore Avoids Technical Recession

Following a downside surprise in the recent US consumer price index (CPI) data, the release of US June producer prices overnight further reinforces the narrative of abating inflation risks, paving the way for Wall Street to add to recent gains (DJIA +0.13%; S&P 500 +0.61%; Nasdaq +1.58%). Strength was largely concentrated in the growth sectors however, with performance heavy-lifted by megacap tech stocks once more (NVDA +4.7%, GOOG +4.4%, AMZN +2.7%, TSLA +2.2%).

The US headline producer price index (PPI) for June came in at a 0.1% growth from a year ago, way below the 0.4% forecast. The core aspect revealed promising progress from tighter policies as well, heading lower to 2.4% versus the 2.6% consensus. Month-on-month, core PPI came in at 0.1% (consensus 0.2%).

With that, market rate expectations found further conviction for a rate pause from the Federal Reserve (Fed) after July, along with more leeway for rate cuts into 2024. Treasury yields headed lower, with the US 10-year down for the fourth straight day while the two-year yields widen its gap further below the key 5% level.

Looking ahead, the US consumer sentiment data for July will be in focus, with expectations for an uptick in the reading to 65.5 from the 64.4 in June, which will be the third straight month of increase. Further recovery in US consumer sentiments may likely provide some support for soft landing hopes, considering that past recessions since 1968 have always been marked by a decline in the US consumer sentiment data.

The Russell 2000 has managed to break out of its previous consolidation zone to deliver a new four-month high. Its Relative Strength Index (RSI) has retained above its key 50 level thus far, as an indication of buyers in control, along with a firm bounce off its 50-day and 200-day moving average (MA) at the start of the month. Further upside may leave the key psychological 2,000 level on watch for a retest, while the 1,900 level will now serve as a resistance-turned-support.
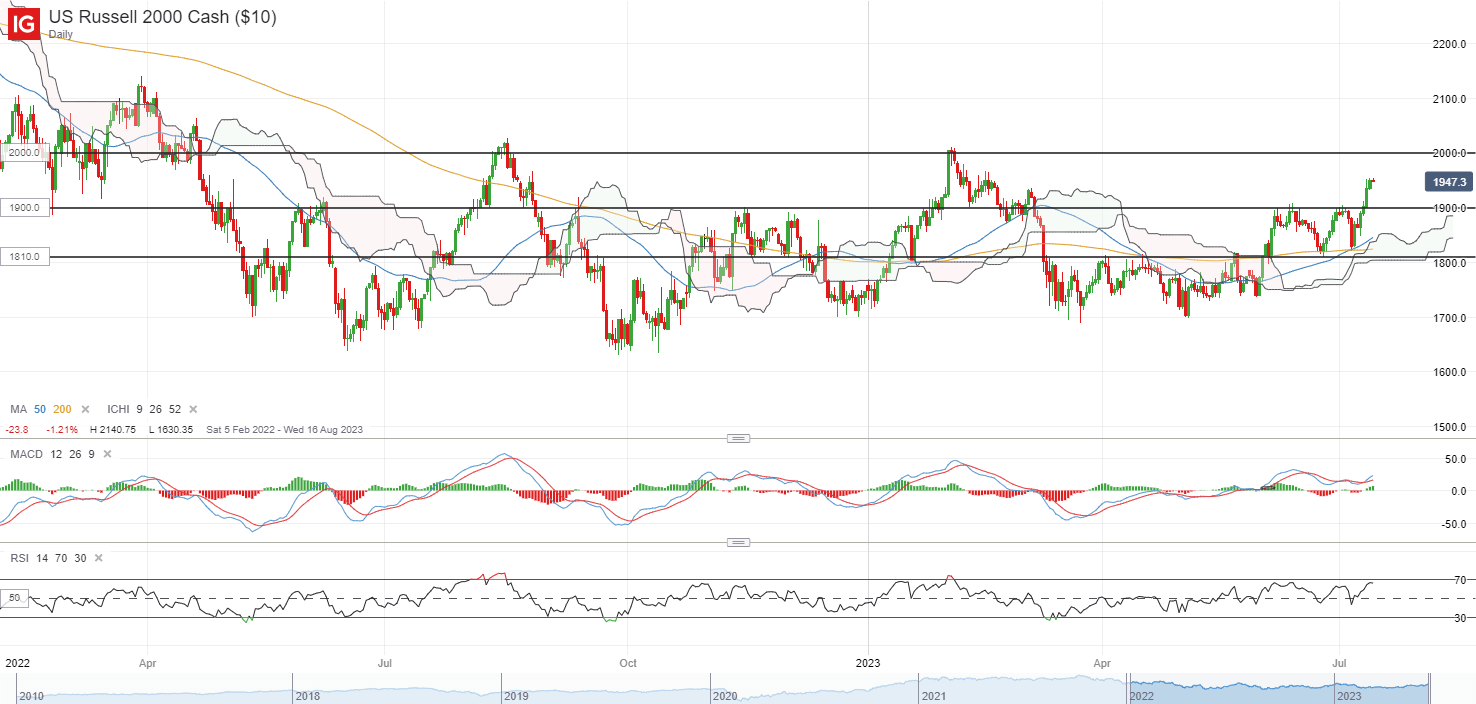
image1.png

Asian stocks look set for a positive open, with Nikkei +0.14%, ASX +0.49% and KOSPI +0.68% at the time of writing. The economic calendar this morning saw some resilience in Singapore’s advance Q2 gross domestic product (GDP) growth rate, with the economy narrowly avoiding a technical recession with a tepid expansion. Quarter-on-quarter read was largely in line with expectations at 0.3%, while year-on-year read came in at 0.7%, which slightly outperformed the 0.6% consensus.

While we have a less-bad-than-feared outcome, economic challenges are still presented with a still-weak showing in the manufacturing sector (-7.5% YoY versus -6% in 1Q), having to lean on strength in the services industries for some cushioning. Heading into the second half of this year, much may hinge on China’s recovery story and economic conditions in the US and other trading partners holding up to build on current resilience.

Following the data release, the USD/SGD headed further to the downside, having already been weighed by the sell-off in the US dollar over the past few days. The breakdown of the ascending triangle pattern has brought about a current retest of the 1.321 level. While an oversold RSI read may drive an attempt for a near-term bounce, the overall trend continues to lean on the downside. Its moving average convergence/divergence (MACD) has crossed below the zero level and the 1.340 level of support confluence has given way, where its Ichimoku cloud stands alongside its 100-day MA. Further breakdown of the 1.321 level may pave the way to retest its year-to-date low at the 1.303 level.
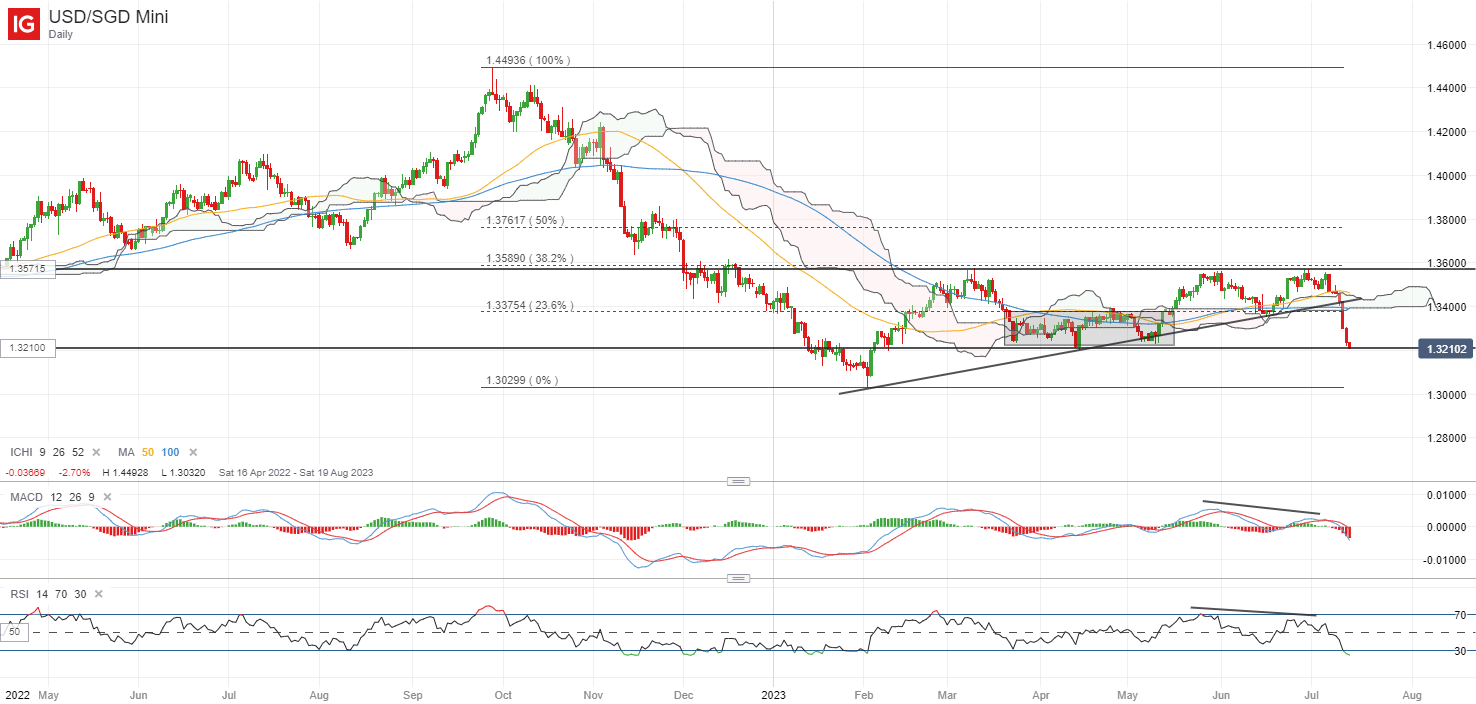
image2.png


On the watchlist: GBP/USD broke to new high since April 2022

Further weakness in the US dollar and a better-than-expected read in the UK GDP figure for May have propelled the GBP/USD above the key 1.300 level of resistance yesterday. The three-month year-on-year GDP came in flat (0%), but a less-bad-than-feared scenario provided some solace with estimates looking for a worse outcome of a 0.1% contraction.

The formation of a new higher high and the RSI retaining above the key 50 level reinforce the overall upward trend in place. Further upside may place the 1.342 level on watch as the next level of resistance for a retest. The IG client sentiment data shows that 73% of traders are net-short in the GBP/USD, with further net-short positioning building from last week. A typical contrarian view to crowd sentiment may point towards a stronger bullish trading bias for the GBP/USD.
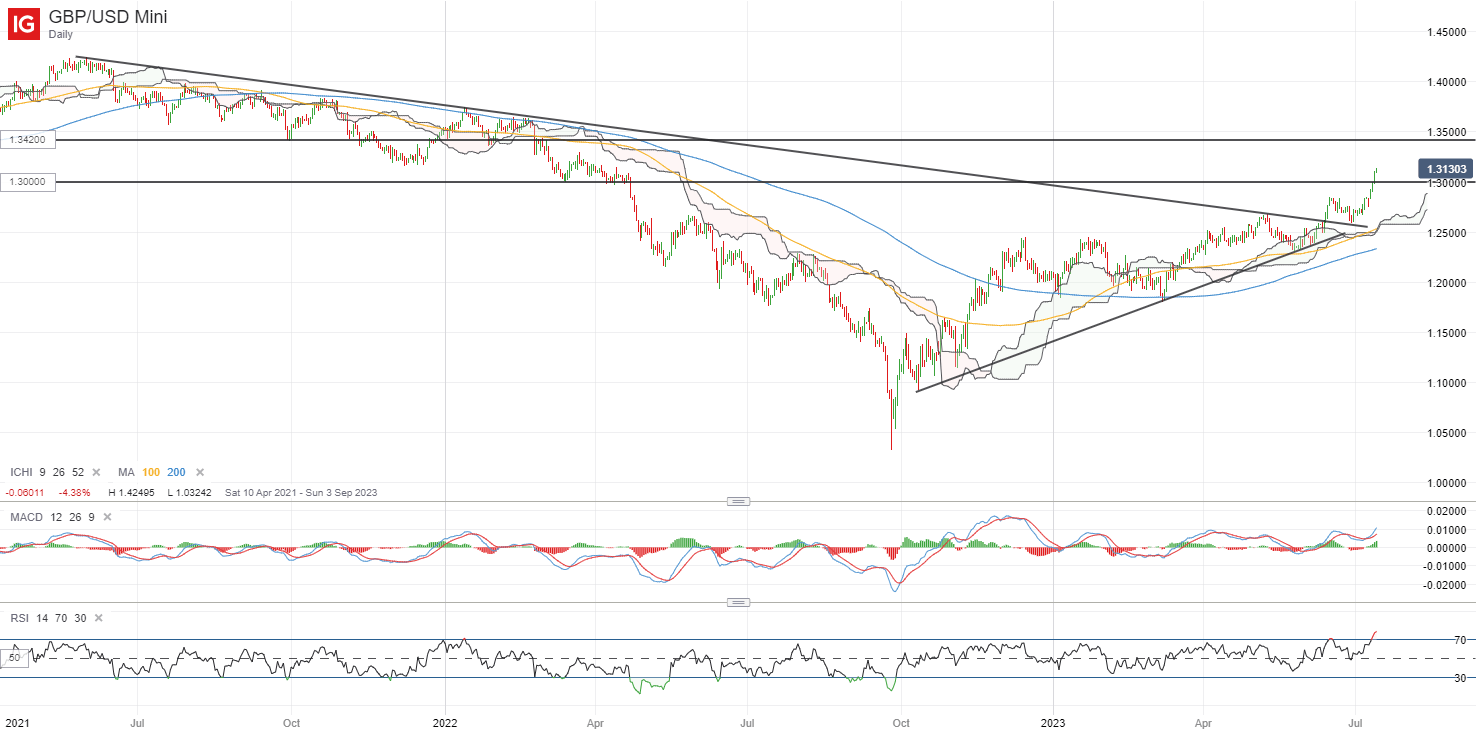

image3.png


Bitcoin & Ethereum After Ripple Wins SEC Case: Preparing for an Advance

Bitcoin & Ethereum After Ripple Wins SEC Case: Preparing for an Advance

Cryptocurrencies jumped after a US judge ruled on Thursday that Ripple Labs Inc did not violate federal securities law by selling its XRP token on public exchanges. Technical charts suggest Bitcoin and Ethereum could be preparing for another leg higher.

BTC/USD Daily Chart

image1.png

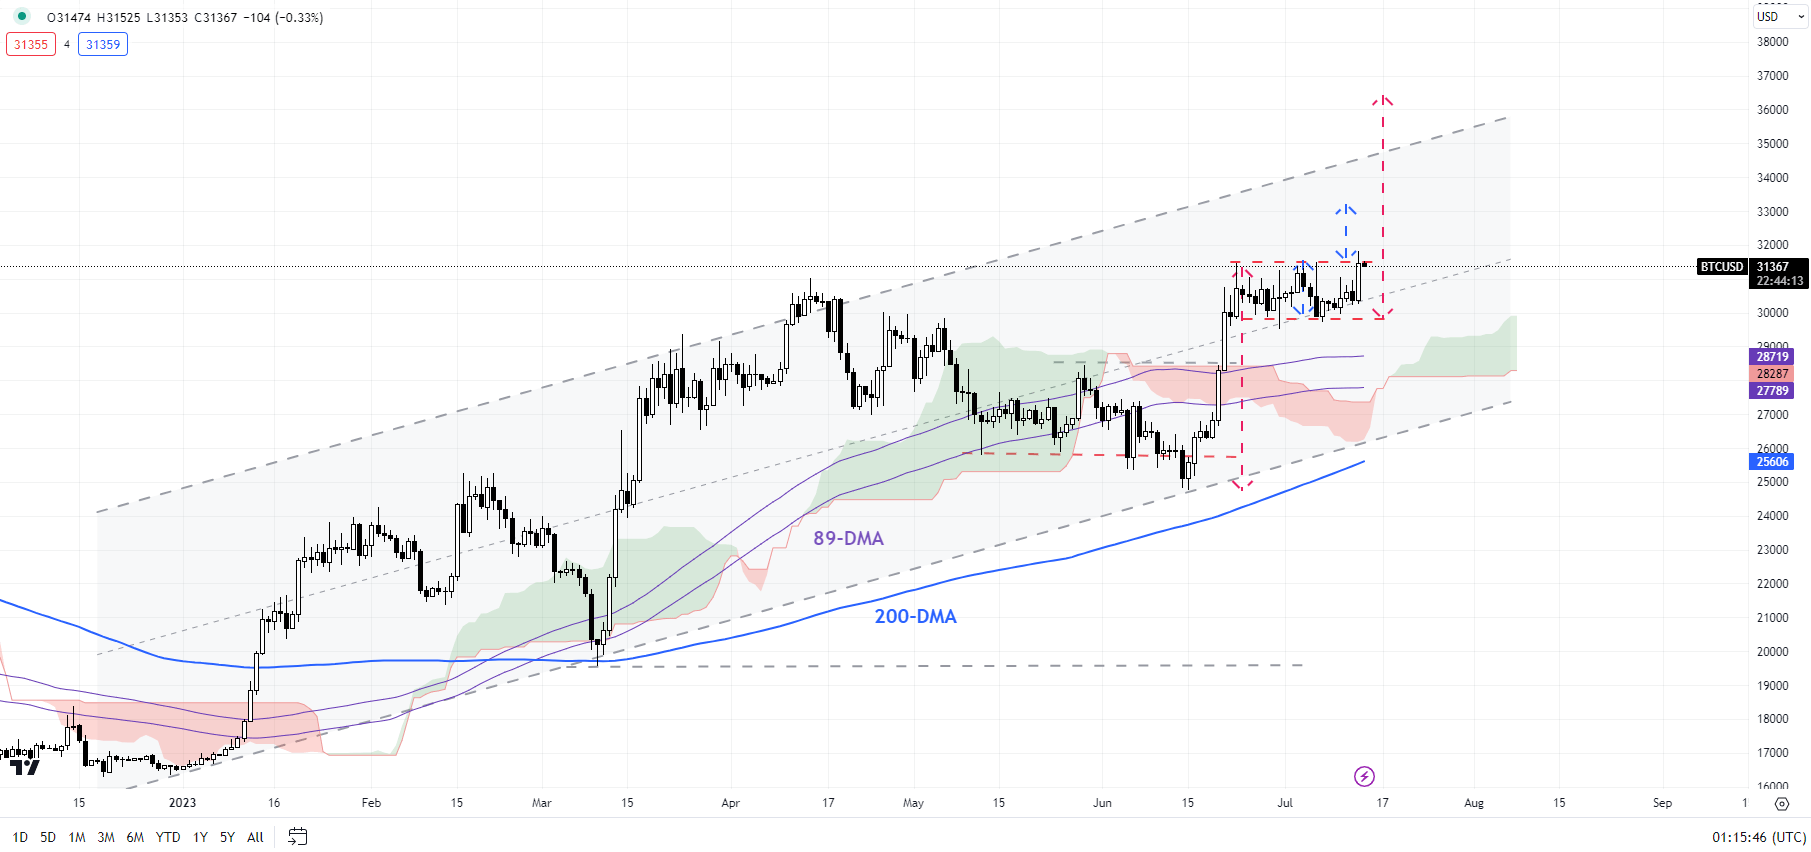
BTC/USD has rebounded from near major cushion on the 200-day moving average, coinciding with the lower edge of a rising channel from early 2023. This coupled with the subsequent rise above minor resistance at the May high of 28460 has confirmed that the downward pressure has faded, raising the odds of further gains.

BTC/USD Daily Chart

image2.png

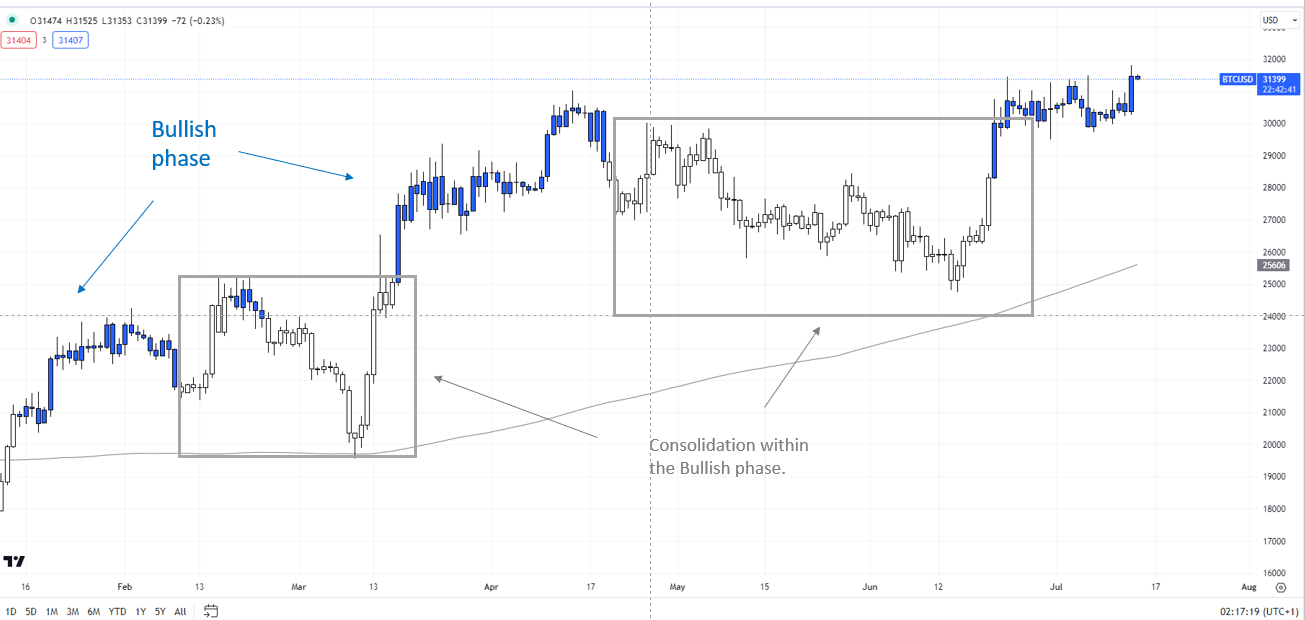
As the colour-coded daily candlestick charts show, the April-May retreat was consolidation within the broader bullish phase.

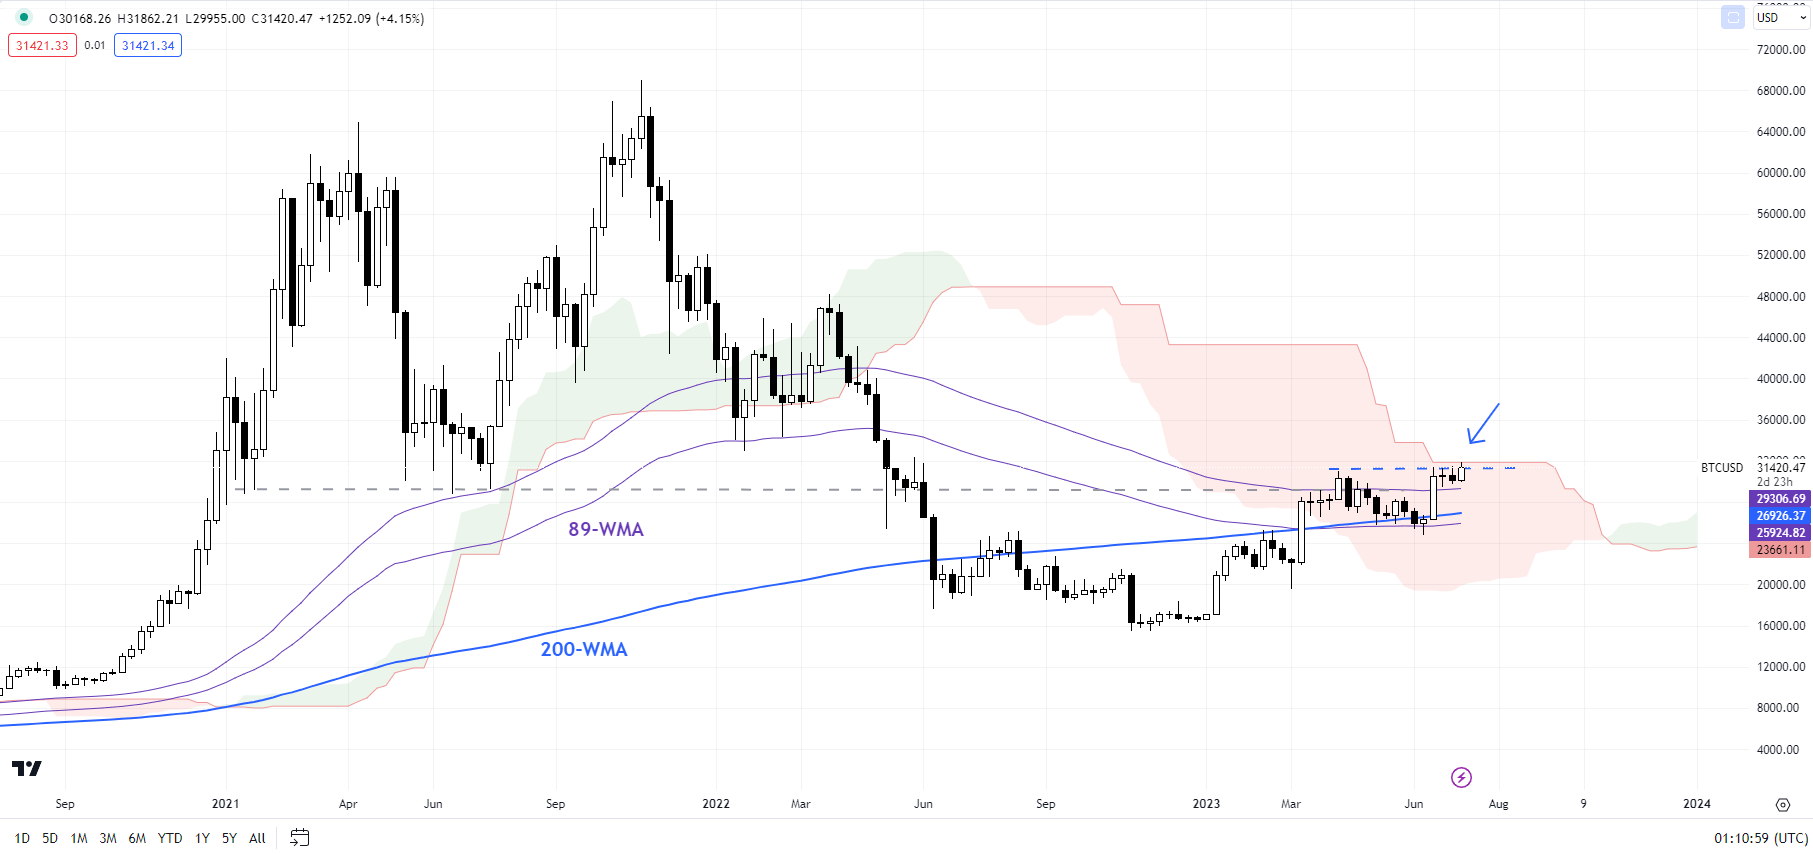
Most recently, BTC/USD has consolidated in a flag pattern. Any break above the recent range could open the way toward the upper edge of the channel (now at about 34800). Importantly, such a break would be associated with a rise above a vital hurdle on the upper edge of the Ichimoku cloud on the weekly chart for the first time since 2022 – an important bullish signal.

On the downside, BTC/USD needs to stay above the 200-day moving average (now at about 25600) for the upward pressure to remain intact.

BTC/USD Weekly Chart

image3.png

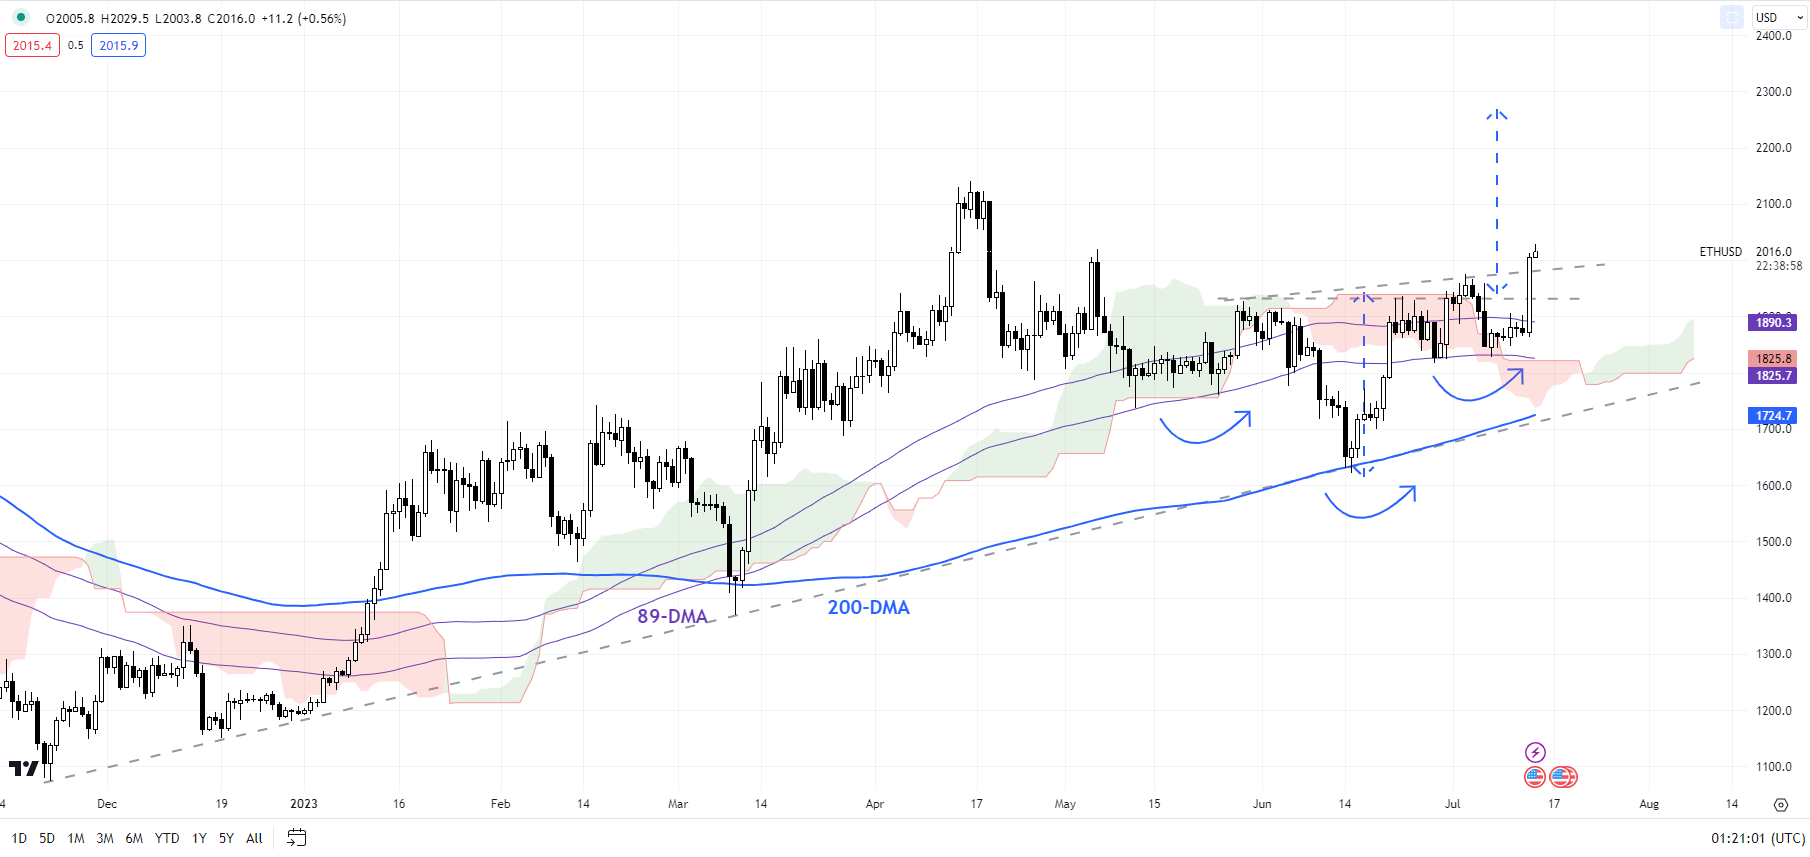
ETHEREUM: A potential reverse head & shoulders brewing

On technical charts, ETH/USD last month rebounded from strong converged support on the 200-day moving average, coinciding with an upper edge of a rising trendline from the end of 2022. The hold above the major average is an important sign, keeping intact the medium-term upward bias. See the previous update highlighting the significance “Bitcoin & Ethereum Slide as Fed Signals Higher Rates: BTC/USD & ETH/USD Price Setups”, published June 15.

ETH/USD Daily Chart

image4.png

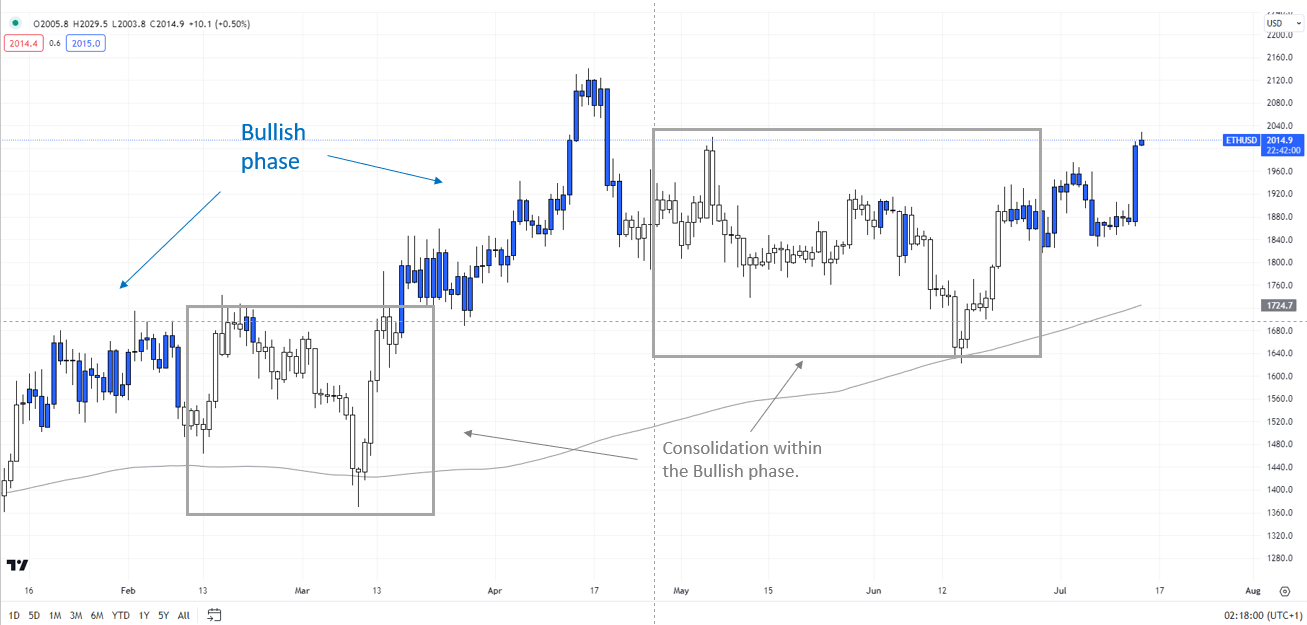
From a trend perspective, the broader bias for ETH/USD remains bullish, as the colour-coded daily candlestick charts show.

ETH/USD Daily Chart

image5.png

It is now attempting to break above a key barrier around 1975-2000. Such a break would trigger a minor reverse head & shoulders pattern (the left shoulder is at the May low, the head at the June low, and the right shoulder is at the early-July low), potentially opening the way toward 2250, the price objective of the pattern.

Note: The above colour-coded chart(s) is(are) based on trending/momentum indicators to minimize subjective biases in trend identification. It is an attempt to segregate bullish Vs bearish phases, and consolidation within a trend Vs reversal of a trend. Blue candles represent a Bullish phase. Red candles represent a Bearish phase. Grey candles serve as Consolidation phases (within a Bullish or a Bearish phase), but sometimes they tend to form at the end of a trend. Candle colors are not predictive – they merely state what the current trend is. Indeed, the candle color can change in the next bar. False patterns can occur around the 200-period moving average, or around a support/resistance, and/or in a sideways/choppy market. The author does not guarantee the accuracy of the information. Past performance is not indicative of future performance. Users of the information do so at their own risk.

Gold (XAU/USD) Consolidates Recent Gains After Stubborn Resistance Falls

Gold (XAU/USD) Consolidates Recent Gains After Stubborn Resistance Falls

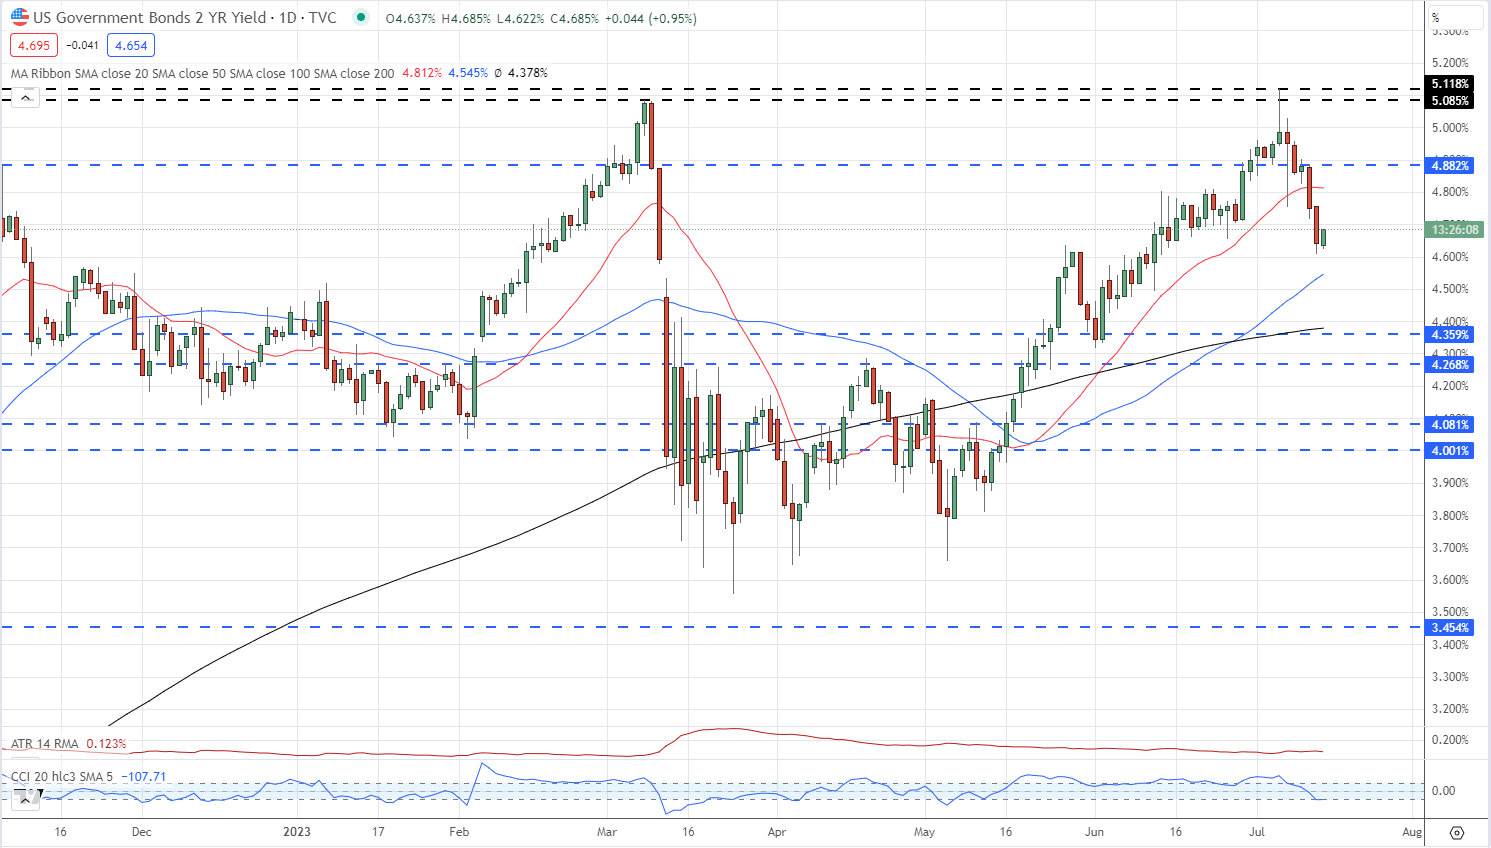
US Treasury yields have fallen sharply over the last week as traders increase their bets that the Federal Reserve’s monetary policy tightening program is coming to an end. The yield on the rate-sensitive UST 2s has fallen by 50 basis points since last Thursday, while further out along the curve, the UST 10s are around 30 basis points lower, while the UST 30s have shed around 18 basis points over the same time period. In the short end at least, it looks as though we have passed peak rates.

UST 2-Year Yield Daily Chart


image1.png

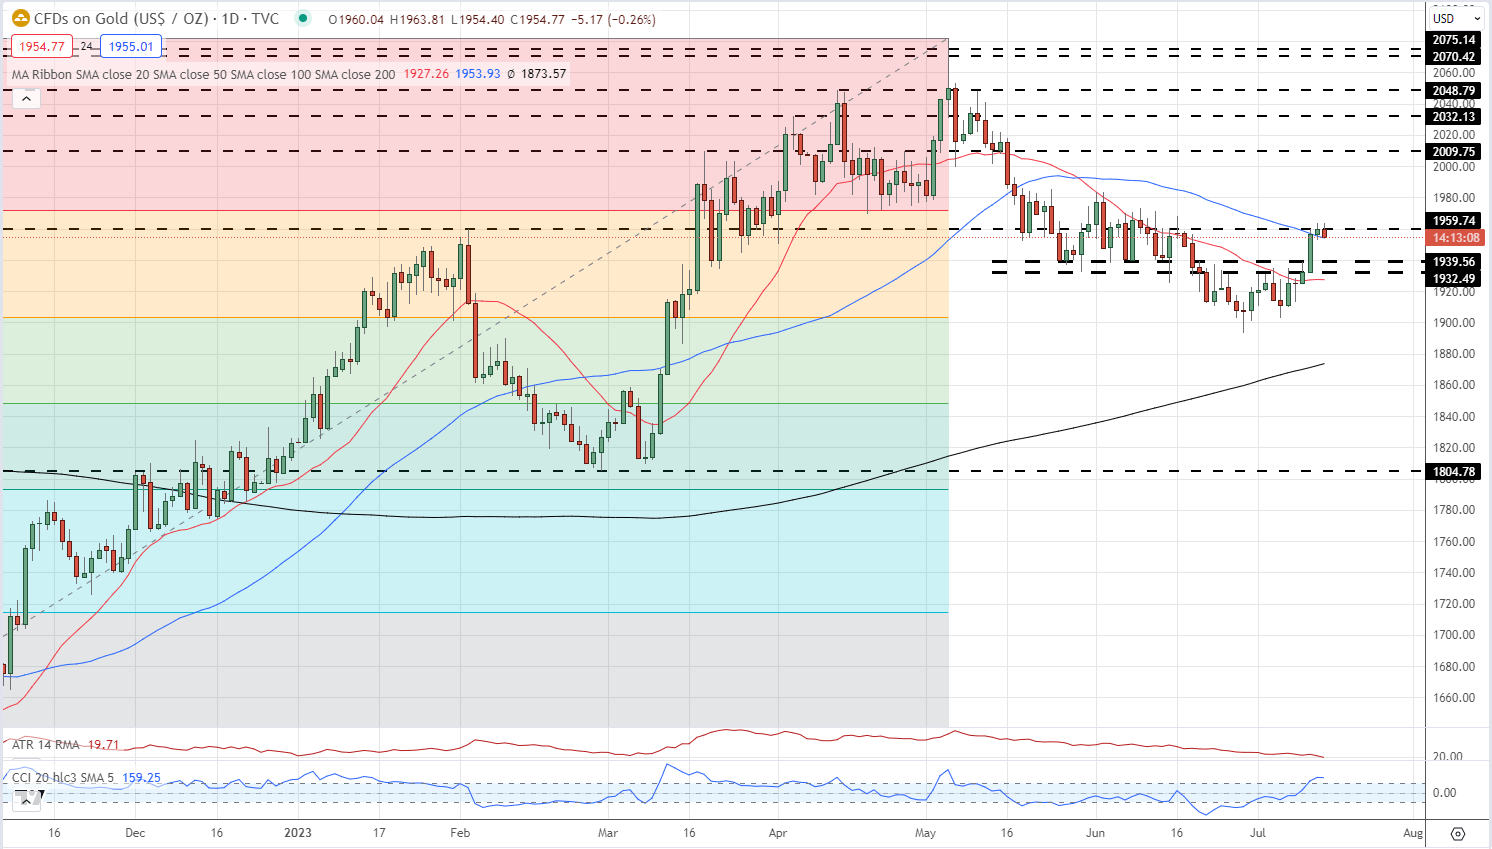
The tailwind of lower rates has helped push gold through a zone of support turned resistance around $1932/oz. and $1.940/oz. This area now turns back to support and should hold any short-tend sell-off. Below here the 20-day simple moving average acts as further support. To the upside, $1971/oz. and $1,985/oz. should act as brakes to any move higher.

Gold Daily Price Chart – July 14, 2023

image2.png

Retail Traders Remain Long of Gold but Sentiment is Mixed

Retail trader data show 65.23% of traders are net-long with the ratio of traders long to short at 1.88 to 1.The number of traders net-long is 2.79% higher than yesterday and 13.82% lower than last week, while the number of traders net-short is 5.32% lower than yesterday and 41.56% higher than last week.

We typically take a contrarian view to crowd sentiment, and the fact traders are net-long suggests Gold prices may continue to fall. Positioning is more net-long than yesterday but less net-long from last week. The combination of current sentiment and recent changes gives us a further mixed Gold trading bias.

US Dollar Forecast: EUR/USD, GBP/USD May Rise as Retail Traders Turn Bearish

US Dollar Forecast: EUR/USD, GBP/USD May Rise as Retail Traders Turn Bearish

The US Dollar has taken a turn for the worst against its major counterparts of late. On Wednesday, the DXY Dollar index dropped -1.08 percent in the worst single-day decline since early January. At -1.67%, this week is shaping up to be the worst since November. In response, retail traders have responded by increasing EUR/USD and GBP/USD bearish bets. This can be seen by looking at IG Client Sentiment (IGCS). IGCS tends to function as a contrarian indicator. With that in mind, could further pain be in store for the US Dollar?

EUR/USD Sentiment Outlook – Bullish

The IGCS gauge shows that about 26% of retail traders are net-long EUR/USD. Since most are biased to the downside, this suggests that the Euro may rise ahead. This is as upside positioning declined by 31.21% and 50.08% compared to yesterday and last week, respectively. With that in mind, the combination of overall and recent changes offers a stronger bullish contrarian trading bias.

Daily Chart

On the daily chart, EUR/USD has closed at a new high for this year as well as achieving the strongest exchange rate since March 2022. While confirmation is lacking, the push higher has exposed the 38.2% Fibonacci extension level at 1.1231. Further gains would open the door to facing highs from February 2022. Otherwise, a turn lower places the focus on a near-term rising trendline from June.

GBP/USD Sentiment Outlook – Bullish

The IGCS gauge reveals that about 29% of retail traders are net-long GBP/USD. Since most traders are biased lower, this hints prices may continue rising. This is as downside exposure increased by 5.02% and 32.14% compared to yesterday and last week, respectively. With that in mind, the combination of overall positioning and recent changes in exposure offers a stronger bullish contrarian trading bias.

Daily Chart

The British Pound closed at its strongest level against the US Dollar since April 2022. That has brought GBP/USD to the 1.3 inflection point, which held as key resistance. Confirming a push above this price exposes late-March 2022 highs. In the event of a turn lower, keep a close eye on the broader rising trendline from September.