National Economy Showed Good Momentum of Recovery in the First Half Year

National Economy Showed Good Momentum of Recovery in the First Half Year

In the first half year, faced with complex and grave international environment as well as arduous tasks to advance reform, development and ensure stability at home, under the strong leadership of the Central Committee of the Communist Party of China (CPC) with Comrade Xi Jinping at its core, all regions and departments strictly implemented the decisions and arrangements made by the CPC Central Committee and the State Council, adhered to the general working guideline of making progress while maintaining stability, fully and faithfully applied the new development philosophy on all fronts, accelerated the efforts to foster a new development pattern, focused on promoting high-quality development, better balanced domestic and international imperatives, coordinated the work of COVID-19 prevention and control with economic and social development, ensured both development and security, and gave priority to ensuring stable growth, employment and prices. As a result, the market demand gradually recovered, production supply continued to increase, employment and price were generally stable, and residents income grew steadily. The national economy showed a good momentum of recovery.

According to preliminary estimates, the gross domestic product (GDP) in the first half year reached 59,303.4 billion yuan, up by 5.5 percent year on year at constant price, or 1.0 percentage point faster than that in the first quarter of 2023. By industry, the value added of the primary industry was 3,041.6 billion yuan, up by 3.7 percent year on year; that of the secondary industry was 23,068.2 billion yuan, up by 4.3 percent; and that of the tertiary industry was 33,193.7 billion yuan, up by 6.4 percent. By quarter, the GDP grew by 4.5 percent year on year in the first quarter and 6.3 percent in the second quarter. The GDP in the second quarter was up by 0.8 percent quarter on quarter.

  1. Agricultural Production was Stable and Animal Husbandry Grew Steadily.

In the first half year, the value added of agriculture (crop farming) witnessed a year-on-year increase of 3.3 percent. The summer grain had another harvest. The total output of summer grain was 146.13 million tons, 1.274 million tons less than that of the previous year, or down by 0.9 percent, still the second highest in history. In the first half year, the output of pork, beef, mutton and poultry was 46.82 million tons, up by 3.6 percent year on year. Of this total, the output of pork, beef, mutton and poultry was up by 3.2 percent, 4.5 percent, 5.1 percent and 4.3 percent respectively. The output of milk was up by 7.5 percent and that of eggs grew by 2.9 percent. At the end of the second quarter, the number of pigs registered in stock was 435.17 million, up by 1.1 percent year on year; and 375.48 million pigs were slaughtered, up by 2.6 percent in the first half year.

  1. Industrial Production Recovered Gradually and Equipment Manufacturing Grew Fast.

The total value added of industrial enterprises above the designated size grew by 3.8 percent year on year in the first half year, or 0.8 percentage points faster than that in the first quarter. In terms of sectors, the value added of mining increased by 1.7 percent year on year, that of manufacturing increased by 4.2 percent, and that of production and supply of electricity, thermal power, gas and water increased by 4.1 percent. The value added of equipment manufacturing increased by 6.5 percent, 2.7 percentage points faster than that of the industrial enterprises above the designated size. An analysis by types of ownership showed that the value added of state holding enterprises was up by 4.4 percent year on year; that of share-holding enterprises was up by 4.4 percent; that of enterprises funded by foreign investors or investors from Hong Kong, Macao and Taiwan was up by 0.8 percent; and that of private enterprises was up by 1.9 percent. In terms of products, the production of solar cells, new-energy automobiles and industrial control computers and systems were up by 54.5 percent, 35.0 percent and 34.1 percent respectively. In June, the value added of industrial enterprises above the designated size grew by 4.4 percent year on year, or up by 0.68 percent month on month. In June, the Manufacturing Purchasing Managers’ Index stood at 49.0 percent, and the Production and Operation Expectation Index was 53.4 percent.

  1. Service Sector Grew Fast and Services Involving Contacts and Gatherings Improved Significantly.

In the first half year, the value added of services went up by 6.4 percent year on year, 1.0 percentage point faster than that in the first quarter. Specifically, the value added of accommodation and catering, information transmission, software and information technology services, leasing and business services, financial intermediation, and wholesale and retail grew by 15.5 percent, 12.9 percent, 10.1 percent, 7.3 percent and 6.6 percent respectively. In June, the Index of Services Production increased by 6.8 percent year on year. Specifically, the Index of Services Production of accommodation and catering, information transmission, software and information technology services and leasing and business services went up by 20.0 percent, 15.4 percent and 9.3 percent respectively. In the first five months, the business revenue of service enterprises above the designated size grew by 8.5 percent year on year. In June, the Business Activity Index for Services stood at 52.8 percent, and the Business Activity Expectation Index was 60.3 percent. Among which, the Business Activity Index for industries like air transportation, express mail services, telecommunication, broadcast, television and satellite transmission services, monetary and financial services, and insurance were within the high expansion range of 60.0 percent and above.

  1. Market Sales Registered Good Momentum of Growth and Sales of Upgraded Goods Accelerated.

In the first half year, the total retail sales of consumer goods reached 22,758.8 billion yuan, up by 8.2 percent year on year, 2.4 percentage points faster than that of the first quarter. Analyzed by different areas, the retail sales of consumer goods in urban areas reached 19,753.2 billion yuan, up by 8.1 percent year on year, and that in rural areas were 3,005.6 billion yuan, up by 8.4 percent. Grouped by consumption patterns, the retail sales of goods were 20,325.9 billion yuan, up by 6.8 percent; the income of catering was 2,432.9 billion yuan, up by 21.4 percent. Goods for basic living enjoyed stable growth, with the retail sales of clothes, shoes, hats, and textiles and of grain, oil and food by enterprises above the designated size up by 12.8 percent and 4.8 percent respectively. The sales of upgraded goods grew fast. The retail sales of gold, silver and jewelry, of sports and recreation goods, and of cosmetics by enterprises above the designated size went up by 17.5 percent, 10.5 percent and 8.6 percent respectively. The online retail sales reached 7,162.1 billion yuan, up by 13.1 percent year on year. Specifically, the online retail sales of physical goods were 6,062.3 billion yuan, up by 10.8 percent, accounting for 26.6 percent of the total retail sales of consumer goods. In June, the total retail sales of consumer goods went up by 3.1 percent year on year, or up by 0.23 percent month on month.

  1. Investment in Fixed Assets Continued to Increase and Investment in High-tech Industries Grew Fast.

In the first half year, the investment in fixed assets (excluding rural households) reached 24,311.3 billion yuan, up by 3.8 percent year on year. Specifically, the investment in infrastructure grew by 7.2 percent; that in manufacturing grew by 6.0 percent; and that in real estate development dropped by 7.9 percent. The floor space of commercial buildings sold reached 595.15 million square meters, down by 5.3 percent; and the total sales of commercial buildings were 6,309.2 billion yuan, up by 1.1 percent. By industry, the investment in the primary industry went up by 0.1 percent, that in the secondary industry up by 8.9 percent, and that in the tertiary industry up by 1.6 percent. The private investment dropped by 0.2 percent. The investment in high-tech industries grew by 12.5 percent, of which the investment in high-tech manufacturing and high-tech services grew by 11.8 percent and 13.9 percent respectively. In terms of high-tech manufacturing, the investment in manufacturing of medical equipment, measuring instrument and meter and manufacturing of electronic and communication equipment grew by 16.8 percent and 14.2 percent respectively. In terms of high-tech services, the investment in professional technical services and in services for transformation of scientific and technological achievements grew by 51.6 percent and 46.3 percent respectively. In June, the investment in fixed assets (excluding rural households) grew by 0.39 percent month on month.

  1. Imports and Exports of Goods Maintained Growth and Trade Structure Continued to Optimize.

In the first half year, the total value of imports and exports of goods was 20,101.6 billion yuan, an increase of 2.1 percent year on year. The total value of exports was 11,458.8 billion yuan, up by 3.7 percent. The total value of imports was 8,642.9 billion yuan, down by 0.1 percent. The trade balance was 2,815.9 billion yuan in surplus. The imports and exports of general trade increased by 4.0 percent, accounting for 65.5 percent of the total value of the imports and exports, 1.2 percentage points higher than that of the same period of the previous year. The imports and exports by private enterprises grew by 8.9 percent, accounting for 52.7 percent of the total value of imports and exports, 3.3 percentage points higher than that of the same period of the previous year. The imports and exports with countries along the Belt and Road grew by 9.8 percent. In June, the total value of imports and exports was 3,488.3 billion yuan, down by 6.0 percent year on year. The total value of exports was 1,989.8 billion yuan, down by 8.3 percent; that of imports was 1,498.5 billion yuan, down by 2.6 percent.

  1. Consumer Price Rose Year on Year and Producer Prices for Industrial Products Dropped Year on Year.

In the first half year, the consumer price index (CPI) rose by 0.7 percent year on year. Grouped by commodity categories, prices for food, tobacco and alcohol went up by 2.1 percent; clothing up by 0.8 percent; housing down by 0.2 percent; articles and services for daily use up by 0.5 percent; transportation and communication down by 2.3 percent; education, culture and recreation up by 1.7 percent; medical services and health care up by 1.0 percent; and other articles and services up by 2.9 percent. In terms of food, tobacco and alcohol prices, the price for fresh fruit went up by 7.9 percent, pork up by 3.2 percent, grain up by 1.6 percent and fresh vegetable down by 2.7 percent. The core CPI excluding the price of food and energy grew by 0.7 percent year on year. In June, the consumer price index maintained the same level year on year and down by 0.2 percent month on month.

In the first half year, the producer prices for industrial products went down by 3.1 percent year on year. Specifically, the prices in June dropped by 5.4 percent year on year, or down by 0.8 percent month on month. In the first half year, the purchasing prices for industrial producers went down by 3.0 percent year on year. Specifically in June, the prices dropped by 6.5 percent year on year, or down by 1.1 percent month on month.

  1. Employment was Generally Stable and Surveyed Unemployment Rate in Urban Areas Declined.

In the first half year, the urban surveyed unemployment rate averaged 5.3 percent, down by 0.2 percentage points over that of the first quarter. In June, the surveyed unemployment rate in urban areas was 5.2 percent, the same as that of the previous month. The surveyed unemployment rate of population with local household registration was 5.1 percent and that of population with non-local household registration was 5.3 percent, of which, the rate of population with non-local agricultural household registration stood at 4.9 percent. Specifically, the surveyed unemployment rates of population aged from 16 to 24 and from 25 to 59 were 21.3 percent and 4.1 percent respectively. Among the population aged from 25 to 59, the surveyed unemployment rates of the population with junior secondary school education or below, with senior secondary school education, with junior college education, and with university education or above were 4.4 percent, 4.4 percent, 3.9 percent and 3.2 percent respectively. The urban surveyed unemployment rate in 31 major cities was 5.5 percent, the same as that of the previous month. The employees of enterprises worked 48.7 hours per week on average. By the end of the second quarter, the number of rural migrant workers totaled 187.05 million, up by 3.2 percent year on year.

  1. Residents Income Increased Steadily and Income Growth of Rural Residents was Faster than that of Urban Residents.

In the first half year, the nationwide per capita disposable income of residents was 19,672 yuan, a nominal growth of 6.5 percent year on year, 1.4 percentage points faster than that of the first quarter; the real growth was 5.8 percent after deducting price factors, 2.0 percentage points faster. In terms of permanent residence, the per capita disposable income of urban households was 26,357 yuan, a nominal growth of 5.4 percent year on year and a real growth of 4.7 percent; the per capita disposable income of rural households was 10,551 yuan, a nominal growth of 7.8 percent year on year and a real growth of 7.2 percent. In terms of income sources, the nationwide per capita salary income, net business income, net property income and net income from transfers grew by 6.8 percent, 7.0 percent, 4.7 percent and 6.1 percent in nominal terms respectively. The median of the nationwide per capita disposable income of residents was 16,393 yuan with a nominal growth of 5.4 percent year on year.

Generally speaking, in the first half year, as the economic and social development has fully returned to normal and macro policies have manifested effects, the national economy showed a good momentum of recovery with high-quality development advancing steadily. However, we must be aware that the international political and economic circumstance is intricate and complicated, and the foundation for sustained economy recovery at home is not solid yet. At the next stage, we must follow the guidance of Xi Jinping Thought on Socialism with Chinese Characteristics for a New Era, adhere to the general principle of pursuing progress while maintaining stability, fully and faithfully apply the new development philosophy on all fronts, focus on the top task of high-quality development and strategic task of creating a new pattern of development, deepen reform and opening up comprehensively, accelerate the modernization of the industrial system, promote smooth economic flow, and make more efforts to change growth model, improve economic structure and gather new growth momentum, so as to achieve effective enhancement of quality and reasonable growth of quantity of economy.

Notes:

 The growth rate of GDP and its sub-items are calculated at constant prices. The growth rates of value added of industrial enterprises above designated size and its sub-items are calculated at comparable prices. Both are real growth rates. The growth rates of other indicators are nominal growth by using current prices unless otherwise specified.

 According to the auto-revision function of the seasonal adjustment model, revisions are made to quarter-on-quarter growth of GDP and to month-on-month changes of the value added of industrial enterprises above designated size, investment in fixed assets (excluding rural households), and total retail sales of consumer goods. The revised figures, quarter-on-quarter GDP growth for the second quarter of 2023 and month-on-month changes of other indicators for June 2023 are as follows:

 The quarter-on-quarter growth of GDP in 2022 and in the first and second quarter of 2023 are 1.0 percent, -1.9 percent, 3.2 percent, 0.5 percent, 2.2 percent and 0.8 percent respectively.

 Month-on-Month Growth Rate of Other Indicators


Value Added of Industrial Enterprises above Designated Size

(%)

Investment in Fixed  Assets (Excluding Rural Households)

(%)

Total Retail Sales of Consumer Goods

(%)

June 2022 0.91 0.75 2.56
July 2022 0.31 0.27 1.27
August 2022 0.24 0.45 -0.96
September 2022 0.83 1.30 0.18
October 2022 0.21 -0.54 -0.90
November 2022 -0.24 -0.43 -0.69
December 2022 0.06 1.33 -0.85
January 2023 0.31 1.62 0.05
February 2023 0.27 -0.38 1.21
March 2023 0.51 0.11 0.23
April 2023 -0.23 -0.84 0.27
May 2023 0.63 0.27 0.39
June 2023 0.68 0.39 0.23

 Industrial enterprises above designated size are industrial enterprises with annual revenue from principal business over 20 million yuan.

 As industrial enterprises above the designated size change every year, to ensure the data comparability between years, the coverage of the data of the same period last year used for estimating year-on-year growth rates like that of products output, are as consistent as possible with the current period and different from the coverage of the data published last year. The main reasons are as follows: First, the statistical units change. Every year, some enterprises are included in the survey as they meet the threshold, while some enterprises are removed from the survey because of downsizing. Besides, enterprises that have newly gone into operation, been bankrupted, canceled their registrations or had their business licenses revoked also cause impact. Second, duplicated outputs across regions of enterprise groups have been removed based on the ad hoc surveys since duplication is found in the products output of some enterprise groups.

 The Index of Services Production is the change of production in the reporting period compared to the base period with the price factors deducted.

 The scope of the total retail sales of consumer goods include all legal entities, establishments and self-employed individuals involved in retail trades or providing catering services. Specifically, businesses above the designated size include wholesale enterprises (businesses, self-employed individuals), retail enterprises (businesses, self-employed individuals) and lodging and catering enterprises (businesses, self-employed individuals) with annual revenue from principal business over 20 million yuan, 5 million yuan and 2 million yuan respectively.

 As the wholesale, retail, and lodging and catering enterprises (businesses, self-employed individuals) above the designated size change every year, to ensure the data comparability between years, the coverage of the data of the same period last year used for estimating year-on-year growth rates like that of the retail sales of consumer goods by businesses above the designated size is consistent with the current period and different from the coverage of data published last year. The main reasons are: some enterprises (businesses, self-employed individuals) are included in the survey as they meet the threshold, while some enterprises (businesses, self-employed individuals) are removed from the survey because of downsizing every year. Besides, enterprises (businesses, self-employed individuals) that have newly gone into operation, been bankrupted, canceled their registrations or had their business licenses revoked also cause impact.

 Online retail sales refer to the retail sales of goods and services realized through internet trading platforms (including self-built websites and third-party platforms). Goods and services include physical goods and non-physical goods (e.g. virtual goods and services).

 The total retail sales of consumer goods include the online retail sales of physical goods, but not the non-physical goods.

 The growth rates of investment in fixed assets are calculated on a comparable basis.

 Employed people refer to people aged 16 and above who have the ability to work and engage in gainful employment for remuneration payment or business income.

 The median of the nationwide per capita disposable income of residents refers to the per capita disposable income of households which lies in the middle of all surveyed households ranked from low to high on the basis of per capita disposable income level.

 Data of imports and exports are from the General Administration of Customs.


  1. Due to the rounding-off reasons, the subentries may not add up to the aggregate totals.


In case of any differences between English translation and the original Chinese text, the Chinese edition shall prevail.

UK house prices continue to fall as interest rate rises bite

UK house prices continue to fall as interest rate rises bite

The average price of property coming on to the market fell marginally this month, according to Rightmove, but the property portal says trends have proved more resilient than most expected during the first half of the year.

According to the data, the average price of a residential property fell by 0.2%, or £905, this month, marginally below the 0% norm for this time of year, as increasing mortgage costs and greater buyer affordability constraints force sellers to temper their price expectations.

Recent Base Rate rises to combat stickier-than-expected inflation are biting, with the number of sales agreed now 12% behind 2019’s more normal market, in contrast to 2023’s better-than-expected first five months.

But Rightmove says buyer demand remains resilient, being 3% higher than 2019, with agents reporting that right-priced homes are still attracting motivated buyers due to a shortage of property for sale compared to historic norms.

The number of available properties for sale is 12% lower than at this time in 2019.

Rightmove research highlights the dangers of sellers initially over-pricing, with properties that need a reduction in asking price being more than 10% less likely to find a buyer than those that are priced right at the outset.

Rightmove’s Tim Bannister said: “The interest-rate brakes being applied more strongly to slow the economy are now beginning to bite in the housing market. While prices and sales bounced back this year much more strongly than most expected, the unexpectedly stubborn inflation figures and the surprise of further mortgage rate rises when many felt that they had stabilised, have contributed to the fall in prices and number of sales agreed.

“However, buyer demand remains resilient at 3% above 2019’s more normal market levels, buoyed by a shortage of quality property for sale and ongoing housing needs. First-time buyers, trader-uppers and downsizers with higher deposits and lower mortgage requirements appear to be still keenly searching the market, not wanting to miss out on the right property that is not over-priced and that they can still afford.”

Rightmove’s data shows that the two larger home sectors have been most impacted by lower levels of agreed sales. The numbers of sales agreed in June in the mid-market second-stepper sector and the top-of-the-ladder sector are 14% behind 2019’s level. Some discretionary movers in these sectors who are trading up and are substantially increasing their mortgage are likely reassessing their budgets, waiting to see which direction mortgage rates head in the coming months.

The smaller home, two-bedrooms and fewer market sector has been less impacted, with June’s sales agreed figure 9% below 2019’s level. This typical first-time buyer sector has held up most strongly throughout the first half of the year, highlighting an ongoing determination from many first-time buyers to navigate the unsettled mortgage market and get onto the ladder, particularly with rents at record levels. It is also an indication of some people deciding to retire early and downsize to a smaller property, perhaps to release some equity from their home for lifestyle or early retirement, or to gift a deposit to family first-time buyers.

Bannister continued: “The continuing twists and turns of persistent inflation and higher mortgage rates have posed some additional challenges for the market. Agents report that some movers are pausing until there is more certainty that mortgage rates have stabilised, as well as reviewing how higher costs affect their plans.

“However, there remains a large volume of motivated buyers who can factor rate rises into their budgets and are continuing to enquire about homes for sale, which is keeping the market functioning, albeit now with lower sales levels than at this time in 2019.

“Sellers who price right the first time, rather than starting with too high an asking price only to reduce later, have a much better chance of attracting one of these motivated buyers, and a good local agent will provide sellers with accurate evidence of prices that are being achieved in their area.”


US-China Climate Talks Reopen With Pledge to Take ‘Big Steps’

US-China Climate Talks Reopen With Pledge to Take ‘Big Steps’

US Climate Envoy John Kerry opened his first major climate talks with Chinese officials in almost a year, as both sides pledged to work for tangible results despite deep tensions between the rival superpowers.

China is seeking “substantial” dialogue this week, the country’s climate envoy Xie Zhenhua said Monday, as officials gathered in Beijing to begin three days of talks. Those exchanges on climate and the green transition could make a contribution “to improving our bilateral relations,” he added.

Kerry, who arrived in Beijing on Sunday, said he hoped China and the US would take “big steps that will send a signal to the world” about how seriously both sides take the common threat to humanity.

“I hope we can work with the greatest purpose we have ever worked to try to get this done,” added the former US secretary of state. The two officials met for about four hours on Monday morning, according to state broadcaster China Central Television.

Negotiations between the world’s top two greenhouse gas emitters on how to tackle global warming were suspended last year, after then US House Speaker Nancy Pelosi’s controversial visit to Taiwan. Their renewed communication comes amid a broader Biden administration push to restore high-level dialogue.

Kerry, who was tapped to be the US special presidential envoy for climate two years ago, is the third senior US official to visit Beijing in five weeks. But while US Secretary of State Antony Blinken and Treasury Secretary Janet Yellen left China mostly with pledges to keep talking, climate is an arena with potential for breakthroughs.

“China and the US share similar ideas and have a similar past in addressing climate change,” Xie said, speaking through a translator. He cited agreements in 2014 and 2021, as well as collaboration at UN climate summits.

Negotiations this week are aimed at making headway on a series of issues — including global climate targets, methane abatement and the use of coal-fired power. They’re also expected to lay the groundwork for potential pronouncements at the UN General Assembly in September, the Asia-Pacific Economic Cooperation leaders’ summit in California in November and the UN climate summit in Dubai at the end of the year.

“It is imperative that China and the United States make real progress in the little more than four months,” before the UN climate talks, Kerry said Monday. “The world and the climate crisis demand that we make progress rapidly and significantly.”

Read more: World Has Hottest June on Record as Ocean Temperatures Soar

Talks are set to proceed on multiple tracks, covering ambitions in addressing climate change, a new loss and damage fund for compensating climate victims and areas for possible bilateral collaboration. Those could include deploying more wind and solar power and handling the intermittent nature of those electricity sources, according to senior US State Department officials, who requested anonymity to discuss private details.

“In too many parts of the world emissions are going up,” said Kerry. “It is imperative that we work together — not competitively, but cooperatively — in order to reduce the impacts of unabated coal power in the world.” He urged both nations to partner to rapidly reduce carbon dioxide and other greenhouse gases such as methane.

Still, experts in climate diplomacy and US-China relations stress that even a formal joint statement from Xie and Kerry’s discussions that commits to keep talking — and to revive a joint working group they agreed to form in November 2021 — would be progress.

One potential source of tension is China’s approach on fossil fuels. China is by far the world’s largest installer of renewable energy — and already on track to beat President Xi Jinping’s own clean power targets. Yet the nation is continuing to expand its massive fleet of coal-fired plants and adding new natural gas deals to help avoid shortages that have plagued its electricity system in recent years.

The Chinese leader said last week China should accelerate its already world-leading adoption of cleaner electricity sources, though has frequently stressed the need to ensure energy security is guaranteed before dismantling fossil fuel capacity.

China’s solar power capacity has grown 150 times from its 2012 level and wind power capacity has jump six-fold over the past decade, Wang Zhongying, director of the Energy Research Institute at the National Development and Reform Commission, China’s top economic planning agency, told reporters at a separate event in Beijing.

Kerry praised China’s commitment to renewables Monday. “We look at China and we see the largest deployment of renewables of anybody in the world — more than the rest of the world combined,” he said. “But on the other hand, we see new coal coming online, which undoes the benefit of some of that.”

The US should also do more to combat the climate crisis, Kerry said. “I’m not sitting here with a one-sided argument,” he added. Xie and Kerry, who had a one-on-one dinner Sunday, have met more than 50 times.

China is balancing issues including still-rising energy demand, the energy needs of heavy manufacturing and its climate goals, Liu Yanhua, a former vice minister of the Ministry of Science and Technology, told reporters at the separate event in Beijing.

“For a running train to stop, it needs a process, so we need to keep control of the pace,” Liu said. “In the face of climate change, we can’t be too slow nor too rushed.”

USD/CNH bulls attack 7.1700 on mixed China data, geopolitical concerns

USD/CNH bulls attack 7.1700 on mixed China data, geopolitical concerns

USD/CNH renews its intraday high near 7.1720 after China fails to defy the market’s downbeat concerns with its mixed data published early Monday. Also fueling the offshore Chinese Yuan (CNH) pair could be the US Dollar’s corrective bounce amid downbeat sentiment, as well as the People’s Bank of China’s (PBoC) defense of the Medium-term Lending Facility (MLF) rates.

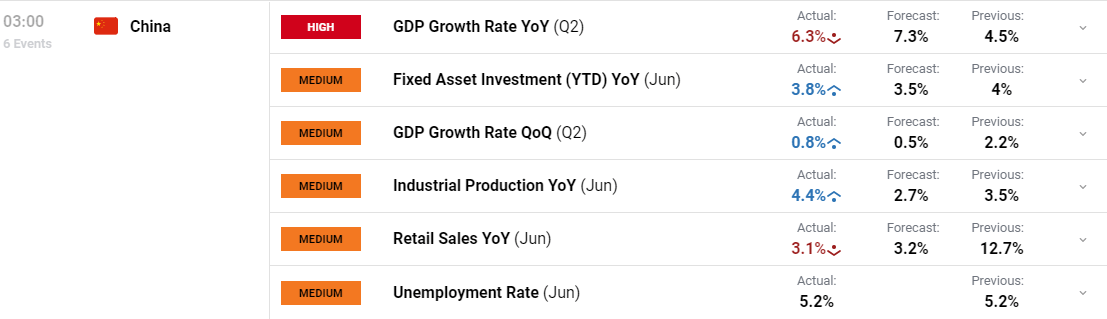
China’s second quarter (Q2) 2023 Gross Domestic Product (GDP) came in at 0.8% QoQ versus 0.5% market forecasts and 2.2% prior whereas the GDP YoY figures rose past the previous readings of 4.5% to 6.3%, versus analysts’ estimations of 7.3%. Further, the Industrial Production growth jumped to 4.4% YoY in June, compared to the 2.7% expected and 3.5% prior, whereas the Retail Sales slumped to 3.1% from 12.7% prior and 3.2% market consensus. It should be noted that China’s June survey-based Jobless Rate for 24-year-olds jumped to a record high of 21.3%. Additionally, the PBoC keeps one-year MLF rate unchanged at 2.65%.

Elsewhere, the International Monetary Fund (IMF) cited the fears of short-term firmer inflation clues to underpin the US Dollar Index rebound from the multi-month low, which in turn allowed USD/CNH to recover. Adding strength to the pair’s corrective bounce are the political fears surrounding China, flagged by comments from New Zealand Prime Minister (NZ) Chris Hipkins and US Treasury Secretary Janet Yellen.

Furthermore, US climate envoy John Kerry arrived at the Beijing Hotel in the Chinese capital on Monday for talks with his Chinese counterpart Xie Zhenhua, per Reuters. The policymaker’s initial comments were grim as he suggested that China and the US must make real progress in the little more than 4 months left before COP28.

Additionally, Friday’s US data and the Fed blackout period also allow the USD/CNH to recover. That said, the preliminary reading of the University of Michigan’s (UoM) Consumer Confidence Index rose to 72.6 for July from 64.4 in June, versus the market’s expectations of 65.5. Further details suggested that the one-year and 5-year consumer inflation expectations per the UoM survey edged higher to 3.4% and 3.1% in that order versus 3.3% and 3% respective priors. Before that, the US Consumer Price Index (CPI) and Producer Price Index (PPI) for June dropped to 3.0% and 0.1% on a yearly basis from 4.0% and 0.9% YoY in that order, which in turn drowned the US Dollar.

While portraying the mood, the S&P500 Futures print mild losses whereas the US Treasury bond yields remain sidelined amid Japan’s holiday.

Moving on, the US NY Empire State Manufacturing Index for June may direct intraday moves of the USD/CNH pair but major attention will be given to the US Retail Sales and Sino-US headlines.

Technical analysis

Despite bouncing off the 50-DMA, at 7.1320 by the press time, the USD/CNH bulls need validation from the support-turned-resistance line stretched from early June, close to 7.1800 at the latest, to restore the market’s confidence.

WTI and Brent Start Week on the Back Foot as Chinese GDP Underwhelms

WTI and Brent Start Week on the Back Foot as Chinese GDP Underwhelms

Oil prices finished last week on the back foot and that trend seems to have continued into the new week. A gap down in price over the weekend with further selling pressure following the Asian Open leaving WTI and Brent down 1.17% and 1.12% respectively.

CHINESE DATA AND US DOLLAR

Last week’s risk-on rally was halted on Friday as strong consumer confidence data from the US reignited some concern that it may be too early to declare victory for the US Federal Reserve in its fight against inflation. Asian session hints at a continuation of that trend to start the week.

China remains interesting as despite a stuttering recovery Oil data released last month revealed that demand for oil remains strong thanks to surging petrochemical use which is expected to see China account for 70% of global gains. This morning brought a mixed bag in terms of Chinese data with the GDP print likely to dominate as it came in below estimates. However, a closer look at the data and there were some positives as Fixed Asset Investment YoY, Industrial Production YoY and GDP QoQ numbers all beat estimates with YoY Retail Sales missing estimates by 0.1%. In the aftermath of the data release the PBoC opted against cutting its medium-term lending facility as calls and hopes of a stimulus package continue to grow.

image1.png

We have already heard mounting speculation that China’s top leaders may announce a massive stimulus package at a key meeting later this month. Following today decision however, this month’s meeting of top Chinese officials could garner even more interest as a stimulus package could provide a welcome boost not just for China but Global economies as well.

The US Dollar and Dollar Index (DXY) did finish the week with a bit of strength with a continuation toward immediate resistance at the 100.84 mark in the early part of the week a possibility. This could see Oil prices continue on the current downward trajectory before bouncing and looking higher toward last week’s highs.

ECONOMIC CALENDAR AND EVENT RISK

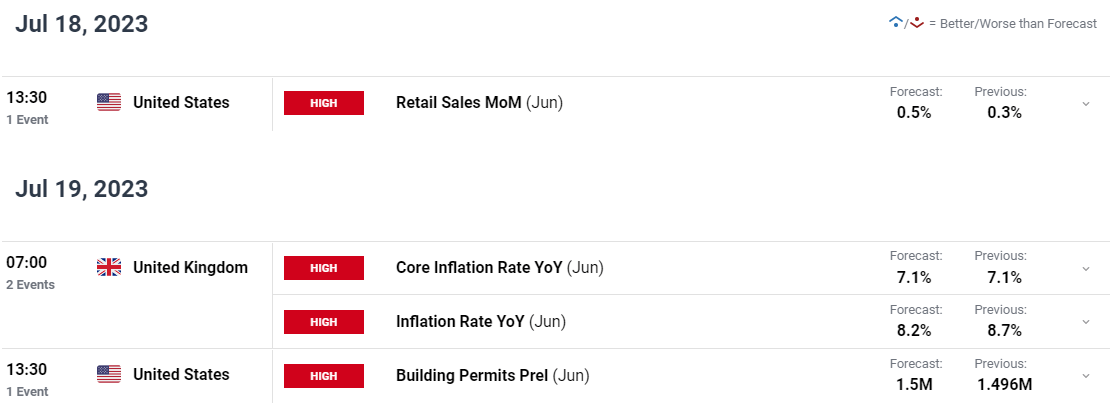
There is not a lot on the calendar in terms of event risk with Retail Sales and Building Permit data from the US and of course UK inflation. Market sentiment this week is largely expected to be driven by US earnings season with continuation of positive earnings likely to see Oil prices remain supported. Market participants are likely to view positive earnings as a sign that a ‘soft landing’ may be possible and push recessionary concerns to the background for now at least.

image2.png

TECHNICAL OUTLOOK AND FINAL THOUGHTS

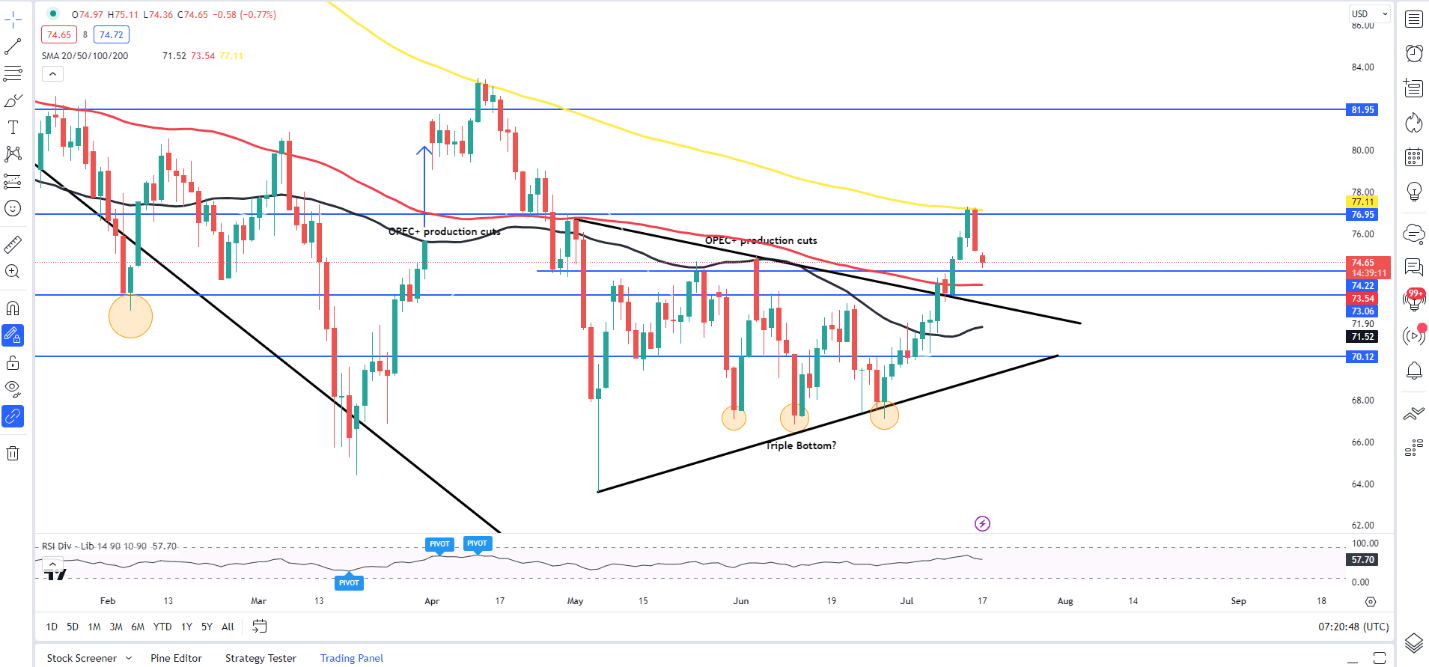
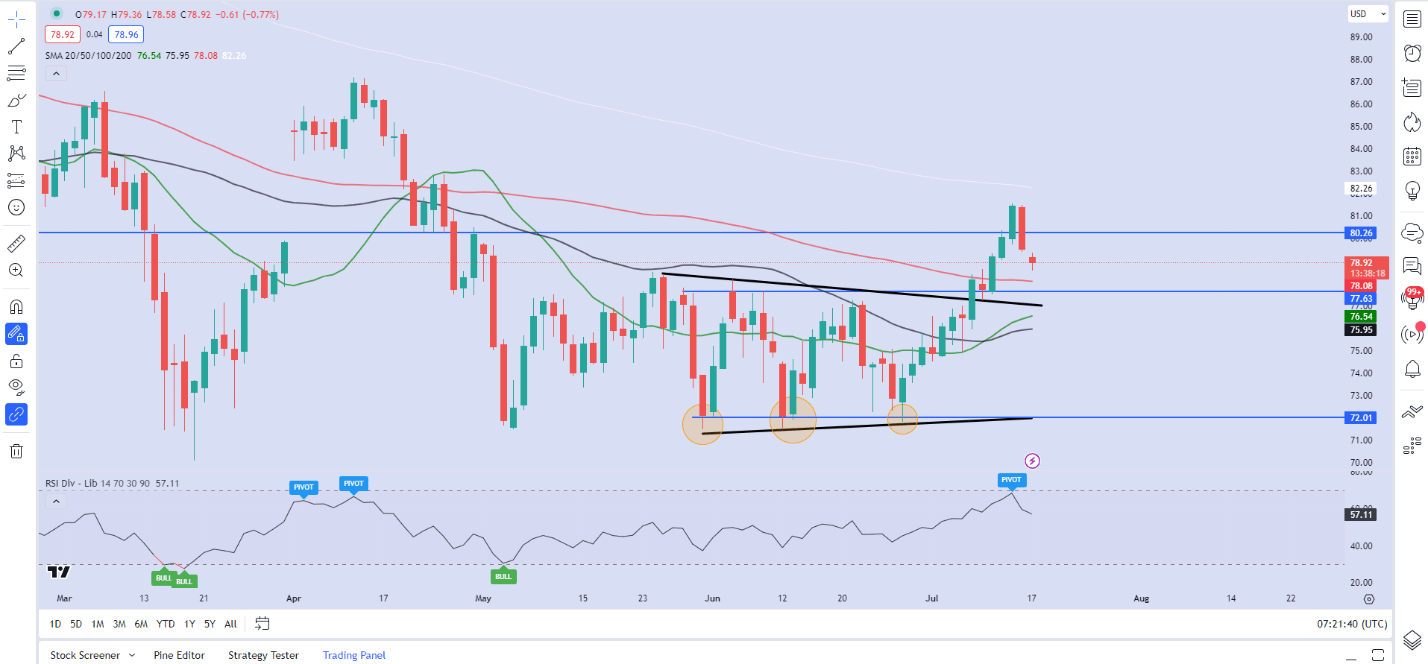
From a technical perspective both WTI and Brent finished last week with a bearish engulfing daily candle close with selling pressure continuing in the Asian session. We are seeing a slight bounce as the European session kicks off with a bit of weakness in the Dollar Index (DXY) helping as well.

WTI Crude Oil Daily Chart – July 17, 2023

image3.png

Both Brent and WTI did open with a slight gap to the downside overnight and market participants may look to close the gap before selling pressure returns. A push toward the $79.45 mark for Brent and $75.17 for WTI will see the weekend gaps close before a continued push toward the 100-day MAs. A lack of event risk today could result in a lack of volatility today with US earnings season continuing tomorrow as well Retail Sales from the US.

Brent Oil Daily Chart – July 17, 2023

A screenshot of a graph  Description automatically generated

IG CLIENT SENTIMENT DATA- OIL US CRUDE

IGCS shows retail traders are currently LONG on WTI Oil, with 60% of traders currently holding LONG positions. At DailyFX we typically take a contrarian view to crowd sentiment, and the fact that traders are long suggests that WTI may enjoy a short rally higher before continuing to fall.

UK Accession to the CPTPP

UK Accession to the CPTPP

Parties to the Comprehensive and Progressive Agreement for Trans-Pacific Partnership (CPTPP) have agreed to admit the United Kingdom (UK) as its first new member following two years of negotiations.

The 11 CPTPP parties and the United Kingdom signed an Accession Protocol at the 7th meeting of the CPTPP Ministerial Commission in Auckland today.

Australia warmly welcomes the UK as a new member of the CPTPP. This development builds on the foundations of the Australia-UK Free Trade Agreement, which entered into force on 31 May 2023.

CPTPP membership enhances the UK’s engagement in the Indo-Pacific and supports our interest in working with partners to realise an open, inclusive and prosperous region.

The CPTPP is one of the most comprehensive trade deals ever concluded, eliminating 98 per cent of tariffs in a trade zone representing a combined GDP of $11.8 trillion and a population of over 500 million people.

An accession working group, established in mid-2021 to progress the terms and conditions for the UK’s accession, presented the Accession Protocol and accompanying Accession Working Group report that was approved by consensus today by the Ministerial Commission.

The Commission agreed the UK was able to demonstrate it can meet, implement and adhere to the rules and standards of the Agreement and possessed a track record of complying with trade commitments.

CPTPP members will now complete their domestic processes to bring the Accession Protocol into force. The CPTPP’s original members are Australia, Brunei Darussalam, Canada, Chile, Japan, Malaysia, Mexico, New Zealand, Peru, Singapore and Vietnam.

CPTPP – Joint Ministerial Statement on the Occasion of the Seventh Commission Meeting [PDF].

Quotes attributable to the Minister for Trade and Tourism, Senator the Hon Don Farrell:

“I congratulate the United Kingdom on becoming the first economy to accede to the CPTPP.”

“The accession of the UK to the CPTPP is a major milestone, as it expands the trade partnership beyond the Pacific Rim.”

“Australia is strongly committed to ensuring the CPTPP continues as a high-calibre trade framework – a key element to maintaining this high standard is a robust accession process.”

Inflation slowing but remains too high, economists say

Inflation slowing but remains too high, economists say

Inflation, dubbed “nobody’s friend” by Reserve Bank governor Adrian Orr, is expected to have fallen to its lowest level since December 2021 – but it remains too high.

The latest inflation data for the June quarter, due for release on Wednesday, will likely show prices rose at a 5.9% annual pace, the lowest level since December 2021, according to forecasts from ANZ, ASB and Westpac.

That’s down from a 6.7% annual rate in the March quarter, and a peak of 7.3% in the June quarter last year, and would be weaker than the Reserve Bank’s 6.1% forecast in its May monetary policy statement.

The Reserve Bank Te Pūtea Matua has been rapidly increasing interest rates since October 2021, pushing up the official cash rate by 525 basis points to 5.5%, its highest level since 2008, as it sought to slow the economy and stamp out inflation.

But Westpac senior economist Satish Ranchhod notes there is still “a long road back” to the Reserve Bank’s inflation target of 1% to 3%.

“While inflation is dropping back, it is not low by any stretch of the imagination,” Ranchhod said in an inflation data preview titled: Lower inflation, not low inflation.

“With strong and persistent underlying price pressures, inflation is unlikely to return within the RBNZ’s target band any time soon.”

Ranchhod expects the fall in the annual inflation rate to be almost entirely due to petrol prices, which are 16% lower than this time last year.

Prices at the pump spiked early last year in response to the Russia-Ukraine conflict but have since fallen, and local fuel taxes were temporarily reduced, he said.

Housing costs have also moderated.

“Construction costs charged higher in the early stages of the pandemic in response to low interest rates and shortages of materials. Now, while build costs remain high, a slowdown in building activity and an easing in supply chain pressures has seen price growth slowing sharply,” he said.

Still, “sticky” underlying price pressures mean that inflation is unlikely to return to the target band until the latter part of next year, he said.

Ranchhod expects food prices to be the largest contributor to the quarterly inflation data.

Food prices rose 2.2% over the past three months and were up an “eyewatering” 12% over the past year, with sizeable increases in the prices of groceries and takeaway foods while poor weather conditions pushed up fresh produce, he said.

Housing costs also continued to weigh on inflation, with rents up 1.1% over the past three months and 4.3% over the past year. While housing costs had slowed, Westpac still expected a 0.9% increase in new house prices over the quarter, he said.

Reserve Bank of New Zealand
The path back to low inflation – Reserve Bank of New Zealand chief economist Paul Conway. (First published 23/03/23)

ASB senior economist Kim Mundy said the inflation data was expected to reinforce that the Reserve Bank was “on track” to bring inflation back down to target.

Advertisement

Advertise with Stuff

However while it was moving in the right direction, inflation remained high and well above the Reserve Bank’s target, she said in a note titled: A gradual descent.

ASB believes the benchmark interest rate has peaked at 5.5% but doesn’t expect cuts until May next year.

Economists will be honing in on non-tradable inflation, which is generated domestically and can be influenced by the Reserve Bank.

ASB expects non-tradable inflation to have slowed to an annual rate of 6.4% in the June quarter from a peak of 6.8% in March.

“Inflation is likely to continue its gradual descent, but the pace of the slowdown will keep the RBNZ wary, and of the view that restrictive settings will need to remain in place for some time,” Mundy said.

ANZ economists believe the relative resilience and sticky non-tradables inflation means the Reserve Bank will hike interest rates again this year by another 25 basis points, taking the official cash rate to 5.75%.

“We think it’s too early for any complacency that the fight against inflation is done and dusted, given the relative resilience of the labour market, the sizeable injection of fiscal stimulus in the next 12 months, the rapid increase in migration, a housing market showing signs of life, and a cautious turn in sentiment among consumers and businesses,” ANZ said in its inflation preview titled: Running before we walk.

While things were definitely going the right way, there was a long way to go, ANZ said.

“We suspect that squeezing that last excess inflation out of the system could be an uphill slog.”

Asia Day Ahead: Subdued Start to the Week Ahead of Key China Data

Asia Day Ahead: Subdued Start to the Week Ahead of Key China Data

Initial gains in Wall Street last Friday failed to find much follow-through, with the DJIA eking out a slight gain (+0.3%) while the S&P 500 (-0.1%) and Nasdaq (-0.2%) closed in the red. The US consumer sentiment index last Friday has smashed past expectations to turn in its highest level since September 2021 (72.6 versus 65.6 consensus), with the stellar read essentially pushing back against recessionary concerns, given that past recessions since 1968 were marked by a decline in the US consumer sentiment data.

That said, earnings results from major US banks were more mixed, with JP Morgan and Wells Fargo beating estimates while Citigroup disappoints. The financial sector ended the day lower by 0.7%, with the Financial Select Sector SPDR Fund having formed a bearish engulfing candle on its daily chart, which could indicate some exhaustion in the sector’s recent rally.

Into the new trading week, the lighter US economic calendar and the Fed blackout period will continue to leave much of the focus on the US earnings season. While estimates suggest that we are currently still in an “earnings recession” with the third consecutive quarter of earnings contraction expected for the S&P 500 in Q2, the divergence in stock market performance (S&P 500 at its highest level since April 2022) seems to be pricing for a bottoming-out in earnings, with a recovery underway in Q3 onwards. Financial updates in the likes of Bank of America, Goldman Sachs, Netflix and Tesla will be key to watch this week to provide any validation.

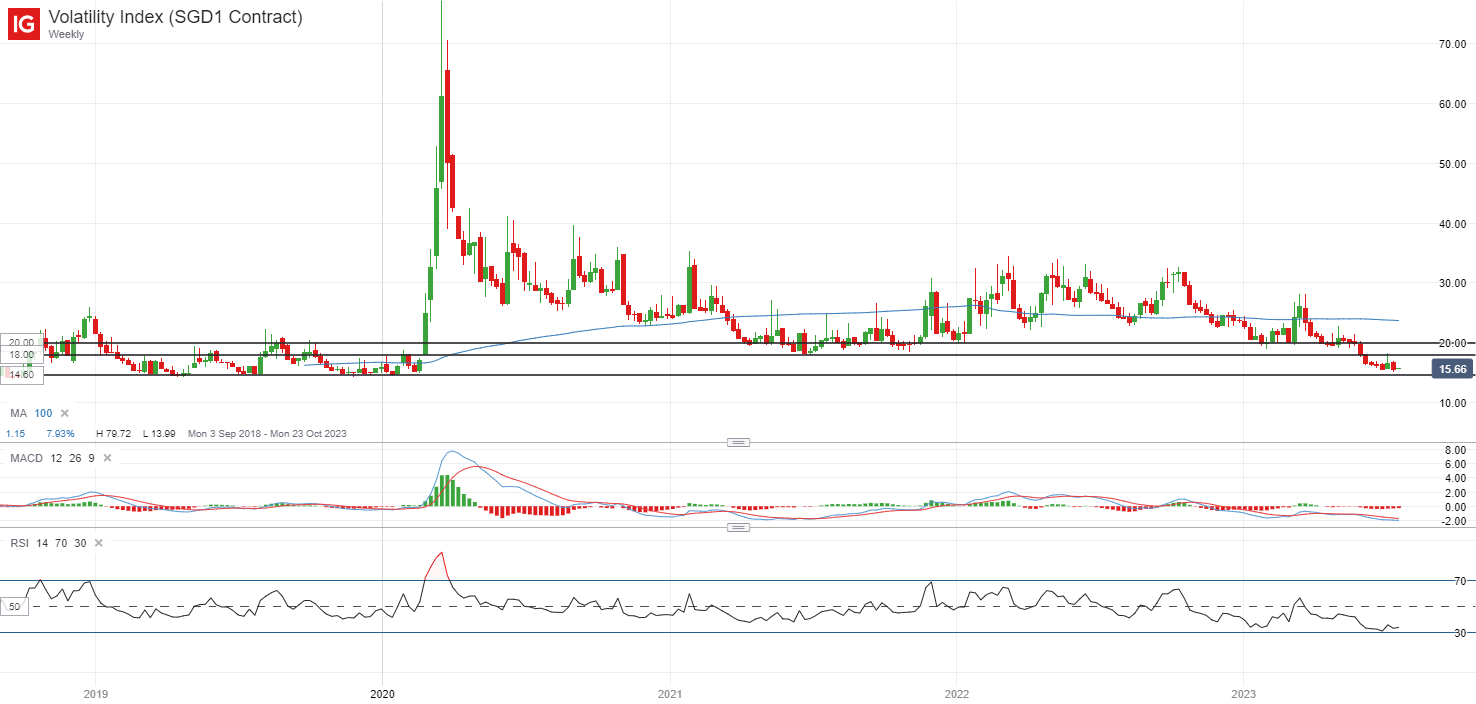
US Treasury yields rebounded last Friday, but the US 10-year yields remain held below a key resistance at the 3.85% level. US interest rate expectations from the Fed funds futures were largely unswayed, with one last 25 basis-point (bp) from the Fed this month still the consensus. The VIX is back to retest its June 2023 low, indicating the broader bullish sentiments despite the near-term risks of a retracement. Further downside will likely leave the 14.60 level as a key support to watch, having held up the index on at least four previous occasions since 2019. On the upside, immediate resistance on watch will be at the 18.00 level.

image1.png

Asian stocks look set for a subdued open, with ASX -0.10% and KOSPI -0.43% at the time of writing. Japan markets will be offline due to Marine Day, while the morning trading session for the Hong Kong markets has been delayed due to the issuance of Typhoon Signal No. 8, potentially setting a quieter tone for markets this morning.

Nevertheless, all eyes will be on a series of China’s economic data releases later including its 2Q GDP, with any weaker-than-expected read likely to serve as a dampener for the broader risk environment. Current expectations are for China’s 2Q GDP growth rate to turn in a 7.3% growth year-on-year, up from the 4.5% in 1Q, but large base effects from last year could mask the underlying dynamics to some extent. Quarter-on-quarter, a 0.5% growth is the consensus.

A series of key economic data will be released alongside as well, such as retail sales (est 3.2% versus 12.7% in June), industrial production (est 2.6% versus 3.5% in June) and fixed asset investment (3.5% versus 4% in June). Overall, an expected moderation in growth across the indicators may continue to point to a more tepid growth outlook for the world’s second largest economy.

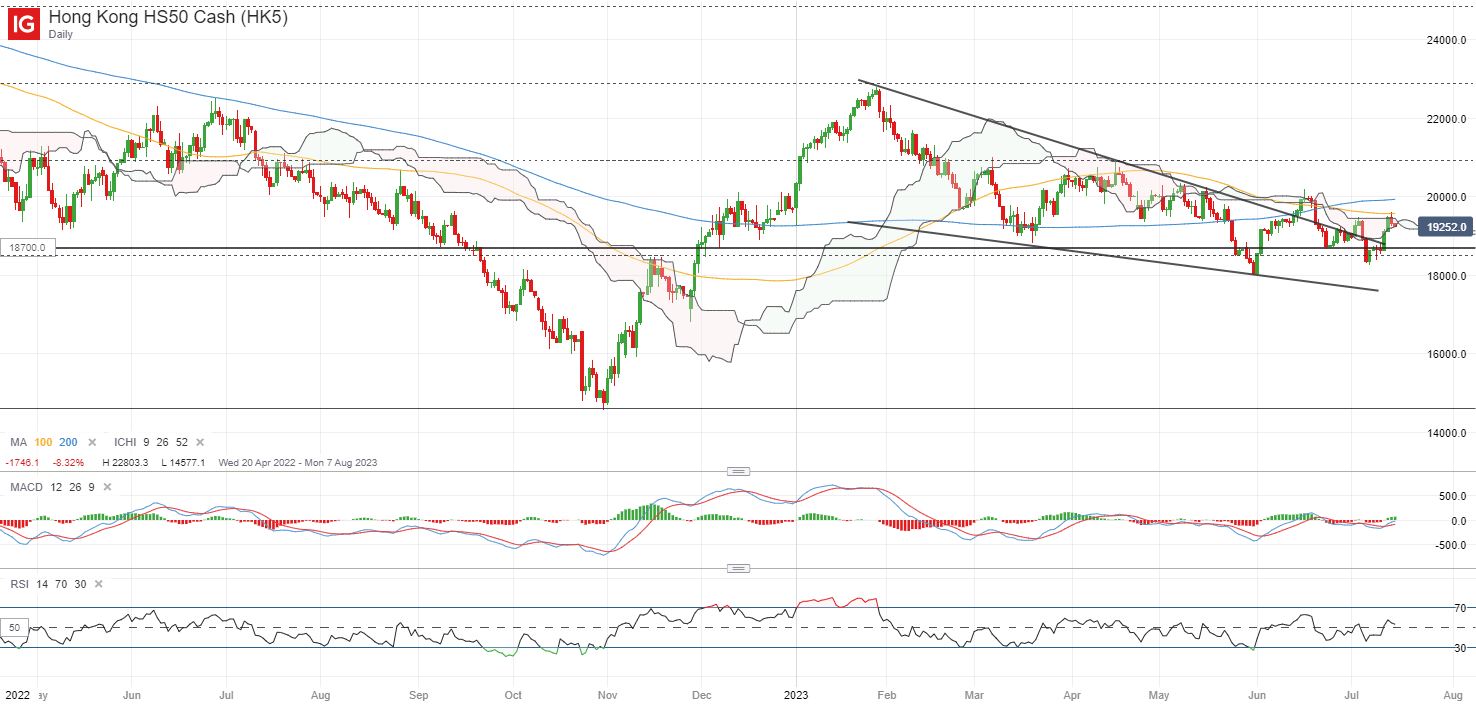
The Hang Seng Index is back to retest the upper edge of its Ichimoku cloud (daily) at the 19,600 level to end last week, with past five interactions since April this year failing to find a successful breakthrough. Near-term, the 19,600 level also coincides with its 100-day moving average (MA). While a bullish crossover on moving average convergence/divergence (MACD) and Relative Strength Index (RSI) above 50 may point to some building upward momentum lately, much is still dependent on a reclaim of its 100-day MA, along with its key psychological 20,000 level.

image2.png

On the watchlist: AUD/USD retesting June 2023 high ahead of China’s data, RBA minutes

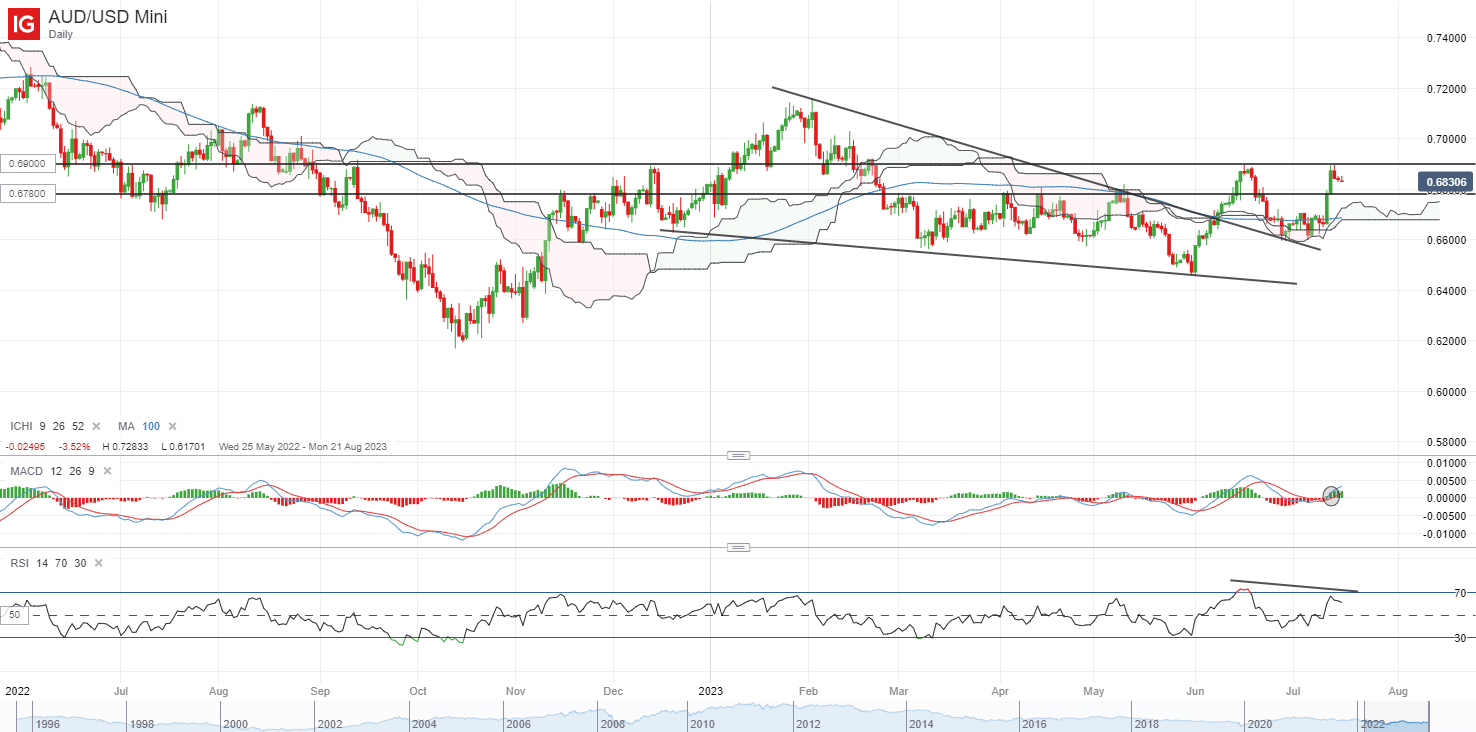
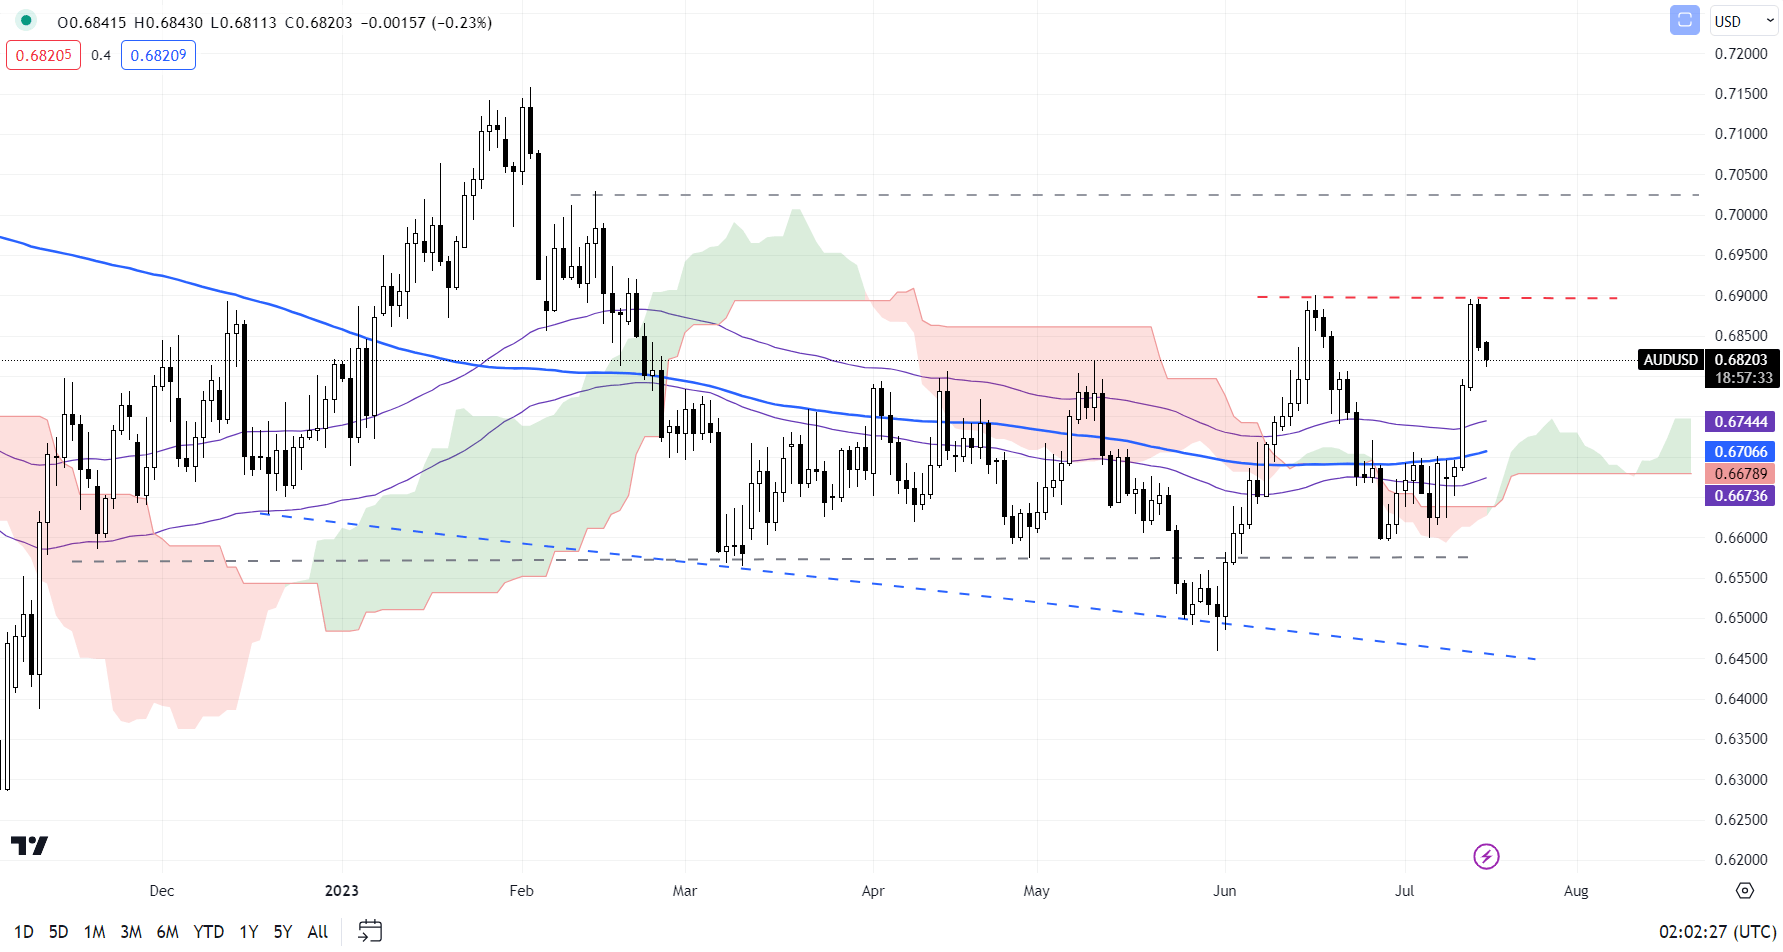
The AUD/USD has been taking the recent announcement of Australia’s next Reserve Bank governor, Michele Bullock, in stride as the new appointment largely pointed towards a no-change in monetary policies. But as a series of China’s economic data looms, along with the release of the Reserve Bank of Australia (RBA) minutes tomorrow, the pair is finding some resistance around its 0.690 level with a near-term bearish divergence on its RSI.

On the weekly chart, the 0.690 level also marked the upper edge of its Ichimoku cloud resistance, where the pair has failed to overcome on the past three interactions since March 2022. Ahead, any weaker-than-expected economic data out of China could further translate to some selling pressure. Any downside may leave the 0.678 level on watch as a previous resistance-turned-support. Failure to defend the 0.678 level may potentially prompt a move back towards the 0.660 level, where its previous consolidation lies.

image3.png

Australian Dollar Holds Losses After China GDP; How Much More Downside in AUD/USD?

Australian Dollar Holds Losses After China GDP; How Much More Downside in AUD/USD?

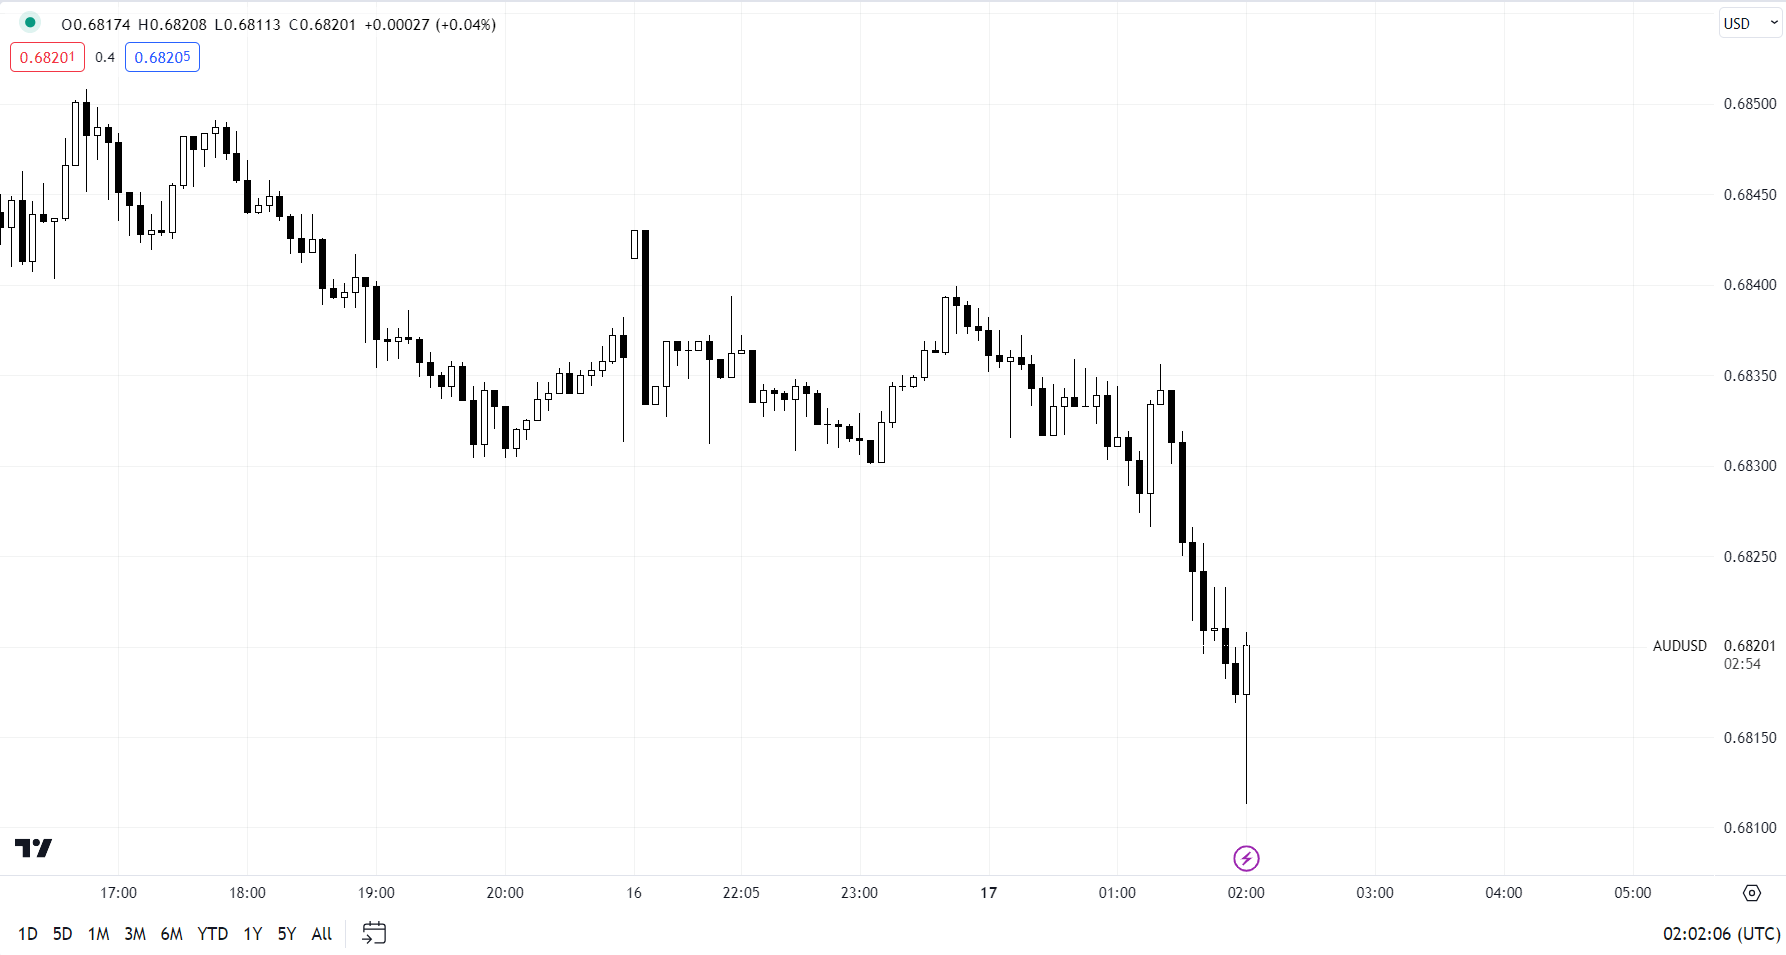
The Australian dollar held the day’s losses against the US dollar after the Chinese economy grew less than expected in the second quarter.

The Chinese economy grew 6.3% on-year in the April-June quarter, Vs 7.3% expected and 4.5% in the previous quarter. Industrial production grew 4.4% on-year in June, Vs 2.7% expected and 3.5% in May. Retail sales grew 3.1% on-year in June, Vs 3.2% expected and 12.7% in May. Fixed asset investment grew 3.8% on-year in the January-June period Vs 3.5% expected.

AUD/USD 5-minute Chart

image1.png

In recent months, China’s macro data have underwhelmed, as reflected in the China Economic Surprise Index, which is languishing around levels before the economic reopening earlier this year. Beijing has announced a series of measures in recent weeks to cushion some of the downside risks to the economy, including cuts in key lending benchmarks, targeted measures toward new-energy vehicles, the property sector, and the booming generative artificial intelligence sector, and signaled the end of the years-long crackdown on the technology sector.

Analysts have already started to upgrade the outlook on Chinese equities on expectations of more stimulus measures from the government, attractive valuations, and easing financial conditions. China is Australia’s largest two-way trading partner in goods and services. Any improvement in China’s growth outlook bodes well for AUD prospects. Key focus is now on the Politburo meeting in late July and potential additional stimulus measures, especially infrastructure, and the real estate sector.

AUD/USD Daily Chart

image2.png

Aside from China, AUD/USD has been supported amid growing expectations that the US Federal Reserve is nearing the end of its tightening cycle on softening US inflation. Rate futures are showing a 96% chance of one last 25 basis point hike at the July 25-26 meeting, according to the CME FedWatch tool.

On technical charts, the medium-term downward pressure in AUD/USD appears to be abating after earlier this month rebounded from near 0.6600. It is now testing resistance at the mid-June high of 0.6900. Any break above could open the door initially toward the mid-February high of 0.7030.On the downside, there is quite strong support around 0.6785.

Gold Price Gives Up Some Gains as the US Dollar Steadies. Where to for XAU/USD?

Gold Price Gives Up Some Gains as the US Dollar Steadies. Where to for XAU/USD?

The gold price has paused on its recent run higher as the market takes stock of where the US Dollar is headed. The yellow metal has eased to start the week as the ‘big dollar’ ticks slightly higher.

Soft inflation data in the US last week saw the market reappraise the extent of tightening that the Federal Reserve will need to carry out in order to contain price pressures.

With CPI and PPI sliding lower, Treasury yields have backed away from their recent peaks.

The benchmark 10-year note he is currently trading near 3.8% after having nudged up against 4.1% just over a week ago. The 2-year bond made a 17-year high earlier this month above 5.1% but it is now back below 4.8%.

The DXY index lost close to 2.25% last week while the gold futures contract only added 1.65%. The index moved to its lowest level since April 2022.

Interest rate markets have placed a high probability of a 25 basis point lift in the overnight target rate when the Federal Open Market Committee (FOMC) gather on July 26th.

With the Fed now in a blackout period ahead of its meeting, the data points in the week ahead could drive market volatility.

The market will see a number of business sentiment surveys as well as retail sales, industrial production, housing market statistics and jobs data. The full calendar can be read here.

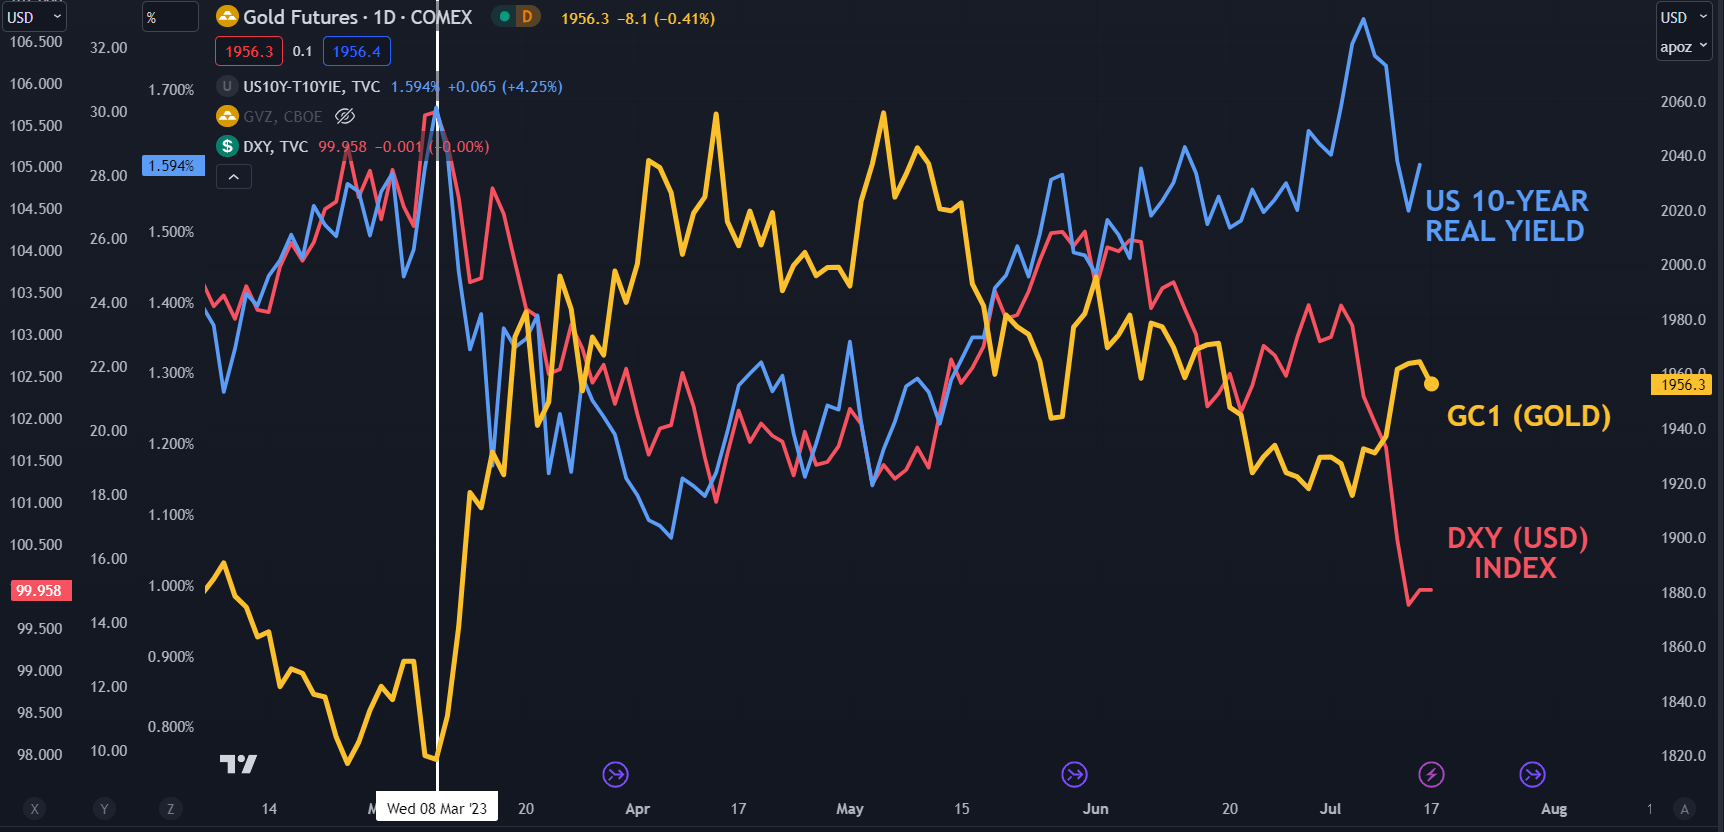
Something else to keep an eye on might be the US real yield. The inflation-adjusted return from the 10-year part of the curve sometimes has a strong correlation to gold.

GC1 (GOLD FRONT FUTURES CONTRACT) AGAINST US 10-YEAR REAL YIELD AND DXY (USD) INDEX

image1.png

GC1 (GOLD FUTURES) TECHNICAL ANALYSIS

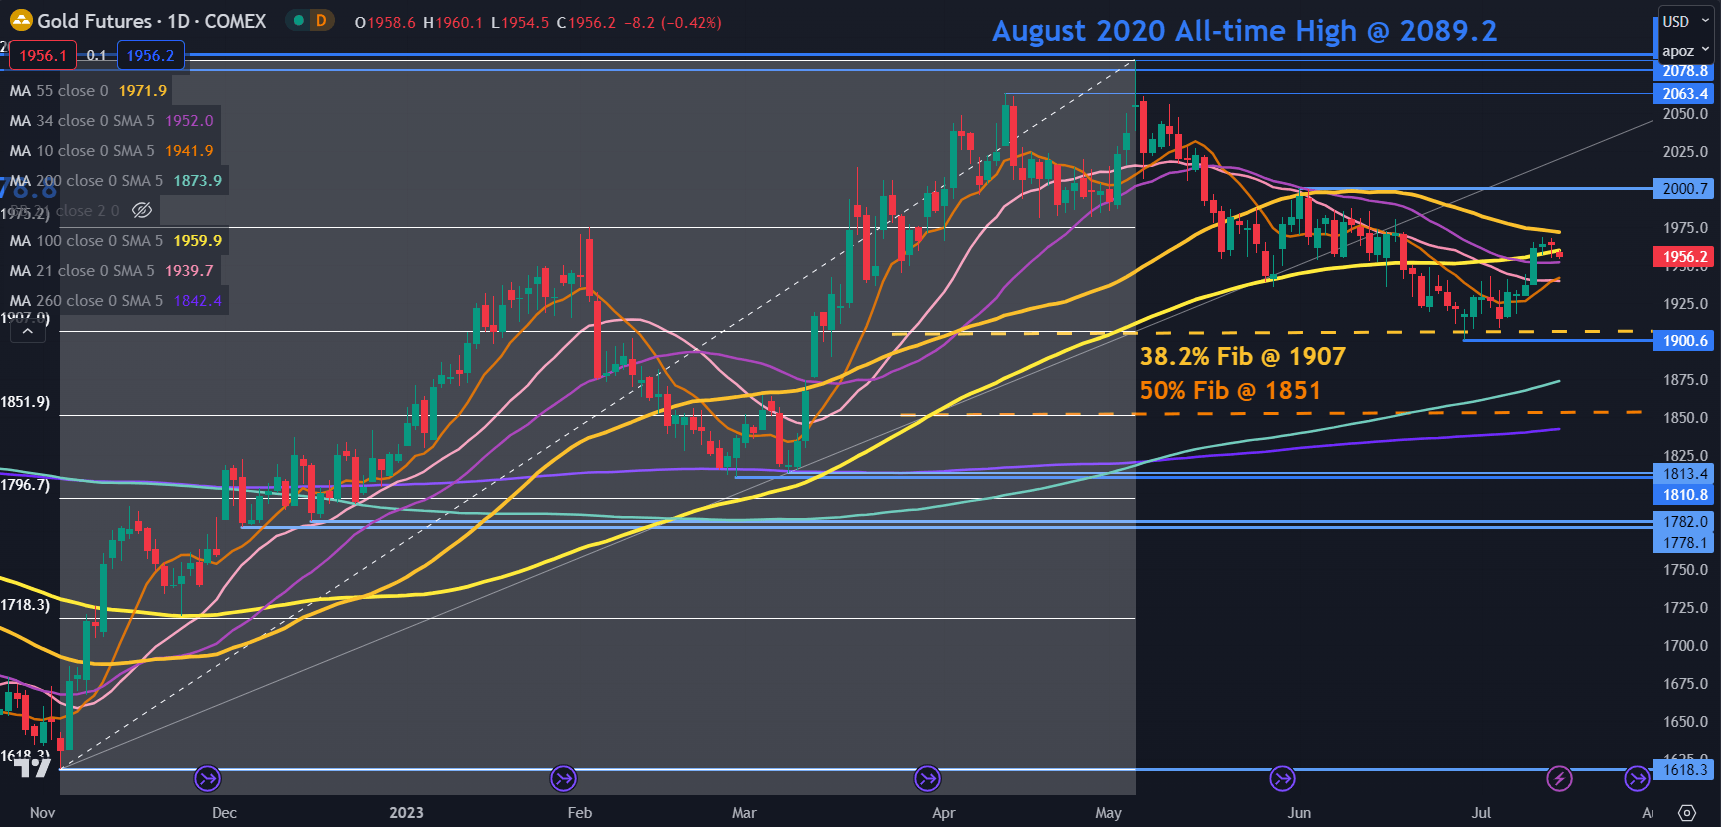
The gold price remains in the middle of its 2-month range between 1900 and 2000.

The lower bound of the range could see support lie at the Fibonacci Retracement levels of the move from 1618 up to 2085. The 38.2% retracement level is at 1907 and the 50% at 1851. The recent low 1900 might also see some support.

Looking at momentum, the price has moved above the 10-, 21-, 34-, 100, 200- and 260-day simple moving averages (SMA).

The 55-day SMA is currently within striking distance of the price at 1972. A clean break above the last remaining daily SMA might see bullish momentum evolve.

The peak of 2000 may offer resistance ahead of a potential resistance zone in the 2060 – 2090 area.

image2.png