China raises foreign debt limit

China raises foreign debt limit

China increased the macro-prudential adjustment parameter for cross-border financing of corporates and financial institutions to 1.5 from 1.25 on Thursday, a move that experts said will help boost confidence in the renminbi, the Chinese currency.

The People’s Bank of China, the country’s central bank, and the State Administration of Foreign Exchange announced in a joint statement on Thursday the intention to raise the parameter, which allows Chinese companies and financial institutions to borrow more from overseas.

The move is aimed at expanding the cross-border funding sources of enterprises and financial institutions and encouraging them to optimize their asset-liability structure, the statement said.

USD/CAD prints four-day losing streak around mid-1.3100s amid sluggish US Dollar, Oil price

USD/CAD prints four-day losing streak around mid-1.3100s amid sluggish US Dollar, Oil price

USD/CAD bears cheer the US Dollar’s retreat from the weekly high amid sluggish Oil prices early Thursday morning in Europe. That said, the Loonie pair drops for the fourth consecutive day to around 1.3145 by the press time, after refreshing the weekly low with the 1.3133 figure. In doing so, the quote consolidates Friday’s stellar rebound from the lowest levels since September 2022.

US Dollar Index (DXY) drops 0.25% intraday to retest the 100.00 round figure while snapping a two-day rebound from the lowest level since April 2022. With this, the greenback justifies the previous day’s downbeat US housing data and mixed concerns about the Fed, as well as ignores the optimism at the US banks.

US Building Permits for June marked a contraction of 3.7% versus the previous increase of 5.6% (revised) whereas the Housing Starts also slumped 8.0% for the said period from 15.7% revised prior. Though the previously released slower growth of the US Retail Sales for June contrasted with promising details to defend the Federal Reserve in keeping the rates higher for longer, as well as help in announcing a 0.25% rate hike in July. The same triggered the US Dollar’s corrective bounce off the 15-month low on Tuesday and helped defend the recovery on Wednesday, ahead of the latest retreat.

On the other hand, WTI crude oil remains indecisive near $75.40 as it struggles for clear directions after reversing from a one-week high the previous day. The black gold’s latest inaction could also be linked to the dual between the lesser-than-expected inventory draw and the softer US Dollar.

Elsewhere, the fresh fears of the US-China tussles, emanating from the comments of China diplomat and the US House of Representatives move concerning outbound investments and AI chips, seem to prod the USD/CAD bears of late.

It should be noted that the mixed concerns about the Federal Reserve’s (Fed) move in 2023, even as the July rate hike is confirmed, contrast with the Bank of Canada’s (BoC) hawkish bias to keep the USD/CAD bears hopeful.

Looking ahead, second-tier employment and housing clues from the US and Canada may entertain intraday traders of the USD/CAD pair ahead of Friday’s Canadian Retail Sales and the next week’s key Federal Reserve (Fed) monetary policy meeting. It’s worth noting that headlines surrounding the Fed and China will also direct short-term moves of the Loonie pair and are worth observing.

Technical analysis

Despite the USD/CAD pair’s latest weakness, a three-week-old bullish triangle formation, currently between 1.3110 and 1.3205, challenges the sellers amid steady RSI and sluggish MACD signals.

AUD/USD, AUD/JPY Analysis: Jobs data keeps hawkish pressure on the RBA

AUD/USD, AUD/JPY Analysis: Jobs data keeps hawkish pressure on the RBA

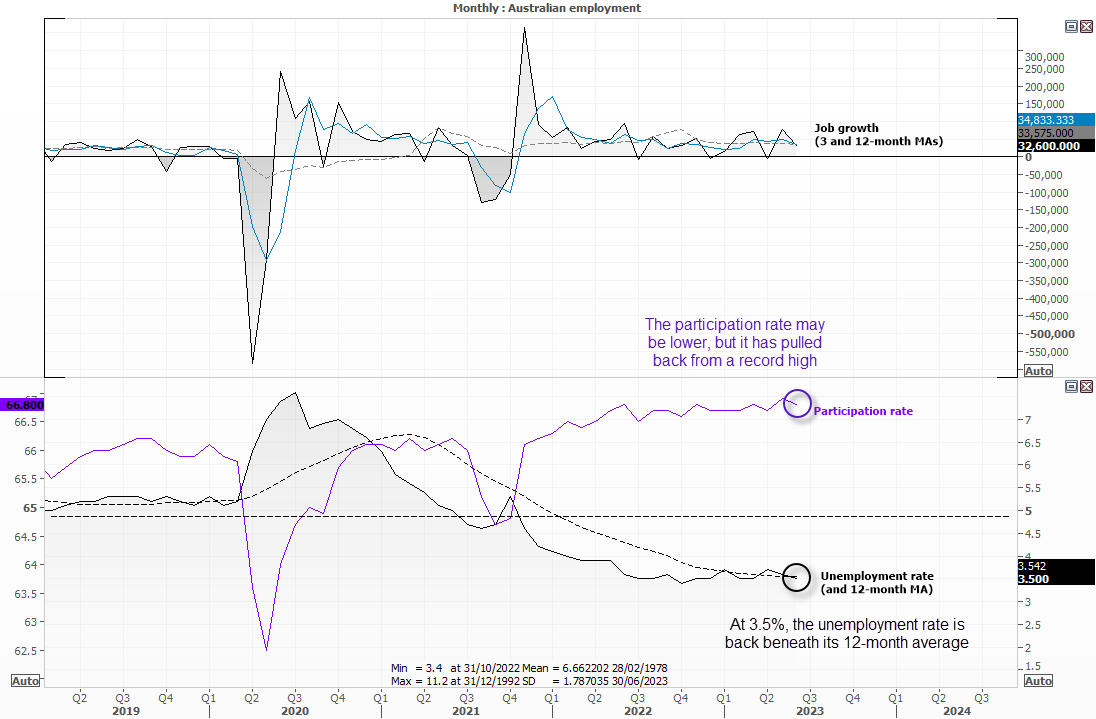
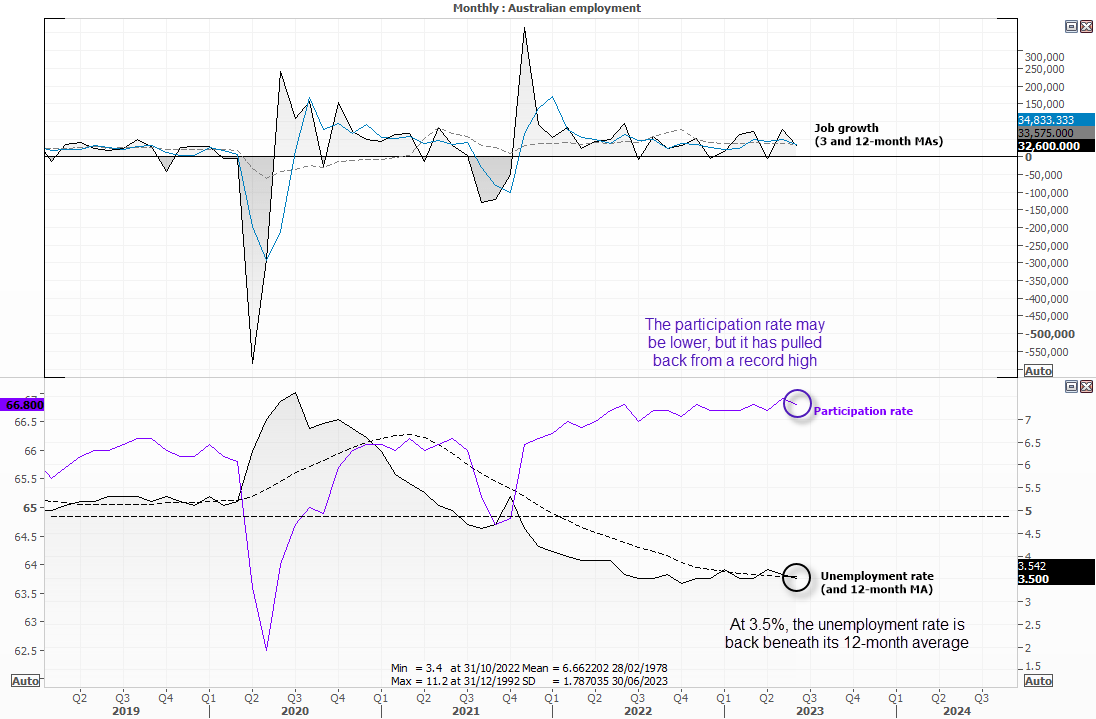
Job growth beat expectations and unemployment back to 3.5% and below its 12-month average. So we’ll turn a blind eye to the lower participation rate, given it has pulled back from a record high.

Ultimately, it’s another strong set of employment figures which keeps the pressure on a data-dependant RBA to potentially hike rates in August. And it could take quite a set of lowballed inflation figures next week for that pressure to be removed. Moreover, it’s the quarterly inflation report which carries more weight for the RBA’s decision.

20230720auemployment

AUD pairs spike higher, ASX 200 pauses at resistance

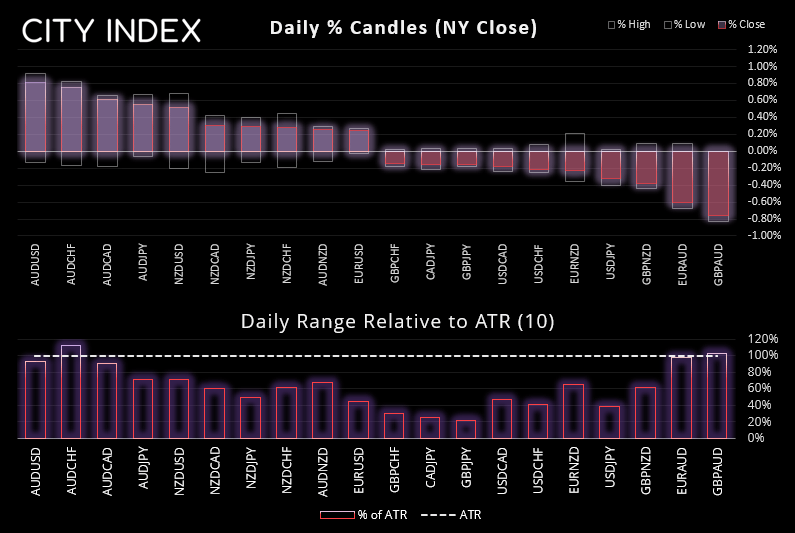
The Australian dollar has spiked higher across the board after the economy delivered another rate-hike defying report. AUD is currently the strongest FX major in today’s session, with AUD/CHF and GBP/AUD exceeding their 10-day ATR’s.

AUD/NZD has regained its footing above 1.0800 and now trades backs above its 50-day EMA, and the bias remains for the cross to move towards 1.0900 – a break above which brings 1.10 into focus. A key driver for this bias is for investors to slowly realise that the RBA may need to hike at least once or two more times whilst the RBNZ remain in pause mode, which will see the RBNZ-RBA interest rate differential diminish and support a higher AUD/NZD.

The ASX 200 has been knocked form its perch after its earlier attempt to tap 7400. And with it holding beneath the April and June highs, I suspect some bulls will be questioning their long exposure at these levels. A pullback could be due.

20230720forexCI

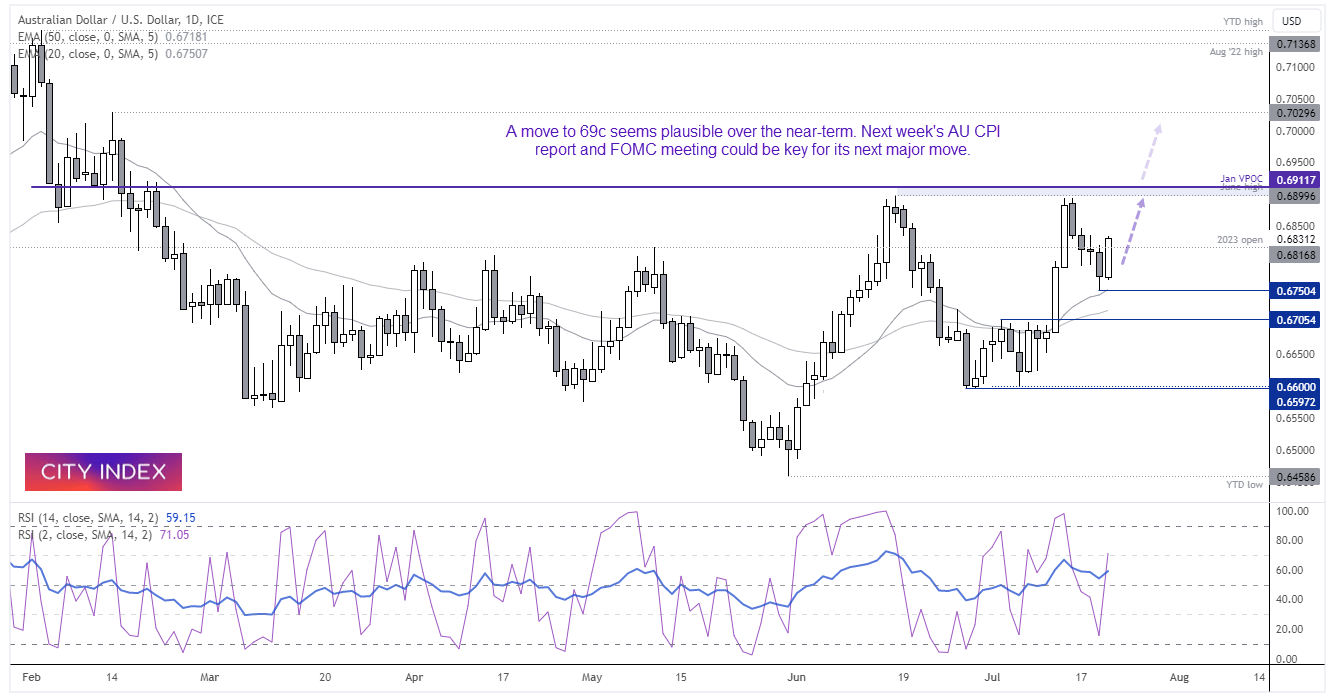
AUD/USD daily chart:

A 4-day pullback on AUD/USD found support just above the 50-day EMA and momentum has now realigned with its breakout of 67c last week. A daily close around current prices would provide a bullish engulfing day above the 2023 open price, which adds to the potential that an important swing low has been seen at 0.6750. From here, I suspect a move to 69c is now on the cards. Bulls could seek bullish setups within today’s range or seek bullish continuation patterns on intraday charts to hopefully improve the reward ratio.

20230720audusdCI

AUD/JPY 1-hour chart

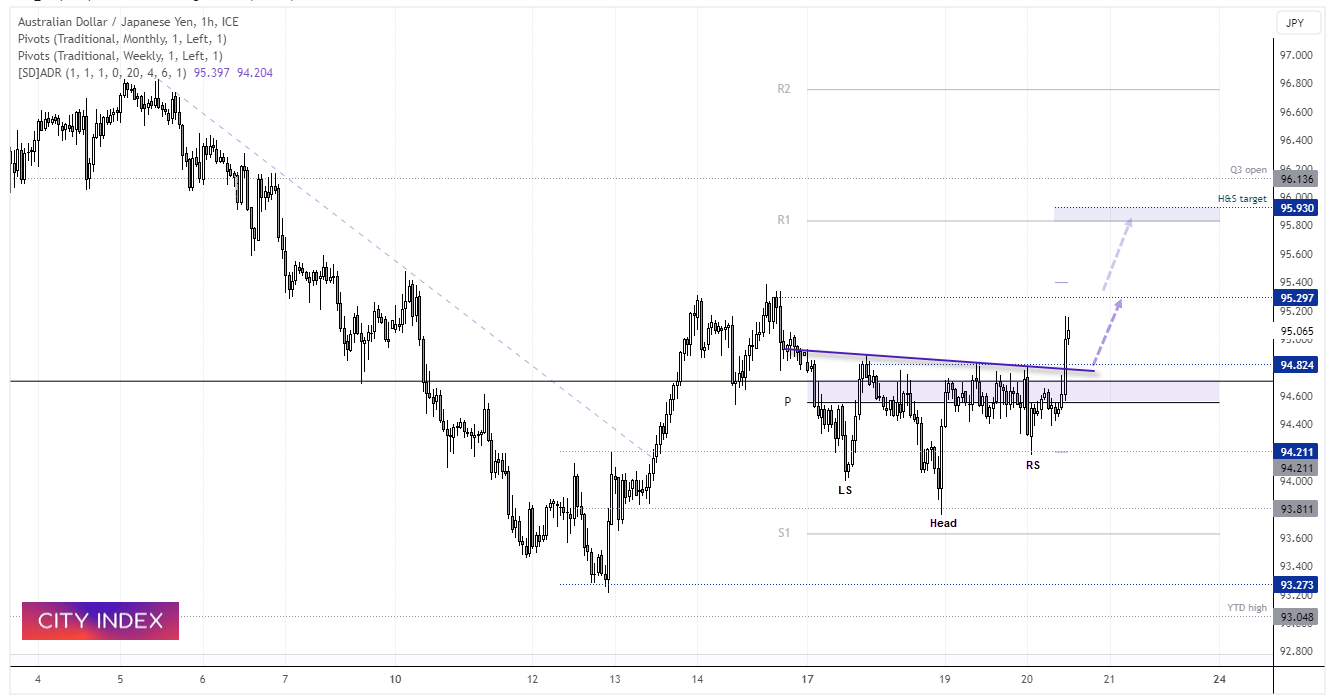
We outlined our bullish bias on AUD/JPY in today’s Asian Open report, and we can see how today’s employment report kicked it into action. We’ve seen a clean breakout of an inverted head and shoulders pattern which projects an approximate target just below 96.0. But as prices are near the 96 highs, we’d prefer to see prices pull back towards the neckline to increase the potential reward to risk ratio. And that leaves the highs around 93 and the weekly R1 pivot in focus for potential bullish targets.

20230720audjpyH1ci


Five of the best: UK sector leaders for tough times

Five of the best: UK sector leaders for tough times

Businesses in the UK, and globally, have had to deal with many headwinds and forces of change in the past few years. After nearly a decade and a half of “ZIRP” (zero interest rate policy), and now in the face of rapidly rising financing costs, many companies are having to reassess their business strategies amid a major shift in the economic regime.

You’ll quite often hear companies complain of the rising cost of doing business – and they’re not wrong. Interest rates are much higher, and hence so is the cost of capital. In addition, labour shortages are commonplace, as is high staff turnover.

Meanwhile, companies are also facing rising costs of materials and goods, coupled with limited supplies. To add to all of the above, tax rates are much higher than they were just a few years ago.

As a result of these changes, the barriers to compete and operate in many industries continue to rise. And we haven’t even mentioned generative artificial intelligence (AI), ever-more complex regulations and the need to invest in sustainability.

More competitive landscape – potentially good for industry leaders

The barriers to entry in many industries are rising rapidly, and are higher than at any time that we can remember in our 20-plus years of investing. In fact, it is harder to find a developed country where these pressures are collectively more acute than they are in the UK.

From our perspective as long-term investors we don’t necessarily see tough corporate times as a bad thing. We spend our days identifying and meeting management teams of the well-funded industry leaders with the scale and profitability to overcome such challenges.

The advantages of such companies are now becoming more apparent as the rising cost of doing business, and cost capital in particular, drive industry shake-outs and lessen “competitive intensity”. In many industries, competitive intensity is falling from high levels after ZIRP had favoured the challenger, or maverick business models for so long.

In this vein, we highlight leading companies from five completely different industries, spanning travel & leisure, retail, housebuilding, construction and real estate.

For each of these industries we’ve identified the leaders within them that we think are benefitting from the current environment. The highlighted companies typically have a particularly strong culture and the advantage of management teams with longer term vision and patience.

1. Travel & leisure

The hotel group: Whitbread Plc

The hotel industry in the UK has been through a particularly difficult time in recent years for obvious reasons. There are a number of large hotel groups, but much less so outside of London and the major cities. Premier Inn, Whitbread’s core asset, competes with larger groups such as Travelodge outside the large city market, but the majority of the market is occupied by independent hotel chains/individual owners.

Whitbread, we believe, is experiencing a reduction in competitive intensity as some of the independent hotel groups shrink for lack of funding. On the other side of the equation, new hotel openings are very limited. In the past two years, data we have seen from UBS Evidence Lab suggests the competitive intensity has fallen for Premier Inns if we measure it in terms of number of competitors within a 10-minute drive.

This is allowing Premier Inn more scope to grow and invest. In fact, not only is Whitbread investing heavily in its hotels in both the UK and Germany, but it can also afford a generous share buyback and dividend to boot. The result is a YouGov brand index score that is unrivalled in the industry.

2. Retail

The clothing and household goods retailer: Next Plc

Next operates in a highly competitive space where barriers to entry have historically been low (plenty of retail space available and many Eastern-based clothing manufacturers). The shift to online shopping has decimated the High Street and many retailers and brand owners have failed to make the leap online in a profitable way.

Next has done this very successfully, helped by the fact that the old Next Direct business was in fact an e-commerce business from the outset, with the logistics infrastructure and knowhow to operate in a post High Street world.

Astute brand management and investment from CEO Lord Simon Wolfson over the past 20-plus years has allowed Next to not only take more market share, but a much higher share of the value chain of the competition. There is Next the brand, and then there is Next the total platform which offers infrastructure, systems and technology to other consumer brands that do not have the resources or scale to operate in a world of digital shopping.

The recent cost of living squeeze, the rapidly rising cost of funding, the abundance of global supply chain issues, and the sharp increase in supply chain standards (e.g. Leicester sweat-shop allegations) are making the barriers to compete ever higher to climb. It is no surprise to us that the market share of the Next brand continues to grind upwards versus its key competitors. It is also no surprise to us that Next recently increased its profit guidance for 2023.

3. Housebuilding

The London-focused housebuilder: Berkeley Group Holdings

When it comes to the UK housebuilding industry there are almost two separate markets, one inside the M25 encompassing London and one outside it. The mix of buyers, the labour pool, and regulations (land scarcity, mostly brownfield sites) are quite different.

The business of planning, developing, and selling in London is in many ways more complex than anywhere else in the country. For this reason, we see a limited presence in the London market from the large listed builders, who tend to focus their sights (sites!) on the regions.

Berkeley is the largest builder operating in London with an historic share of about 12%, competing mainly against a long tail of private builders. Following the fallout of the Grenfell Tower tragedy, the rise in politics around building standards has led to the unintended consequence of a sharp contraction in the number of new apartments being built/planned in the city. Housing starts are a fraction of government targets in the capital.

Berkeley has a fantastic track record of buying and developing land at the right times in the cycle, and has the enviable position of sitting on 12-plus years of a land bank with unrivalled expertise in the complex brownfield planning process. Recently, the group’s share of starts has shot up because of others retrenching. Peer housebuilders in London tend to operate with much shorter land banks, and with funding so tight, supply is likely to be severely constrained in the coming years.

The return of the international buyer (about 50% of Berkeley’s unit sales) following the pandemic is also a support for demand in a world of high mortgage rates.With a backdrop of tighter supply, it is interesting to note that when adjusted for inflation, the “real” price of a house in London has fallen 21% since 2016, already worse than what occurred in the financial crisis in 2008/09. Assuming flat house prices until the end of 2024, and a 4% inflation rate, real house prices will have corrected by a whopping 28%.

The point being that the starting point for London house prices is not necessarily indicative of a hot market.

London real house prices

4. Construction

The aggregates and asphalt manufacturer: Breedon Group Plc

Breedon is one of four national players in the aggregates (quarries) and cement industry. The quarry industry has a long tail of small and mid-sized regional players but because of the heavy and low value nature of the products (aggregates, asphalt in particular), the product does not travel far from source. These dynamics afford the four national players a high local market share.

Being a highly consolidated industry it is a good one in terms of margins and returns in the UK. It is also important to note that new quarries don’t tend to get sanctioned anymore, and are in finite supply. Supply of aggregates (crushed rock/sand and gravel) in the UK market is actually pretty flat over the past 50 years. Meanwhile, the cement import market is also controlled by the same large four national players (which include the UK arms of global peers CRH and Holcim).

A number of disruptions and changes have hit the industry in recent years including the sky high cost of energy, the rising cost of carbon credits, and the need to invest heavily in decarbonisation. The latter in fact is becoming a pre-requisite to winning large national and regional contracts for road paving, in a market that has previously been dominated by price.

Market forces are pushing the industry to concentrate on the strong scale players; for example those with the cost and scale required to hedge energy cost volatility or with the balance sheet to invest in renewable technologies and fuels. Breedon is a clear winner in this space (also in terms of leading the decarbonisation drive) and will continue to take share over time. The UK has a high need for road repair, and the levelling-up agenda and investment in infrastructure will enable continued growth for the sector.

When we invest we look for pricing power as a important ingredient in judging the quality of a company. Breeden enjoys pricing power in an industry where prices have outstripped broader inflationary trends (see chart, below).

UK aggregates prices versus inflation

5. Real estate

The student accommodation specialist: The Unite Group Plc

Unite is the longest serving and leading purpose built student accommodation, or PBSA provider in the UK. It is one of very few fully integrated (developer, owner, operator) players in the space, and its scale and integrated model make it the most profitable. Student accommodation is a specialist industry when it comes to real estate, and a highly focused and customer centric approach is required to make good returns. Barriers to entry in the overall provision of accommodation to students are rising rapidly at a time when demand is also rising fast.

Competitors to Unite and the other PBSA real estate investment trusts (Reits), but also the university owned digs as well as the HMO (houses in multiple occupation) market operated by private landlords.

A mixture of both local and national regulations is making it harder to be a private landlord, notwithstanding the higher tax burden and energy efficiency standards. University budgets are not lined with gold either, and development is being pushed more to providers such as Unite via nomination agreements (long term offtake contracts between the PBSAs and university groups). Unite has the relationships and the balance sheet to continue taking a higher share in this growing market.

The ever rising cost of capital and the shock of the pandemic is also putting paid to new investment in the sector, with pipelines rather thin versus history (Unite being an exception here). Unite has taken its opportunities well, having invested heavily in the London land market post Brexit when other investors were pulling back.

It is very well placed to grow over the next decade where demographics are particularly favourable, as the population of those turning 18 jumps by over 20% by 2030 (see charts, below).


University application ratesPopulation turning 18 in UK

Please note any past performance mentioned is not a guide to future performance and may not be repeated. The sectors, securities, regions and countries shown are for illustrative purposes only and are not to be considered a recommendation to buy or sell.

Japan Raises This Year’s Price View to 2.6% Ahead of BOJ Meet

Japan Raises This Year’s Price View to 2.6% Ahead of BOJ Meet

The Japanese government raised its overall inflation forecast to 2.6% for the current fiscal year ahead of the central bank’s policy decision meeting next week, the Cabinet Office said Thursday.

The upward revision from the previous forecast of 1.7% shows stronger-than-expected inflationary pressure. Japan saw that trend holding up even after accounting for government price-relief measures, which the Cabinet Office says shaves 0.5 percentage points off this year’s price reading.

For fiscal 2024, the government expects overall inflation to slow to 1.9%. The forecasts are for year-on-year changes on overall consumer prices, which stood at 3.2% in May. June data is due Friday, with analysts expecting the reading to remain at the same level.

The forecasts come ahead of the Bank of Japan’s latest policy meeting at the end of next week, which investors are closely watching for any shifts to policy. Until last month, many economists were linking a possible upward revision to the central bank’s price outlook to a change in policy, but fewer analysts now see that as likely in the latest survey.

This time the BOJ is said to raise its inflation forecast above 2% for this fiscal year, but their view for the following year is expected to be largely unchanged, potentially suggesting that the central bank may hold off from any major change this time.

The BOJ has kept up its aggressive monetary easing in an effort to get its main inflation gauge — consumer prices excluding fresh food — to be anchored above its 2% target.

Earlier this week, BOJ Governor Kazuo Ueda indicated it would take a shift in the bank’s assessment of stably achieving its inflation target to change its stance of continuing with persistent monetary easing.

Asia Day Ahead: Mixed Showing in Asia as Markets Digest NFLX, TSLA Earnings

Asia Day Ahead: Mixed Showing in Asia as Markets Digest NFLX, TSLA Earnings

Wall Street eked out further gains (DJIA +0.31%; S&P 500 +0.24%; Nasdaq +0.03%) to end the trading session overnight, but after-market earnings releases from Netflix and Tesla have brought about a more mixed showing in US equity futures this morning. Given that both companies’ share price have witnessed stellar gains this year (Netflix +62%, Tesla +170% year-to-date), expectations may be priced for a perfect outcome on all fronts in their results, with pockets of weaknesses revealed this morning not very much well-received.

Netflix has managed to grow its subscriptions by 8% in the second quarter (Q2), revealing some success in its password-sharing clampdown, but a miss in Q2 revenue and lower-than-expected revenue forecast for Q3 translate to an 8.3% plunge in share price in after-hours trading.

On another front, Tesla has beaten both top and bottom-line estimates, but volume growth comes at the expense of its operating margin (9.6% versus 11.4% previously) with price cuts and increased discounts. Possibilities of further price cuts remain on the table as signalled by its CEO, Elon Musk. Tesla’s share price is down 4.2% in after-hours trading.

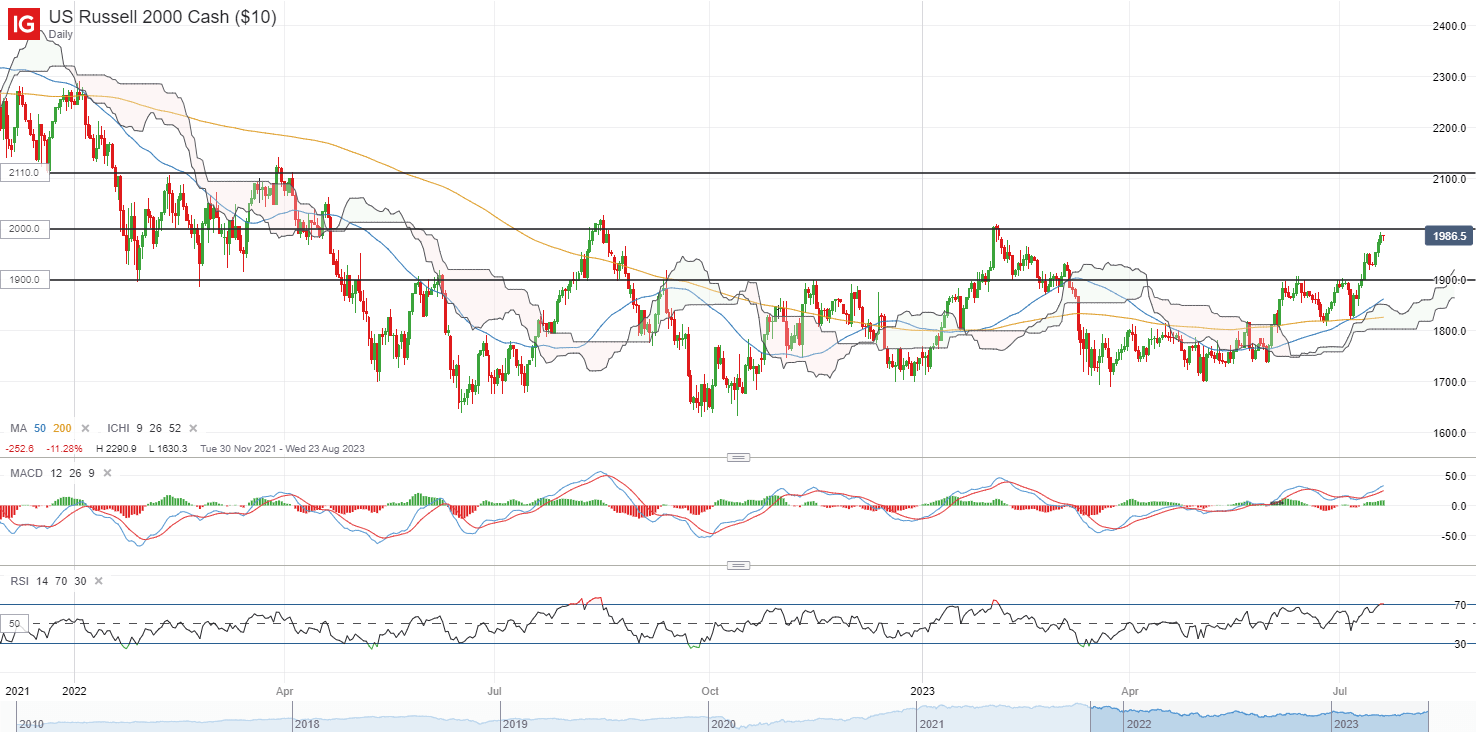
Apart from fresh market reaction to Netflix and Tesla results, the day ahead will leave eyes on a series of economic data out of the US to provide a gauge of economic conditions, such as the jobless claims data and the Conference Board leading index. The Russell 2000 is just a touch away from its key psychological 2,000 level after surging more than 9% over the past two weeks. Further broadening out of the risk rally could translate to more catch-up gains in the index, with a bullish crossover formed between its 50-day and 200-day moving average (MA) lately. A reclaim of its key 2,000 level could pave the way to retest the 2,110 level next.

image1.png

Asia Open

Asian stocks look set for a mixed open, with Nikkei -0.43%, ASX +0.81% and KOSPI -0.20% at the time of writing. China’s one-year and five-year loan prime rate settings were kept unchanged, which are largely expected. Australia’s jobs data will be on the agenda next to provide clues on the Reserve Bank of Australia’s (RBA) next move in rates. Thus far, rate expectations remain unconvinced for a prolonged rate pause from the RBA thus far, with bets for one more additional 25 basis-point hike by the end of this year. A weaker showing in Australia’s labour market may potentially challenge that.

On the earnings front, TSMC’s earnings will be due, with expectations for a 27% decline in quarterly profits from a year ago and a 13% decline in net revenue over the same period, reflecting ongoing moderation in the chip sector demand. But given the recent rally in share price since May this year, expectations could be for a turnaround, with Refinitiv estimates suggesting that Q2 may mark the worst in terms of top and bottom-line before a turnaround in Q3 onwards. Validation will be sought on management’s guidance on that aspect.

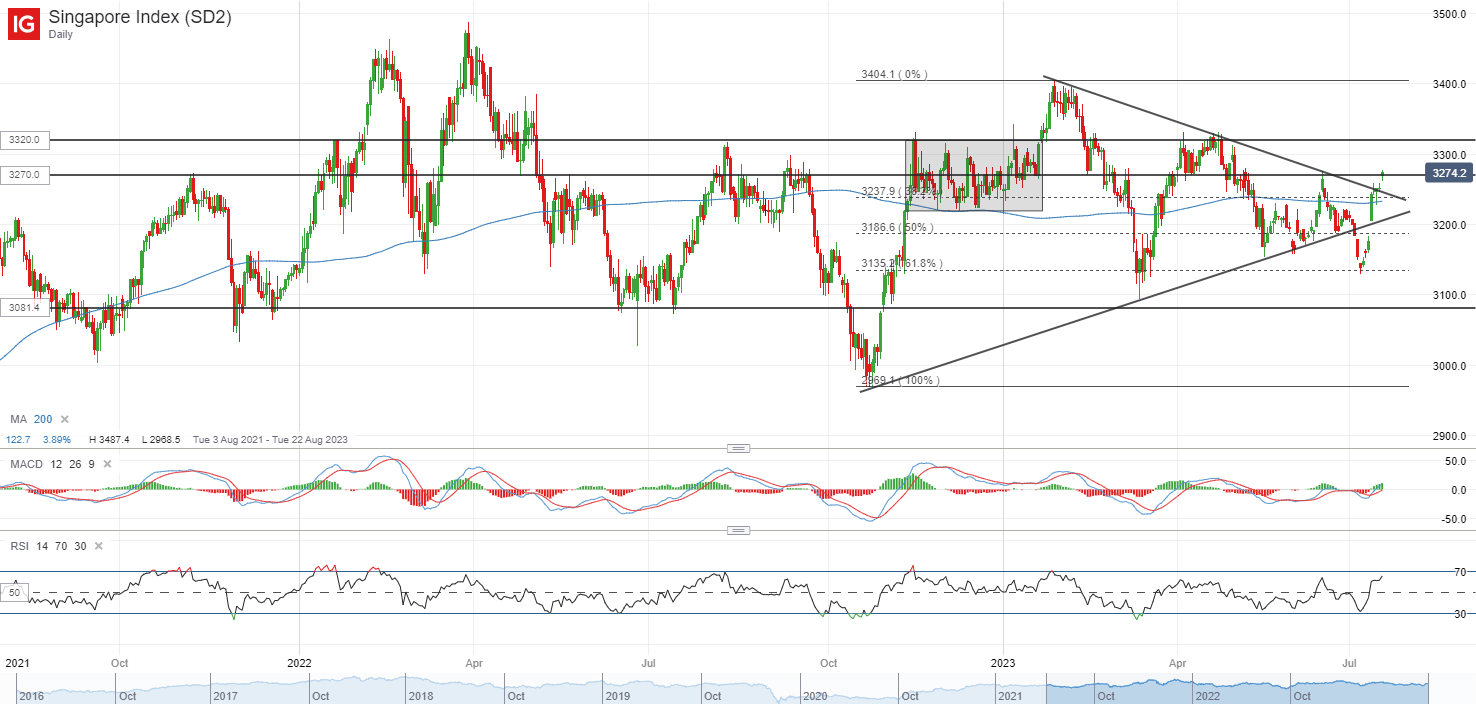
Perhaps a surprise showing from the mounting traction towards value sectors is the 4.8% jump in the Straits Times Index over the course of the past two weeks. A breakdown of the lower trendline of a symmetrical triangle pattern in early July eventually came short-lived, after finding support at its March 2023 bottom at the 3,140 level. Holding above its 3,270 level may leave its 3,320 level in sight next, but more signs could still be needed on whether recent upmove marked a trend reversal, given the presence of lower highs still in place.

image2.png

On the watchlist: USD/JPY attempting to stabilise ahead of Japan’s inflation data tomorrow

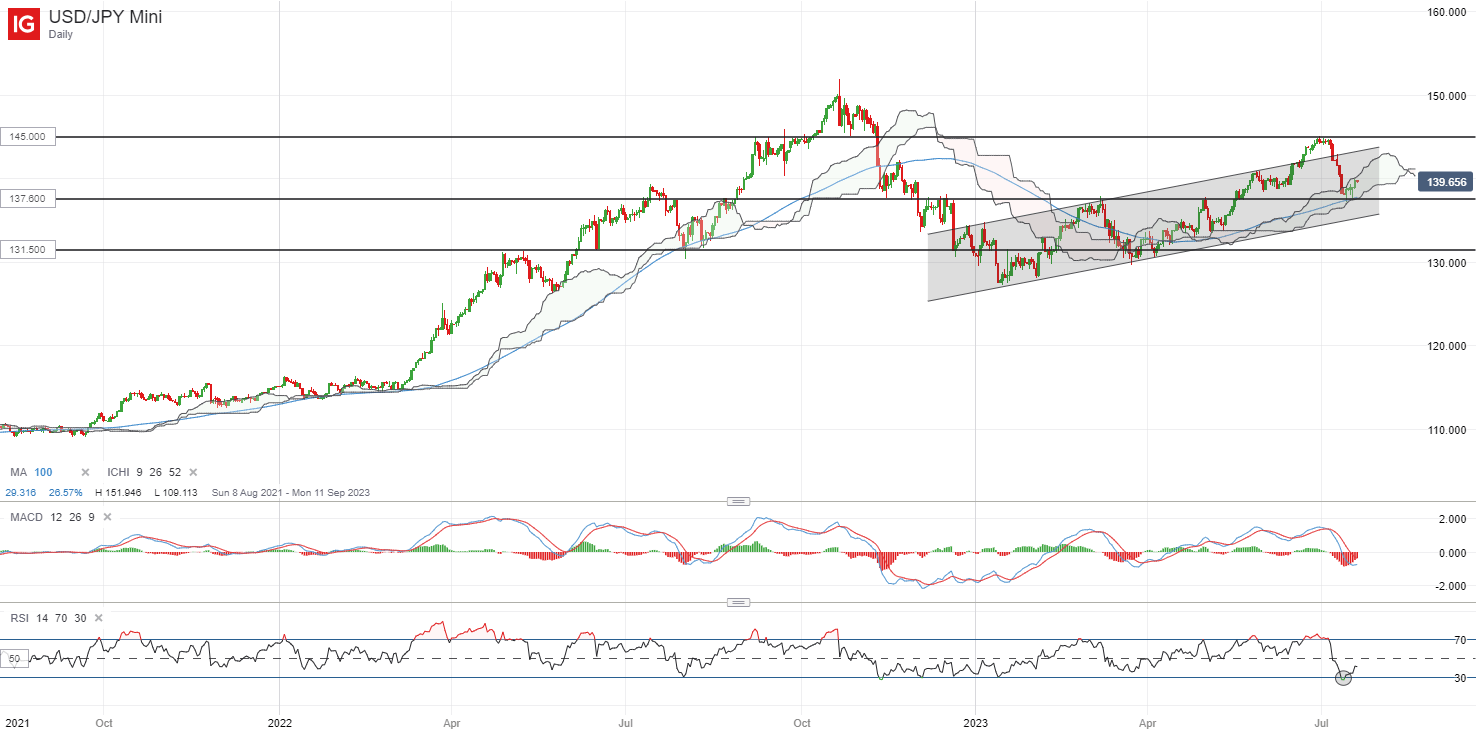
Following a steep 5% sell-off over the past two weeks, the USD/JPY has been attempting to stabilise around its 137.60 level lately as sentiments moderate from oversold technical conditions. The 137.60 level marked a key support confluence for the pair to hold, where its 100-day MA coincides with the lower edge of its Ichimoku cloud support on the daily chart. Failure for the 137.60 level to hold for the USD/JPY could pave the way to retest a lower channel trendline at the 135.80 level, followed by the 131.50 level next.

Fresh updates on Japan’s inflation number will be on watch tomorrow. A recent pull-ahead in Japan’s wage pressures in May has sought to challenge the Bank of Japan (BoJ)’s long-lasting view of inflation being ‘transitory’. Another pull-ahead in inflation data, particularly the core aspect, may raise the odds of pricing pressures being more ingrained and further support hawkish positioning in the yen ahead of the BoJ meeting next week.

image3.png

Gold Price Trend Focuses Back on Broader Upside Bias Since the End of Last Year

Gold Price Trend Focuses Back on Broader Upside Bias Since the End of Last Year

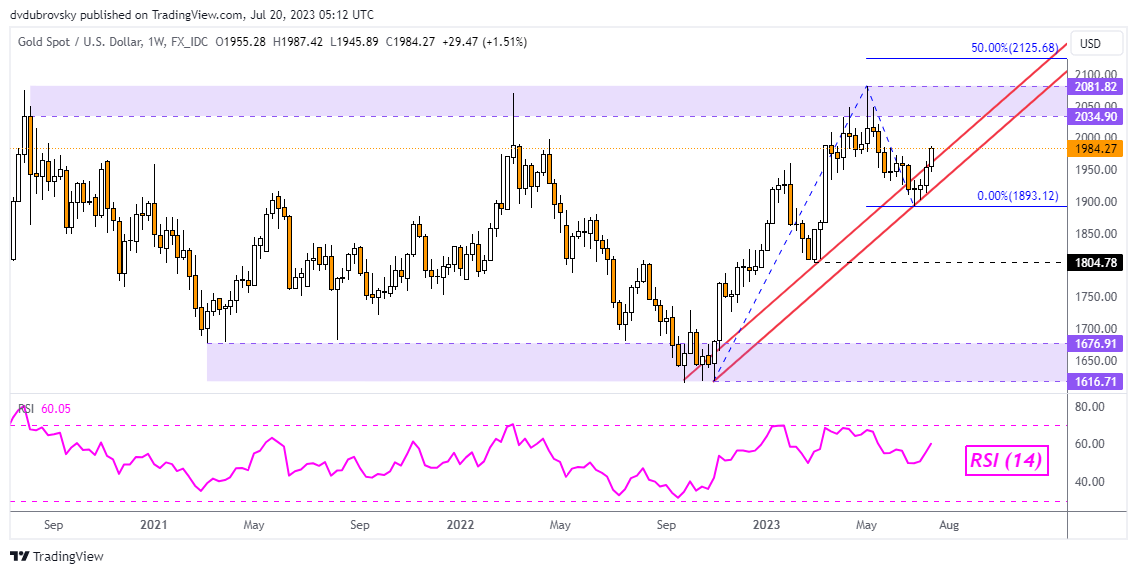
Gold prices are attempting to resume the broader uptrend since XAU/USD bottomed towards the end of 2022. Using the weekly chart below, the yellow metal is working to confirm a push above a zone of rising support from October, opening the door to extending near-term gains. That may pave the way for a retest of early 2023 highs.

In such an outcome, gold would also be looking at testing the critical resistance zone between 2034 and 2081. Clearing this range opens the door to setting new highs. Meanwhile, a turn lower from here places the focus on 1893, which is the June low. With that in mind, let us examine the daily chart to get a better picture of what the near-term outlook looks like.

Weekly Chart

Daily Chart

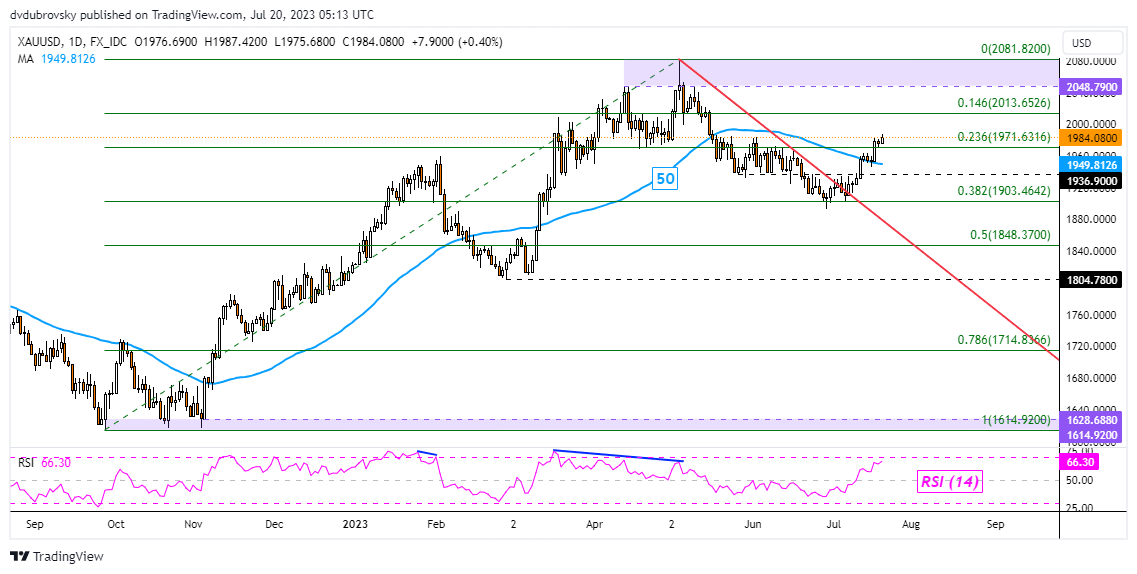
Gold confirmed a breakout above the near-term falling trendline from May. Since then, prices have also pushed above the 50-day Simple Moving Average, which failed to maintain a downside bias. That has left the yellow metal facing the minor 14.6% Fibonacci retracement level at 2013 before the 2048 – 2081 resistance zone comes into focus.

In the event of a turn lower, immediate support seems to be the 23.6% level at 1971. Confirming downward would once again place the focus on the 50-day SMA, which may reinstate itself as new support. Otherwise, further bearish price action places the focus on the 38.2% level at 1903. Confirming a breakout under this price opens the door to resuming May’s top.

Daily Chart

Australian Dollar Leaps on Hot Jobs Data Ahead of CPI. Where to for AUD/USD?

Australian Dollar Leaps on Hot Jobs Data Ahead of CPI. Where to for AUD/USD?

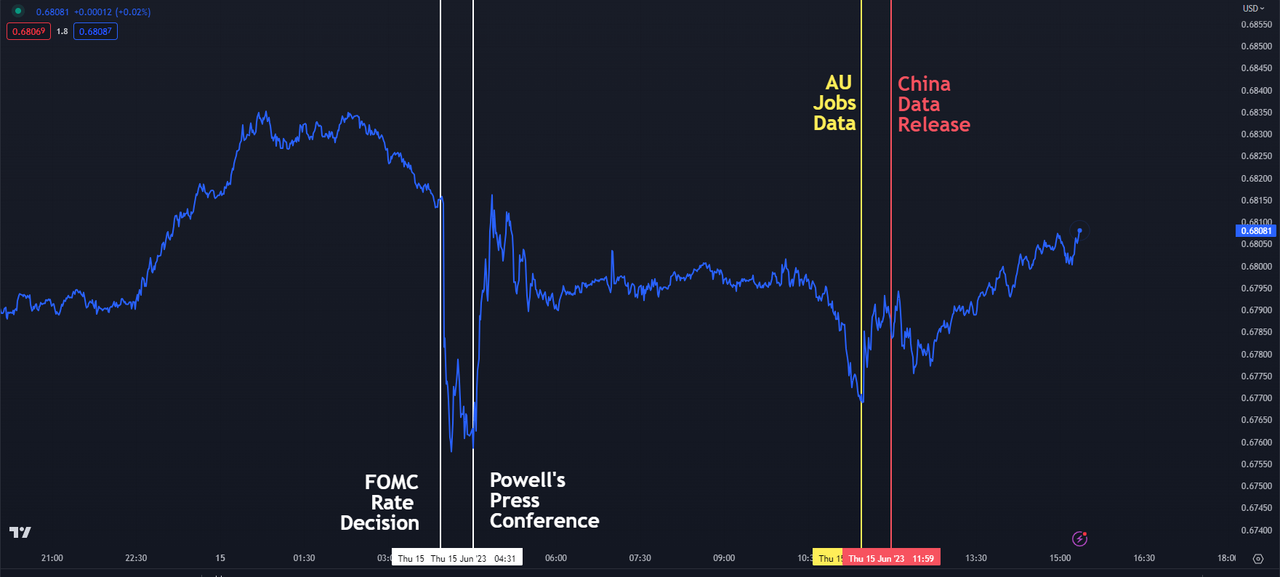
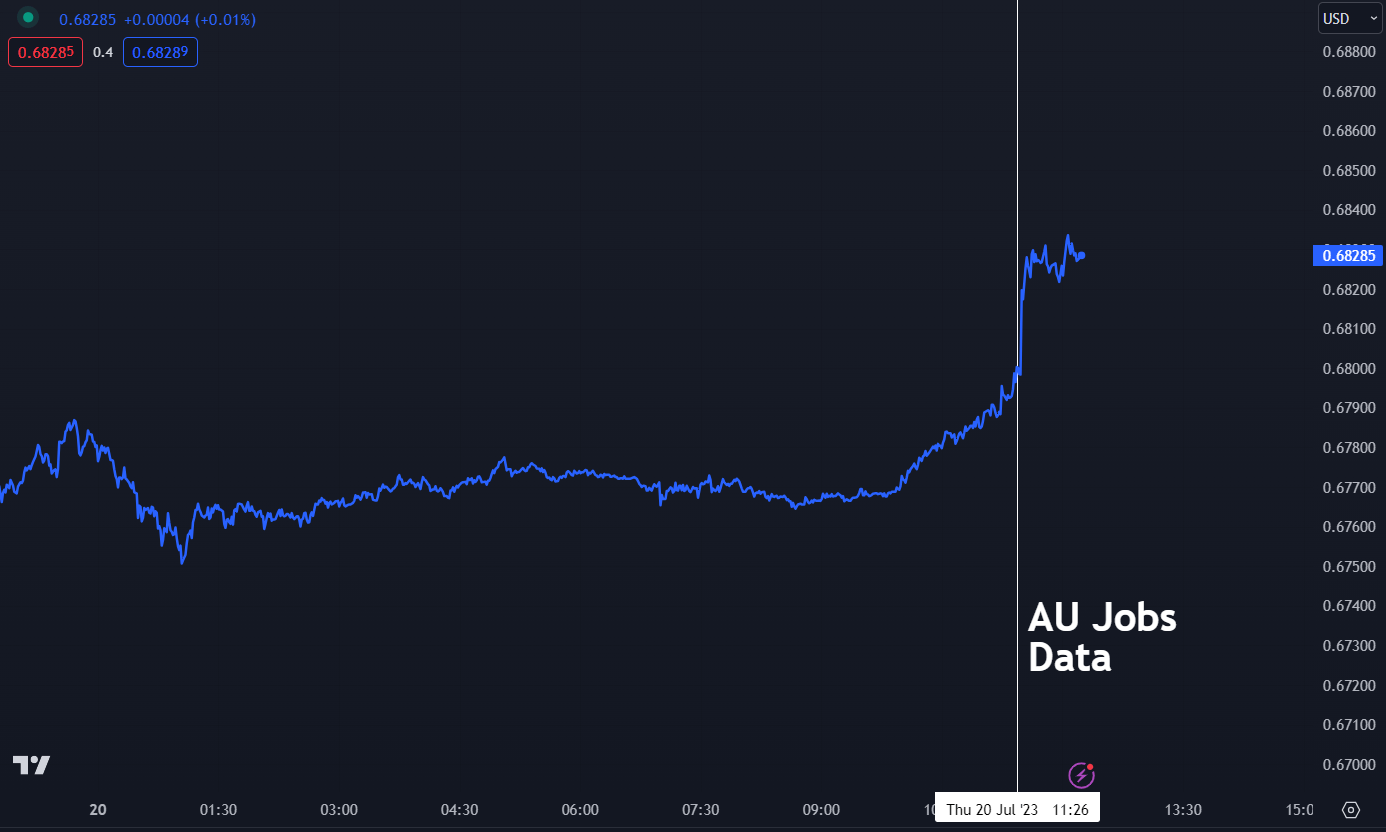
The Australian Dollar ran to higher ground immediately after sizzling local jobs data that shows that the economy remains robust. This is despite 400 basis points of tightening by the Reserve Bank of Australia (RBA) since May last year.

The unemployment rate came in at 3.5% in June against the 3.6% anticipated and prior. 32.6k Australian jobs were added in the month, which was notably above the 15k expected to be added and 75.9k previously.

Of note was the full-time boost of 39.3k while the participation rate dipped slightly to 66.8% from 66.9%.

The RBA left rates unchanged earlier this month at 4.10%. Before today’s numbers, the interest rate futures market ascribed a low probability of a hike in the cash rate by the RBA at its August monetary policy meeting.

Elsewhere in the region, the Peoples Bank of China (PBOC) refrained from cutting the rate on the 1- and 5-year loan prime rate today, keeping them at 3.55% and 4.20% respectively.

There is speculation that Beijing will look to do more stimulus measures as they try to reignite their economy.

Looking ahead, next Wednesday will see Australian headline CPI to the end of the second quarter. A Bloomberg survey of economist is anticipating 6.2% against 7.0% previously.

The same survey is forecasting the RBA’s preferred measure of trimmed mean inflation for the same period to be 6.2%. It was 6.6% in the prior quarter.

A wide variation from expectations could trigger a bout of volatility for AUD/USD. The RBA’s fight on inflation is set to continue with many award wages rising by 5 to 8% in recent weeks.

AUD/USD PRICE REACTION TO JOBS DATA

image1.png

AUD/USD TECHNICAL ANALYSIS

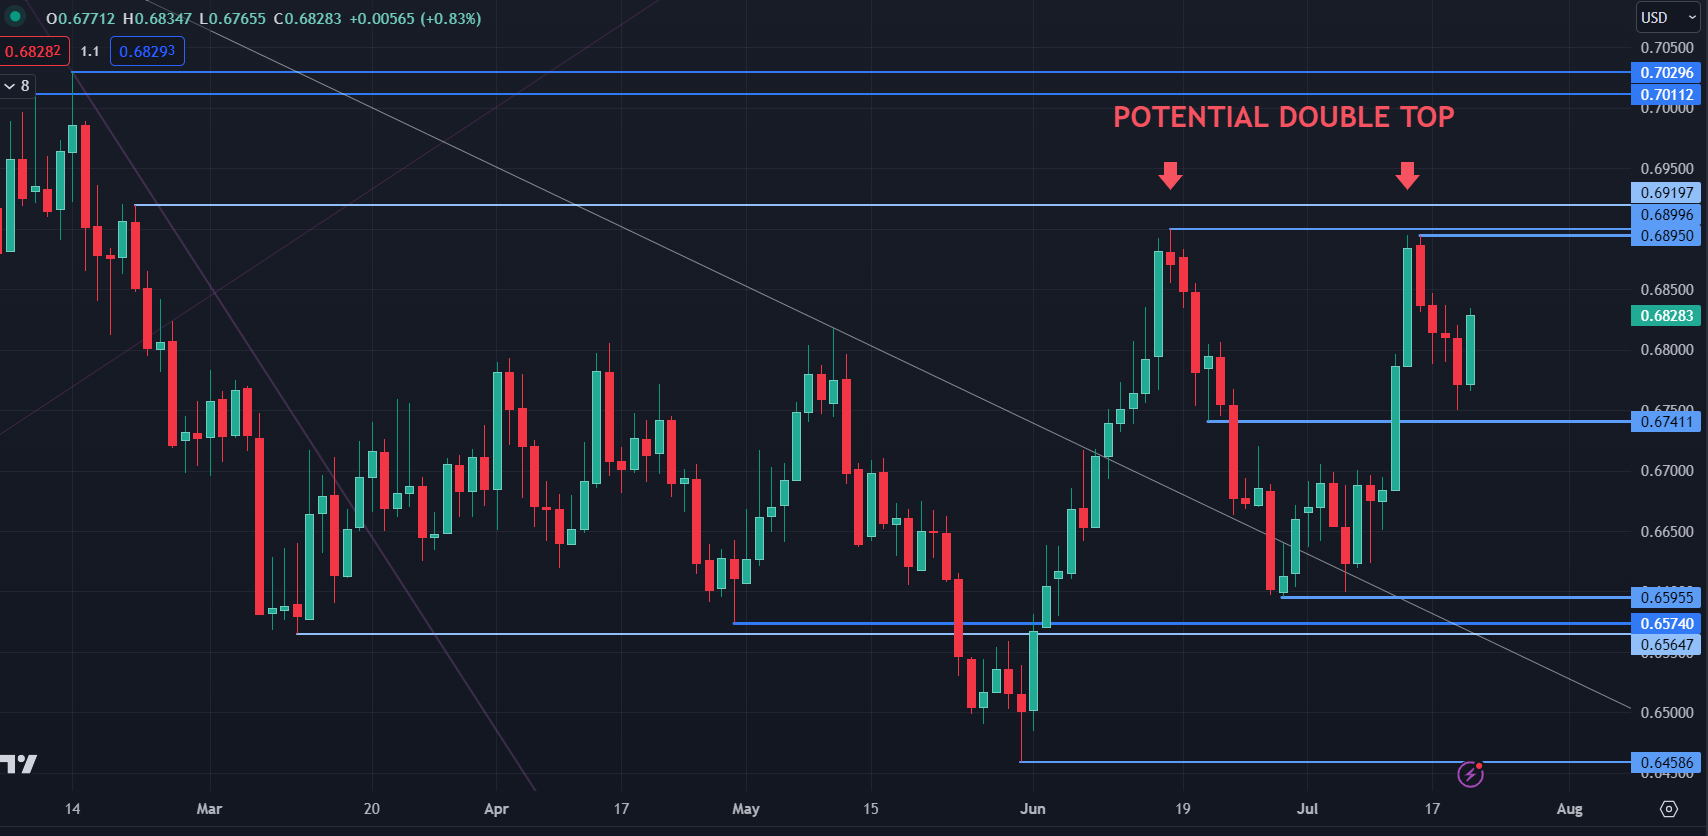
AUD/USD has been in a five-month trading range of 0.6459 – 0.6900 and it failed to break the upper bound last week and has potentially set up a Double Top.

A break above 0.6920 would negate the pattern, but as long as it stays below that level, potential bearishness may unfold.

Resistance could be in the 0.6900 and 0.6920 zone ahead of possible resistance in the 0.7010 – 0.7030 area where several previous peaks lie.

On the downside, support might be at the breakpoint of 0.6741 ahead of the prior low of 0.6595. Further down, the previous low of 0.6565 or the breakpoint of 0.6547 may provide support.

image2.png


What’s Changed for British Pound After UK CPI? GBP/USD, EUR/GBP, GBP/AUD Price Setups

What’s Changed for British Pound After UK CPI? GBP/USD, EUR/GBP, GBP/AUD Price Setups

The British pound looks set to retreat slightly against its peers following evidence that price pressures in the UK are finally moderating from elevated levels.

Data showed inflation slowed to 7.9% on-year in June, Vs 8.2% expected and 8.7% in May. Core inflation eased to 6.9% on-year from 7.1% in May. As a result, the Bank of England’s terminal benchmark rate expectations have scaled back to around 5.8% by the end of the year, from slightly over 6% on Tuesday, and 5% currently.

Also, this probably means BOE will move by 25 basis points at its next meeting in August rather than 50 basis points. But the bias is still for higher rates as headline inflation is the highest amongst G7 economies, and well above BOE’s 2% target, keeping the downside in GBP supported, both from absolute (level of terminal interest rates) and relative (potential for more tightening) monetary policy perspective in comparison with some of its peers.

GBP/USD Weekly Chart

image1.png

GBP/USD: Bullish pressure is easing in the short term

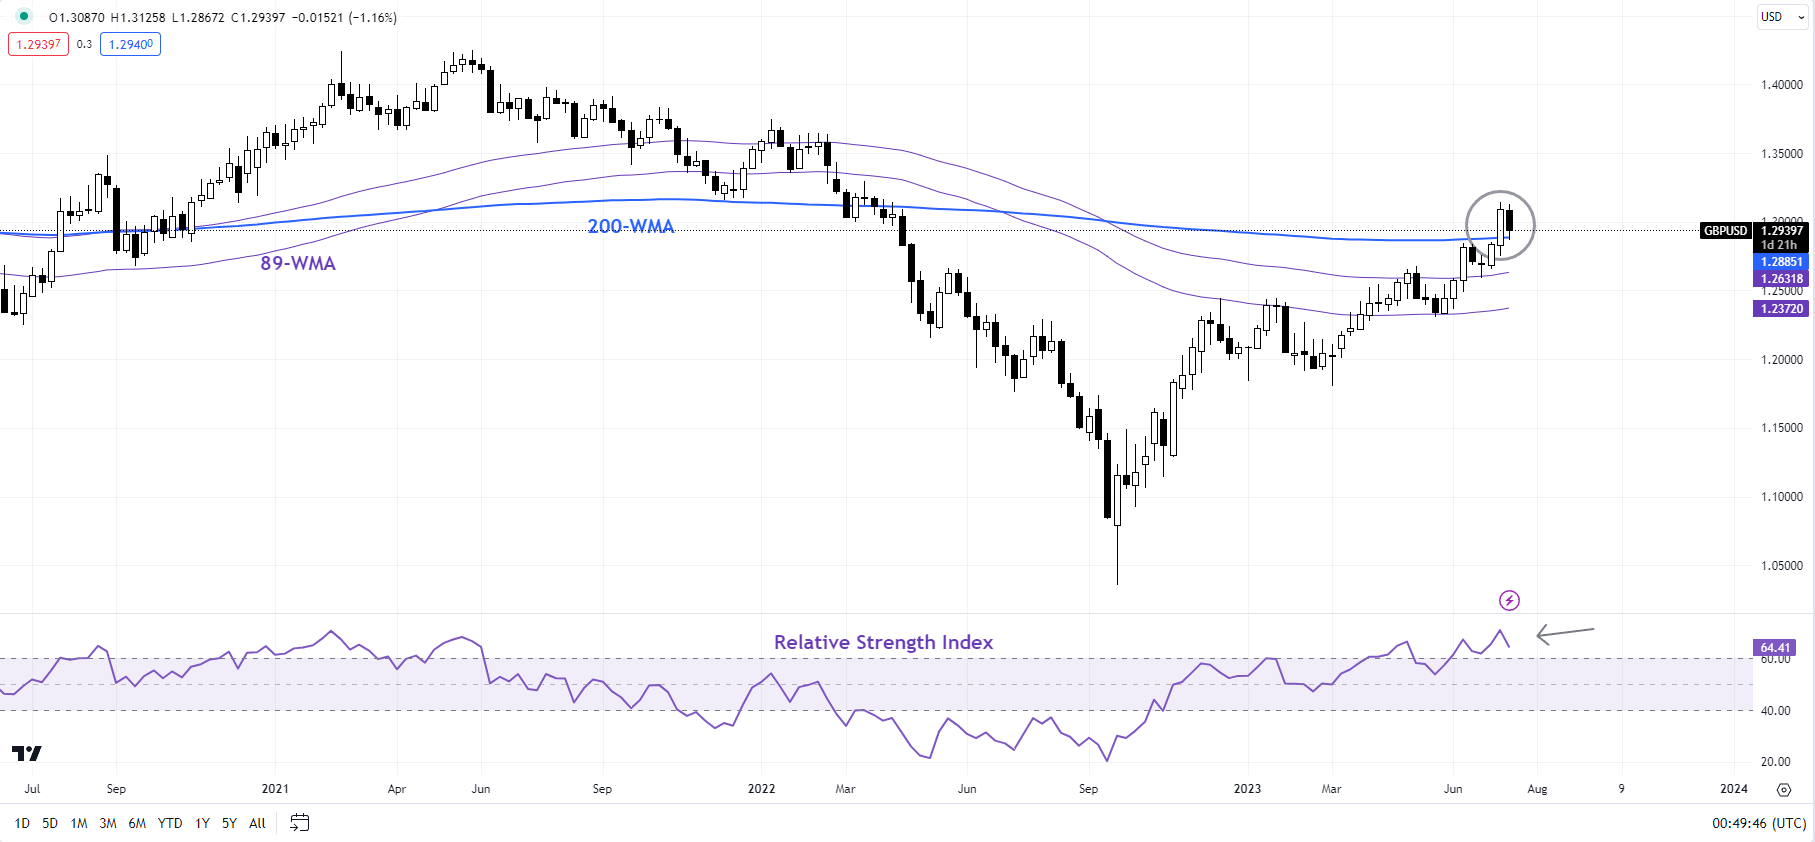
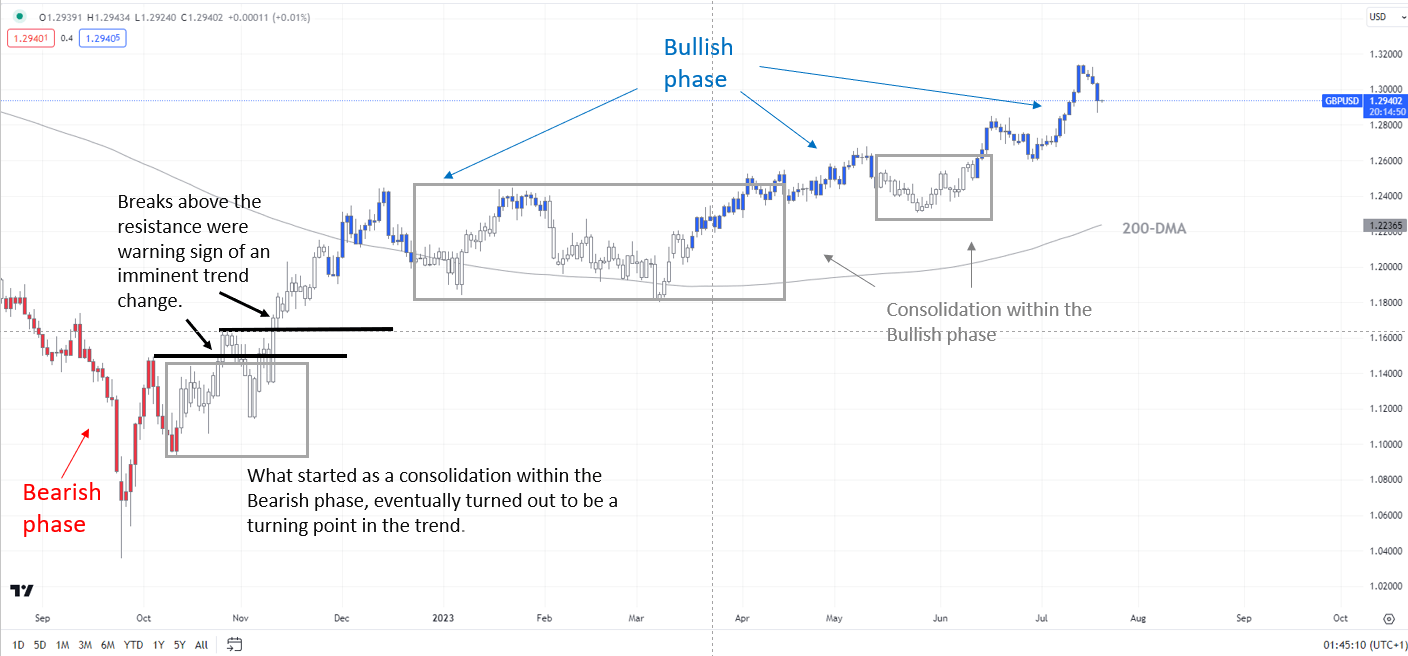
From a trend perspective, GBP/USD broader trend remains up, as the colour-coded daily candlestick charts show. However, overbought conditions coupled with stretched speculative long positioning (around the highest level since 2014) raise the risk of some consolidation given the pair has run into stiff resistance on the 200-week moving average.

GBP/USD Daily Chart

image2.png

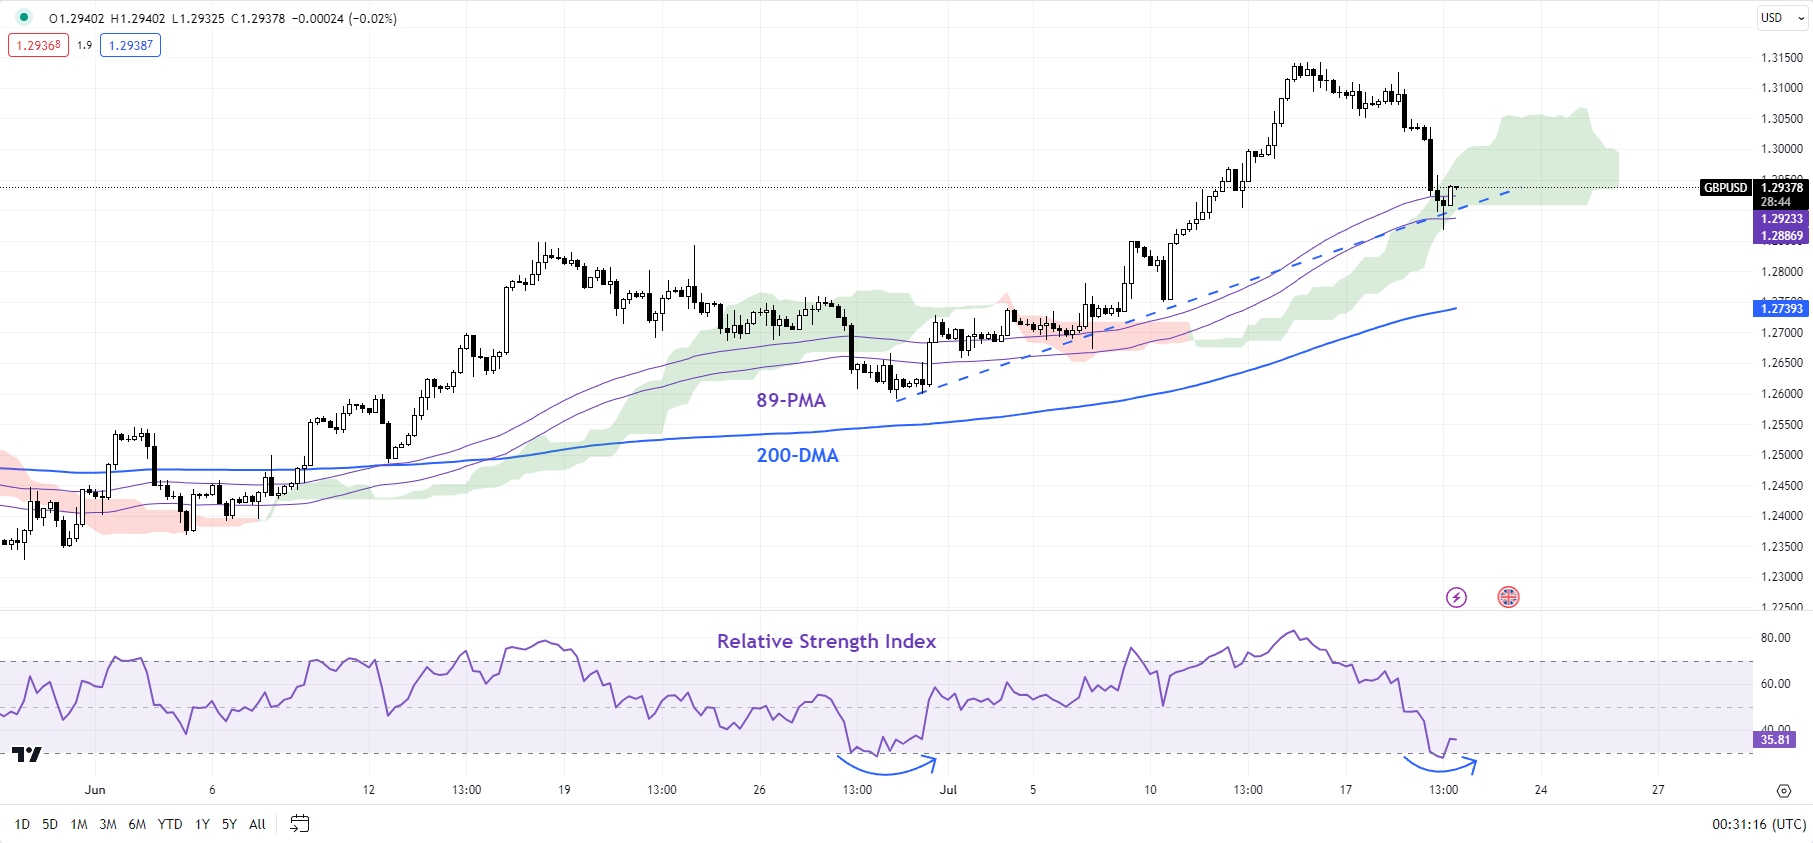
For now, though, GBP/USD has quite a strong cushion on the 89-period moving average, roughly coinciding with an uptrend line from the end of June. Any break below would confirm that the short-term upward pressure had faded, potentially opening the gates toward the end-June low of 1.2600.

GBP/USD 240-minute Chart

image3.png

Beyond the daily timeframe, from a medium-term perspective, the rise this month to a one-year high in May confirmed the higher-tops-higher-bottom sequence since late 2022, leaving open the door for some medium-term gains. (see “British Pound Buoyant Ahead of BOE: How Much More Upside?”, published May 8).

EUR/GBP Daily Chart

image4.png

EUR/GBP: Minor double-bottom triggers

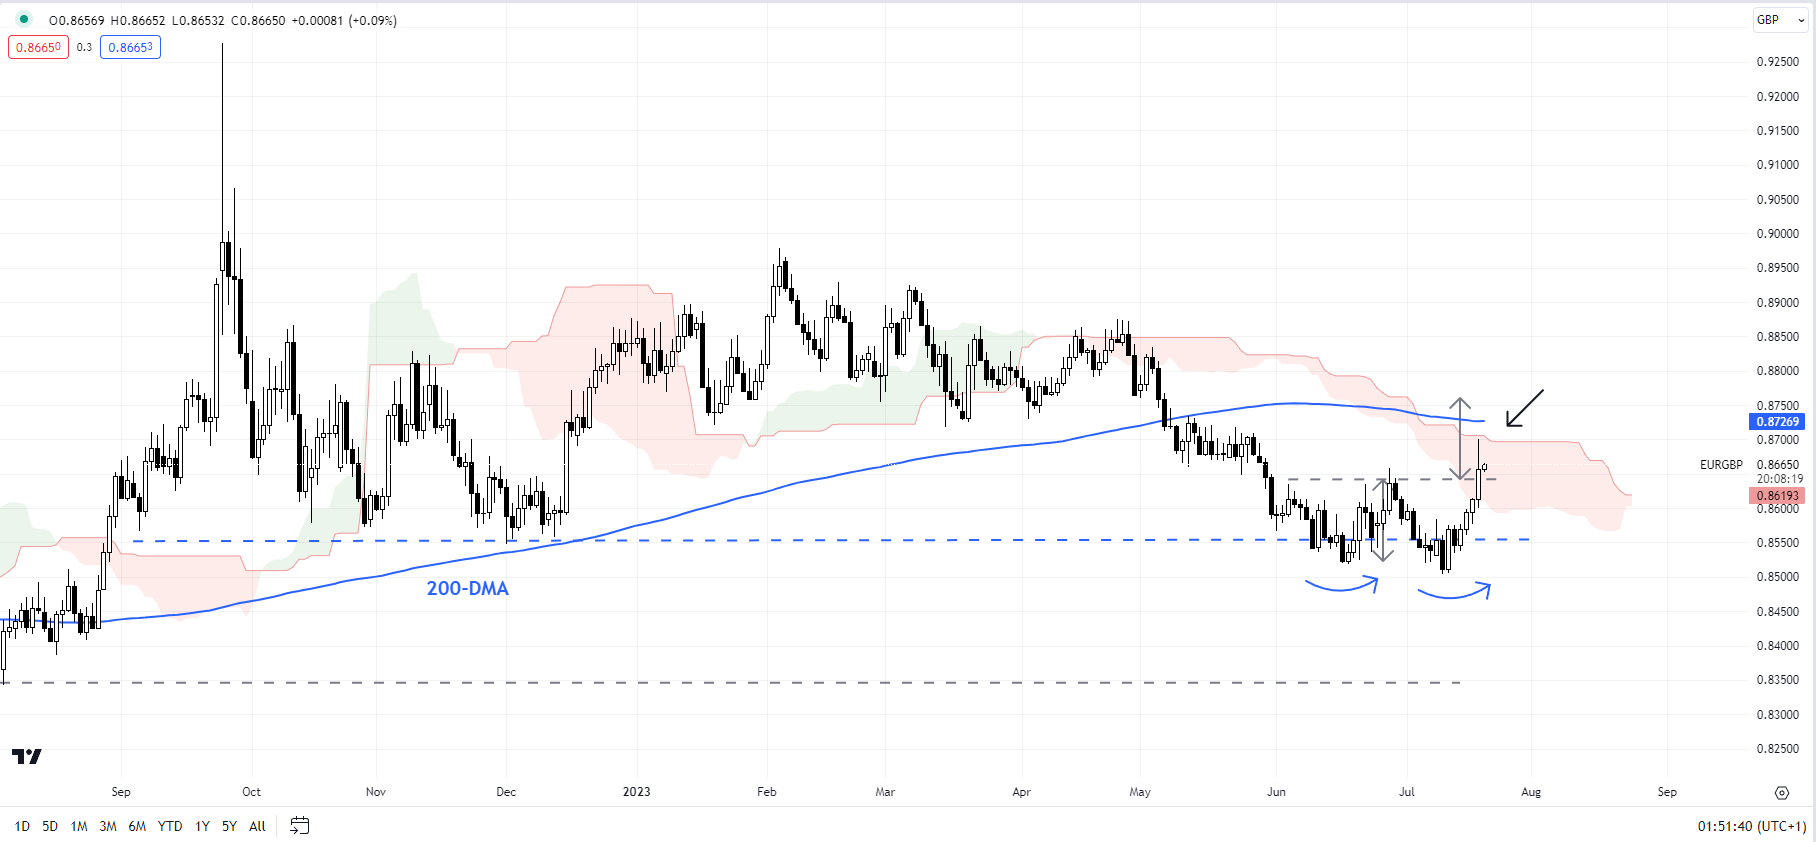
EUR/GBP’s rise above the end-June high of 0.8635 has triggered a minor double bottom (the June low and the early-July low) – as highlighted in the previous update. See “British Pound Ahead of UK CPI: GBP/USD, EUR/GBP, GBP/JPY Price Action,” July 18. The bullish break has opened the door toward stiff resistance on the 200-day moving average (now at about 0.8730). Earlier, EUR/GBP’s decline stalled in recent weeks around key support at the December low of 0.8545.

GBP/AUD Daily Chart

image5.png

GBP/AUD: Upward momentum is fading for now

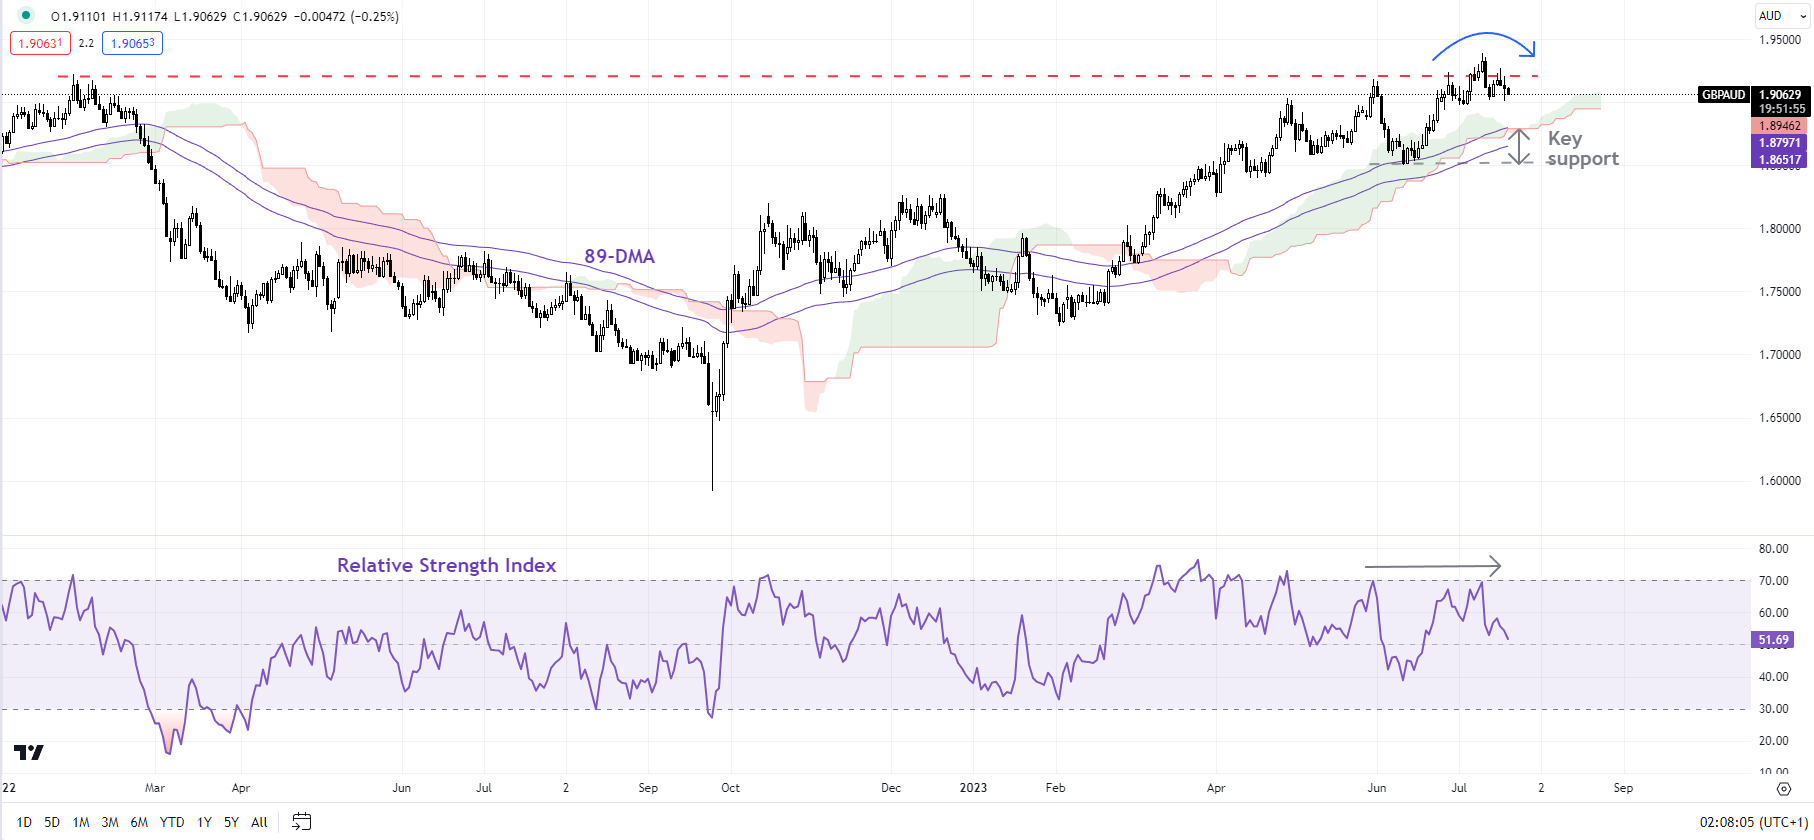
A negative momentum divergence (rising price associated with a stalling in the 14-day Relative Strength Index) suggests GBP/AUD’s rally is losing steam as it tests a vital ceiling on a horizontal trendline from 2021, at about 1.9200. Chances are the cross could consolidate with a downward bias in the near term. Any break below the immediate cushion around the June low of 1.8500 would indicate that the short-term upward pressure had faded, potentially opening the door toward the 200-day moving average (at about 1.8230).

Note: The above colour-coded chart(s) is(are) based on trending/momentum indicators to minimize subjective biases in trend identification. It is an attempt to segregate bullish Vs bearish phases, and consolidation within a trend Vs reversal of a trend. Blue candles represent a Bullish phase. Red candles represent a Bearish phase. Grey candles serve as Consolidation phases (within a Bullish or a Bearish phase), but sometimes they tend to form at the end of a trend. Candle colors are not predictive – they merely state what the current trend is. Indeed, the candle color can change in the next bar. False patterns can occur around the 200-period moving average, around a support/resistance, and/or in a sideways/choppy market. The author does not guarantee the accuracy of the information. Past performance is not indicative of future performance. Users of the information do so at their own risk.

Crude Oil Steadies as Markets Assess US Dollar Direction. Will WTI Regain High Ground?

Crude Oil Steadies as Markets Assess US Dollar Direction. Will WTI Regain High Ground?

WTI crude oil is holding ground so far today just below US$ 78.50 after slipping overnight despite the news that crude stockpiles had fallen by less than anticipated.

Other energy products saw notable decreases in demand, particularly for gasoline.

The US Energy Information Agency (EIA) data revealed that crude inventory levels fell by 708k barrels for the week ended July 14th, rather than forecasts of 2.44 million barrels.

Wheat has continued higher into Thursday’s session after large gains in the last few days. It comes after Russia stepped up its rhetoric of taking action to shut Ukrainian ports for grain exports.

They have now said that vessels entering the Black Sea would be considered to be carrying armaments.

Spot gold has nudged higher, trading at its highest level in 7-weeks with the US Dollar generally weaker across the board.

The Australian Dollar got an extra shot in the arm as it shrugged off recent bearishness, sailing over 68 cents after the unemployment rate dropped again to 3.5% in June, below forecasts of 3.6%.

The Peoples Bank of China (PBOC) refrained from cutting the rate on the 1- and 5-year loan prime rate today, keeping them at 3.55% and 4.20% respectively.

Speculation continues to swirl that Beijing will look to do more stimulus measures as they try to reignite their economy. Actions have so far struggled to add any positivity toward the Middle Kingdom.

APAC equities markets are mixed with little movement except for Japanese stocks. They are down on the day with the Nikkei 225 down over 1% at the time of going to print.

Wall Street futures are pointing to a sluggish start to the cash session there after Tesla and Netflix reported mixed results.

Treasury yields have steadied after sliding lower through the early part of this week with the benchmark 10-year bond inching above 3.75%.

Looking ahead, US jobs data will hold the market’s attention as well as home sales figures.

WTI CRUDE OIL TECHNICAL ANALYSIS

The WTI contract continues to see range trading conditions although there has been some short-term volatility this week.

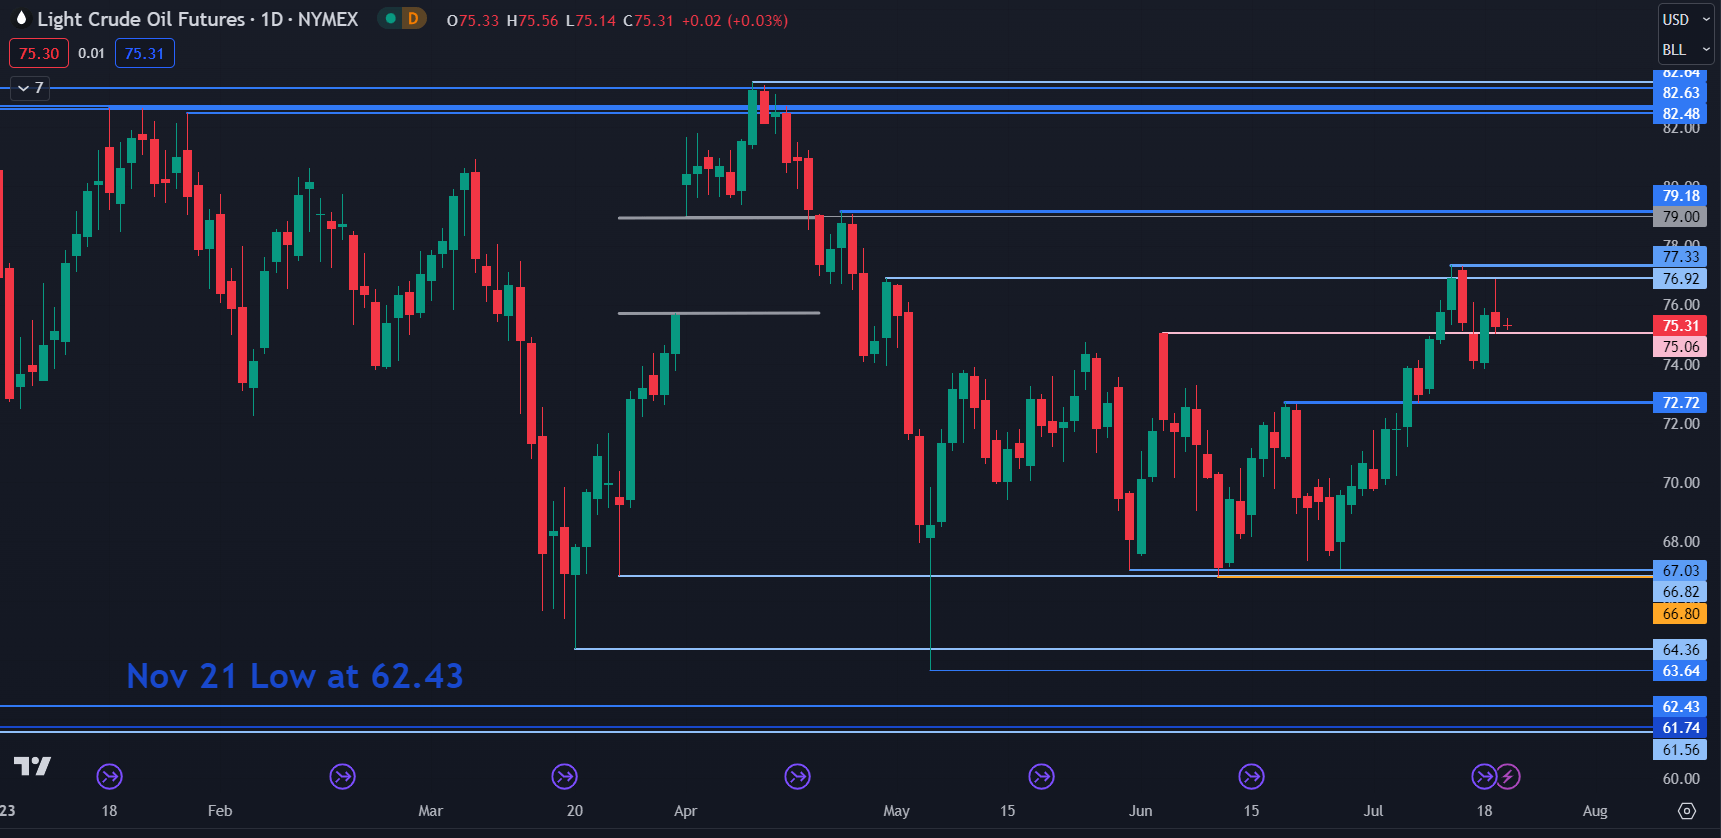
The price remains contained within 66.80 – 77.33 for 11 weeks. Looking at the bigger picture, it has traded between 63.64 and 83.53 since last November.

With this in mind, previous highs and lows might provide resistance and support respectively.

On the downside, support may lie at the breakpoint near 75.00 and 72.72 or the prior lows of 67.03, 66.82, 66.80, 64.36, 63.64 or at the November 2021 low of 62.43.

On the topside, resistance could be at 76.92 and 79.18 ahead of a cluster of breakpoints and prior peaks in the 82.50 – 83.50 area.

image1.png