Crude Oil Holds the High Ground as US Jobs Data Lights Up. Higher WTI?

Crude Oil Holds the High Ground as US Jobs Data Lights Up. Higher WTI?

Crude oil is bumping up against the top end of the recent range going into Friday’s session as robust US data lifted the outlook for economic activity in the world’s largest economy.

Stockpiles of crude reported by the US Energy Information Agency (IEA) revealed a drop of 1.508 million barrels for the week ended June 30th against 983k barrels anticipated and 9.603 fewer barrels in the prior week.

Earlier in the week, the American Petroleum Institute (API) inventory report showed a decrease of 4.382 million barrels for the same week. The shrinking reserves may hint toward a US economy continuing to thrive in the face of the Federal Reserve’s tightening measures.

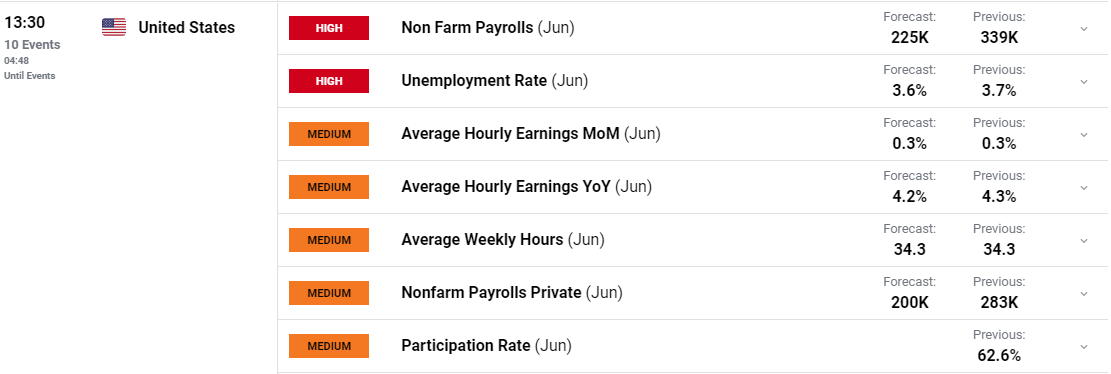
Compounding this perspective was the ADP National Employment Report that showed 497k non-farm private jobs were added in June, well above estimates of 228k.

Later today, the market will be focussing on the US Bureau of Labour Statistics non-farm payroll figures. A Bloomberg survey of economists estimates that 230k jobs were added last month.

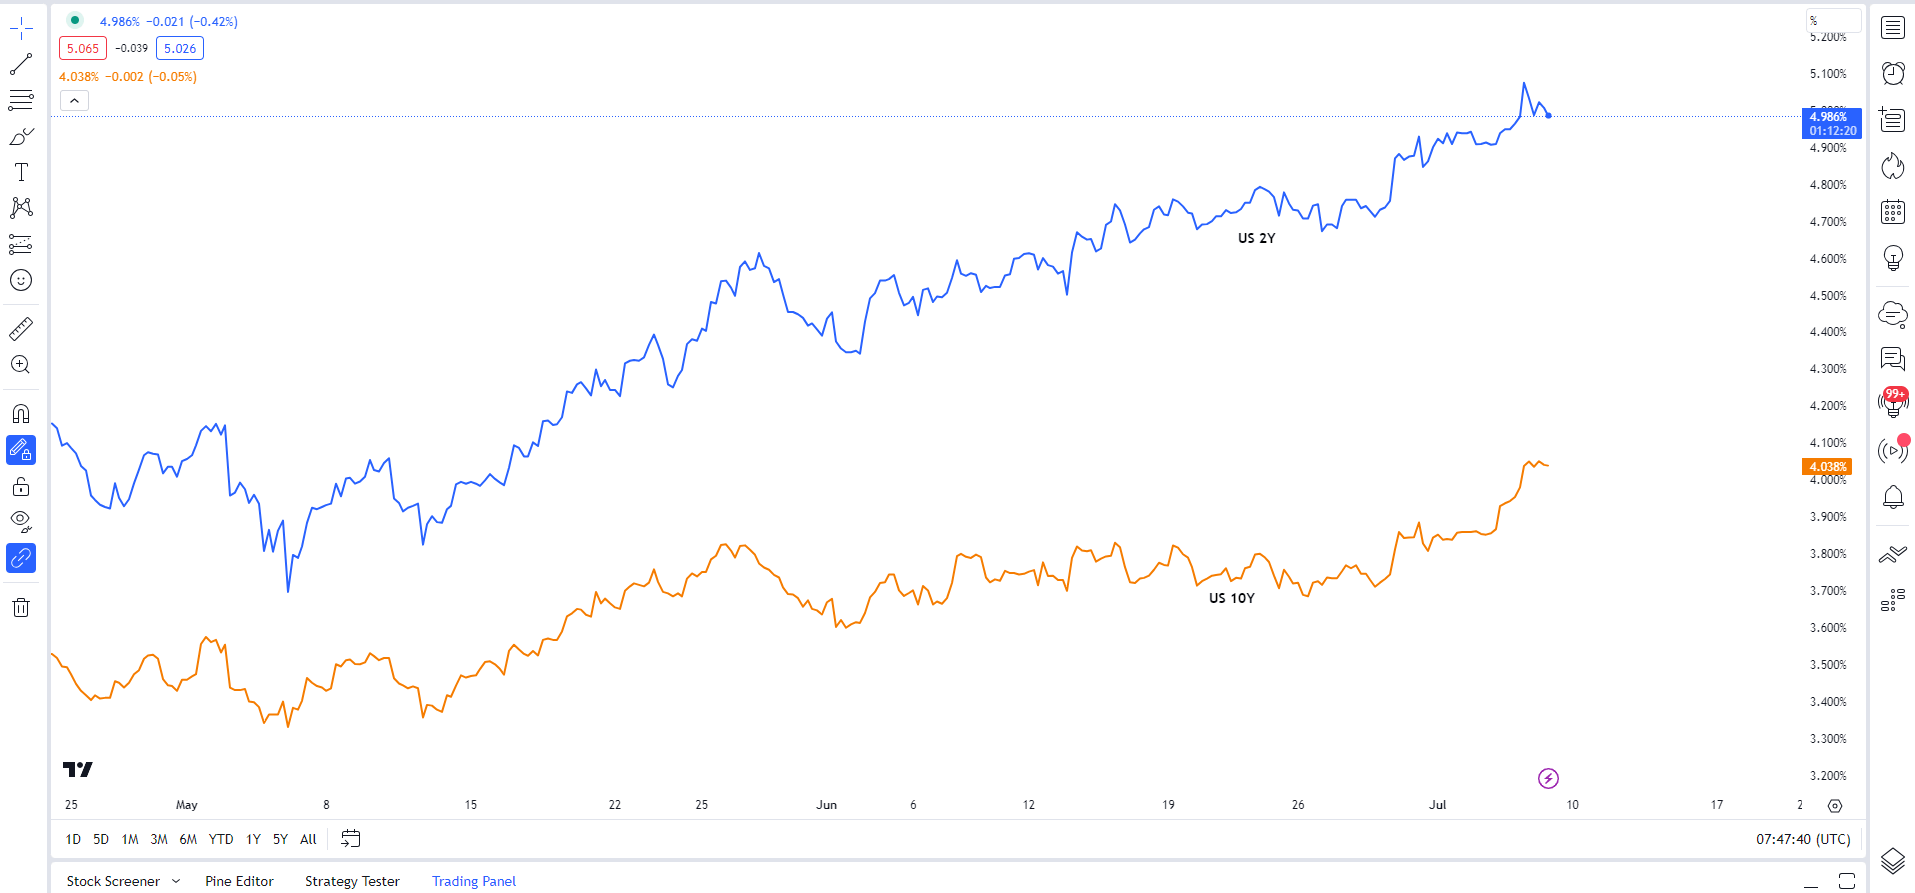
All this positive news saw Treasury yields marching higher again with the benchmark 10-year bond trading back above 4%.

The vigour in the labour market lifted the prospect of a more hawkish Fed at their meeting on the 26th of July. Wall Street finished lower in its cash session and APAC equity indices followed the lead with a sea of red across the region.

The growth-linked currencies of AUD, CAD and NZD are struggling going into the end of the week. Spot gold is also eyeing a 4-month low, trading near US$ 1,910 at the time of going to print.

After US non-farm payrolls data, ECB President Christine Lagarde will be speaking.

The full economic calendar can be viewed here.

WTI CRUDE OIL TECHNICAL ANALYSIS

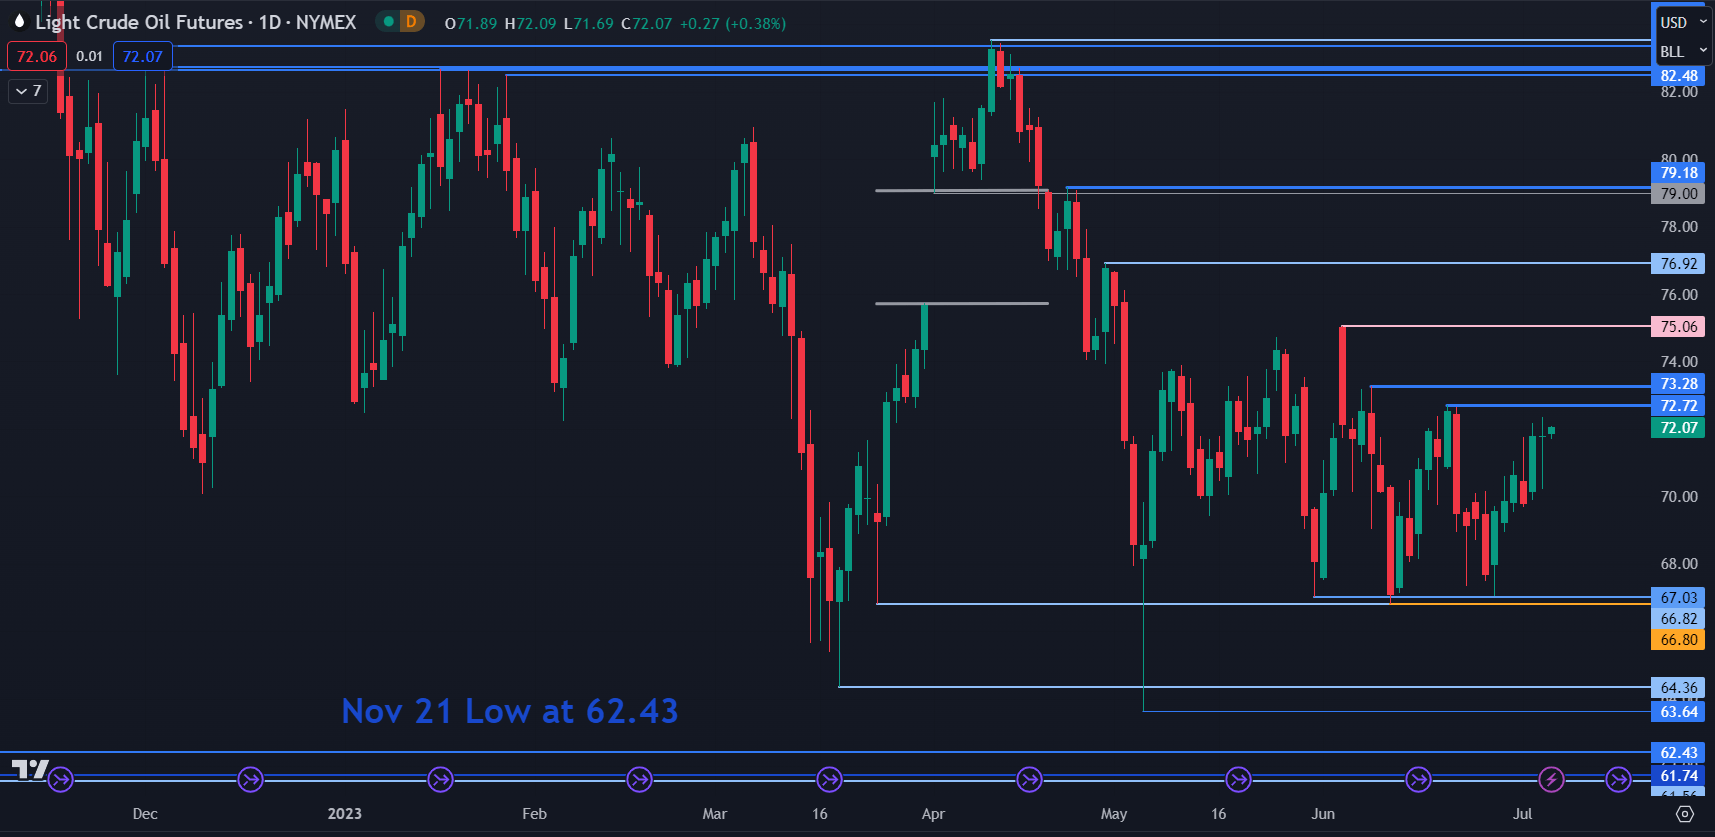
WTI crude continues to see range trading conditions with the price contained within 66.80 – 75.06 for more than 2 months. More broadly, it has traded between 63.64 and 83.53 since last November.

With this in mind, previous highs and lows might provide resistance and support respectively.

On the downside, support may lie at 67.03, 66.82, 66.80, 64.36, 63.64 or at the November 2021 low of 62.43.

On the topside, resistance could be at 72.72, 73.28, 75.06, 76.92 and 79.18 ahead of a cluster of breakpoints and prior peaks in the 82.50 – 83.50 area.

image1.png


Gold (XAU/USD) Prices at Risk of Freefall Heading Into NFP Day

Gold (XAU/USD) Prices at Risk of Freefall Heading Into NFP Day

US Yields Rise, Red-Hot ADP Data, NFP Ahead

Gold prices continued their recovery in the Asian session following another day probing the key $1900/0z psychological level. Yesterdays red hot data out of the US facilitated the push toward the $1900 but failing to find acceptance below once more.

US ISM services and ADP data yesterday provided further signs of the resilience of the US economy despite growing calls that a recession is on its way. Following the release market participants understandably adopted a more hawkish outlook on the potential path of the Federal Reserve on the rate hike front. Money market pricing in the immediate aftermath were pricing in roughly 36bps of hikes by November, up from the 28bps ahead of the data releases.

US Yields spiked higher in the aftermath of the data further weighing on gold prices as the US 2Y Yield briefly traded around the 5.12% mark, the highest since 2007. Despite this however the Dollar for some reason continues to struggle to hold onto gains with whipsaw price action seeming to be the case post data releases.

US 2Y and 10Y Yields

image1.png

Heading into today’s NFP and US jobs data, Gold bears will no doubt be hoping for another forecast beating print to finally inspire a sustained push below the $1900/oz handle. Another positive release for the US economy would undoubtedly see an increase in rate hike bets from market participants and facilitate another spike in both US Yields as well as the Dollar Index (DXY). This would in turn drag Gold prices lower and ensure a 4th successive week of losses for the precious metal.

image2.png

TECHNICAL OUTLOOK AND FINAL THOUGHTS

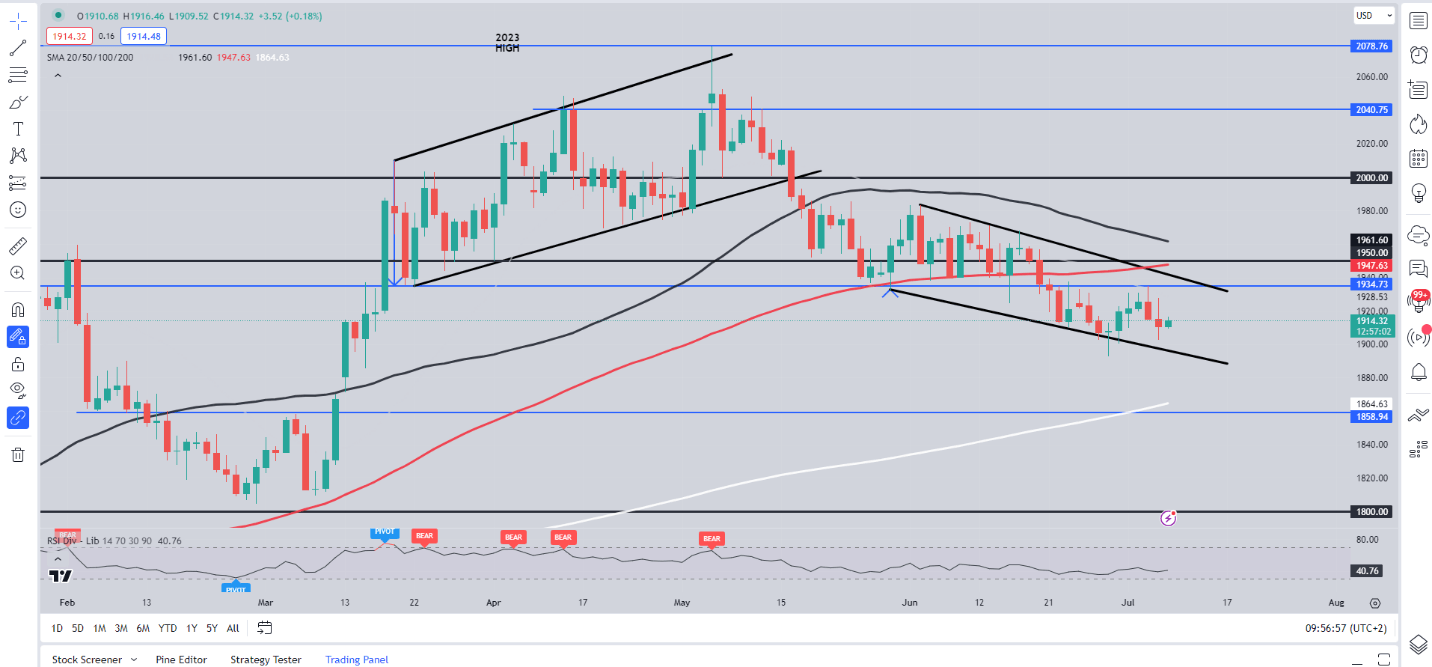
Form a technical perspective, Gold prices remain in a range between the $1890 and $1940 levels with the $1934 proving a tough nut for bulls to crack this week. Gold is currently trading in a bullish flag pattern if you will, which in theory preceded a bullish breakout. However, given the macro picture in play and the expectation of another positive NFP print, a downside breakout begins to look more appealing.

A daily candle close below the $1900 psychological level may finally see Gold make a long-awaited retest of the 200-day MA currently resting around the $1864 handle before a retest of the key $1850 support level comes into focus.

Gold (XAU/USD) Daily Chart – July 7, 2023

image3.png

IG CLIENT SENTIMENT DATA

Taking a look at the IG client sentiment data and we can see that retail traders are currently net LONG on Gold with 74% of traders holding long positions (as of this writing). At DailyFX we typically take a contrarian view to crowd sentiment meaning we could see Gold prices continue to decline following a short upside rally.

How to Trade Forex News: An Introduction

How to Trade Forex News: An Introduction

Major economic data has the potential to drastically move the forex market. It is this very movement, or volatility, that most newer traders seek when learning how to trade forex news. This article covers the major news releases, when they occur, and presents the various ways traders can trade the news.

Why Trade the News on Forex?

Traders are drawn to forex news trading for different reasons but the biggest reason is volatility. Simply put, forex traders are drawn to news releases for their ability to move forex markets. ‘News’ refers to economic data releases such as GDP and inflation, and forex traders tend to monitor such releases considered to be of ‘high importance’.

The largest moves tend to follow a ‘surprise’ in the data – where the actual data contrasts what was expected by the market – the good news here is that you don’t have to hold a PhD in Economics because our economic calendar already provides economist expectations.

Furthermore, news releases are set at pre-determined dates and times allowing traders enough time to prepare a solid strategy.

Traders that can effectively manage the risks of volatility, at the predetermined time of the news release, are well on their way to becoming consistent traders.

The Impact of Major News Releases on the Forex market

Just before a major news release, it is common to witness lower trading volumes, lower liquidity and higher spreads, often resulting in big jumps in price. This is because large liquidity providers, much like retail traders, do not know the outcome of news events prior to their release and look to offset some of this risk by widening spreads.

While large price movements can make trading major news releases exciting, it can also be risky. Due to the lack of liquidity, traders could experience erratic pricing. Such erratic pricing has the potential to cause a huge spike in price that shoots through a stop loss in the blink of an eye, resulting in slippage.

Additionally, the wider spread could place traders on margin call if there isn’t enough free margin to accommodate this. These realities surrounding major news releases could result in a short trading career if not managed properly through prudent money management such as incorporating stop losses or guaranteed stop losses (where available).

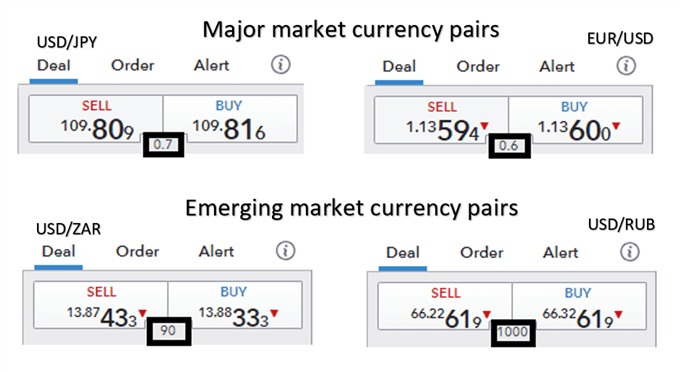
In general, major currency pairs will have lower spreads than the less traded emerging market currencies and minor currency pairs. Therefore, traders may look to trade the majors EUR/USD, USD/JPY, GBP/USD, AUD/USD and USD/CAD to mention a few.

General forex spreads between majors and emerging markets

Traders need to be well prepared ahead of time – with a clear idea of what events they want to trade and when they occur. It’s also important to have a solid trading plan in place.

“Don’t think about what the market’s going to do; you have absolutely no control over that. Think about what you’re going to do if it gets there. In particular, you should spend no time at all thinking about those rosy scenarios in which the market goes your way, since in those situations, there’s nothing more for you to do. Focus instead on those things you want least to happen and on what your response will be.” – William Eckhardt

Which Major Forex News Releases to Trade?

When learning how to trade news, traders must be aware of the major news events that affect the forex market, that can be monitored closely using an economic calendar.

US economic data is so influential within global currency markets that it is generally seen as the most important news. It is important to note that not all news releases lead to increased volatility. Rather, there are a limited number of major news releases that have previously produced the greatest potential to move the market.

The table below summarizes the major US economic releases alongside some of the most important non-US data releases from around the world.

Major news releases (US and rest of world):

Economic data release Time (EST) Description
Non-farm payrolls (NFP) 8:30am – monthly release (first Friday after the month ends) Represents the net changes in employment jobs
US Gross domestic product (GDP) 8:30am – quarterly release Gauges the monetary value of all goods and services produced within the US over a specified period
US Federal Reserve Bank Federal funds rate 1:00pm – scheduled 8 times a year Interest rate at which depository institutions lend and borrow to other institutions, overnight
Australian cash rate 10:30pm (First Tuesday of the month except January) Interest rate charged on overnight loans between financial intermediaries
Australian employment change 7:30pm – monthly release (about 15 days after month ends) Change in number of employed people during the previous month
European Central Bank refinancing rate 7:45am – 8 times a year Interest rate on the main refinancing operations offering liquidity to the financial system
Bank of England official bank rate 7:00am – monthly release Interest rate that the BOE lends to financial institutions (overnight)
Bank of Canada overnight rate 10:00am – 8 times a year Overnight rate that major financial institutions borrow and lend between themselves
Canadian employment change 8:30am – monthly (about 8 days after month ends) Measures the change in the number of employed people in the previous month
Reserve Bank of New Zealand official cash rate 9.00pm – scheduled 7 times a year Interest rate at which banks borrow and lend to other banks, overnight

Key Tools & Resources to Trade Forex News

DailyFX provides a one-stop-shop for all your forex related data and news releases:

  • Economic calendar: Know when major data like the US Non-Farm-Payroll, GDP, ISM, PPI and CPI figures are due to be released.
  • Central Bank Calendar: Central Bank interest rate decisions can have profound effect on the financial markets. Get to know when they are scheduled.
  • Real time news feed: Stay up to date with breaking news, as it happens, with updates from our top analysts. Similarly, get all the major stories of the day plus analysis by following our market news.

Managing risk when trading news and events

The importance of prudent risk management cannot be overstated during volatile periods that follow a news release.

The use of stops is highly recommended but in this case, traders may want to consider using guaranteed stops (where available) over normal stops. Guaranteed stops do come with a fee so be sure to check this with your broker; however, this fee can oftentimes end up being insignificant in relation to the amount of slippage that can occur in such volatile periods.

Additionally, traders should also look to reduce their normal trade size. Volatile markets can be a trader’s best friend but also have the potential to reduce account equity significantly if left unmanaged. Therefore, in addition to placing guaranteed stops, traders can look to reduce their trade sizes to manage the emotions of trading.

3 Approaches to forex news trading

There are a number of approaches traders can adopt when developing a forex news trading strategy which depend on the timing of the trade relative to the news release.

Many traders like to trade in the moment and make decisions as and when an announcement happens – using an economic calendar to plan ahead. Others prefer to enter the market in less volatile conditions ahead of a release or announcement. To summarize, forex news trading fits into one of the categories below:

  1. Trading before the news release
  2. Trading on the news release
  3. Trading after the news release

1. Trading before the news release  

Trading forex news before the release is beneficial for traders looking to enter the market under less volatile conditions. In general, traders who are more risk averse gravitate towards this approach looking to capitalize on the quieter periods before the news release by trading ranges or simply trading with the trend. Discover strategies on how to trade before the news release.

2. Trading during a release

These forex news trading strategies are not for the faint hearted as it involves entering a trade as the news breaks or in the moments that immediately follow. This is at a time when the market is at its most volatile which underscores the importance of having a clear strategy and well-defined risk management. Equip yourself with strategies to navigate the volatility associated with forex news trading at the release.

3. Trading after the news release

Trading post-release involves entering the trade after the market has had some time to digest the news. Often the market, through price action, provides clues on its future direction – presenting traders with great opportunity. Learn how to trade the news when the market is in transition with our article on trading after the news release.

Emerging Asia Bonds, Currencies Have Lost Their Traditional Link

Emerging Asia Bonds, Currencies Have Lost Their Traditional Link

Asia’s emerging-market currencies are losing their traditional close relationship to local bonds as falling hedging costs means more investors are choosing to offset their foreign-exchange risks.

The correlation is also breaking down as China’s gloomy outlook weighs on Asian currencies, while having little impact on regional debt markets.

The average 90-day correlation between a basket of emerging Asian currencies and government bond yields has fallen to 0.1 from 0.42 at the end of last year, according to data compiled by Bloomberg. A level of 1 would mean the two move in lockstep.

The breakdown in the relationship shows why increasing inflows into Asia bonds this year are having only a limited spillover into the regional currency market. Cheaper hedging costs and growing expectations for rate cuts in Asia suggest currencies will remain under pressure for the rest of the year.

“It’s about relative interest rates,” said Galvin Chia, emerging-market strategist at NatWest Markets in Singapore. “Rates in the US have continued to rise with it being clear that the Fed’s disinflationary target has not yet been met, while rates in Asian economies have mostly remained lower, resulting in falling hedging costs.”


The cheaper cost of hedging is making it more attractive for global funds to offer dollars in exchange for Asian currencies. For example, three-month non-deliverable won forwards have dropped to minus 6 basis points — or 1.7 standard deviations below their five-year mean — from minus 2.9 basis points at the end of December.

The divergence between Asian bond yields and regional currencies can clearly be see in the case of Malaysia. Overseas investors bought $842 million of the nation’s debt in May, above the average net inflow of $388 million for the previous six months, according to the latest central-bank data. Still, the ringgit fell by more than 3% against the dollar in May, the worst-performing Asian currency.

The 90-day correlation between an index of Malaysian bond yields and the dollar-ringgit exchange rate has fallen to around 0.3 from more than 0.5 in December.

China Outlook

China’s deteriorating growth outlook is also weighing on the correlation between local yields and currencies.

The mainland economy has an outsized impact on Asian currencies via their trading links, especially the South Korean won, Taiwan dollar, Thai baht and Malaysian ringgit. It has less of an impact on regional bond yields, which are currently being driven by the trajectory of inflation.

Traders have recently boosted bets on interest-rate cuts in emerging Asia as inflation slows. Expectations for more easing will help pull down bond yields, but simultaneously weaken the allure of currencies as targets for carry trades.

UK construction output falls for first time in five months amid steep downturn in housing activity

UK construction output falls for first time in five months amid steep downturn in housing activity

UK construction companies signalled a renewed decline in business activity during June as a steep and accelerated downturn in house building weighed on overall workloads. Latest data also highlighted a reduction in new orders for the first time since January. On a more positive note, softer demand and fewer supply bottlenecks resulted in the sharpest improvement in delivery times for construction inputs since July 2009. This also contributed to an outright decline in purchasing prices for the first time in thirteen-and-a-half years. At 48.9 in June, down from 51.6 in May, the headline seasonally adjusted S&P

Asia Day Ahead: Little Surprise in Fed Minutes; Focus Now on US Jobs Data

Asia Day Ahead: Little Surprise in Fed Minutes; Focus Now on US Jobs Data

Wall Street posted modest declines overnight (DJIA -0.38%; S&P 500 -0.20%; Nasdaq -0.18%), following its return from the holiday break. Late last week, the Fear and Greed Index has reverted back to ‘extreme greed’ territory, which may point to near-term overextended price levels. That said, seasonality over the past 20 years remains in favour for a continuation of the upward trend, with the month of July delivering the second-highest average return and positive frequency across other months.

The Fed minutes came with not too much of a surprise, largely serving as a reinforcement for the Fed’s hawkish stance, which were presented in the series of Fedspeak beforehand. The additional colour is that ‘almost all’ Fed officials indicated that further tightening is likely, but settled at a pause at the previous meeting to buy time in assessing the lagged impact of current policies.

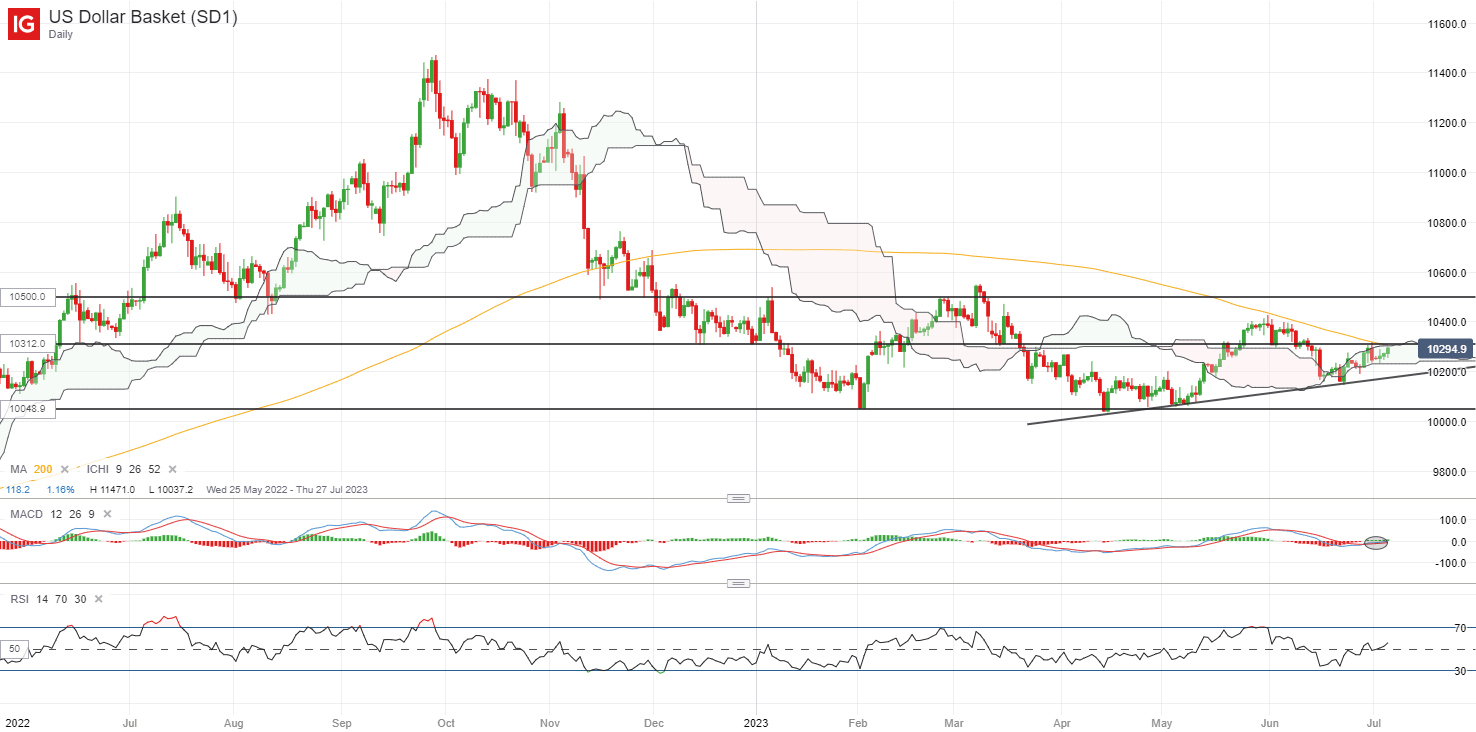
Rate expectations remain largely unswayed by the Fed minutes, with a continued lean towards an additional 25 basis-point rate hike after July to conclude the Fed’s hiking process. Nevertheless, US Treasury yields found their way higher, with the 10-year yields surging to a new three-month high. The US dollar received an uplift (+0.2%) overnight as well, seemingly headed back to retest the key 103.12 level of resistance once more. The formation of higher highs and higher lows since mid-June reflects buyers attempting to take back some control, while the RSI has defended its key 50 level thus far. Further upmove above the 103.12 level could place a retest of its May 2023 high in sight.

image1.pngAhead, the US ISM services PMI will be on the radar, which is expected to show a slight uptick to 51.0 following the surprise underperformance in May. With the Fed having their eyes on the core services ex-shelter prices, further signs of progress in the services sector’s prices data will provide more conviction for an impending rate pause. The lead-up to the US non-farm payroll report this week will also leave US job openings data in focus today, along with the initial jobless claims and ADP report. Any resilience on that front could point to strength in the US labour market which supports soft-landing hopes, but much will still revolve around a continued moderation in wage pressures, which will only be presented in the US non-farm report tomorrow.

Asian stocks look set for a negative open, with Nikkei -0.94%, ASX -0.63% and KOSPI -0.58% at the time of writing. Despite the stellar record of outperformance in the China’s Caixin services PMI since the start of the year (outperform 5 out of 6 occasions), the latest data has disappointed with a lower-than-expected read (53.9 versus 56.2 forecast). That joined the list of economic data pointing to a more lacklustre growth picture in the world’s second largest economy, which suggests more to be done in the second half of the year. The relatively quiet economic calendar in the region will leave Australia’s trade balance in focus ahead.

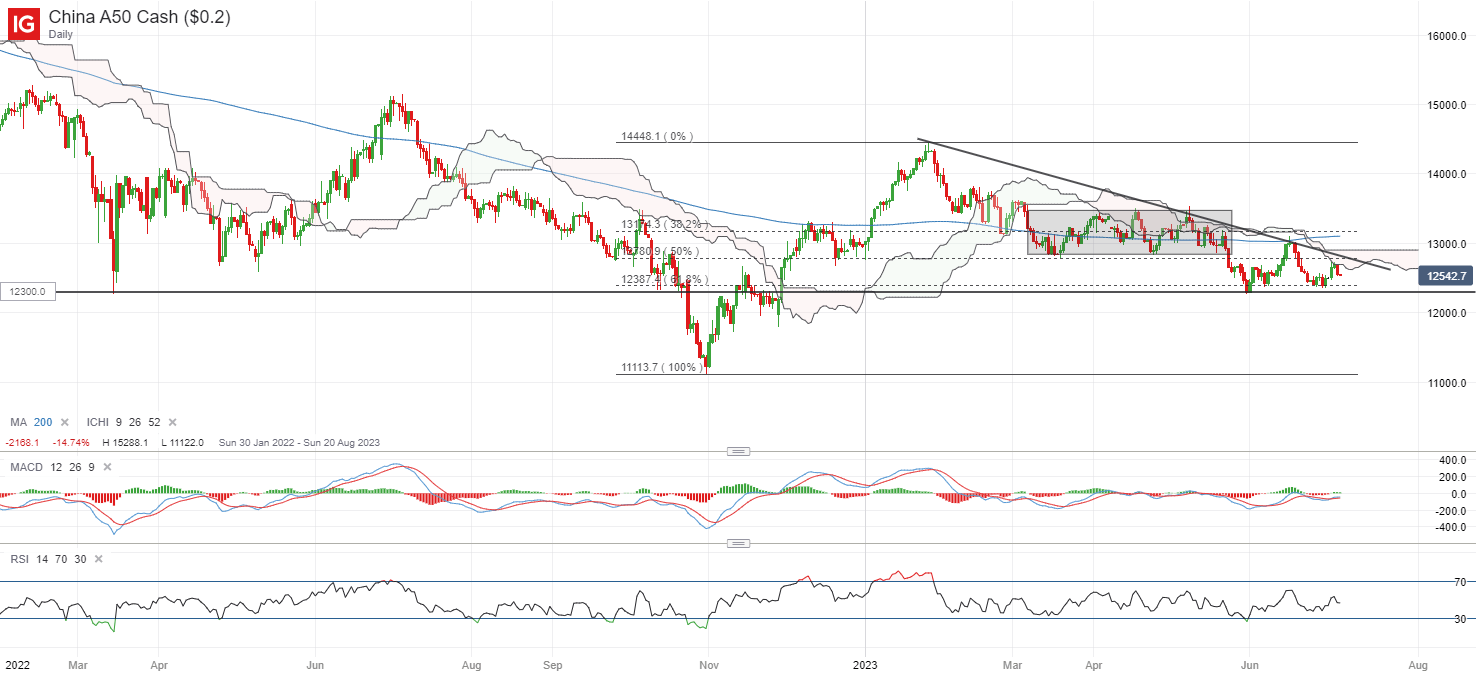
The China A50 index continues to show a downward trend in place thus far, trading on a series of lower highs and lows since the start of the year. On the upside, a downward trendline and Ichimoku cloud resistance seems to be in the way, with the RSI still hovering below the key 50 level. Further downside may leave the 12,300 level on watch as near-term support, with any failure to hold the level potentially paving the way towards the 11,700 level next.

image2.pngOn the watchlist: Gold prices continue to show signs of exhaustion

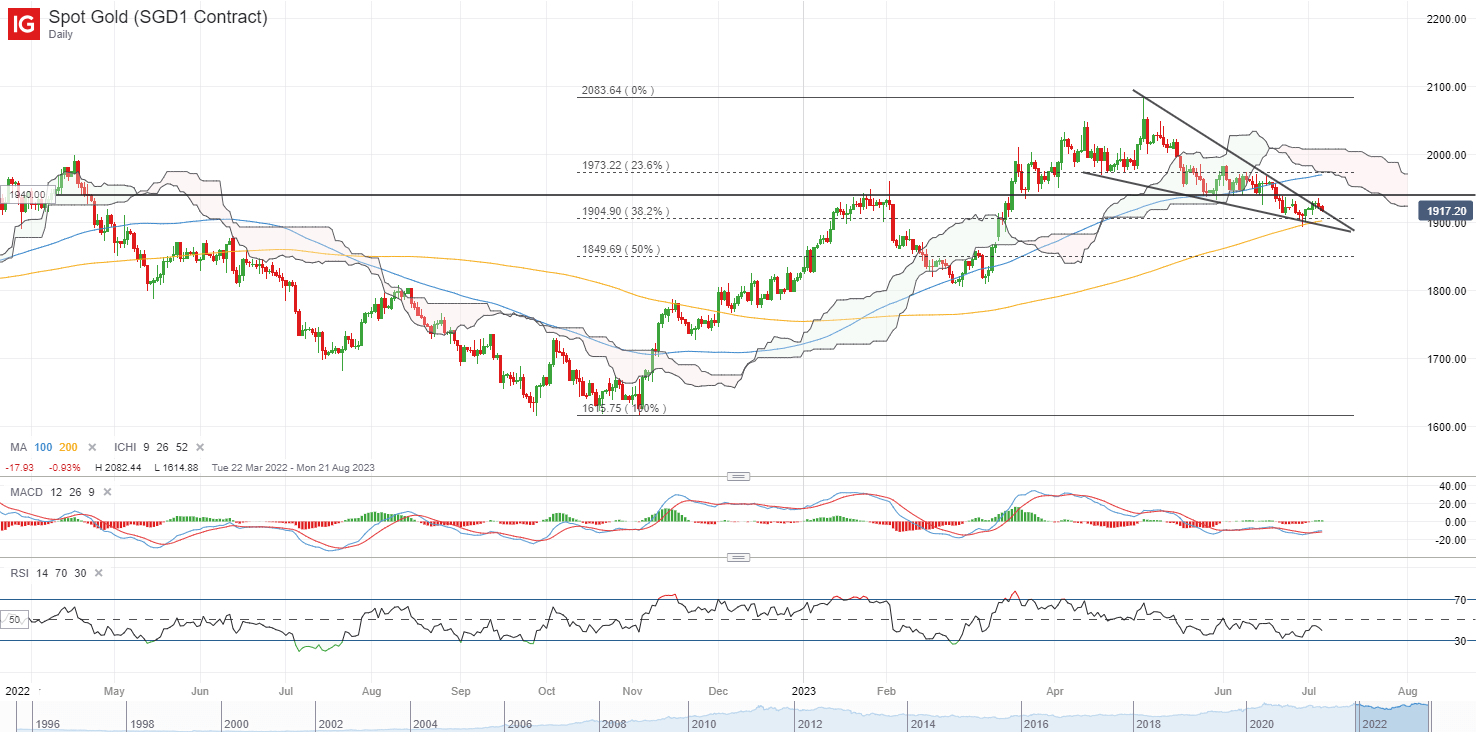
An upmove in US Treasury yields and a stronger US dollar has not been well-received by gold prices overnight, which failed to find much conviction for a move back above the US$1,940 level. Thus far, abating recession concerns have curtailed safe-haven flows, while rate expectations continue to price for rate cuts only in 2024, with the pushback in rate-cuts timeline compared to the start of the year driving some unwinding in gold from previous bullish build-up.

On the technical front, its RSI continues to hover below the key 50 level as a reflection of sellers in control, reinforced by a breakdown of previous key support confluence at the US$1,940. Further downside may leave the US$1,900 level on watch, where previous dip-buying drove the formation of a bullish pin bar last week on the daily chart. Failure to hold this level could pave the way to retest the US$1,850 level next.

image3.png

 
Crude Oil Holds the High Ground as US Jobs Data Lights Up. Higher WTI?

Crude Oil Price Firms on OPEC+ Intentions and API Data. Will WTI Break the Range?

Crude oil is firming going into Thursday’s trading session after notable gains overnight in the wake of the OPEC+ gathering in Vienna.

Saudi Arabia’s Energy Minister, Prince Abdulaziz bin Salman, said in reference to oil price stability, “we will do whatever is necessary, whatever it takes.”

Earlier in the week, the cartel announced that the current 1 million barrels per day cut would be extended beyond July and into August. Additionally, Russia would reduce its output by 500,000 barrels per day.

The squeeze on supply comes at a time when the outlook for global growth has become somewhat mired.

Further tightening of monetary conditions is expected across the Western world in the coming months, with the only notable exception being Japan, a major energy-importing nation.

The US Federal Reserve left rates on hold at its June meeting but is widely anticipated to raise them again at their meeting later this month.

The Federal Open Market Committee (FOMC) meeting minutes, released overnight, revealed that several board members were in favour of tightening policy.

The rhetoric from the European Central Bank (ECB) has also seen the market price in hikes there for the remainder of 2023.

The aim of bringing down inflationary price pressures might weigh on economic activity in many parts of the globe over the medium term.

Additionally, China’s attempts to reignite its economy continues to struggle to get off the ground with the Caixin services PMI missing estimates yesterday. It came in at 53.9 for June, rather than the 56.2 anticipated and 57.1 previously. The composite PMI was 52.5 against 55.6 prior.

The American Petroleum Institute (API) inventory report showed a decrease of 4.382 million barrels for the week ended June 30th which may have assisted in underpinning the oil price. The drop comes on the back of 2.408 million fewer barrels in the week prior.

The underlying structure of the WTI futures market appears to be unperturbed about the outlook for oil prices.

The OVX index is a measure of implied volatility for oil that is calculated in a similar way to the VIX index’s interpretation of volatility for the S&P 500. Oil volatility remains low and might indicate a lack of conviction for direction in price.

At the same time, the price difference between the front two futures contracts is near equilibrium, which may denote a degree of equilibrium in the market.

Furthermore, the RBOB crack spread has rolled over after trying to move higher last month. The RBOB crack spread is the gauge of gasoline prices relative to crude oil prices and reflects the profit margin of refiners.

RBOB stands for reformulated blendstock for oxygenate blending. It is a tradable grade of gasoline. If profitability for refiners continues to decrease, it may lead to less demand for the crude product. For now, it appears to be neither overly nor underly profitable for refiners.

If the market is in balance, more range trading for black gold could be in store. Updated crude oil prices can be found here.

WTI CRUDE OIL, CRACK SPREAD, BACKWARDATION/CONTANGO, VOLATILITY (OVX)

image1.png


USD/CAD Price Forecast: Loonie Strength to Come?

USD/CAD Price Forecast: Loonie Strength to Come?

CANADIAN DOLLAR FUNDAMENTAL BACKDROP

The Canadian dollar has enjoyed marginal gains against the USD over the first half of 2023 but recent weakness has brought the pair to a key inflection point. The greenback has gained favor after a more hawkish rhetoric from the Federal Reserve which was reiterated in yesterday’s FOMC minutes. The majority of participants eluded to further monetary policy tightening at some stage this year but with fundamental data slowing, data dependency will be more crucial than ever particularly in the case of inflation and jobs data.

Later today, the precursor to the US labor market will be released through the ADP and jobless claims release. Although history shows these figures have not been reliable as a gauge for the Non-Farm Payroll (NFP) print but will regardless provide some short-term volatility. The focal point for today will stem from the US ISM services PMI release due to the US being a primarily services driven economy. The measure has been on the decline of recent but forecasts do point to a slight improvement that could give the US dollar some support. Canadian PMI’s are also scheduled but will likely be overshadowed by the US print.

USD/CAD ECONOMIC CALENDAR (GMT +02:00)

image1.png

TECHNICAL ANALYSIS

USD/CAD DAILY CHART

image2.png

Daily USD/CAD price action places the pair within a rising wedge chart formation (dashed black line) with prices close to the apex point in line with the 1.3300 psychological level. With this in mind, a break below wedge support will be the natural course of action opening up subsequent support zones thereafter. A confirmation close above wedge resistance will invalidate the bearish pattern giving bulls a clear run up towards the 50-day moving average (yellow).

Key resistance levels:

  • 1.3407
  • 50-day moving average (yellow)
  • 1.3300

Key support levels:

  • Wedge support
  • 1.3263
  • 1.3226
  • 1.3200

IG CLIENT SENTIMENT DATA: BEARISH

IGCS shows retail traders are currently LONG on USD/CAD , with 68% of traders currently holding long positions (as of this writing). At DailyFX we typically take a contrarian view to crowd sentiment resulting in a short-term downside disposition.

Trading the London Session: Guide for Forex Traders

Trading the London Session: Guide for Forex Traders

The London trading session accounts for around 35% of total average forex turnover*, the largest amount relative to its peers. The London forex session also overlaps with the New York session throughout the year.

Key talking points in this article:

  • What time does the London forex market open?
  • Top three things to know about the London trading session
  • What currency pairs are the best to trade?
  • How to trade breakouts during the London session.

What time does the London forex market open?

The London forex market hours are from 3:00 AM ET to 12:00 PM ET. The London forex market session sees the most forex volume of all the forex market sessions.

Time in ET.

Open 3:00 AM
Close 12:00 PM
Overlap with Asia session 3:00 AM – 4:00 AM
Overlap with New York session 8:00 AM – 12:00 PM

Top 3 things to know about the London trading session

1. The London session is fast and active

The slower Tokyo market will lead into the London session, and as prices begin to move from liquidity providers based in the United Kingdom, traders can usually see increases in volatility.

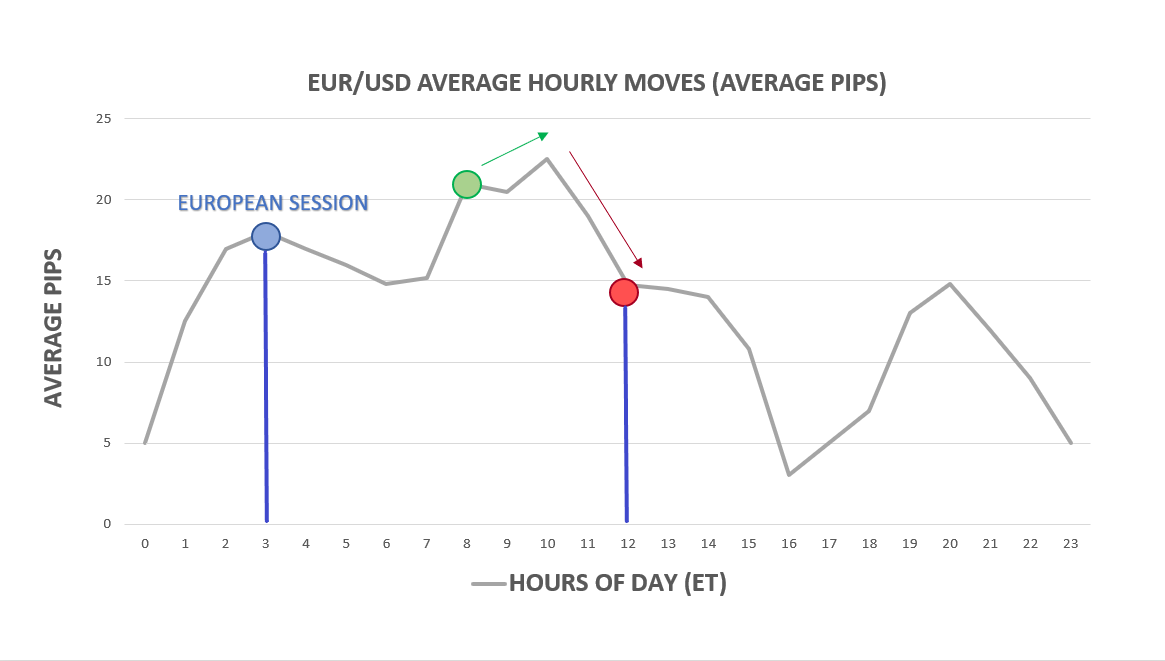
As prices begin to come in from London, the ‘average hourly move’ on many of the major currency pairs will often increase. Below is analysis on EUR/USD based on the time of day. Notice how much greater these moves are, on average, after the Asian session closes (Asia session closes at 3AM ET-blue dot):

Average hourly moves by hour of day in EUR/USD

Support and resistance may be broken much more easily than it would during the Asian session (when volatility is usually lower).

These concepts are central to the trader’s approach when speculating in the London Session, as traders can look to use this volatility to their advantage by trading breakouts. When trading breakouts, traders are looking for volatile moves that may continue for an extended period of time.

2. Look out for the overlap

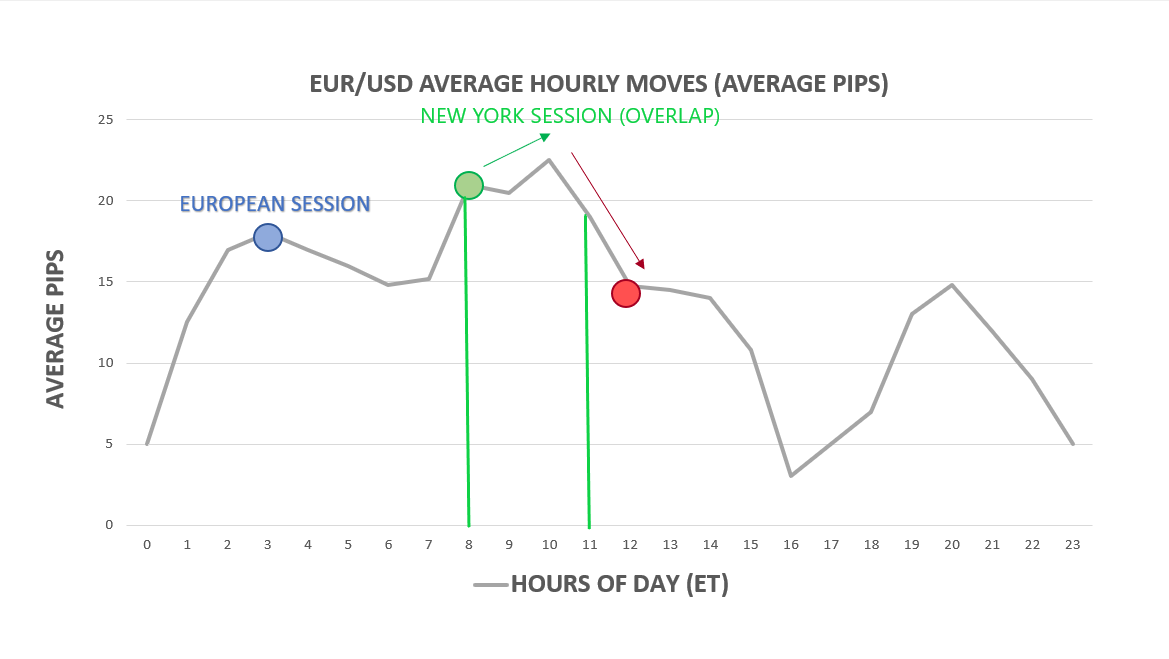
The ‘overlap’ is when the London and US sessions literally overlap each other (8AM ET to 12PM ET). These are the two largest market centers in the world, and during this four-hour period large and fast moves can be seen during the overlap as a large amount of liquidity enters the market.

When to trade the London-New York forex session overlap

As seen in the image above, the volatility increases to a maximum from 8:00 AM to 12:00 PM ET – when the London forex session overlaps with the New York forex session. To trade the overlap, traders can use a break-out strategy which takes advantage of the increased volatility seen during the overlap.

3. High liquidity

The London forex session is one of the most liquid trading sessions. Due to the high volume of buying and selling, major currency pairs can trade at extremely low spreads. Day traders looking to target short moves may be interested in finding trends and breakouts to trade so as to reduce the cost they pay in spread s.

What currency pairs are the best to trade during the London session?

There are no ‘best’ currency pairs to trade during London forex market hours, but there are currency pairs that will reduce in spread due to the high volume and allow traders cheaper spread costs.

These currencies include the major currency pairs like EUR/USD, USD/JPY, GBP/USD, and USD/CHF. The major currency pairs trade in extremely high volumes during the London forex session.

Currency pairs that are most affected by the overlap include the EUR/USD, USD/JPY, GBP/USD due to the inter-bank activities between the United States and Europe/London. If your trading strategy is better suited for volatility, then these are the trading pairs to watch because they will be flooded with liquidity and will move more on average during the overlap.

GBP Forecast

GBP Forecast
Recommended by David Bradfield
Check out our Pound forecast for expert GBP insight
Get My Guide

How to trade breakouts during the London Session

Trading breakouts during the London session using a London breakout strategy is much the same as trading breakouts during any other time of day, with the addition of the fact that traders may expect an onslaught of liquidity and volatility at the open.

When traders look to trade breakouts, they are often seeking firm support or resistance to plot their trades.

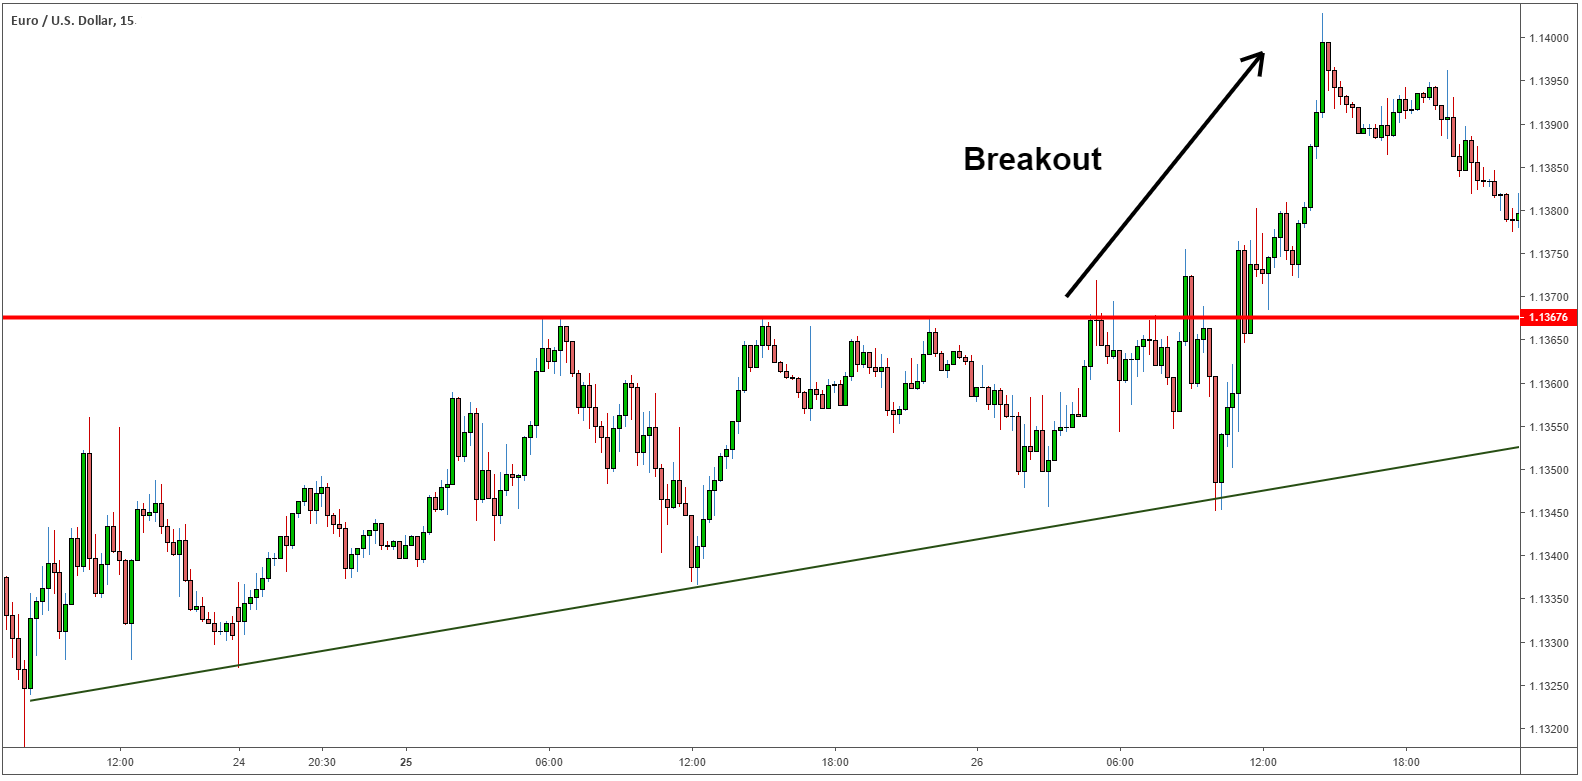
The chart below illustrates a rising wedge pattern, a trend line with a resistance level that is eventually broken- a breakout.

Rising wedge EUR/USD leading into a breakout during London session

The big benefit of this setup is risk management. Traders can keep stops relatively tight, with their stop-losses trailing close to the trend line. If the support/trend line does break, losses are limited, and if the strategy does prevail it could lead to a positive risk-reward ratio.

The increase in liquidity during the London session coupled with the increase in volatility makes potential breakouts much more likely.