Italian service sector growth continues to slow in June

Italian service sector growth continues to slow in June

Italy’s service sector continued to expand during June. However, amid reports that client uncertainty and increased interest rates were weighing on sales, activity rose at the slowest rate in four months. Confidence in the future remained positive, and firms took on extra staff though also at a slower rate compared to May. Disinflationary pressures were apparent as signalled by concurrent falls in input and output price inflation. The headline index from the report, the HCOB Italy Services PMI Business Activity Index recorded 52.2 in June. Although indicating another period of above trend growth, the index was down

GlobalDairyTrade auction results: Slip sliding away

GlobalDairyTrade auction results: Slip sliding away

Dairy auction prices fell sharply overnight continuing the downward trend that started in March 2022. While prices fell across all product categories, there were some marked differences. Key whole milk powder (WMP) prices were just a shade weaker, falling by just 0.4%. However, milk fat prices were sharply lower, with prices for butter and butter milk powder dropping by 10.3% and 11.4%, respectively. Meanwhile prices for cheddar cheese and skim milk powder dropped 3.1% and 6.0%. Although a significant drop, the result was still better than expected. We had expected WMP to fall by about 4%, with the futures market

USD/JPY Stuck in a Rut at Sub-145 as Intervention Risk Lingers

USD/JPY Stuck in a Rut at Sub-145 as Intervention Risk Lingers

It is a busier Tuesday session for the USD/JPY. The services sector was in the spotlight, with Services PMIs from China and Japan drawing interest.

Service sector activity in Japan slowed more than expected in June, with the PMI falling from 55.9 to 54.0 versus a prelim 54.2. Notably, demand conditions remained robust, with outstanding business rising at the second-fastest rate on record. While firms continued to report elevated inflationary pressures, input price inflation softened to a 15-month low.

Trading Derivatives carries a high level of risk to your capital and you should only trade with money you can afford to lose. Trading Derivatives may not be suitable for all investors, so please ensure that you fully understand the risks involved, and seek independent advice if necessary. A Product Disclosure Statement (PDS) can be obtained either from this website or on request from our offices and should be considered before entering into a transaction with us. Raw Spread accounts offer spreads from 0.0 pips with a commission charge of USD $3.50 per 100k traded. Standard account offer spreads from 1 pips with no additional commission charges. Spreads on CFD indices start at 0.4 points. The information on this site is not directed at residents in any country or jurisdiction where such distribution or use would be contrary to local law or regulation.

The Caixin Services PMI from China followed a similar theme, with the PMI falling from 57.1 to 53.9.

The US Session

It is a quiet day ahead on the US economic calendar. US factory orders will be in focus ahead of a busy second half of the week. After the disappointing ISM Manufacturing PMI numbers, an unexpected fall in factory orders would test the appetite for the dollar.

However, despite weaker economic indicators, the markets are still betting on a July Fed rate hike.

According to the CME FedWatch Tool, the probability of a 25-basis point July Fed rate hike stood at 86.2% versus 86.8% on Monday. Significantly, the chances of the Fed lifting rates to 5.75% in September stood at 19.0%, down from 20.8% on Monday.

Investor sentiment toward a September move could significantly change later this week. The all-important ISM Non-Manufacturing PMI survey and the US Jobs Report will need consideration.

USD/JPY Price Action

Daily Chart

The Daily Chart showed a sustained USD/JPY breakout from the psychological 144 support level despite disappointing PMI numbers and China-US tensions. The USD/JPY remained above the 200-day (136.142) and 50-day (140.043) EMAs, signaling bullish momentum over the near and long term.

Notably, the 50-day EMA continued to pull away from the 200-day EMA and reflected bullish momentum despite the Tuesday pullback.

Looking at the 14-Daily RSI, the 71.30 reading signals oversold territory, suggesting a return to sub-144. However, a hold above the lower level of the 144.3 – 145.0 resistance range should support a return to 145.

USD/JPY Daily Chart sends bullish signals.
USDJPY 050723 Daily Chart

4-Hourly Chart

Looking at the 4-Hourly Chart, the USD/JPY faces strong resistance at the 145 psychological level. The USD/JPY remained above the 200-day (141.096) and 50-day (143.916) EMAs. Significantly, the 50-day EMA pulled further away from the 200-day EMA, signaling another run at the upper level of the resistance range of 144.3 – 145.0.

The 14-4H RSI reading of 56.34 indicates a moderately bullish stance, with buying pressure outweighing selling pressure. Significantly, the RSI aligns with the EMAs, also signaling another run at 145.

4-Hourly Chart is bullish.
USDJPY 050723 4 Hourly Chart
China squeezes key metal supplies in chip war escalation

China squeezes key metal supplies in chip war escalation

In a chip war twist, China will restrict exports of the niche metals gallium and germanium and certain of their compounds in retaliation against US and Japan export bans on sending advanced chips and chip-making equipment to China.

Beginning August 1, Chinese chemical suppliers must apply for government licenses to export 38 products including gallium nitride (GaN) and germanium dioxide (GeO2), China’s Ministry of Commerce said in a statement on July 3.

The metals are used in chipmaking, communications equipment and various defense items. Gallium is used in compound semiconductors, which when combined with various other elements are often used to improve transmission speed and efficiency in mobile phone screens, solar panels and radars.

Germanium is used in fiberoptic communication cables, night-vision goggles and the solar cells that are used to power many satellites. US imports of gallium metal and gallium arsenide wafers in 2022 were valued at only about US$225 million, according to US trade data.

China is by far the world’s top source of both metals, accounting for 94% of gallium supply and 83% of germanium, according to a European Union study released this year.

Some analysts have already estimated the impact of China’s bans will be limited as the US and Japan can import the materials from other countries or produce them domestically, although at considerably higher costs.

Chinese commentators said China’s export controls aim at slowing the pace of development of US and Japanese chipmakers, a bid to create the time and space for Chinese players to catch up in the critical race to forge ever smaller chip sizes.

“China is always committed to keeping the global industrial and supply chains secure and stable, and has always implemented fair, reasonable and non-discriminatory export control measures,” Chinese Foreign Ministry spokesperson Mao Ning said in a media briefing on Tuesday.

USD/TRY climbs to fresh tops near 26.1000 post-CPI

USD/TRY climbs to fresh tops near 26.1000 post-CPI

Further depreciation of the Turkish currency lifts USD/TRY to new all-time highs near 26.1000 on Wednesday.

USD/TRY: Rally appears unabated so far

On Wednesday, the USD/TRY continued its weekly rebound and surpassed the 26.0000 hurdle, as negative sentiment towards the Turkish lira persisted.

Despite the release of inflation figures in Türkiye, which showed a 3.92% MoM increase in June and a 38.21% rise over the past twelve months, the FX market did not react significantly. These figures came in lower than expected and indicated that disinflationary pressures remained in place last month. Additionally, Producer Prices rose 6.5% MoM and 40.42% YoY.

As the lira falls off the cliff, market participants are increasingly skeptical about the newly appointed economic team’s ability to reverse the trend and restore credibility to both the government and the central bank.

Furthermore, investors are concerned about national lenders spending approximately $1B to support the domestic currency earlier this week.

What to look for around TRY

USD/TRY now seems to have resumed the uptrend following a brief consolidation period of several sessions.

In the meantime, investors are expected to closely monitor upcoming decisions on monetary policy. By appointing Mehmet Simsek and Hafize Gaye Erkan, both former Wall Street bankers, to oversee the country’s finances, President R. T. Erdogan seems to suggest a possible move away from heavy state intervention in favor of letting the market dictate the fair value of the currency.

Although it remains uncertain whether Mr. Erdogan’s preference for combating inflation through lower interest rates will allow Simsek and Erkan’s orthodox approach to monetary policy to thrive, the news of their appointment has been so far cautiously welcomed by market participants.

In a broader sense, price action around the Turkish currency is expected to continue to revolve around the performance of energy and commodity prices, which are directly tied to developments from the Ukraine conflict, broad risk appetite trends, and dollar dynamics.

Key events in Türkiye this week: CPI, Producer Prices (Wednesday).

Eminent issues on the back boiler: Persistent distrust over the CBRT credibility/independence. Absence of structural reforms. Bouts of geopolitical concerns.

USD/TRY key levels

So far, the pair is gaining 0.48% at 26.0739 and faces the next hurdle at 26.0813 (all-time high July 5) followed by 27.00 (round level). On the downside, a break below 23.4189 (weekly low June 21) would expose 21.6268 (55-day SMA) and finally 20.4611 (100-day SMA).

EUR/USD remains sidelined below 1.0900 amid risk-aversion

EUR/USD remains sidelined below 1.0900 amid risk-aversion

EUR/USD is keeping its narrow range below 1.0900 in the European morning. The US Dollar is underpinned by the safe-haven demand on renewed US-China trade issues, which is keeping investors on the edge. The pair awaits EU data and Fed Minutes for fresh impetus.

The EUR/USD fell modestly on Tuesday, on a quiet day across financial markets. The US holiday limited price action. The pair moved with a bearish bias and fell modestly without any new cataclysms. On Wednesday, volatility is likely to pick up with Eurozone economic data and the release of FOMC minutes. The Euro lagged and fell versus the pound on a quiet day without any relevant economic reports.

The US dollar posted mixed results on US Independence Day. Market participants remained on the sidelines. Trading activity will likely be back to normal on Wednesday. The focus is set on the FOMC minutes of the last meeting. Afterwards, attention would turn to US labor market data. On Thursday, the ADP Employment, Jobless Claims, and the JOLTS reports are due, and on Friday, it’s Nonfarm Payrolls. These numbers will help shape expectations regarding what the Federal Reserve will do next.

Relevant economic data is due on Wednesday in the Eurozone. The May Producer Price Index (PPI) is due, with the annual rate expected to decline from 1% to -1.3%. Such numbers would be welcome news for the European Central Bank (ECB). Besides the PPI, the final reading of the Markit Services PMI is due, with no relevant revisions expected.

The US holiday kept price actions contained on Tuesday, with EUR/USD moving in a small range with a bearish bias. The pair dropped under 1.0900, falling toward 1.0880. The outlook has not changed much during the last hours, with the upside potential limited and the Euro supported by the 1.0850 area.

On the 4-hour chart, the technical indicators show mixed signs, with the Relative Strength Index (RSI) turning south below 50, and Momentum moving north above midlines. On the downside, the key support stands around 1.0850, and while above it, losses are likely to be limited. A slide below would expose last week’s low.

On the upside, the key area is a downtrend line around 1.0925 and the 1.0930 resistance area. If the Euro rises above it, it could unleash bullish potential, targeting the 1.0965 area. Above that, attention would turn to 1.1000.

Q3 Top Trade: Canadian Dollar Could Rise Further Against the US Dollar in the Third Quarter

Q3 Top Trade: Canadian Dollar Could Rise Further Against the US Dollar in the Third Quarter

The Canadian dollar’s rise against the US dollar above key resistance points to further gains on improving risk appetite amid resilient global growth, signs of a turnaround in commodity prices, and hopes of more stimulus from China.

Commodity prices (using the Bloomberg Commodity Total Return Index) rebounded sharply in the week ended June 16, while the Bloomberg Industrial Metals index appears to have found a floor. The rebound in commodity prices has aided commodity-sensitive currencies, including the Canadian dollar, the Australian dollar, and the New Zealand dollar.

Moreover, the raising of the US debt ceiling, fading stress in the banking/financial sector, resilience in global growth, and hopes that global interest rates are peaking have boosted investor confidence in risk-sensitive assets, especially technology stocks.

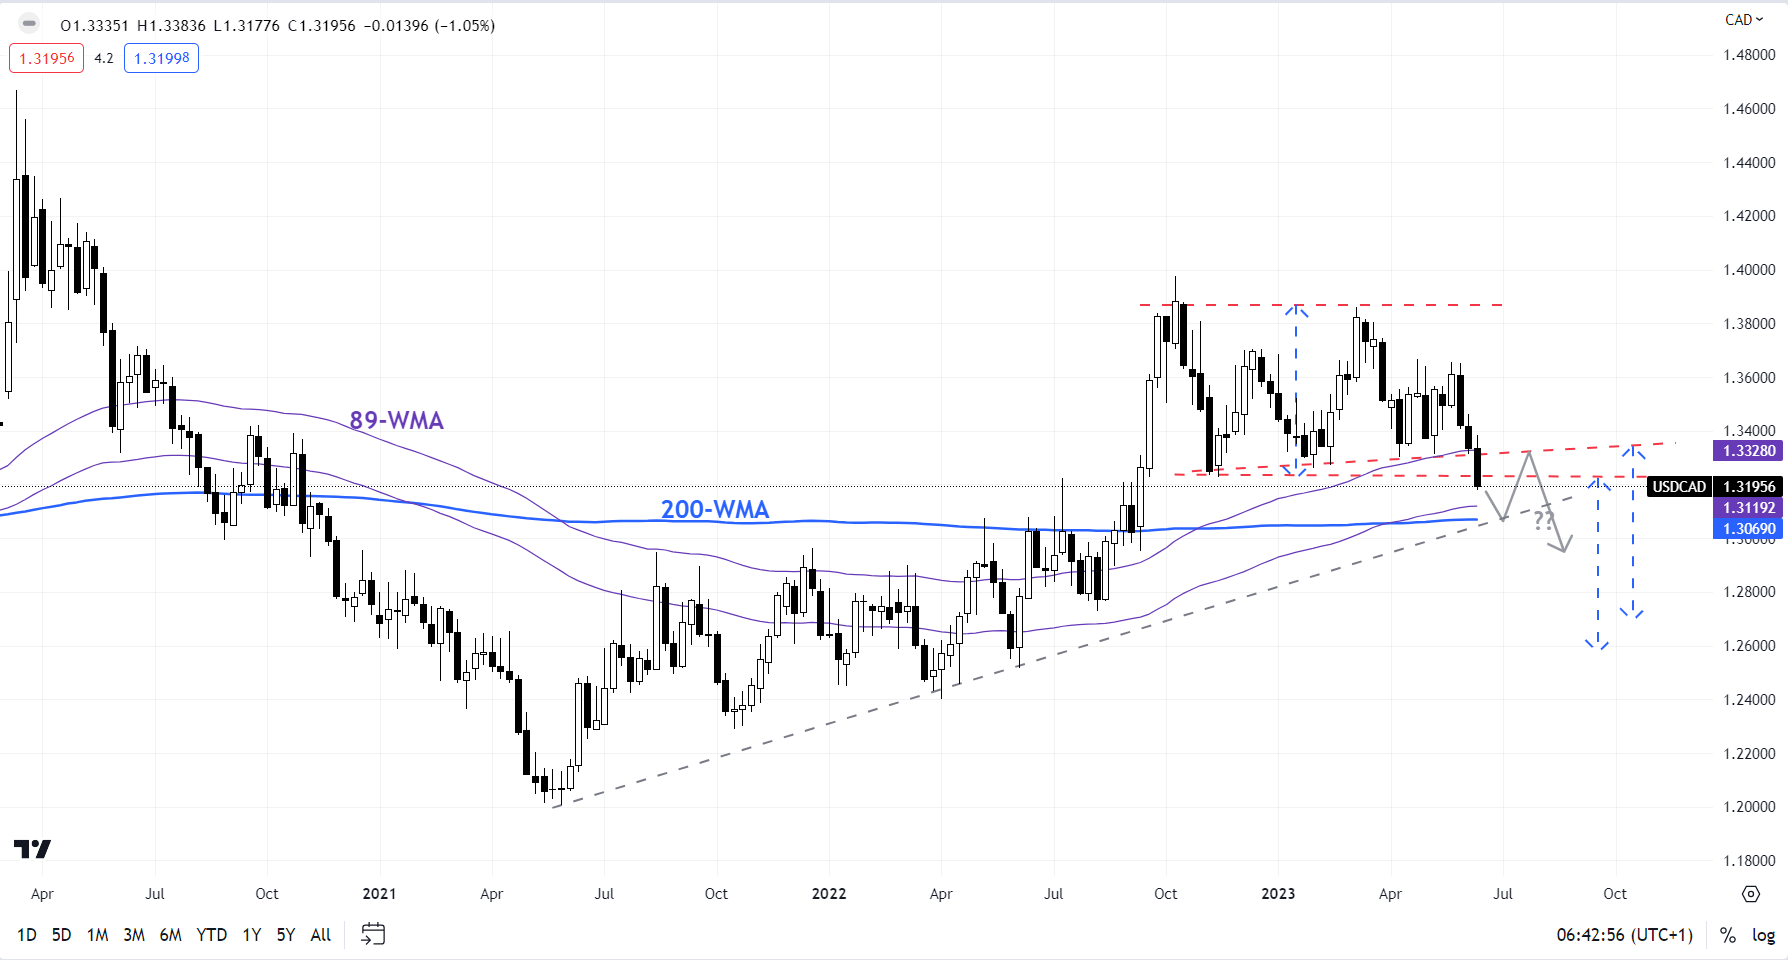
USD/CAD Daily Chart

image1.png

Furthermore, just as global central banks are reaching an inflection point in the hiking cycle, China cut a few key policy rates in the past week, boosting hopes of more stimulus in coming months to support the fragile economic recovery. Media reports suggest Beijing is considering issuing roughly one trillion yuan of special treasury bonds to help indebted local governments and boost business confidence.

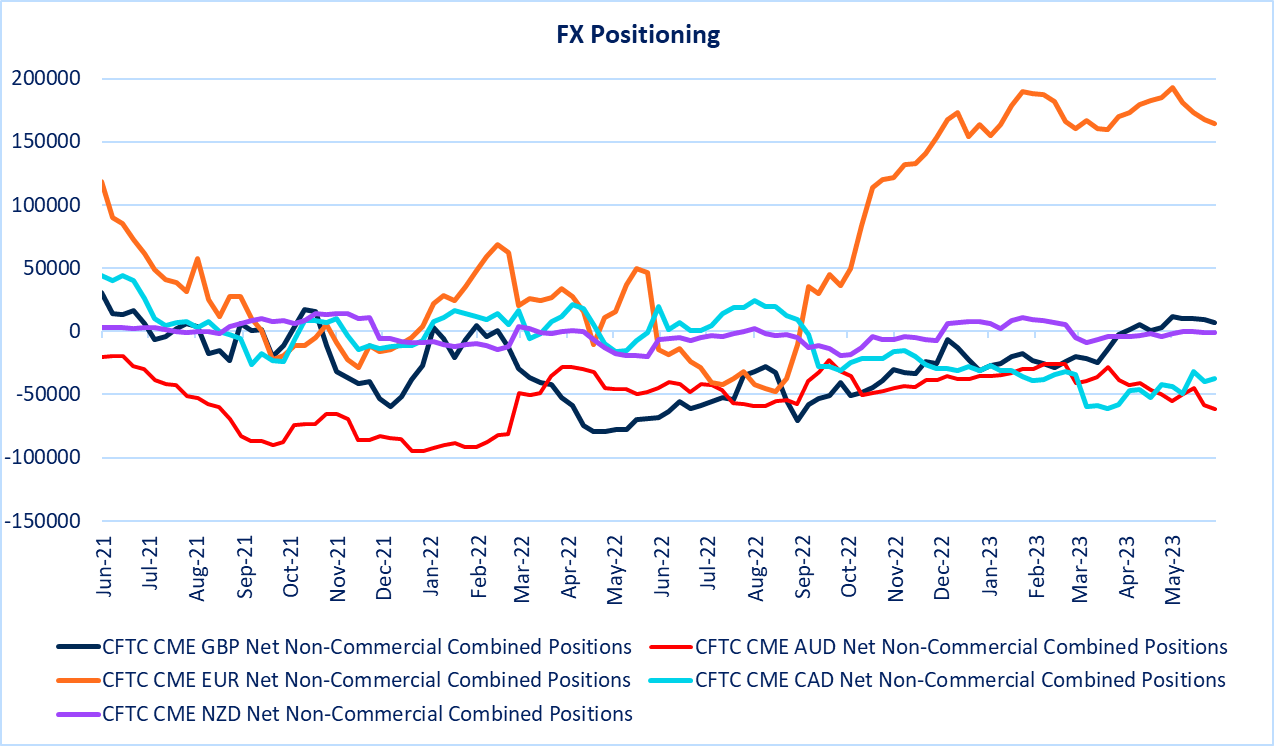
From a monetary policy perspective, there is very little takeaway for USD/CAD. Both the US Federal Reserve and the Bank of Canada aren’t done with tightening, although the extent of such tightening would depend on incoming data. However, stretched speculative short CAD positioning leaves open the possibility of unwinding some of those positions, especially in the absence of a sharp deterioration in global growth.

FX Positioning

image2.png

USD/CAD: Cracks below vital support

USD/CAD’s break below vital converged support around 1.3220-1.3320 has initially opened the gates toward the psychological 1.3000, potentially toward the August low of 1.2725. See the daily chart for potential technical price objectives. From a trend perspective, after being sideways for months, USD/CAD’s fall below the support has reversed the trend to bearish.

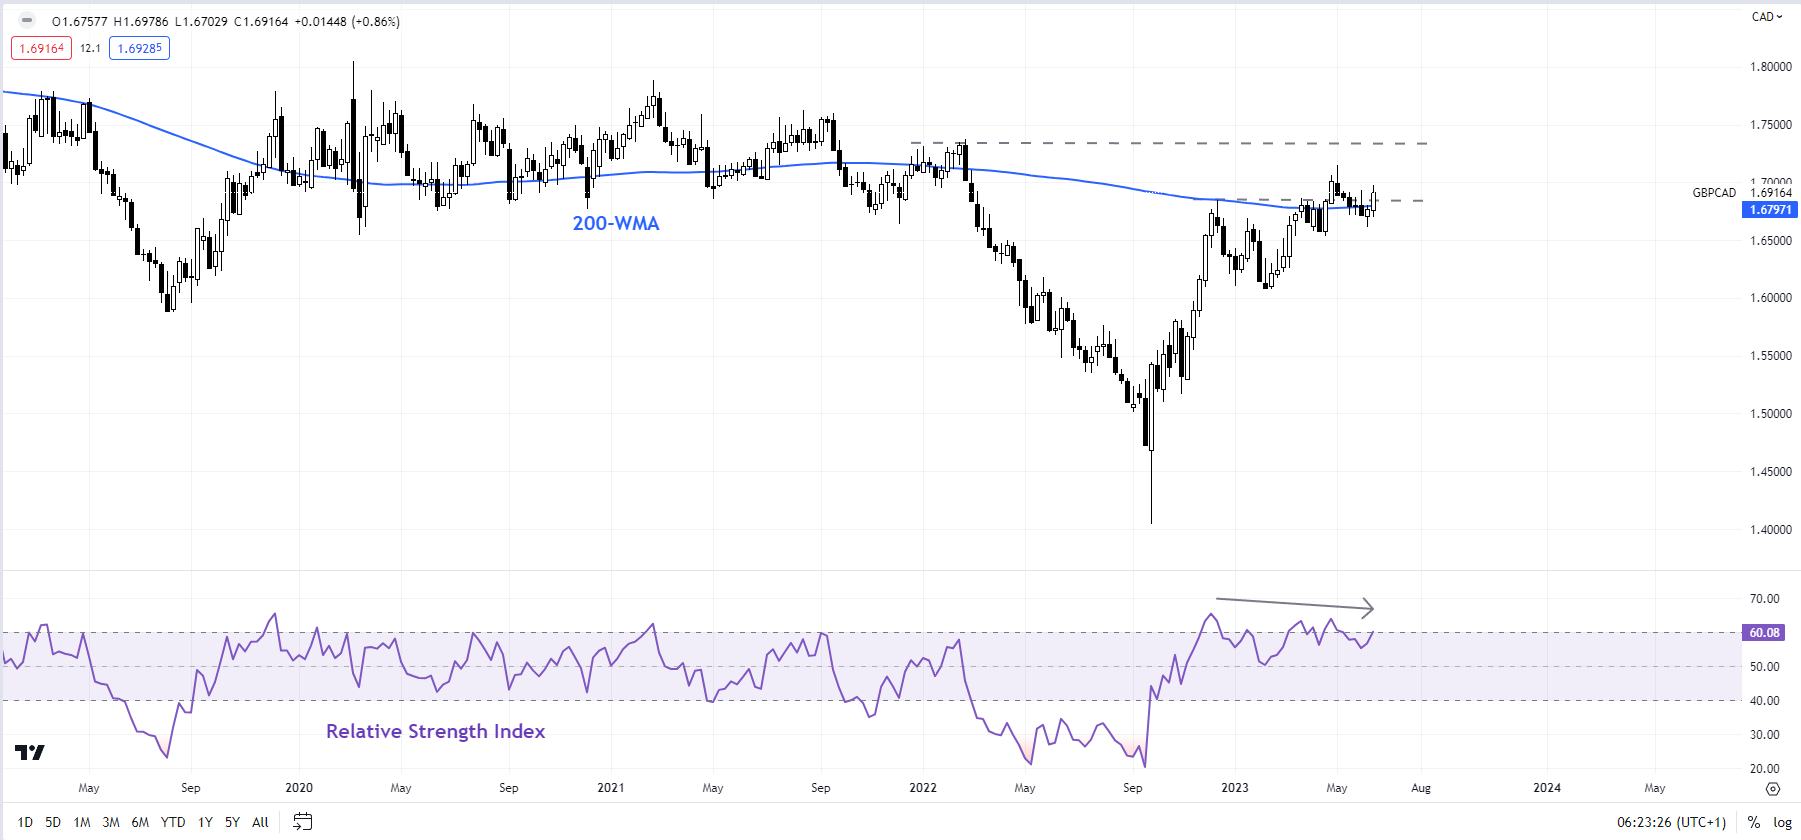
GBP/CAD Weekly Chart

image3.png

GBP/CAD: Upside capped

GBP/CAD’s failure to rise decisively past the end-2022 high of 1.6850, slightly above major resistance on the 200-week moving average, points to fatigue in the nine-month-long rally. So far, the cross has been supported around a crucial converged floor, including the April low of 1.6535, coinciding with the 89-period moving average. The bias, however, remains down potentially toward the 200-day moving average (now at about 1.6300).

Asia Day Ahead: Focus on FOMC Minutes as US Markets Reopen After Holiday

Asia Day Ahead: Focus on FOMC Minutes as US Markets Reopen After Holiday

With the US markets off-trading due to the Independence Day holiday, the risk environment was met with a more subdued tone without much economic data to catch on. European markets were flat to slightly lower on a thinly-traded session, while at the time of writing, US equity futures are on some wait-and-see as well.

The market focus today will be on the Federal Open Market Committee (FOMC) minutes. With the higher terminal rate forecasts at its previous meeting, more clarity on policymakers views around that guidance will be sought in the upcoming minutes. That said, the minutes could be perceived to be outdated somewhat, given that we have a series of positive economic surprises and a softer-than-expected core PCE inflation figure released after the Fed discussion. Market rate expectations have also been unwavered by previous hawkish Fedspeak, which suggests that it may have to take much more from the Fed minutes to convince markets of a more hawkish outlook.

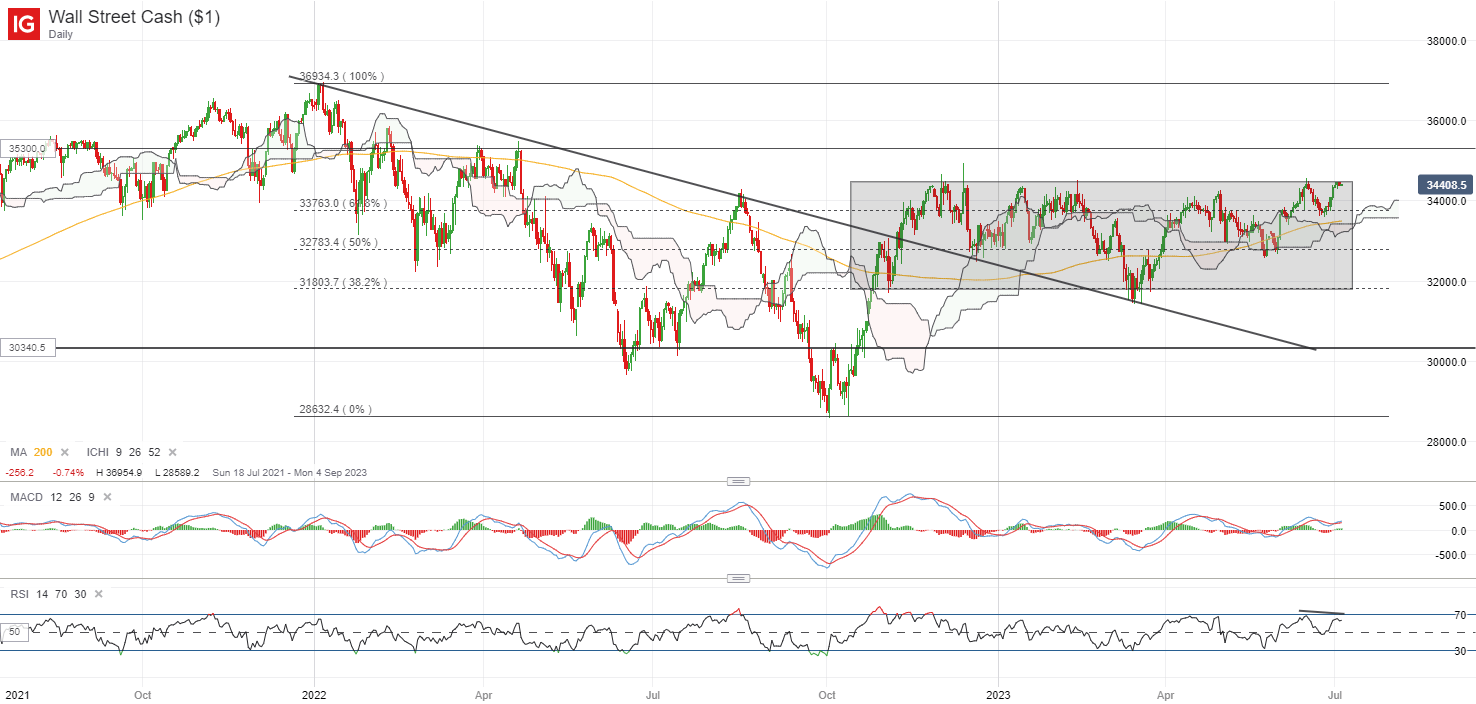
Having largely traded in a long-ranging pattern since November last year, the DJIA is back to retest the upper edge of the consolidation zone once more at the 34,500 level. Having failed to find a breakthrough above this level on multiple occasions since late-2022, it has served as a key level of resistance to watch, accompanied by recent lower highs on the daily Relative Strength Index (RSI). The more value-focused DJIA is just up 3.9% year-to-date, way trailing behind the Nasdaq Composite’s 33%. With chatters of the risk rally turning more broad-based, a break above this level may be warranted to provide greater conviction for further catch-up performance in value stocks. Any break above the 34,500 level could potentially pave the way to retest its April 2022 high next.

image1.png

Asian stocks look set for a slightly weaker open, with Nikkei -0.44%, ASX -0.26% and KOSPI -0.24% at the time of writing. Chinese equities managed to stay in the green yesterday, with the Hang Seng Index up 0.6%.

As a follow-up to China’s move to restrict key materials for manufacturing semiconductors, US plans to restrict Chinese access to US cloud-computing services, according to a report by the Wall Street Journal. Ahead of US Treasury Secretary Janet Yellen’s visit to Beijing this week, recent action from both ends seem to be a display of their tough stance in the bilateral relationship, potentially to showcase their competitive advantage to gain leverage in any discussions. Any resolution or inaction from the visit could take some focus into next week.

Ahead, China’s services Purchasing Managers Index (PMI) read will be on the radar today to provide clues on how the country’s consumption-led economic recovery has been playing out. Since the start of the year, the reading has outperformed expectations on 5 out of 6 previous occasions, which may translate to some near-term relief for Chinese equities if the trend continues.

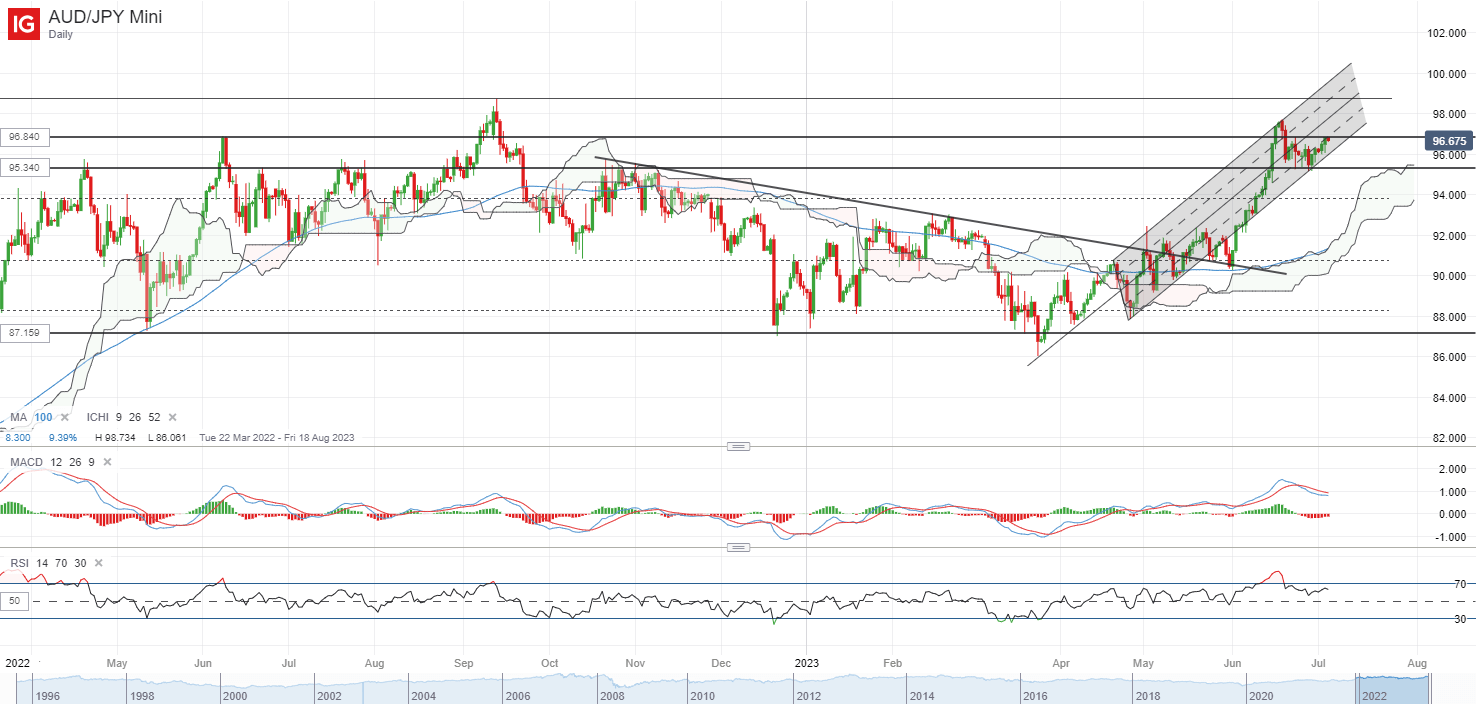
The takeaway from the recent Reserve Bank of Australia (RBA) meeting was a hawkish pause, which saw the AUD/JPY ticking slightly higher to retest the 96.84 level of resistance. This follows after a bounce off an upward trendline at the 95.34 level, which also marked a horizontal resistance-turned-support. Having traded on higher highs and higher lows since March this year, any move above the 96.84 level could set its sight to retest its year-to-date high next, followed by the 98.75 level.

image2.png

On the watchlist: USD/SGD heading closer towards ascending triangle apex

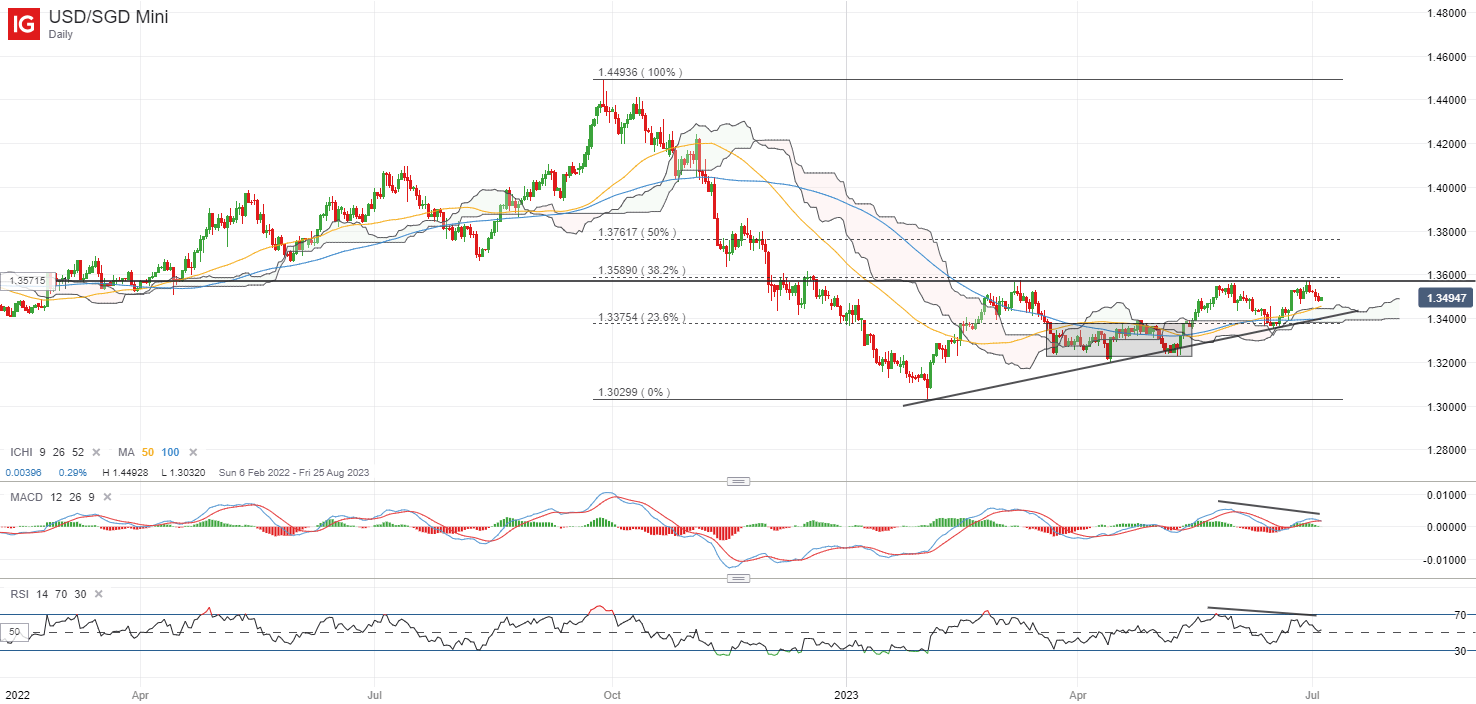
After falling by 10% since September 2022, buyers have been attempting to take back some control since the start of this year, with an ascending triangle pattern formation in place year-to-date. Much still await for now, with the bearish divergences on RSI and MACD pointing to some waning upward momentum on recent tops.

The 1.360 level will serve as the immediate resistance to overcome ahead. A recent retest of the upper triangle trendline around the 1.360 level has failed to find a breakthrough for the third occasion this year, leaving it as a key resistance level to watch. Any subsequent move above this level could better reflect buyers in control, which may pave the way to retest the 1.376 level next. On the downside, the rising lower trendline support of the triangle formation will serve as support around the 1.340 level.

image3.png

Forex Trading Journal: A How-To and other Forex Trading Tips

Forex Trading Journal: A How-To and other Forex Trading Tips

A forex trading journal is a log of your trades that can help you refine your strategies based on learning from previous experiences. Just as a business owner tracks inventory, a trader should also keep up with their closed positions.

While keeping a trading journal may be difficult at first, recording your trades can help answer some critical questions about your trading techniques. It can increase the consistency of your trading, keep you accountable, and improve your technique overall. In this piece we will explore what you need to know about journaling, providing the following:

  • A forex trading journal Excel template
  • Tips on finding the journaling method that suits you
  • Tips on the ideal forex trading workflow.

Forex Trading Journal Excel

Screenshot showing a forex trading journal template

As in the forex trading journal Excel example above, your journal might contain information such as the currency pair traded, size of the trade, whether your position is long or short, the date of the trade, your conviction level, whether you’ve used a fundamental or technical strategy, the reward to risk ratio, points movement, and whether the trade was successful or not.

You may also want to include details such as the entry price, stop price and limit price, as well as lots traded. The more data you keep, the easier it will be to assess your past trades at a later date.

Also, be sure to include space to add notes in your journal. Traders using multiple entry techniques will want to track things such as chart time frames, indicators used, market conditions (range, trend, breakout) and any other information that factors into a trading decision.

Through journals such as the one above, over time the trader will be able to identify characteristics of winning or losing trades.

Journaling Approaches From expert Analysts

He also includes notes on why an entry order should be placed and a stop placed at the point that an equity drawdown is minimized and his technical viewpoint changes.

‘I often reduce my trade size so that I can stay in the market longer or until the technical bias is invalidated,’ he adds.‘The follow-up focuses on what types of currency pairs are reacting best to the currently employed strategy.’

James has been trading since 1999 and focuses on equity indices and ETFs along with forex.

James keeps a ledger rather than a journal. He tries to update it once a week with trades placed since the last update. ‘I keep everything in percentage format so I can make apples-to-apples comparisons, from equities to options to FX,’ he says.

‘As I’m filling this in, I can see trends as they happen(ed), largely by focusing on P&L, and if something is amiss, I’ll usually just think about it for a day or two while I come up with some form of a solution.’

As for considerations for improvement during drawdowns, James considers how aggressive or conservative he wants to be. ‘If I hit a bad streak the answer is usually just pulling back the throttle, smaller sizes, less leverage, fewer but more selective entries.

‘The polar opposite of that is being too conservative, and I can usually catch that as it’s happening, so I don’t often have to encourage myself to get more aggressive.’

This brief insight into the journaling and trading workflows of our analysts may or may not resonate with your own. There is no correct method, but there are a range of approaches listed below that can be tried.

Finding the Journaling Method That Suits You

Finding the journaling method that suits you will take trial and error, and there are a couple of approaches. Either you will keep your trade journal private and review it on your own, or you can allow other traders to take a look at it and give feedback. Both methods are effective and will help keep you accountable.

If you go the personal journal route, it’s probably easiest to keep your thoughts and screenshots in a Word doc (although a physical notebook could work to simply jot down your thoughts).

For a public journal, you will probably want to record your trades and thoughts on an online blog or forum. This will allow traders from anywhere in the world to see your trades win, lose or draw.

Whether you are reviewing your journal yourself or allowing people online to review it, this gives you extra incentive to place clear, valid trades on your account and make it more difficult to deviate from your strategy.

You will know in the back of your mind that you will have to face your decisions later on in your journal and possibly have to face others if your journal is public. This will help you become more aware of times when you let emotions dictate your decisions rather than your strategy’s logic or when you decide to ‘get creative’ and place a rogue trade without a strong basis for it.

It’s good to have accountability. Many traders can fool themselves into thinking they are rationally making trading decisions only to find out later that they didn’t follow their strategy at all.

Top Forex Trading Tips: Journaling and Your Trading Workflow

The workflow for a trader should involve a combination of scanning the charts and reviewing the news, entering and managing trades, and journaling the trade at the end (and possibly start) of the process.

Review charts

Look at the opportunities available in the market, whether it be identifying technical chart patterns, or acting on fundamental factors such as news releases. At this point, you may want to journal the potential pairs to trade and your thought process on selecting them.

Find an opportunity

Identify an entry, mark up your chart and make a note on your chart on the reason for the entry.

Enter Trade

Once you place the trade, add your profit targets and take profits. At this point, you will probably be too busy with the trade to journal.

Manage Trade

Trade management at this point may include pyramiding, or multiple profit targets. Managing the trade requires your full attention, so your journaling may be limited to screenshots.

Review and Journal the Trade

Now that the trade is closed, you can set to work journaling, assessing your screenshots and any notes you took to analyze the trades, work out where you may have made a mistake, and consider what you need to do to improve.

Check out our resources on forex trading tips

For more information on forex trading tips, check out our forex real time news section. Also, be sure to download the forex trading journal template from Page 5 of the Building Confidence in Trading guide, which can be accessed via the link above.

A Price Action Tell: Support at Prior Resistance, Resistance at Prior Support

A Price Action Tell: Support at Prior Resistance, Resistance at Prior Support

As we talked about in our introduction to price action, markets are cyclical creatures. Prices go up, prices go down and as traders, the most we can hope to do is ride on the right side of the wave for a bit.

But along the way there’s a number of deductions that traders can make that can allow for strategy to enter the picture, and in terms of trend, support and resistance is fairly important. Bullish trends will often price-in a series of higher-highs and higher-lows while bearish trends will show the opposite. But – markets aren’t always trending, as we’ll often see ranges or digestion pop-up when prices are fairly equalized. That’s what brings on inside bars and we’ll talk about those a little later in this sub-module.

Price Action Support and Resistance

As discussed throughout our education section, there’s a plethora of ways to find support and resistance levels. Fibonacci is a popular tool and psychological levels can carry some significant weight. But, if markets don’t acknowledge that support or resistance – what is its point? There isn’t one, right? The only utility for support and resistance is the ability to highlight something that may happen, while allowing the trader to adopt an objective framework for their own activity within a market.

As we looked at in our Price Action Support and Resistance article, there’s a couple of primary ways to use prior price action to find actionable levels to work with. But we also ended by saying that there’s one more way that traders can incorporate prior price movements in the effort of finding support and resistance, and that’s by incorporating older levels that may come back into the picture.

Support and Old or Prior Resistance

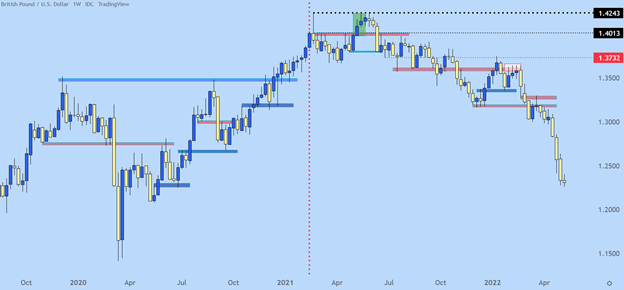
When in an up-trend, prices will often ebb and flow with a general bias towards the ebbing as opposed to the flowing. And when prices do pullback, traders are often looking for that point with which it becomes attractive again to buy. One possible reference point – prior swing-highs or prior points of resistance. And, in the case of down-trends, prior swing-lows or points of support as potential resistance. Let’s look at an example in GBP/USD to illustrate.

Each of the blue lines below indicate an area of prior resistance that came into play as support. And red lines indicate an area of support that’s come into the picture as resistance.

GBP/USD Weekly Price Chart

Chart prepared by James Stanley; GBP/USD Weekly chart, Oct 2019 – April 2022

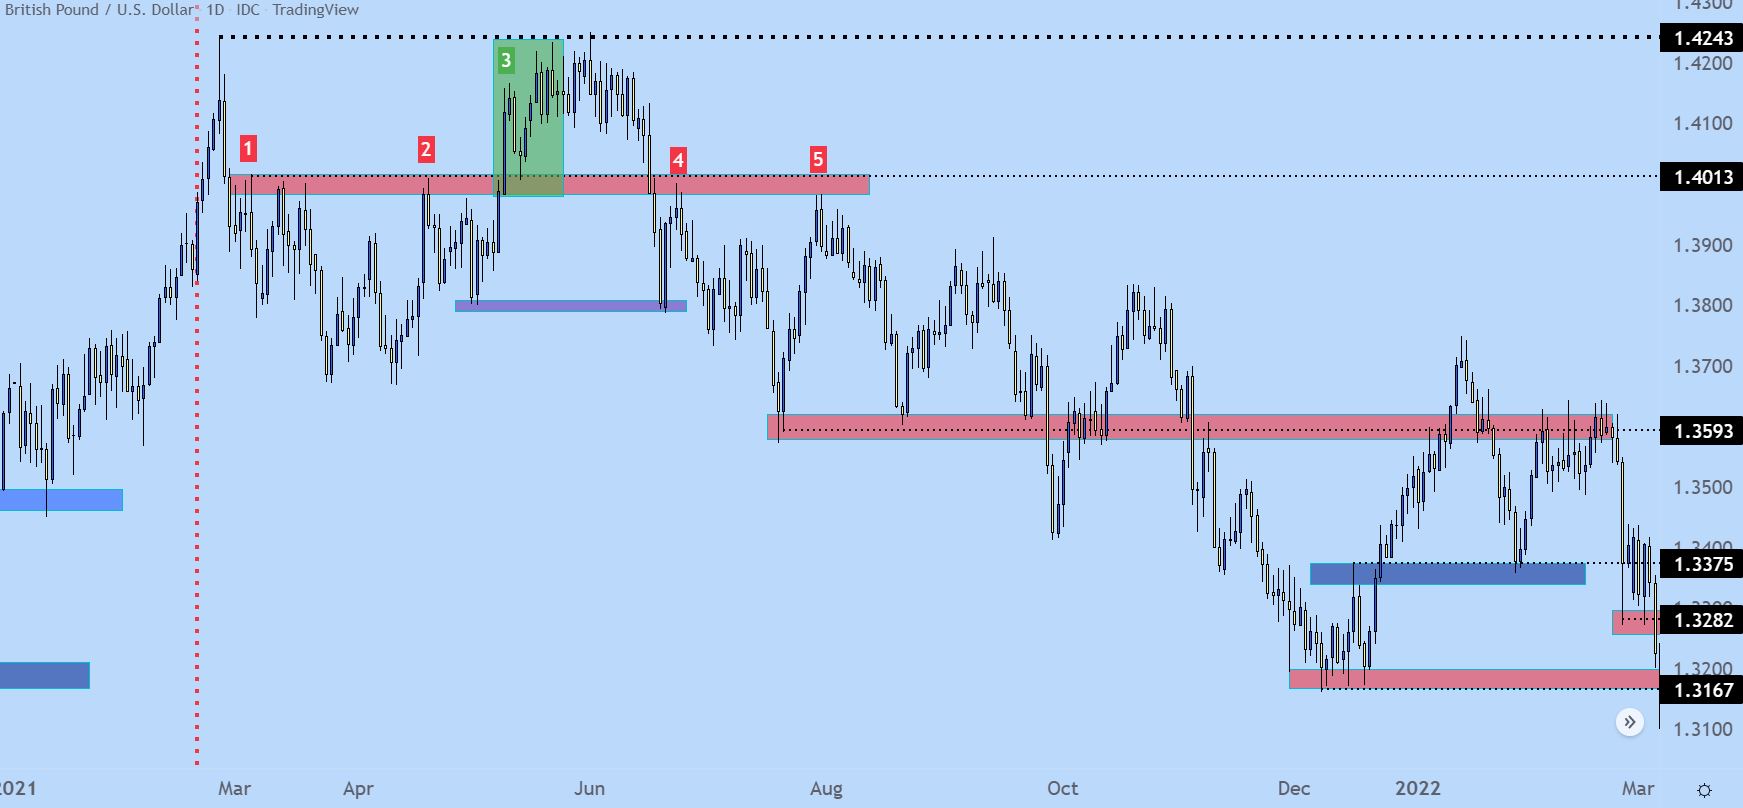
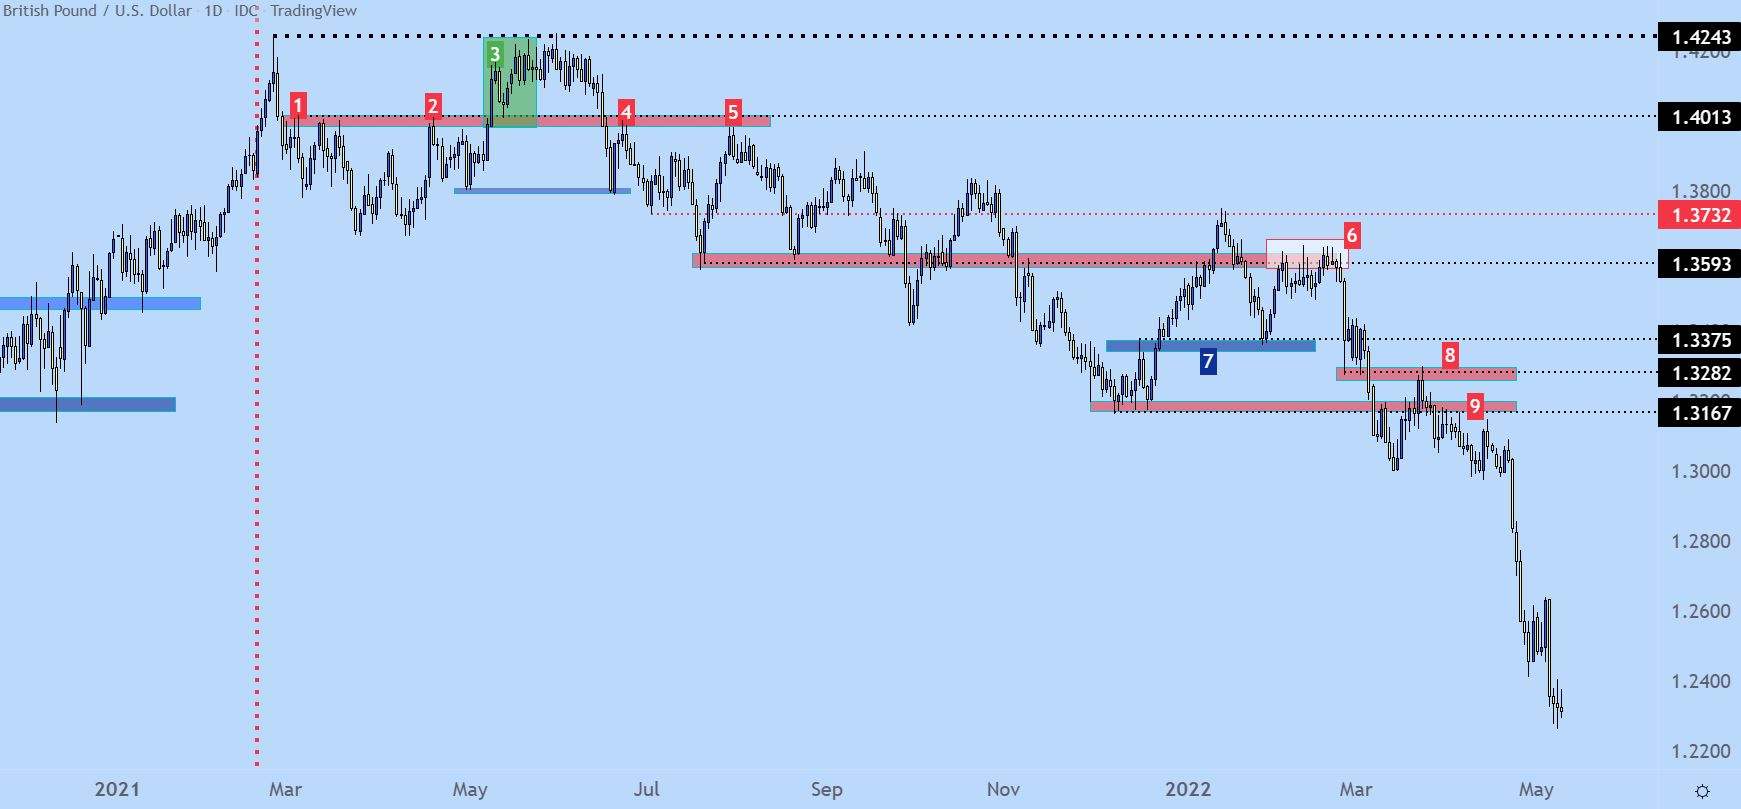
Let’s get a bit more granular with this situation, using the below chart. We’ll begin with the red vertical line, after which price action puts in a swing at the 1.4013 level (marked as ‘1’ on the below chart). You can see multiple wicks on the daily chart in the red box accompanying that line, and this is highlighting a resistance reaction that holds from early-March through the May open (marked as ‘2). That resistance offered a few different inflections but buyers eventually break through, indicated by the green box in early-May (marked as ‘3’).

But, buyers are thwarted at the same exact level that had come into play a few months earlier, plotted at 1.4243, and after bulls failed to breakthrough, sellers eventually take control and elicit a breakdown back-below the 1.4013 price. Buyers push down to the purple box, around 1.3800, before a bounce develops and that sends prices right back into that same zone of resistance (marked as ‘4’).

That inflection leads to another fresh low, around the 1.3600 area, but sellers still don’t have full control, as price pushes back up to that same resistance zone but fails to get all the way there. This is a lower-high, and indication that sellers were on the sidelines and unwilling to wait for price to test the high. They enter a bit earlier, and this leads to a lower high before sellers swing a bit more aggressively (marked as ‘5’).

GBP/USD Daily Price Chart (2021 – Feb 2022)

After that second resistance reaction (marked by ‘5’ above), sellers push price right back to support, which isn’t ready to give way yet. That happens a couple of months later.

But, perhaps more importantly, in early 2022 trade, that same zone around the 1.3600 handle becomes a massive spot of resistance. This gyration has now taken six months but there’s still a discernible bearish bias as indicated by the lower-highs. But, notably, notice how intense the resistance reaction is in the white box on the right side of the chart (marked as ‘6’). This took almost three weeks to resolve but, once it did, prices started a sell-off that ran for a long time. Along the way there were more items of short-term resistance coming in as support (marked as ‘7’) and prior items of support coming in as resistance (marked as ‘8’). In box 9, I wanted to highlight the build of lower-highs, below box 8 as that prior swing was continuing to help form some resistance.

GBP/USD Daily Price Chart (2021 – May 2022)