Crude Oil Range Bound Ahead of OPEC+ Gathering and FOMC Minutes

Crude Oil Range Bound Ahead of OPEC+ Gathering and FOMC Minutes

Crude oil has had a mixed session so far on Wednesday ahead of the start of the OPEC+ gathering that gets underway in Vienna today. The disparity in prices is explained by the US holiday on Tuesday.

The West Texas Intermediate (WTI) futures contract is heading north as it approaches US$ 71 bbl while the Brent contract has dipped below US$ 76 bbl.

The overall sluggishness of prices is despite Saudi Arabia and Russia committing to extending their production cuts earlier this week.

The gold price has eked some small gains today, trading over US$ 1,925.

APAC equities have had a tough day after China’s Caixin services PMI for June underwhelmed expectations. It came in at 53.9 rather than the 56.2 anticipated and 57.1 previously. The composite PMI was 52.5 against 55.6 prior.

Hong Kong’s Hang Seng Index (HSI) bore the brunt of the negative sentiment, trading more than 1.5% lower through the session.

Anaemic currency markets appear to be waiting for the return of US traders after a holiday there.

Later today the Fed’s FOMC minutes from the June gathering will be released. The market will be looking for clues on the outlook for the rate path given that they paused their hiking but then resumed the hawkish rhetoric in the aftermath of the conclave.

New York Fed President John Williams will also be speaking today.

WTI CRUDE OIL TECHNICAL ANALYSIS

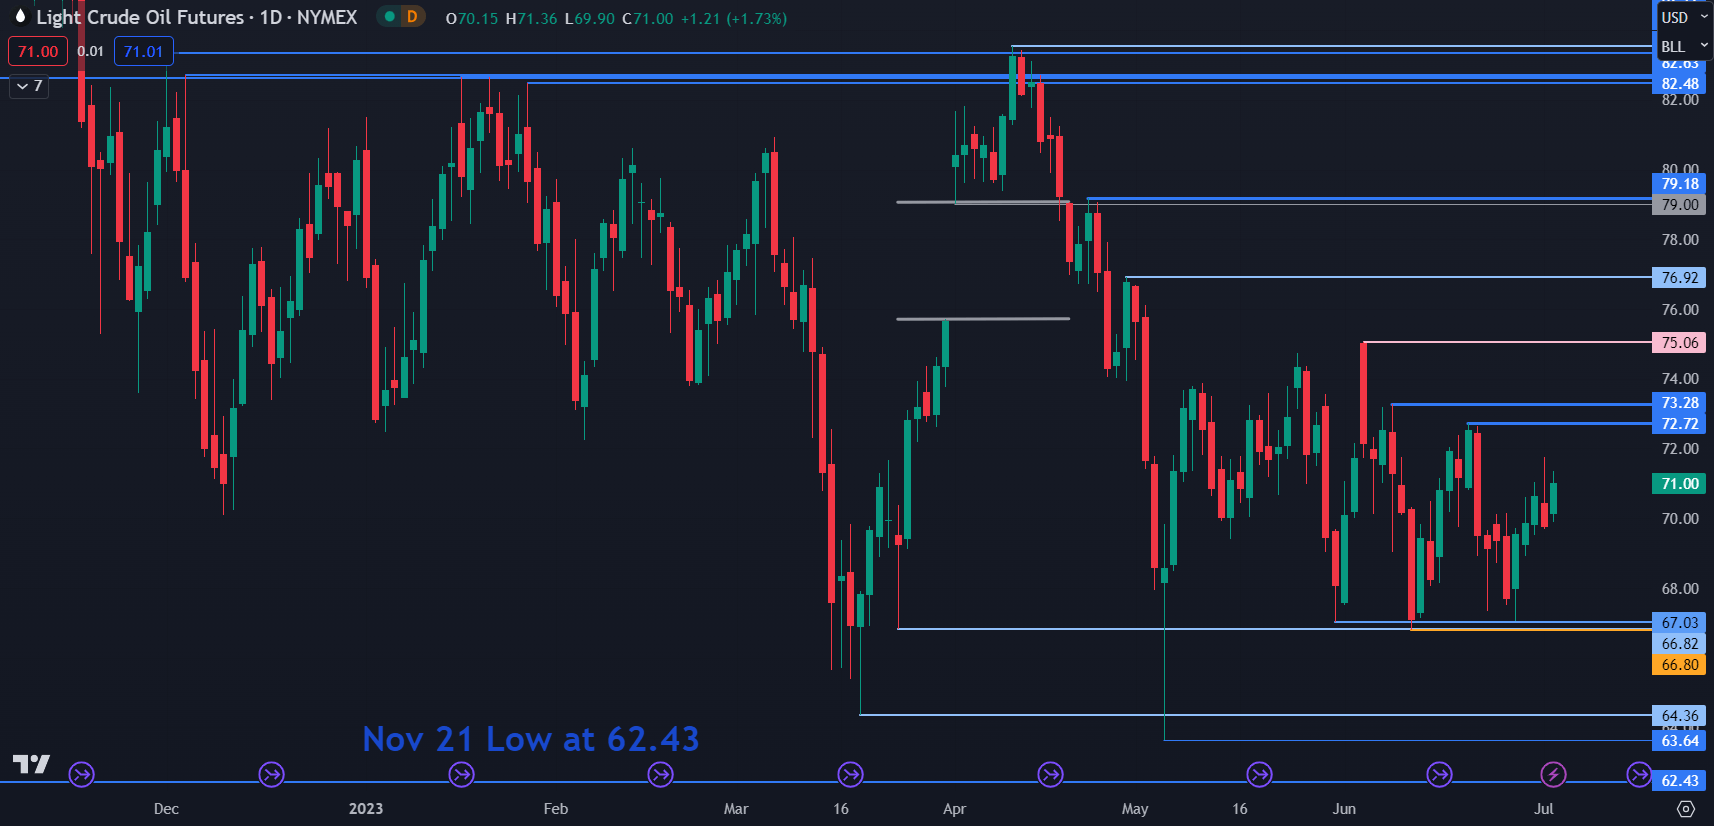
WTI crude continues to see range trading conditions with the price contained within 66.80 – 75.06 for more than 2 months. More broadly, it has traded between 63.64 and 83.53 since last November.

With this in mind, previous highs and lows might provide resistance and support respectively.

On the downside, support may lie at 67.03, 66.82, 66.80, 64.36, 63.64 or at the November 2021 low of 62.43.

On the topside, resistance could be at 72.72, 73.28, 75.06, 76.92 and 79.18 ahead of a cluster of breakpoints and prior peaks in the 82.50 – 83.50 area.

image1.png


USD-crosses volatility will pick up again tomorrow when the focus will shift to FOMC minutes – ING

USD-crosses volatility will pick up again tomorrow when the focus will shift to FOMC minutes – ING

It should be a quiet day in FX today due to the US national holiday, but things will get hectic again from tomorrow, economists at ING report.

National holiday today, but volatility to pick up tomorrow

US bond and equity markets are closed and there are no data releases, so expect another quiet day in FX.

USD-crosses volatility will pick up again tomorrow when the focus will shift to FOMC minutes.


Australia’s central bank leaves its key rate unchanged, says inflation ‘passed its peak’

Australia’s central bank leaves its key rate unchanged, says inflation ‘passed its peak’

Australia’s central bank held its official cash rate steady at 4.10% in a closely watched decision Tuesday.

Economists were split on expectations ahead of the decision, with 16 out of 31 respondents surveyed by Reuters forecasting a hike of 25 basis points and 15 expecting the central bank to hold.

Stocks cheered the move as the central bank said inflation in the economy has “passed its peak.” The S&P/ASX 200

pared earlier losses and rose 0.5%. The Australian dollar

weakened 0.25% to 0.6652 against the U.S. dollar.

“Some further tightening of monetary policy may be required to ensure that inflation returns to target in a reasonable timeframe, but that will depend upon how the economy and inflation evolve,” RBA governor Philip Lowe said in a statement.

“Inflation is still too high and will remain so for some time yet,” he said.

The Australia Bureau of Statistics’ monthly inflation indicator showed some cooling in the rise of prices at 5.6% for the month of May, led by housing prices, food and non-alcoholic beverages.

Australia’s monthly inflation indicator peaked at 8.4% in December. The economy’s consumer price index rose 7% in the first quarter of 2023.

The decision comes after the central bank raised its cash rate by 25 basis points last month — a move it described as a “finely balanced” decision, according to minutes from its June meeting.

‘Time to assess’

Lowe said in Tuesday’s statement, “The decision to hold interest rates steady this month provides the Board with more time to assess the state of the economy and the economic outlook and associated risks.”

He added that the central bank will continue to closely monitor developments in the global economy, household spending trends and inflation forecasts.

The central bank’s decision to hold rates steady was to “assess” the effects of the multiple rate hikes so far, according to IG’s Australia market analyst Tony Sycamore.

“The RBA’s decision to keep rates on hold today was in some parts based on reasons like the ones that prompted a pause in April — to assess the impact of a cumulative 400bp or rate hikes over the past fourteen months,” Sycamore told CNBC.

Unemployment is reduced by 50,268 people and stands at the lowest figure in the last 15 years

Unemployment is reduced by 50,268 people and stands at the lowest figure in the last 15 years

The number of people registered in the offices of the State Public Employment Service (SEPE), at the end of the month of June, fell by 50,268 people (-1.84%), compared to the previous month. Registered unemployment has reached a total of 2,688,842 people, the lowest figure in the last 15 years, specifically since September 2008. In the last 12 months the reduction has been almost 200,000 people (-191,740 people, the -6.66%). This decline, which is widespread throughout the country, affects all sectors and all age groups, both men and women. It also confirms the positive evolution of the labor market, which has now

China’s Xi: Should focus on practical cooperation, accelerate economic recovery

China’s Xi: Should focus on practical cooperation, accelerate economic recovery

In a virtual SCO summit on Tuesday, China’s President Xi Jinping said that they “should focus on practical cooperation and accelerate economic recovery.

Additional takeaways

“Need to strengthen strategic communication and coordination, respect each other’s core interests and concerns.“

“Need to formulate foreign policies independently.”

“China willing to work with all parties to implement global security initiatives.”

“China is against decoupling and severing supply chain.”


GBP/USD Price forecast: Pound Gears Up for Big Data Tomorrow

GBP/USD Price forecast: Pound Gears Up for Big Data Tomorrow

GBPUSD FUNDAMENTAL BACKDROP

Today’s US holiday (Independence Day) will likely see the British pound relatively muted alongside no significant economic data. The calendar below shows tomorrow holds more volatility stoking news including UK services PMI’s, Fed speak and the FOMC Minutes respectively. Non-manufacturing data will be closely monitored as services outline roughly 75% of the UK’s economy making it a key gauge to assess the overall trajectory of the UK economy.

UK ECONOMIC CALENDAR (GMT +02:00)

image1.png

Implied rates (refer to table below) for the Bank of England (BoE)’s forthcoming interest rates remain firm in their expectation for yet another 50bps hike with cumulative rate hikes estimated around 125bps by December 2023. Markets clearly view the inflationary pressures through an extremely hawkish lens leaving room for a dovish surprise in my view. Any upcoming data pointing to a weaker economy and declining inflation could hurt the pound after a strong start to the first half of 2023 against the greenback.

BANK OF ENGLAND INTEREST RATE PROBABILITIES

image2.png

TECHNICAL ANALYSIS

GBP/USD DAILY CHART

image3.png

Price action on the daily cable chart above has GBP/USD shows the 1.2680 swing support handle holding but with minimal data for today coupled with an absence of US trade, cable will likely remain muted/rangebound.

Key resistance levels:

  • 1.2813

Key support levels:

  • 1.2680
  • 1.2584

BEARISH IG CLIENT SENTIMENT

IG Client Sentiment Data (IGCS) shows retail traders are currently net SHORT on GBP/USD with 56% of traders holding short positions (as of this writing). At DailyFX we typically take a contrarian view to crowd sentiment but due to recent changes in long and short positioning we arrive a at a short-term downside disposition.

Bitcoin Looking to Shrug Off Regulatory Concerns and Push Even Higher

Bitcoin Looking to Shrug Off Regulatory Concerns and Push Even Higher

The second quarter saw regulatory concerns ramp up with the SEC sending charge notices to both Binance and Coinbase. This tightening of the regulatory backdrop comes after the failure of FTX late last year when billions of dollars of client money were, supposedly, comingled with FTX’s sister company Alameda Research. SEC chair. SEC chair Gary Gensler believes that most cryptocurrencies are securities and that therefore they, and the exchanges, fall under his purview. This increasingly tough enforcement by the SEC tipped the market lower for most of Q2. The sentiment changed however mid-June when the world’s largest asset manager, BlackRock, announced that they had applied for a spot Bitcoin ETF. If BlackRock is granted a spot Bitcoin ETF, then a potentially huge new customer basewill become available, as well as the gravitas the asset manager’s name would lend to the cryptocurrency space.

The weekly Bitcoin chart highlights how the late June candle has erased all the losses seen in the two months before and adds belief that prices may push higher. BTC is back above the 200-day moving average, while the 20-dma is now set to push through the 200-dma, another positive, longer-term technical signal.

Bitcoin (BTC/USD) Weekly Price Chart

The daily Bitcoin chart shows two horizontal lines of resistance at $31,000 and $32,400 respectively with little above here of technical relevance. There is also a very early stage bullish flag being formed this week, which if confirmed would see the two levels of previously mentioned horizontal resistance taken out. BTC/USD is also above all three moving averages.

Bitcoin (BTC/USD) Daily Price Chart

While Bitcoin can be a notoriously difficult asset to trade, the change in sentiment along with a positive technical backdrop makes Bitcoin one to watch in the third quarter.

Silver Price Analysis: XAG/USD bulls await sustained move beyond $23.00/38.2% Fibo.

Silver Price Analysis: XAG/USD bulls await sustained move beyond $23.00/38.2% Fibo.

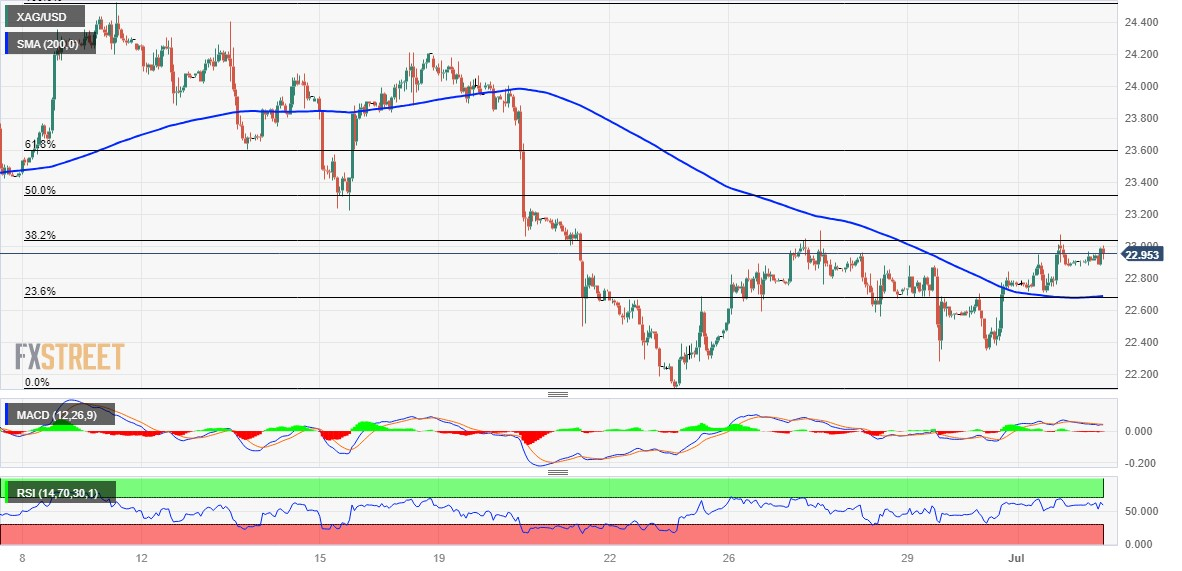
Silver trades with a mild positive bias for the third successive day on Tuesday, albeit lacks follow-through and remains below the $23.00 mark through the early European session.

From a technical perspective, the recent breakout through the $22.65-$22.70 confluence – comprising the 200-hour Simple Moving Average (SMA) and the 23.6% Fibonacci retracement level of the downfall from the June swing high – favours bullish traders. Moreover, oscillators on hourly charts are holding in the positive territory and are still far from being in the overbought zone, supporting prospects for some meaningful appreciating move for the XAG/USD.

That said, technical indicators on the daily chart – though have been recovering from lower levels – are yet to confirm the positive outlook and warrant some caution.  This makes it prudent to wait for sustaiend strength and acceptance beyond the $23.00 mark, nearing the 38.2% Fibo. level, before placing fresh bullish bets. This is followed by the $23.30 area, or the 50% Fibo., which if cleared decisively might trigger a fresh bout of a short-covering around the XAG/USD.

The subsequent move up has the potential to lift the white metal beyond the $23.60 intermediate hurdle, or the 61.8% Fibo. level, towards reclaiming the $24.00 round-figure mark. The upward trajectory could get extended further towards the $24.25 resistance en route to the $24.45-$24.50 supply zone, or the June monthly swing high.

On the flip side, the $22.70-$22.65 confluence resistance breakpoint now seems to protect the immediate downside. A convincing break below will be seen as a fresh trigger for bearish traders and drag the XAG/USD back towards the multi-month low, around the $22.10 region touched in June. Some follow-through selling below the $22.00 mark should pave the way for deeper losses towards the $21.70-$21.65 zone en route to the $21.25 support and the $21.00 mark.

Silver 1-hour chart

fxsoriginal

Asia Day Ahead: Soft Start to the New Quarter; Key Focus on RBA Rate Decision

Asia Day Ahead: Soft Start to the New Quarter; Key Focus on RBA Rate Decision

Major US indices drifted higher on lighter volume to deliver a positive start to the new quarter, as we head into the Independence Day holiday. Overnight, the US Institute for Supply Management (ISM) manufacturing Purchasing Managers’ Index (PMI) data has been mixed with a slight underperformance (46 versus 47 consensus). Some reasons to cheer may be the significant progress in pricing pressures for US manufacturers (41.8 versus 44.0 consensus) and some cooling of employment (48.1 versus 50.8 consensus), but new orders remained in contractionary territory for the 10 straight months as a reflection of some downside risks to growth ahead.

Along with stronger-than-expected US construction spending, expectations remained firm that the Fed will deliver its last 25 basis-point (bp) hike later this month to conclude its hiking cycle. US Treasury yields closed higher despite an initial dip, while the US dollar continues to show some signs of exhaustion with a subdued close.

Gold prices have been trading on a descending wedge pattern thus far, with a move below its support confluence at the US$1,940 in mid-June this year suggesting sellers taking control and leaves the near-term trend tilted to the downside. CFTC data has revealed further unwinding of net-long positioning from money managers last week. Thus far, the RSI on the daily chart has also struggled to reclaim its 50 level. Immediate support at the US$1,900 level will be crucial to hold next, with some dip-buying seen last week with the formation of a bullish pin bar. Failure for the US$1,900 level to hold could potentially pave the way to retest the US$1,850 level next.
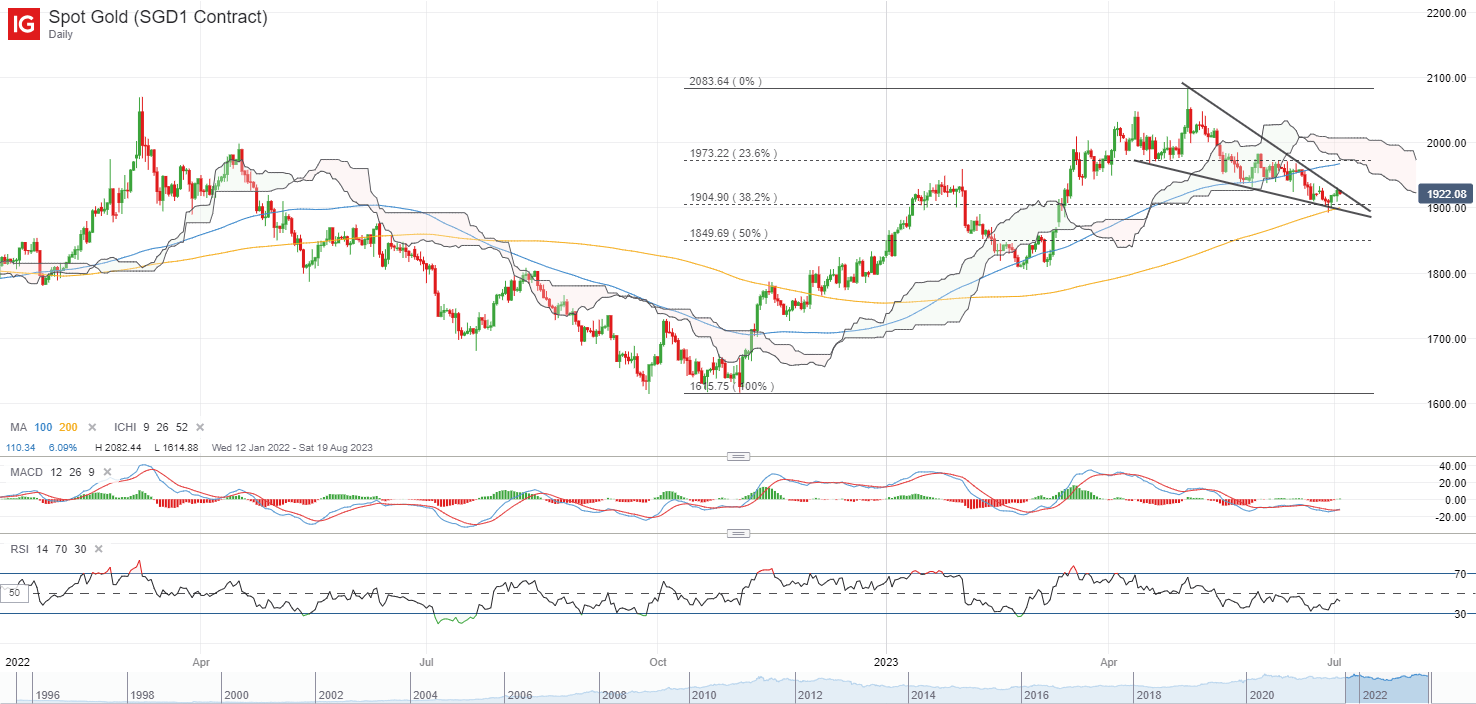
image1.png

Asia Open

Asian stocks look set for a mixed open, with Nikkei -1.06%, ASX +0.12% and KOSPI -0.11% at the time of writing. An upside surprise in China’s Caixin manufacturing PMI has paved the way for some gains in Chinese equities yesterday, with the Nasdaq Golden Dragon China Index up 2.1%, following a similar gain in the Hang Seng Index in the earlier session. The recent tit-for-tat move from China to restrict export of chip-making metals to US could take some focus, which may affect longer-term production rather than near-term impact. While it raises the prospects for more tit-for-tat escalation between US and China, tensions may still seem measured for now, as both economies are still trying to cope with their respective economic issues (US inflation, China’s growth).

The day ahead will bring focus to the Reserve Bank of Australia’s (RBA) interest rate decision. While the recent 13-month low in Australia’s May inflation data has anchored views of a potential rate pause at the upcoming meeting, markets are still pricing for any upcoming pause to be a temporary move as compared to the end of tightening. That will leave the policymakers’ guidance on close watch. Any acknowledgement of the recent downside surprise in inflation could raise hopes for a prolonged rate pause, but on the other hand, keeping its firm stance for additional tightening ahead could be seen as hawkish and provide an uplift for the AUD.

The AUD/USD is attempting to bounce off a previous resistance-turned-support trendline but much awaits for buyers, with the RSI still hanging below the 50 level while its 100-day MA serves as immediate resistance to overcome. Failure to hold the trendline support over the coming days at the 0.658 level could pave the way to retest its year-to-date low at the 0.646 level. On the upside, any reclaim of its 100-day MA will leave the key 0.680 level on watch.
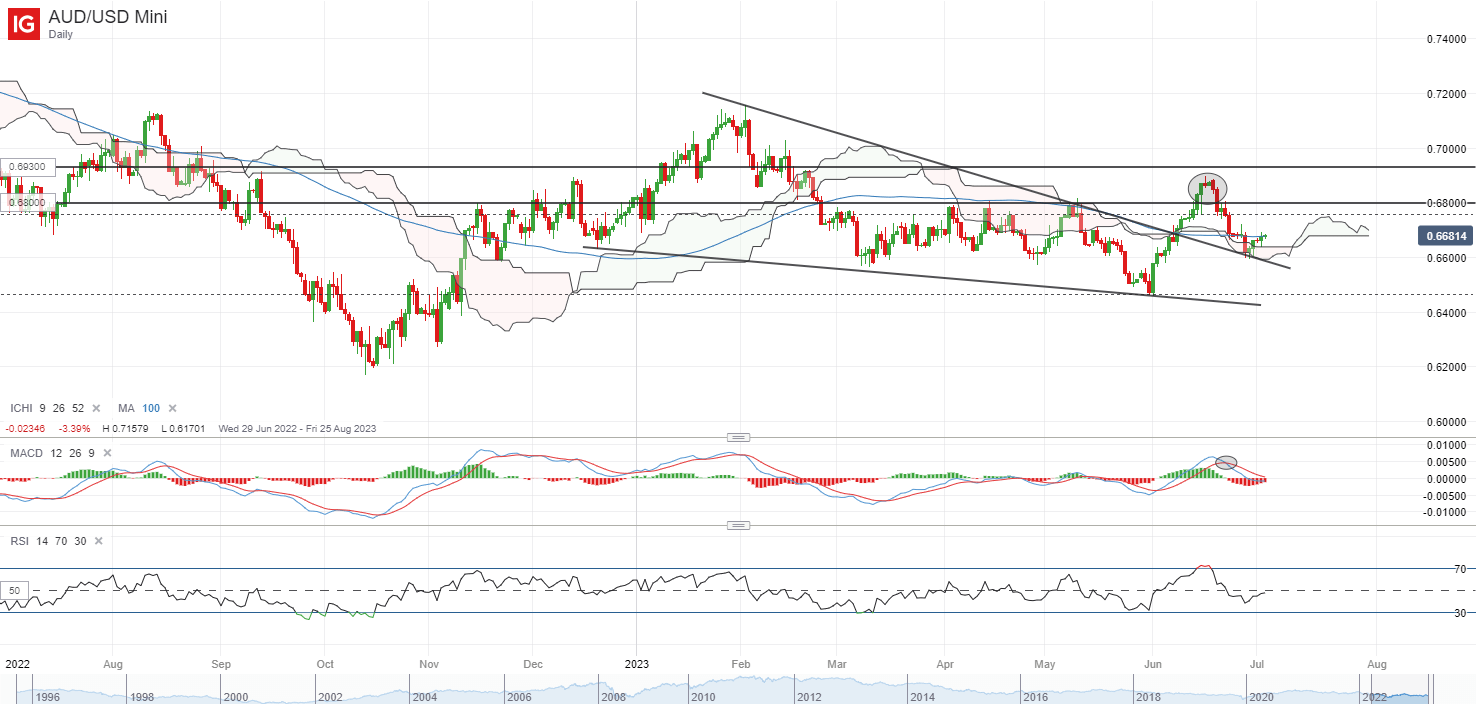
image2.png

On the watchlist: NZD/USD trading on descending channel pattern

Since the start of the year, the NZD/USD has been kept firmly within a descending channel pattern on the weekly chart, with the weekly RSI struggling to cross above the key 50 level as a reflection of sellers in control. The series of lower highs over the past year, along with a failure to move above its Ichimoku cloud resistance (weekly) on past three interactions, has kept a downward trend in place for now.

With New Zealand’s economy falling in a technical recession ahead of the US, the pressure for rate cuts may be mounting for the Reserve Bank of New Zealand (RBNZ) versus the US Fed, where pockets of economic resilience are still presented in the US. The US economic surprise index currently hangs at its three-month high.

Immediate resistance for buyers may be at the 0.625 level, where a resistance confluence stands (Ichimoku cloud, upper channel trendline, downward trendline resistance). Any reclaim of the 0.625 level could pave the way to retest the 0.654 level next. Until that occurs, the current downward bias remain, which could leave the lower channel support on watch at the 0.600 level.
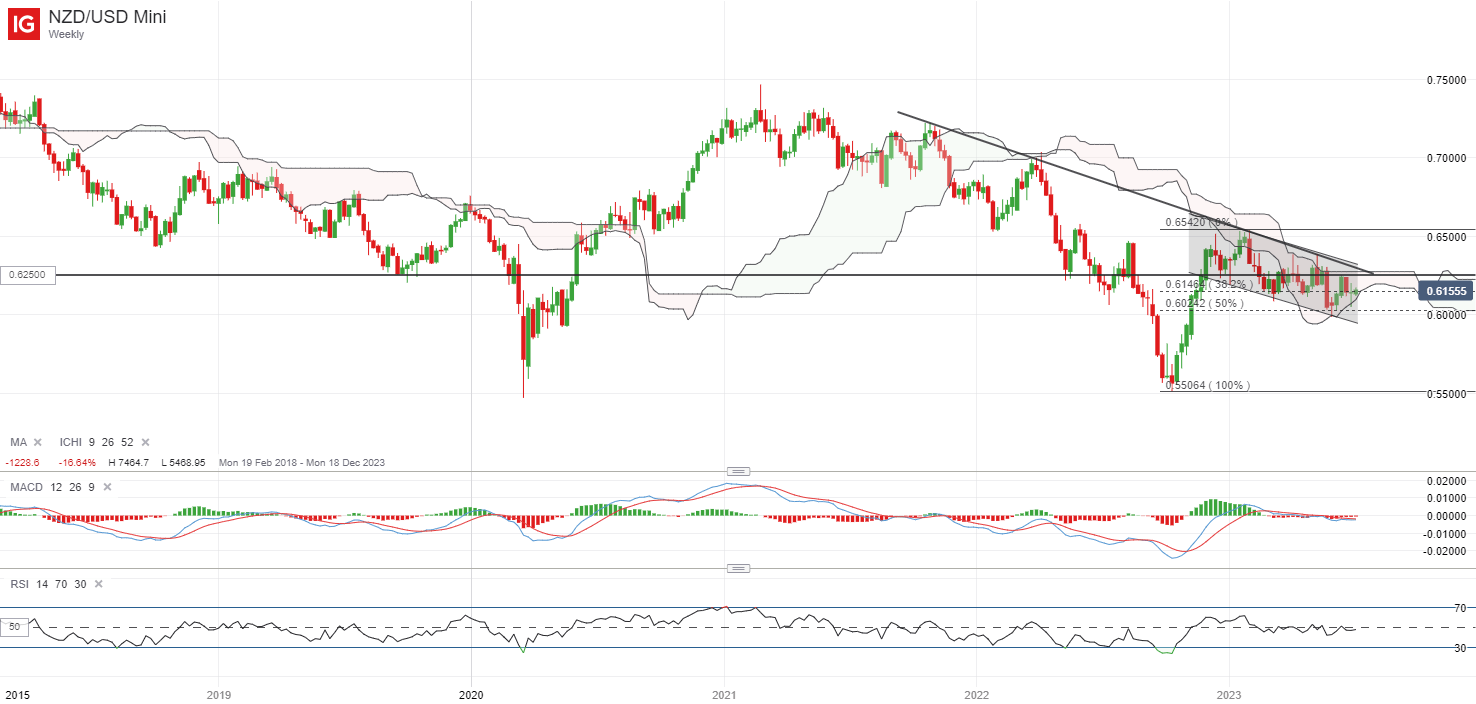

image3.png

Euro Ahead of US Jobs Data: EUR/USD, EUR/AUD, EUR/GBP Price Setups

Euro Ahead of US Jobs Data: EUR/USD, EUR/AUD, EUR/GBP Price Setups

The euro may have recouped some of its recent losses against some of its peers, but it would be premature to read the rebound as the start of a new leg higher for the single currency.

EUR has gained against its peers in June following the European Central Bank’s (ECB) hawkish hike last month and oversold conditions. However, further upside in EUR appears to be limited, particularly against USD, unless Euro area macro data starts to improve, or US jobs data disappoints.

Data published on Monday showed Euro area manufacturing activity contracted faster than initially thought in June, while US ISM manufacturing PMI dropped to the lowest level since mid-2020. However, looking beyond the start of the month manufacturing activity numbers, US macro data have been generally better than expected as reflected in the economic surprise index.In contrast, Euro area macro data has underwhelmed, giving USD a relative advantage on the growth front.

US non-farm payrolls are expected to have grown 225k in June, down from 339k in May, but the unemployment rate is expected to have eased to 3.6% from 3.7%. Better-than-expected jobs data could cement expectations for a Fed rate hike later this month, keeping EUR/USD’s upside capped. Rate futures are currently implying a 90% chance of a 25-basis point hike on July 26.

EUR/USD Weekly Chart

image1.png

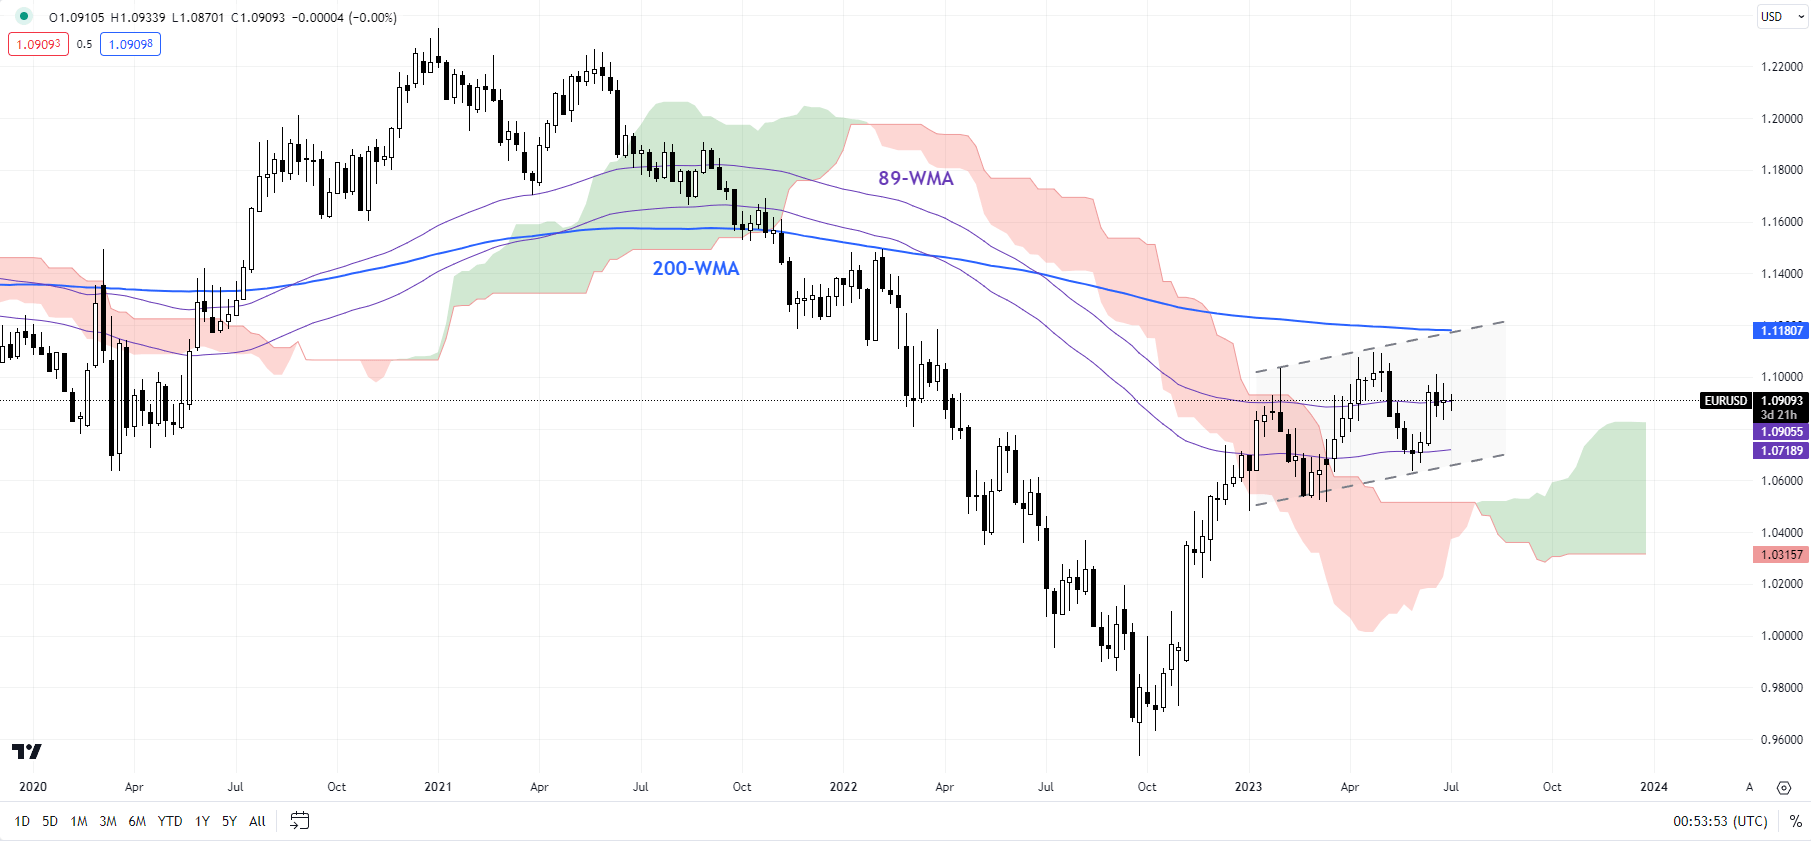
EUR/USD: Broader upward bias unchanged

On technical charts, the broader trend for EUR/USD remains up. However, the range price action could extend a bit further. The top end of the range is marked by the May high of 1.1100, while the bottom edge of the range is a horizontal trendline from January, at about 1.0480. A break below 1.0480 is needed for the broader upward pressure to ease.

EUR/GBP Daily Chart

image2.png

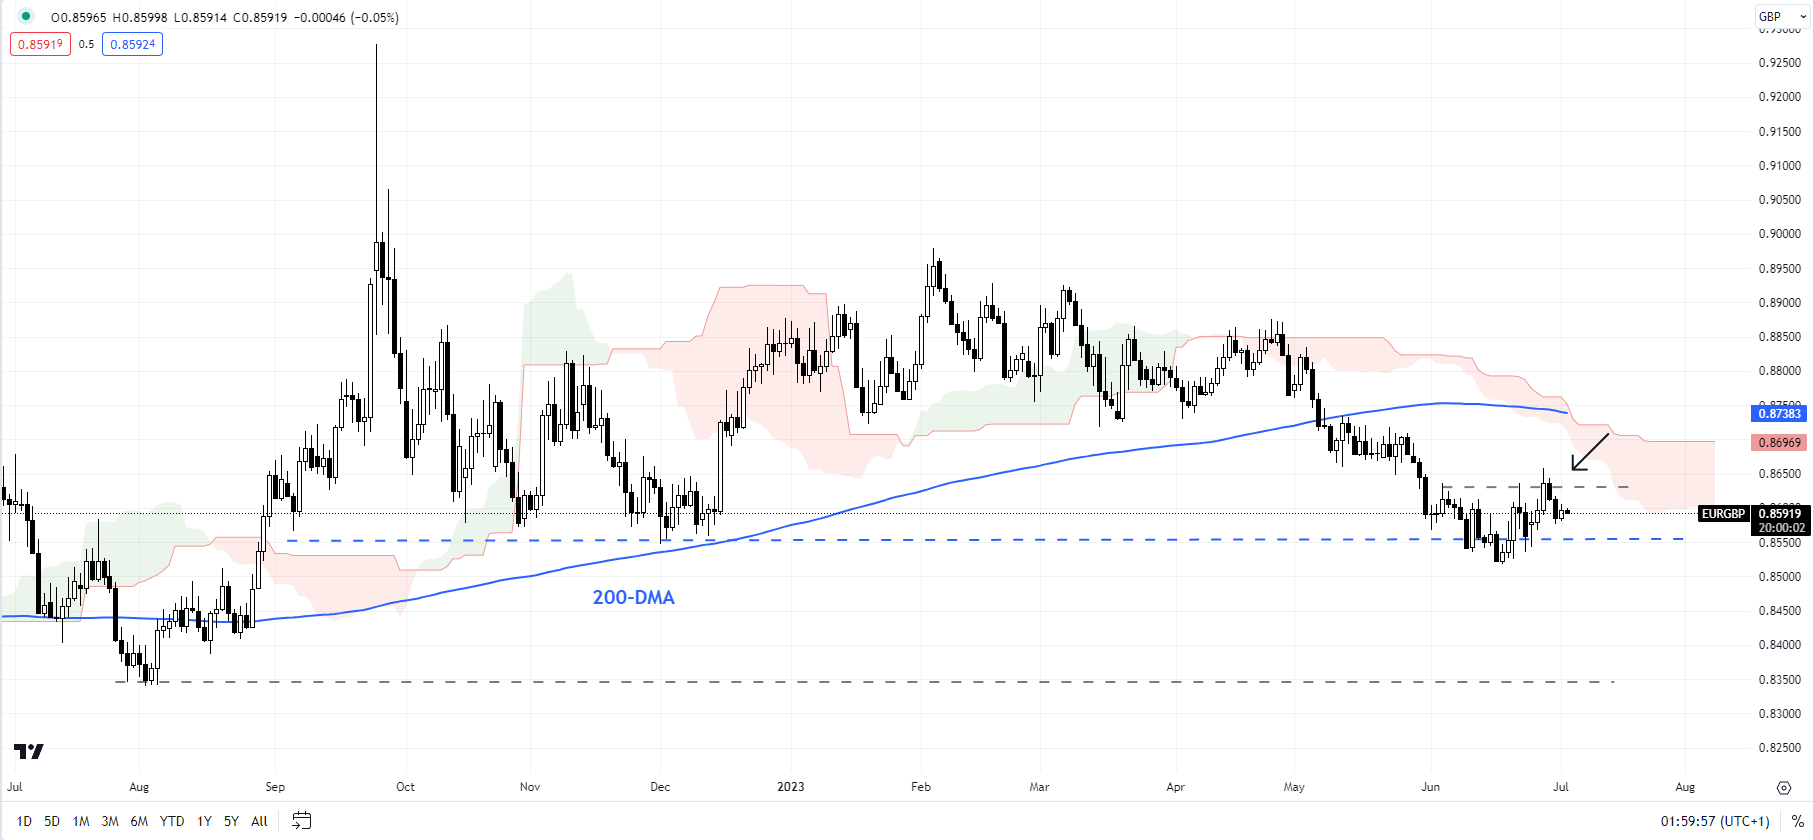
EUR/GBP: Upside capped

EUR/GBP has rebounded from oversold conditions – a possibility highlighted in the previous update “Euro After ECB Rate Hike: EUR/USD, EUR/AUD, EUR/GBP Price Setups”, published June 19. However, the upside in the cross could be capped given stiff hurdles at the mid-May low of 0.8660, roughly coinciding with the 89-day moving average. On the downside, a decisive break below 0.8545 could pave the way toward the August low of 0.8340.

EUR/AUD Daily Chart

image3.png

EUR/AUD: Due for a retreat?

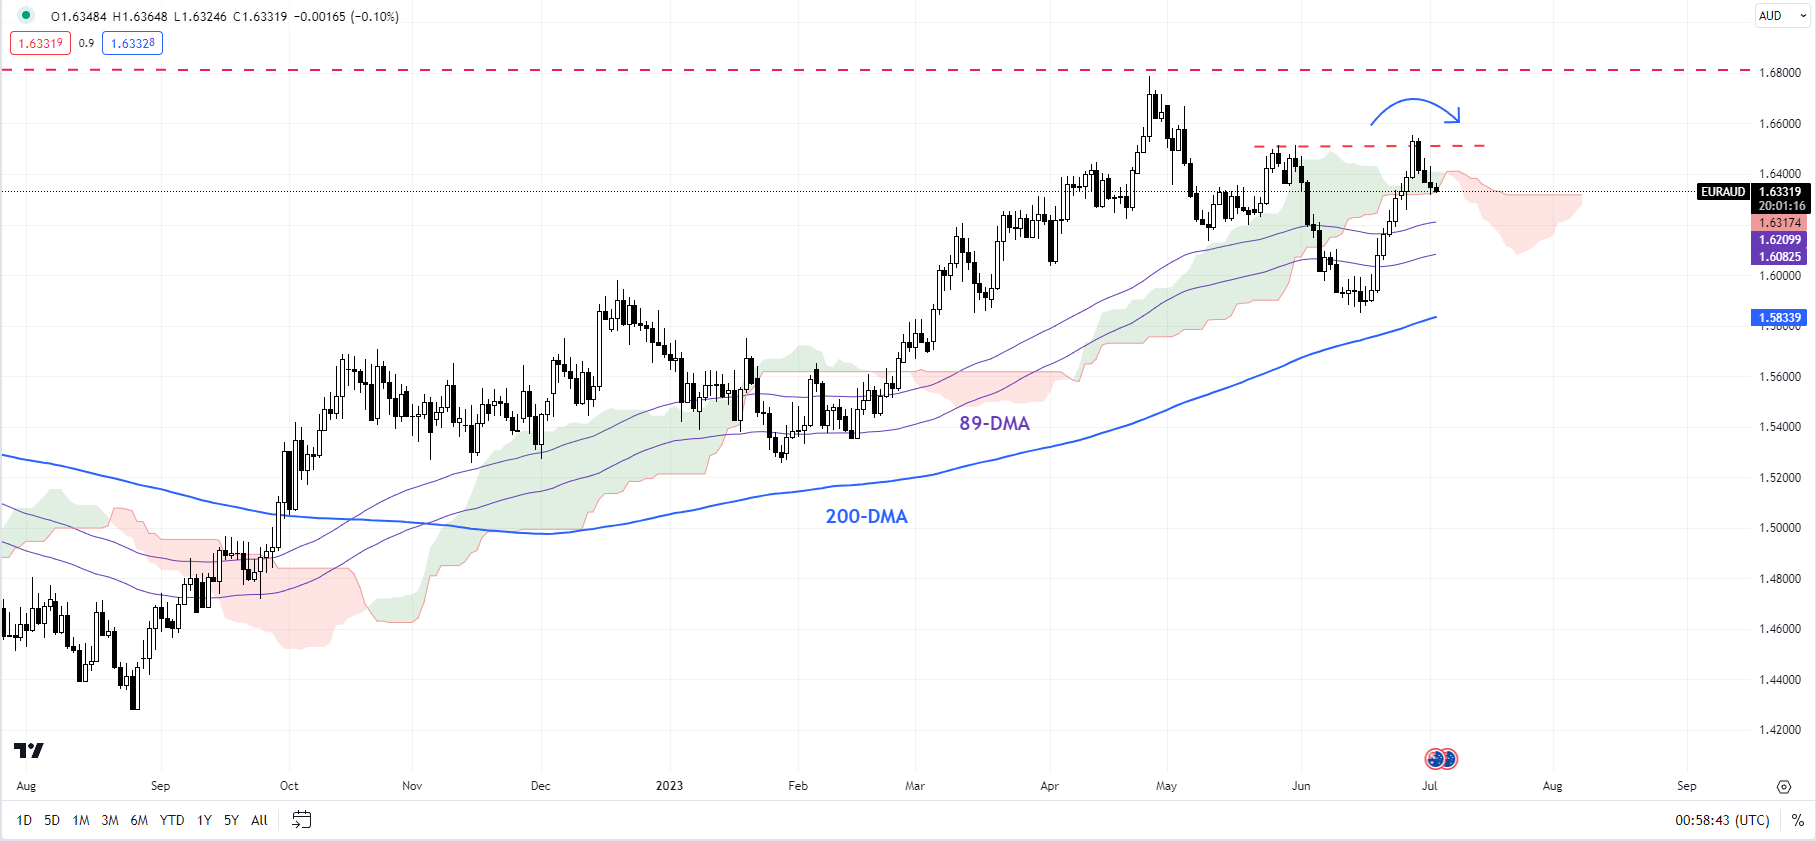
EUR/AUD has rebounded from near-strong support on the 200-day moving average – a possibility highlighted in the previous update “Euro After ECB Rate Hike: EUR/USD, EUR/AUD, EUR/GBP Price Setups”, published June 19. However, the cross has now run into a tough barrier at the end-May high of 1.6515, raising the prospect of a turn lower that could extend toward the 200-day moving average (now at about 1.5850).