Untitled

European Gas rally pauses amid Norwegian outages – ING

The rally in European natural gas took a breather yesterday, with the Title Transfer Facility (TTF) settling 0.66% lower on the day, ING’s commodity experts Ewa Manthey and Warren Patterson note.

TTF slips as storage builds, JKM spread narrows

“Some weakness in the JKM-TTF spread is dragging TTF lower. Meanwhile, outages in Norway have led to lower gas flows to Europe over the last week. The Troll field had power-related issues following maintenance last week; the outage might persist until this weekend.”

“EU gas storage continues to tick higher, standing at just under 47% full, down from 69% at the same stage last year and below the 5-year average of 58% full.”

Untitled

Gold price holds above $3,300, upside seems capped amid modest USD strength, ahead of FOMC Minutes

Gold price (XAU/USD) attracts some dip-buyers on Wednesday and reverses a part of the previous day’s heavy losses, though it lacks bullish conviction amid mixed cues. The uncertainty surrounding US President Donald Trump’s trade tariffs, US fiscal concerns, and geopolitical risks keep a lid on the market optimism, which, in turn, revive demand for the safe-haven bullion. Apart from this, bets that the Federal Reserve (Fed) will cut rates further in 2025 act as a tailwind for the non-yielding yellow metal.

Meanwhile, Tuesday’s better-than-expected US economic releases assist the US Dollar (USD) to gain positive traction for the second straight day. This, along with a generally positive tone around the equity markets, contributes to capping gains for the Gold price. Traders also seem reluctant to place aggressive directional bets around the XAU/USD pair and now look to FOMC Minutes for some meaningful impetus. This, in turn, warrants some caution before positioning for the resumption of the recent uptrend.

Gold price bounces off 200-SMA pivotal support on H4; not out of the woods yet
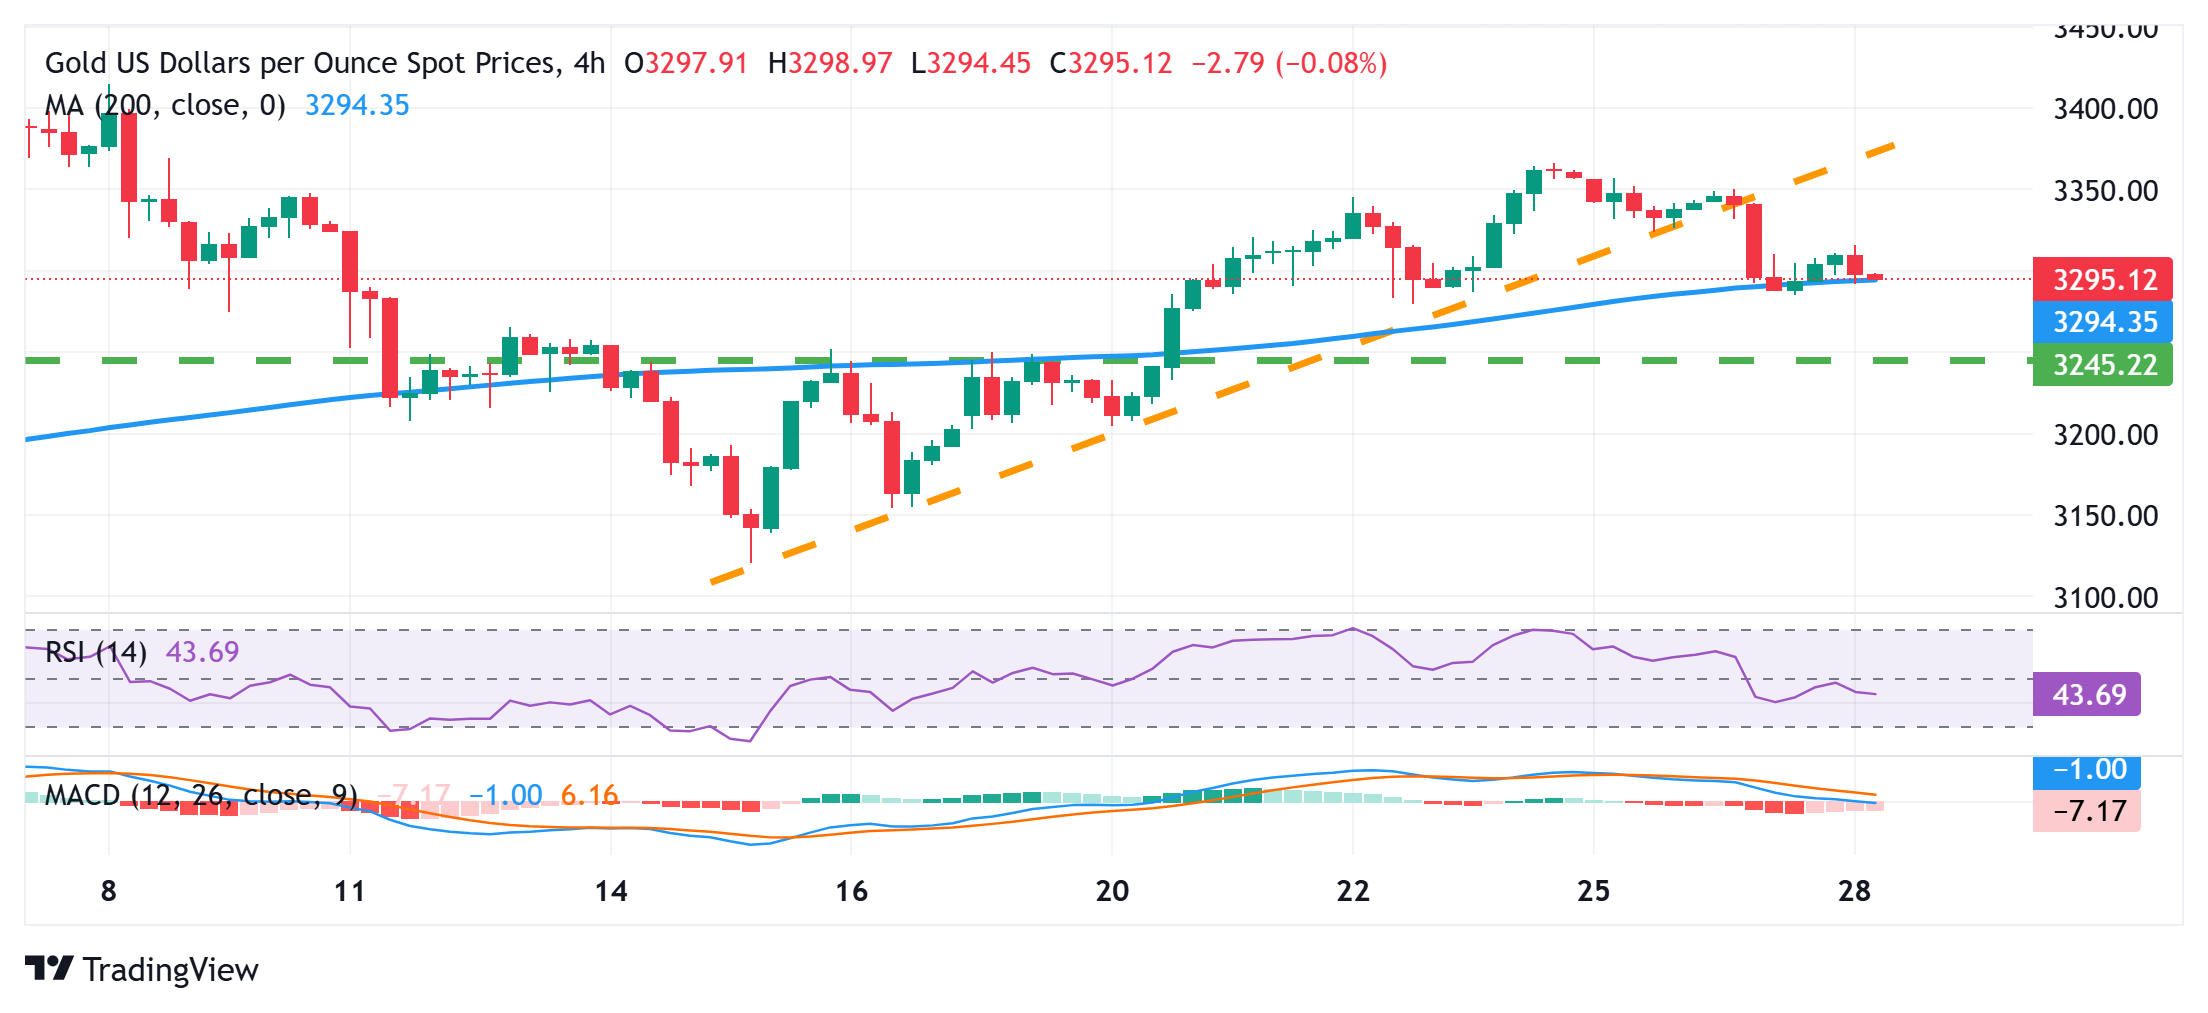
From a technical perspective, the overnight breakdown through a short-term ascending trend line was seen as a key trigger for bearish traders. Some follow-through selling below the 200-period Simple Moving Average (SMA) and acceptance below the $3,300 mark will reaffirm the negative bias. However, oscillators on the daily chart – though they have been losing traction – are yet to confirm the negative outlook. Hence, any subsequent fall could attract some buyers and find decent support near the $3,250-3,245 horizontal zone. The latter should act as a pivotal point, which if broken would set the stage for a further near-term depreciating move for the Gold price.

On the flip side, momentum beyond the Asian session peak, around the $3,315-3,316 area, now seems to confront some hurdle near the $3,340-3,345 region. The latter coincides with the ascending trend-line breakpoint, above which a fresh bout of a short-covering could lift the Gold price to over a two-week high, around the $3,365-3,366 zone touched last Friday. The subsequent move up should allow the XAU/USD pair to reclaim the A sustained strength beyond would be seen as a fresh trigger for bulls and should allow the Gold price to reclaim the $3,400 mark and climb further to the next relevant barrier near the $3,465-3,470 zone.


Untitled

GBP a relative outperformer despite softer CBI data – Scotiabank

Pound Sterling (GBP) is soft, down 0.15% against the US Dollar (USD) while showing relative outperformance against the G10 currencies, Scotiabank’s Chief FX Strategist Shaun Osborne notes.

Trend for GBP/USD is bullish

“Domestic data were weak, with CBI reported sales figures for May reflecting a sizeable deterioration. The near-term data release calendar remains limited and rate expectations remain steady, with markets pricing a minimal chance of a 25bpt cut in June and 39bpts of easing by December.”

“The trend for GBP/USD is bullish, given the sequence of higher lows and higher highs, as well as the recent push to fresh multiyear highs. The momentum indicators are bullish, providing confirmation to the moves in the spot, and the RSI’s current reading of 64 leaves ample space for further upside. We look to near-term support at 1.35 and near-term resistance at 1.36.”

eurozone-02_Small

Oil prices remain stable: Possible production increases here and sanctions policy there – Commerzbank

The oil market is showing strength ahead of the OPEC+ meeting and the production decision due on Saturday by the eight cartel members who voluntarily cut production and are now considering a further significant withdrawal of these cuts in July, Commerzbank’s commodity analyst Barbara Lambrecht notes.

Brent crude oil prices fall

“A barrel of Brent crude oil cost $65 again yesterday, although trading was thinner due to public holidays in the US and the UK. The strength is likely due to relief that the threat of new US tariffs against the EU has been postponed for the time being. However, many uncertainties remain, especially with regard to (US) sanctions policy.”

“On the one hand, there are the nuclear negotiations between the US and Iran. Although these were so far inconclusive, both sides remained optimistic after the fifth round of talks and want to meet again in the near future. A possible easing of sanctions against Iran therefore remains on the table.”

“On the other hand, however, the mood between Russian President Putin and US President Trump has deteriorated: following Russia’s massive attacks on Ukraine, Trump has reiterated that he will absolutely consider new sanctions against Russia. Russia, however, seems keen to play down Trump’s reaction.”

Untitled

EUR/CAD hesitates above 1.5600 with higher Oil prices supporting the loonie

The Euro is trading without a clear direction, as the enthusiasm of the delay on Trump’s 50% tariffs wears out, while the moderate rebound on Oil prices is providing some support to the loonie.

The pair has been losing momentum after hitting one-month highs, right above 1.5750 last week, yet with downside attempts contained above 1.5880 so far.

Mixed Eurozone data and dovish comments from ECB’s Villeroy

In the macroeconomic domain, Eurozone data has been mixed. The German GFK consumer Confidence Index remained at downbeat levels, while the Eurozone Economic Sentiment and Industrial Confidence figures have shown a moderate improvement.

Earlier today, ECB’s Villeroy struck a dovish tone, noting that there is still room for further monetary easing and warning about the potential impact of a trade war on the Eurozone’s financial stability and economic growth prospects.

The Canadian Dollar, on the other hand, is firming up on the back of a moderate pickup in Oil prices.

Beyond that, the positive Retail Sales data released on Friday has eased concerns triggered by the weak employment figures seen earlier this month, and prompted investors to dial back BoC easing expectations for next month.

Canadian Dollar PRICE Today

The table below shows the percentage change of Canadian Dollar (CAD) against listed major currencies today. Canadian Dollar was the strongest against the New Zealand Dollar.

USD EUR GBP JPY CAD AUD NZD CHF
USD 0.34% 0.17% 0.71% 0.19% 0.65% 0.77% 0.60%
EUR -0.34% -0.18% 0.36% -0.14% 0.22% 0.34% 0.24%
GBP -0.17% 0.18% 0.57% 0.03% 0.38% 0.51% 0.38%
JPY -0.71% -0.36% -0.57% -0.48% -0.06% -0.00% -0.10%
CAD -0.19% 0.14% -0.03% 0.48% 0.43% 0.49% 0.35%
AUD -0.65% -0.22% -0.38% 0.06% -0.43% 0.03% -0.10%
NZD -0.77% -0.34% -0.51% 0.00% -0.49% -0.03% -0.16%
CHF -0.60% -0.24% -0.38% 0.10% -0.35% 0.10% 0.16%

The heat map shows percentage changes of major currencies against each other. The base currency is picked from the left column, while the quote currency is picked from the top row. For example, if you pick the Canadian Dollar from the left column and move along the horizontal line to the US Dollar, the percentage change displayed in the box will represent CAD (base)/USD (quote).

gold

Gold faces headwinds with US-EU talks and a stronger Greenback in focus

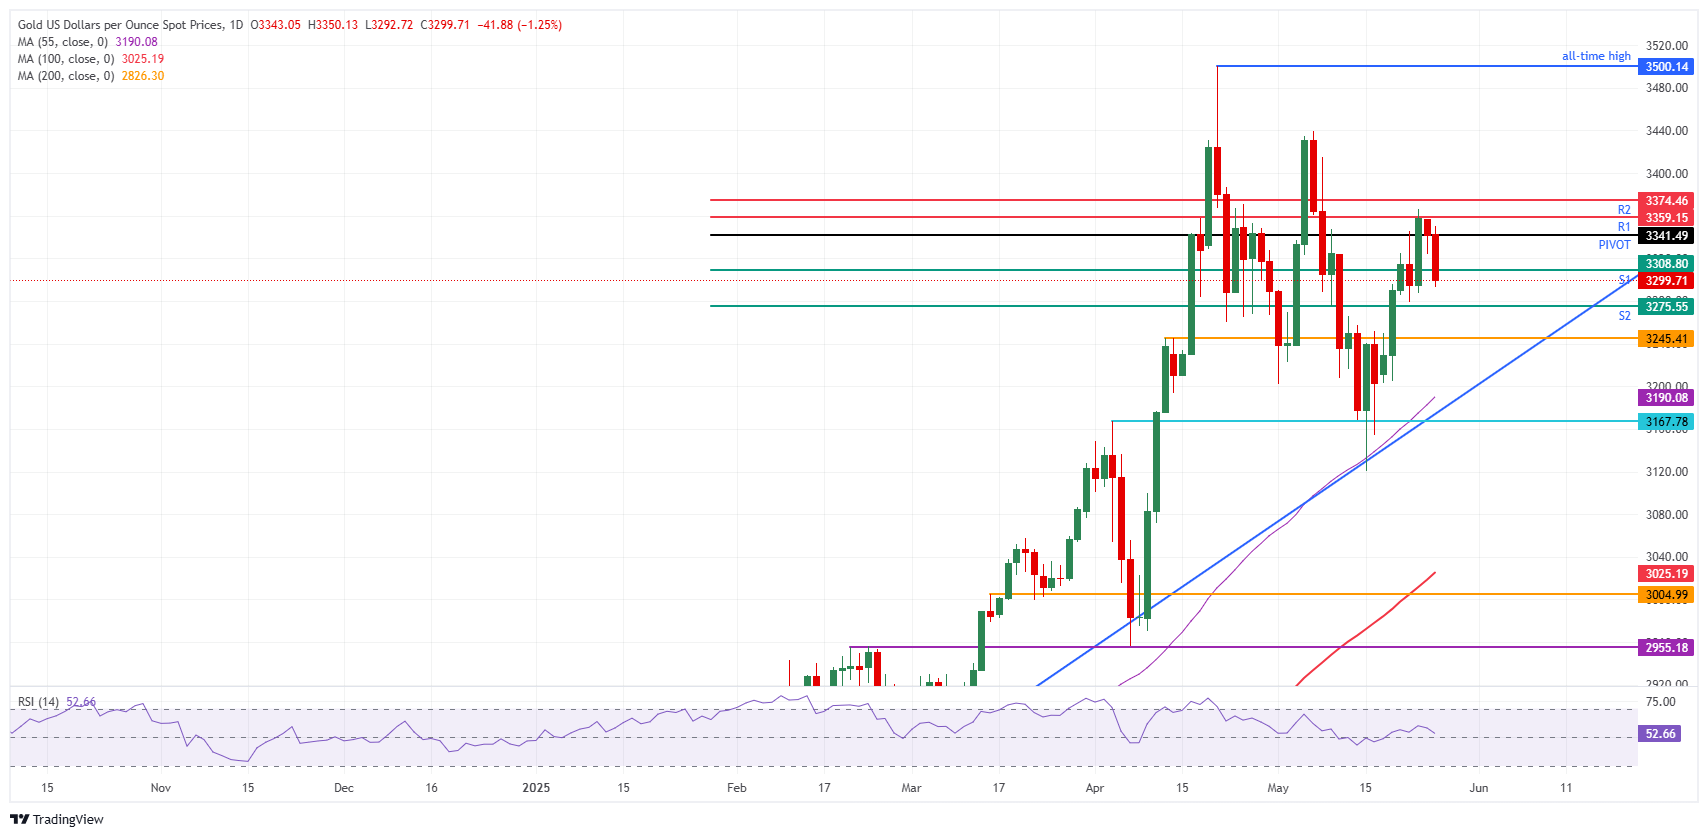
Gold (XAU/USD) price sees losses grow on Tuesday, sliding below the $3,300 mark at the time of writing on Tuesday as improving risk-on mood and a stronger US Dollar (USD) are creating some issues for the Gold rally. Gold extends its decline for a second day this week as the US dollar caught up with some gains and demand for haven assets cooled, with investors also weighing prospects for improving trade relations between the US and the EU after US President Donald Trump said on Sunday that he agreed to an extension on the 50% tariff deadline on the European Union (EU) until July 9.

The stronger USD gained momentum at the end of Asian trading after the Japanese Ministry of Finance (MoF) stated that its bond issuance plan might see some tweaking, with lower volumes. This made Japanese yields collapse and saw the Japanese Yen (JPY) devalue against the US Dollar, triggering a spillover effect in favor of the Greenback against several other major currencies. A stronger US Dollar makes Gold more expensive for most buyers, and thus it is seen as a headwind.

Gold Price Technical Analysis: Support not there yet

Some downside pressure appears on Gold’s price this week. The headwinds mentioned above could be proven quite persistent, as the US Dollar has already experienced a long stretch of devaluation and is due for some recovery at the expense of the precious metal. Add some more possible positive signs on trade talks, and any prospects of Gold extending its highs might fall short of expectations.

On the upside, the daily Pivot Point at $3,341 is the first level to look out for, followed by the R1 resistance at $3,359. Further up, the R2 resistance at $3,374 follows not far behind and could open the door for a return to the $3,400 round level and potentially further course to $3,440, coinciding with May 6 and May 7 peaks.

On the other side, some thick-layered support emerges in case the Gold price declines. In case the $3,300 mark breaks, some intermediary support could come from the S2 support at $3,275. Further below, there is a technical pivotal level at $3,245 (April 11 high).

XAU/USD: Daily Chart

images

EUR/USD stays pressred near 1.1350 as US Dollar finds demand ahead of data

EUR/USD holds sizeable losses near 1.1350 in European trading on Tuesday. The pair declines as the US Dollar recovers from EU-US tariffs delay-led sell-off ahead of the mid-tier US economic data and the Senate tax debate.

The Relative Strength Index (RSI) indicator on the 4-hour chart declined toward 50 and EUR/USD closed the last 4-hour candle slightly below the 20-period Simple Moving Average (SMA), reflecting a loss of bullish momentum.

On the downside, the 200-period SMA aligns as immediate support at 1.1315 before 1.1270 (Fibonacci 38.2% retracement of the latest uptrend, 20-day SMA, 100-period SMA) and 1.1180 (Fibonacci 50% retracement).

Looking north, resistance levels could be spotted at 1.1380 (Fibonacci 23.6% retracement), 1.1430 (static level) and 1.1500 (static level, round level).

Dovish comments from European Central Bank (ECB) policymakers and improving risk mood makes it difficult for EUR/USD to hold its ground.

ECB policymaker Francois Villeroy de Galhau argued on Tuesday that policy normalization in the Eurozone is not complete and ECB Governing Council member Gediminas Šimkus said that the risks that inflation in the Euro area will be below the ECB’s target in the future have increased. On the flip side, Minneapolis Federal Reserve (Fed) President Neel Kashkari noted that he supports the stance to maintain interest rates until there is some more clarity on the impact of higher tariffs on inflation, highlighting the policy divergence between the Fed and the ECB.

Meanwhile, US stock index futures rise more than 1% on the day following the Memorial Day holiday. US President Donald Trump’s decision to grant an extension to the 50% tariff deadline on the European Union (EU) until July 9 seems to be easing market fears over a deepening conflict between the EU and the US, helping the USD stay resilient against its rivals. Additionally, a spokesperson for the European Commission said on Monday that the EU’s ‘zero-for-zero’ proposal is still on the table in negotiations with the US.

In the second half of the day, the US economic calendar will feature Durable Goods Orders data for April and the Conference Board’s Consumer Confidence Index for May. A noticeable improvement in consumer sentiment could provide an additional boost to the USD and trigger another leg lower in EUR/USD.

Untitled

EUR/USD sticks to gains near 1.1400 as Trump extends EU tariff deadline

EUR/USD consoldiates latest gains near 1.1400 in the European session on Monday. The pair draws support from persistent US Dollar weakness and US President Donald Trump’s extension of the 50% tariff deadline on the European Union (EU) until July 9.

The US Dollar (USD) struggled to find demand last week amid growing concerns over United States (US) President Donald Trump’s tax bill causing the federal debt to remain on an unsustainable path. Additionally, Trump’s renewed tariff threats further weighed on the USD and helped EUR/USD push higher heading into the weekend.

President Trump said on Friday that their discussions with the European Union (EU) were going nowhere and noted that he is recommending a “straight 50% tariff” on imports from the EU. Moreover, Trump noted that he is planning to impose tariffs on Apple iPhones not manufactured in the US and suggested that they could put Samsung products under the same application.

On Sunday, Trump announced that he agreed to extend the tariff deadline on European imports until July 9 after he held a phone conversation with European Commission President Ursula von der Leyen. This headline failed to help the USD stage a rebound to start the week.

Financial markets in the US will remain closed in observance of the Memorial Day holiday on Monday. Hence, thin trading volumes could cause EUR/USD’s action to remain subdued in the second half of the day.

On Tuesday, the European Commission will release consumer and business sentiment data. Later in the day, the US economic calendar will feature Durable Goods Orders data for April and the Conference Board’s Consumer Confidence Index for May.

yyhy

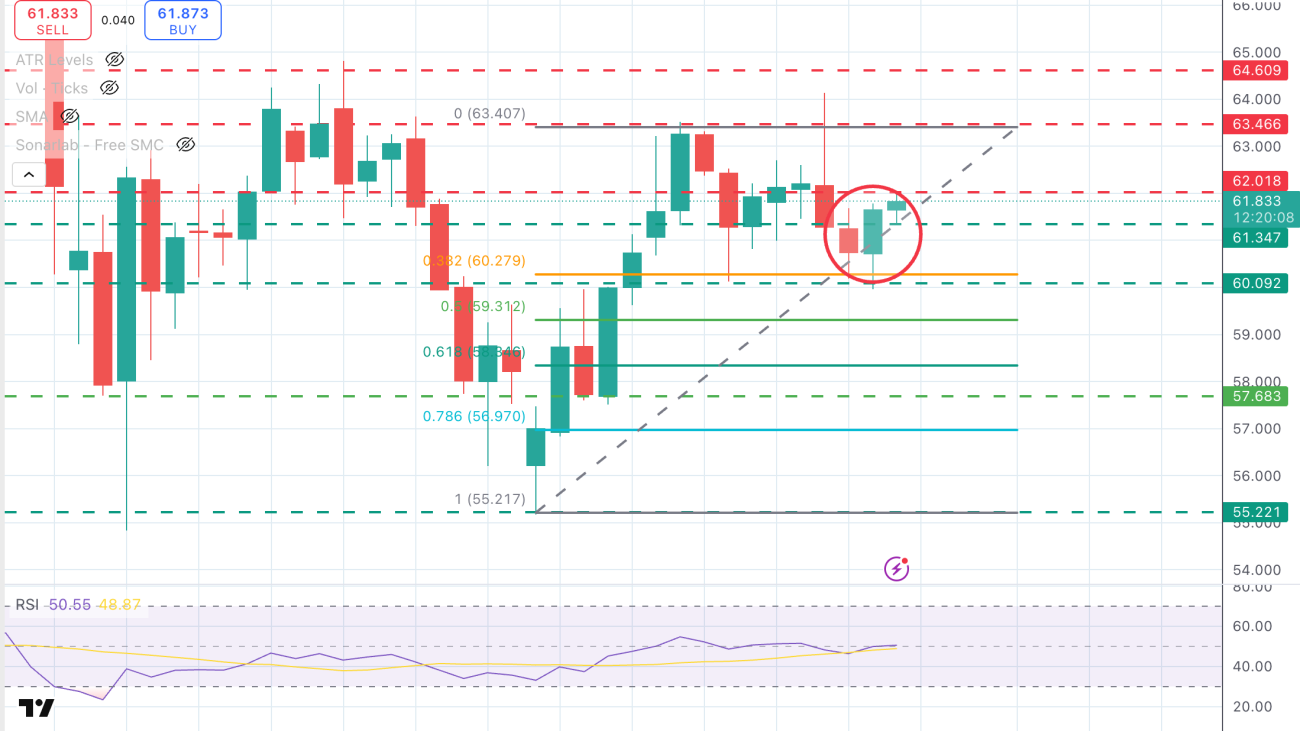
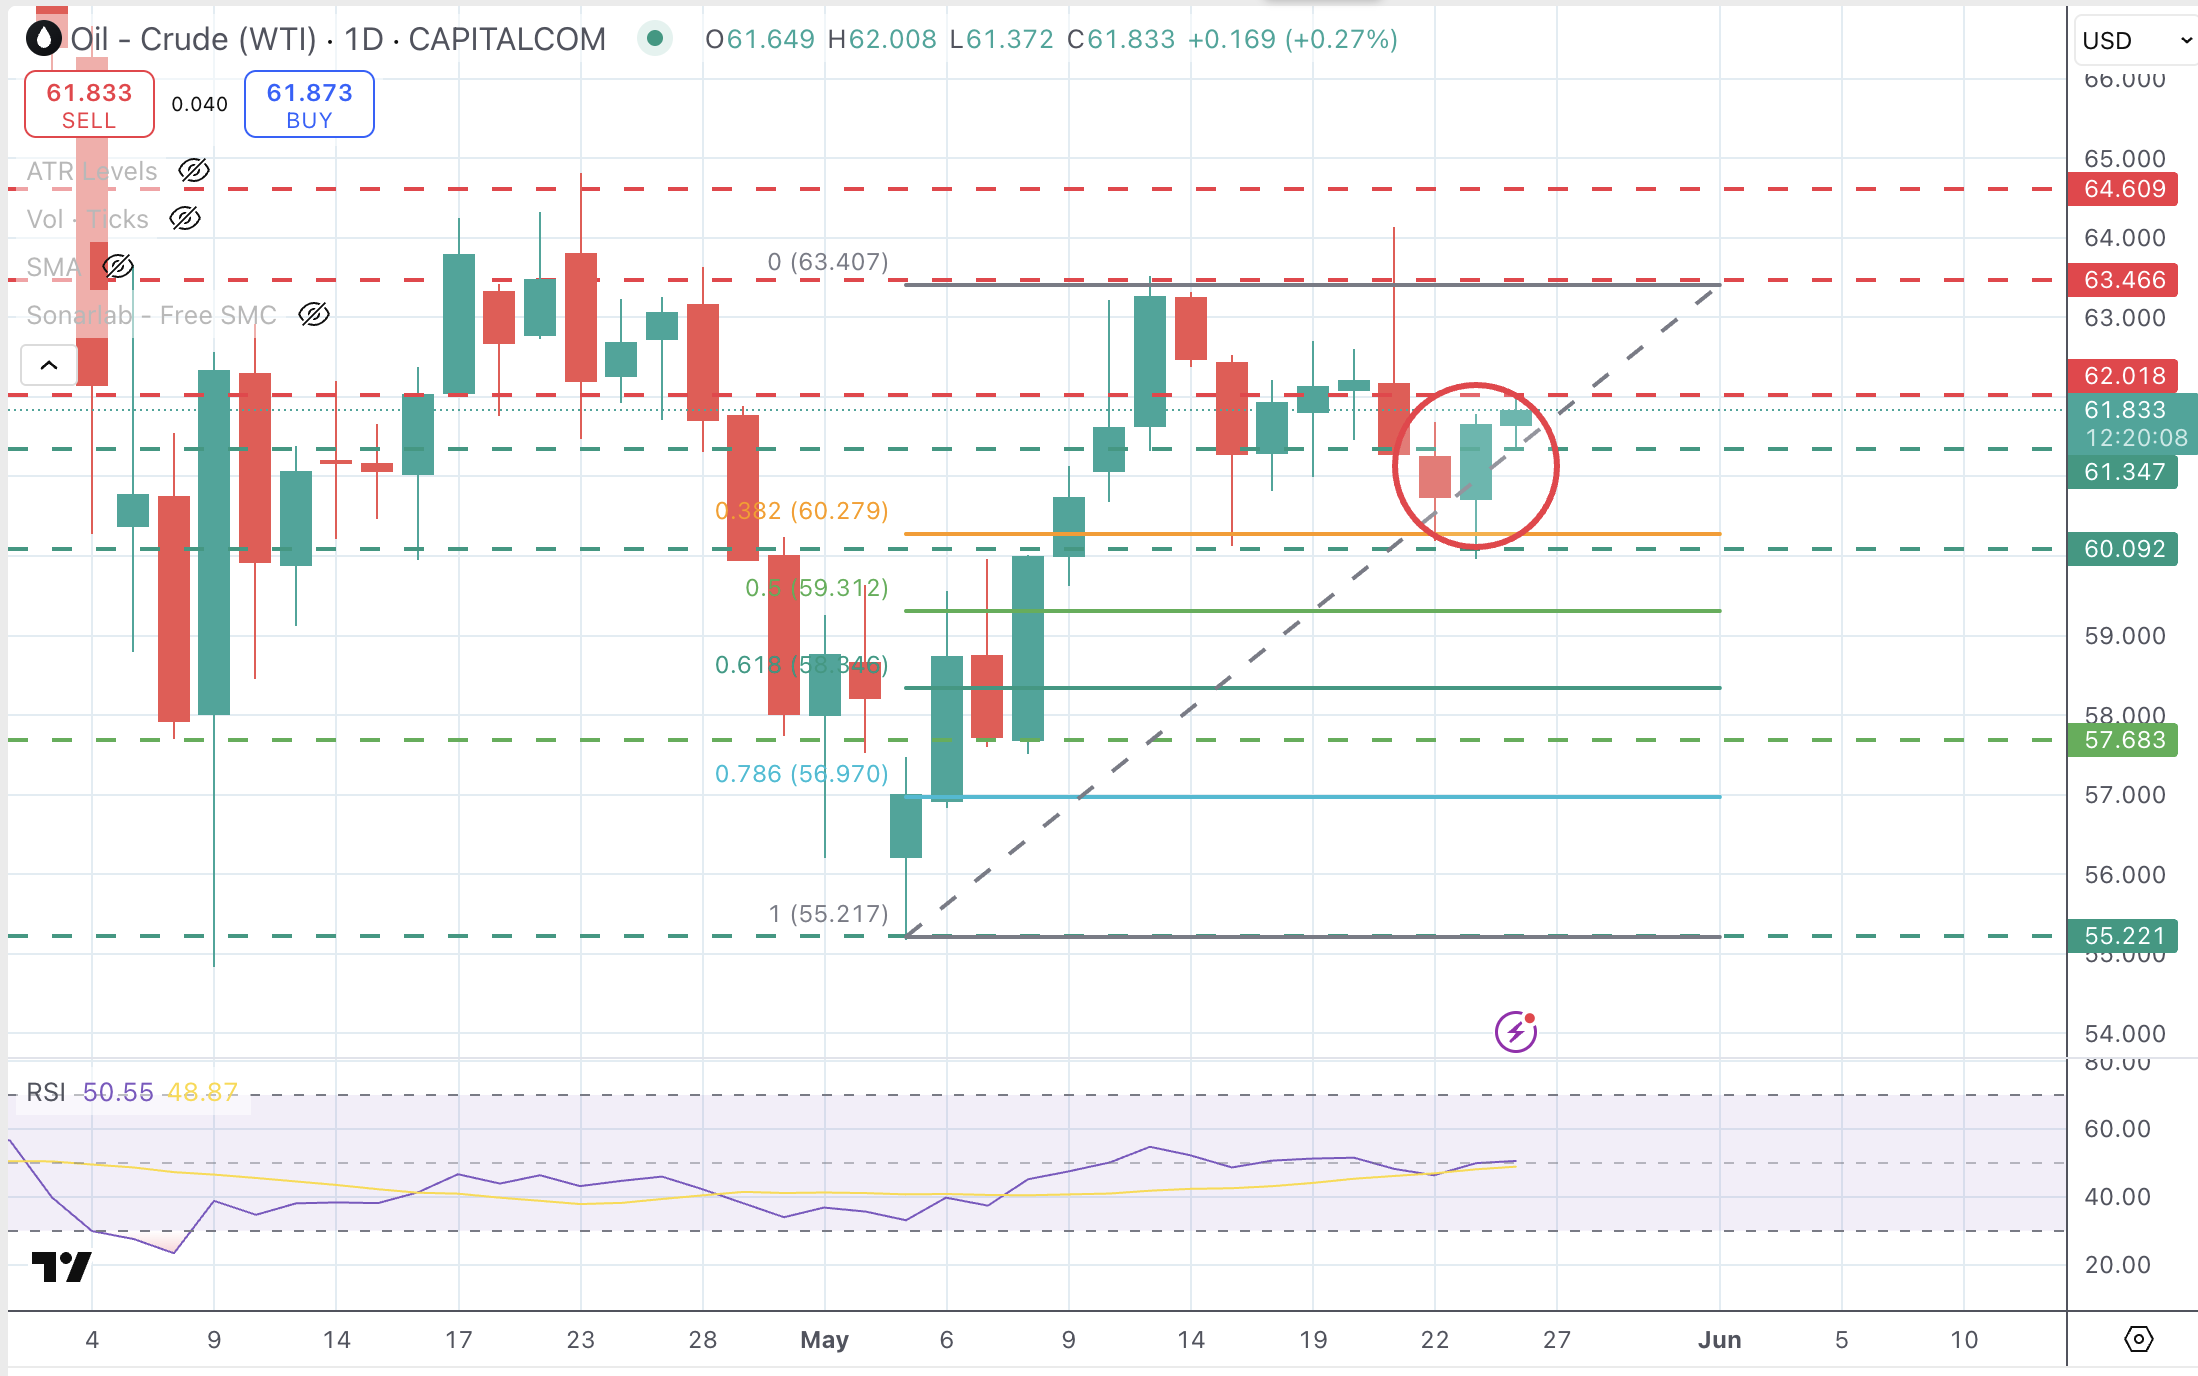
WTI Oil consolidates above $61.30 on easing global trade fears and geopolitical tensions

Oil prices are standing comfortably above $61.30, supported by US President Trump’s decision to put tariffs on Eurozone imports on hold until July 9th and escalating tensions in Gaza, but oversupply worries are limiting gains.

Trump backed off on Friday’s threat to impose 50% levies on EU imports from next week, after a phone call with EU Commission President Ursula von der Leyen. The market has welcomed the news, as a trade rift between the US and the EU would significantly slash global growth and curb oil demand expectations.

On the geopolitical front, Israel keeps pounding an already devastated Gaza Strip. A recent report talks about an attack on a school killing 36, many of them Children. This news raises tensions in the area, which, coupled with the lack of advances on the US negotiations with Iran, are keeping Oil prices from falling further.

WTI Oil Daily Chart

WTI Oil Daily Chart


gold-bar-and-dollar-bills-42586628_XtraLarge

Gold price retains intraday negative bias; bullish bias remains amid broadly weaker USD

Gold price (XAU/USD) remains depressed as the latest optimism led by US President Donald Trump’s decision to delay the implementation of tariffs on the European Union (EU) continues to undermine safe-haven assets. However, a combination of factors acts as a tailwind for the commodity and warrants some caution before positioning for any meaningful corrective decline from over a two-week high touched on Friday.

Investors remain on edge amid worries over the worsening US fiscal health. Apart from this, bets that the Federal Reserve (Fed) will cut rates further in 2025 drag the US Dollar (USD) to over a one-month low and lend some support to the non-yielding yellow metal. Apart from this, persistent geopolitical risks stemming from the protracted Russia-Ukraine war and conflicts in the Middle East limit losses for the precious metal.

Gold price dips towards ascending trend-line support near $3,325 could be seen as a buying opportunity

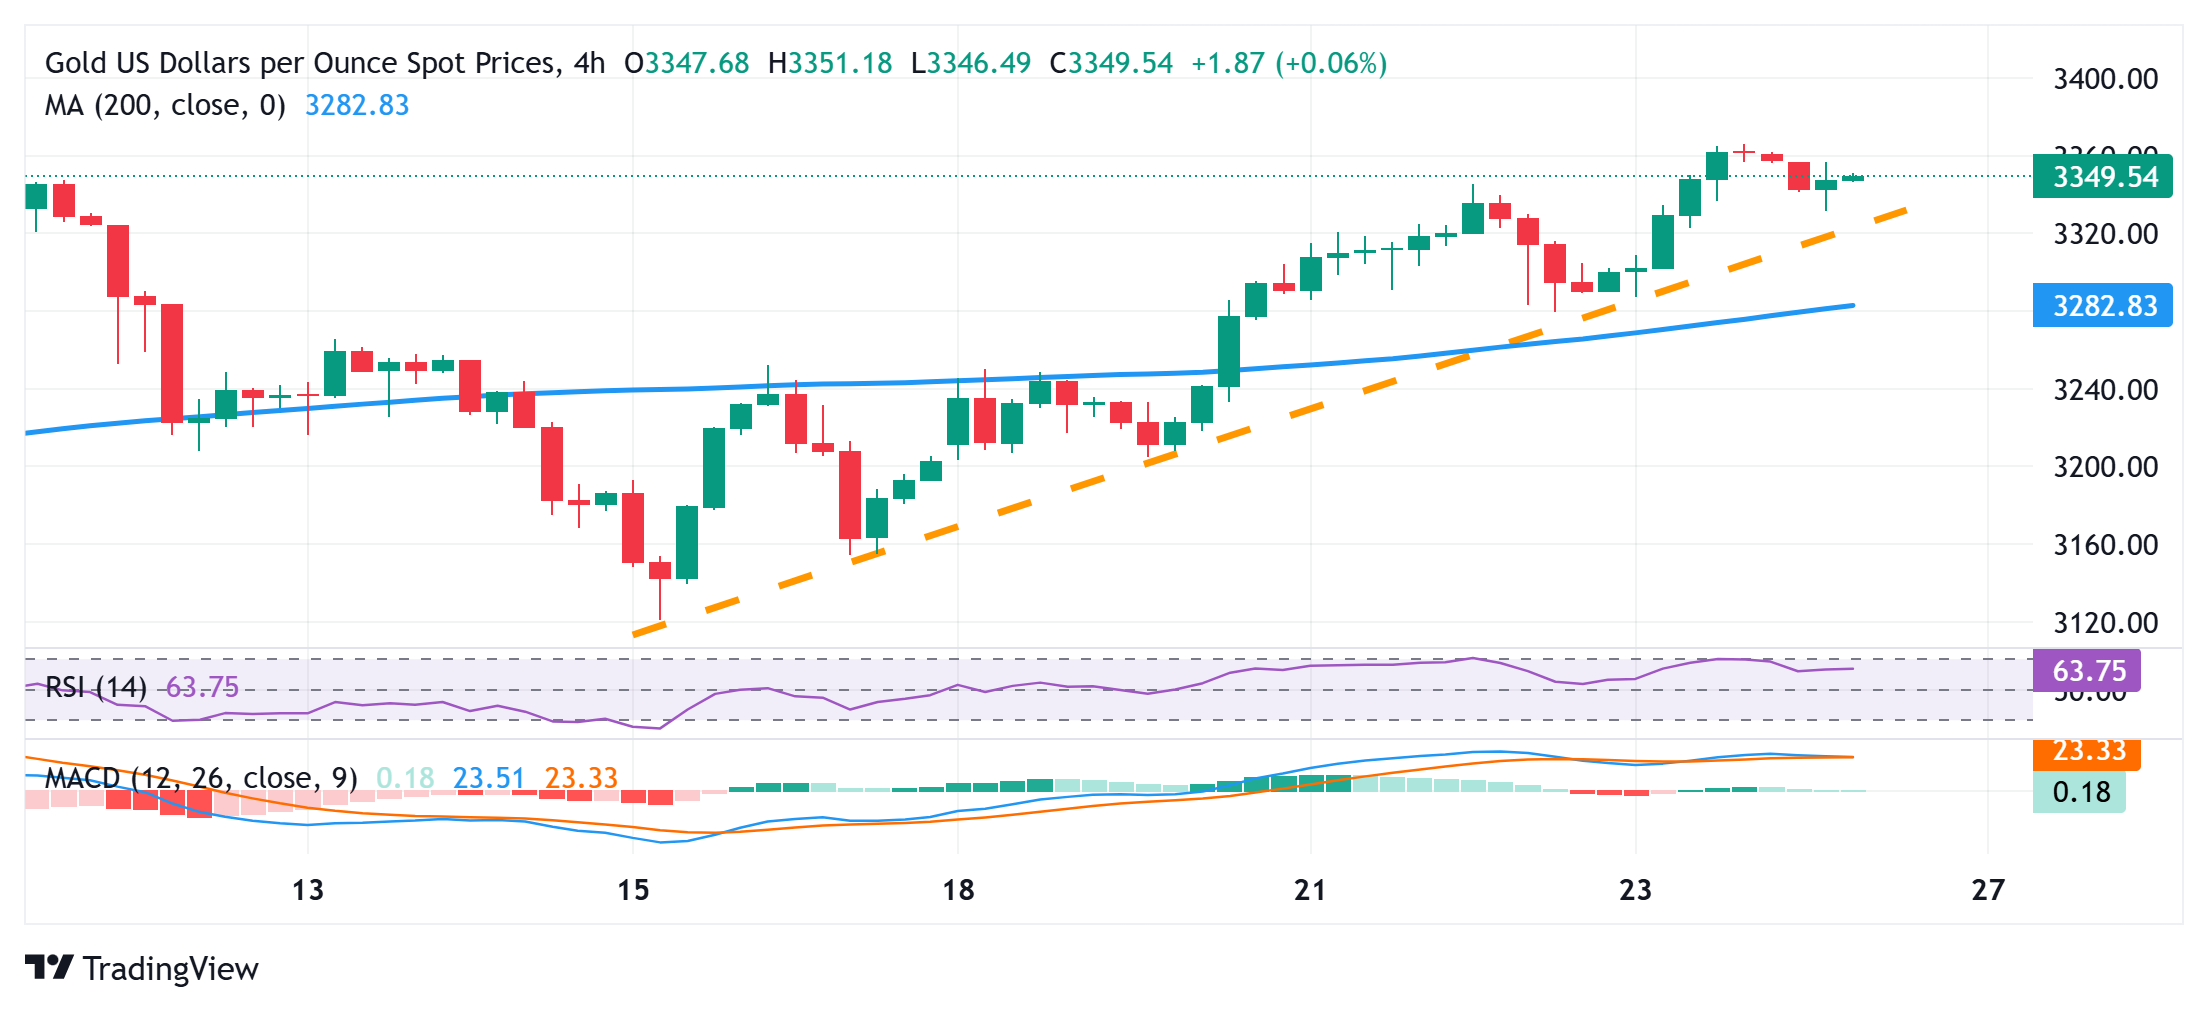
From a technical perspective, the recent move higher along an ascending trendline and positive oscillators on hourly/daily charts validates the near-term positive outlook for the Gold price. Hence, any subsequent slide is more likely to find decent support near the said trendline, currently pegged near the $3,325-3,324 region. A convincing break below, however, might prompt some technical selling and drag the XAU/USD to the $3,300 round figure en route to the $3,283 area, or the 200-period Simple Moving Average (SMA) on the 4-hour chart. The latter should act as a key pivotal point, which if broken decisively should pave the way for deeper losses.

On the flip side, momentum beyond Friday’s swing high, around the $3,366 area, will be seen as a fresh trigger for bullish traders and allow the Gold price to reclaim the $3,400 round figure. The next relevant resistance is seen near the $3,430 region, above which the XAU/USD could aim to challenge the all-time peak, around the $3,500 psychological mark touched in April, with some intermediate hurdle around the $3,465-3,470 zone.