US Trade Rep. Greer: We’re moving as quickly as we can on trade deals

US Trade Rep. Greer: We’re moving as quickly as we can on trade deals

United States Trade Representative (USTR) Jamieson Greer told CNBC on Tuesday that it will take time to end non-tariff barriers with China.

Key takeaways

“I will talk to the Indian commerce minister Tuesday, then flying to South Korea.”

“We are discussing other deals in parallel.”

“We’re moving as quickly as we can on trade deals.”

“The US is not relying on any trade partner for critical goods.”

“Global 10% tariff is a strong incentive to reduce the deficit.”

Market reaction

These comments failed to trigger a noticeable market reaction. At the time of press, the US Dollar Index was down 0.2% on the day at 101.58.

eurozone-02_Small

EUR/USD holds firm above 1.1100 ahead of US inflation data

EUR/USD clings to marginal gains above 1.1100 in the European session on Tuesday. The pair firms up as the US Dollar extends pullback as traders resort to repositioning ahead of the key US CPI data release. ZEW Survey – Economic Sentiment in the Eurozone improved to 11.6 in May from -18.5 in April.

EUR/USD trades slightly above the 1.1080-1.1090 area where the 50-day Simple Moving Average (SMA) meets the Fibonacci 61.8% retracement of the latest uptrend. In case the pair drops below this level and starts using it as resistance, technical sellers could take action. In this scenario, 1.1000 (round level, static level) could be seen as the next support level before 1.0950 (Fibonacci 78.6% retracement).

On the upside, resistance levels could be seen at 1.1170 (Fibonacci 50% retracement), 1.1220 (200-period SMA) and 1.1270 (Fibonacci 38.2% retracement).

The broad-based US Dollar (USD) strength forced EUR/USD to come under heavy bearish pressure at the beginning of the week, as investors cheered the US-China agreement on significantly lowering and pausing reciprocal tariffs for 90 days.

Early Tuesday, US stock index futures trade in negative territory and the USD Index retreats slightly from the monthly high it set on Monday, reflecting a cautious market stance and allowing EUR/USD to hold its ground.

In the second half of the day, the US Bureau of Labor Statistics will publish Consumer Price Index (CPI) data for April. On a monthly basis, the core CPI, which excludes volatile food and energy prices, is expected to rise by 0.3% following the 0.1% increase seen in March. A stronger-than-forecast print could support the USD with the immediate reaction and cause EUR/USD to stretch lower. On the flip side, a soft print of 0.2% or lower could make it difficult for the USD to find demand.

may-26-04-2024

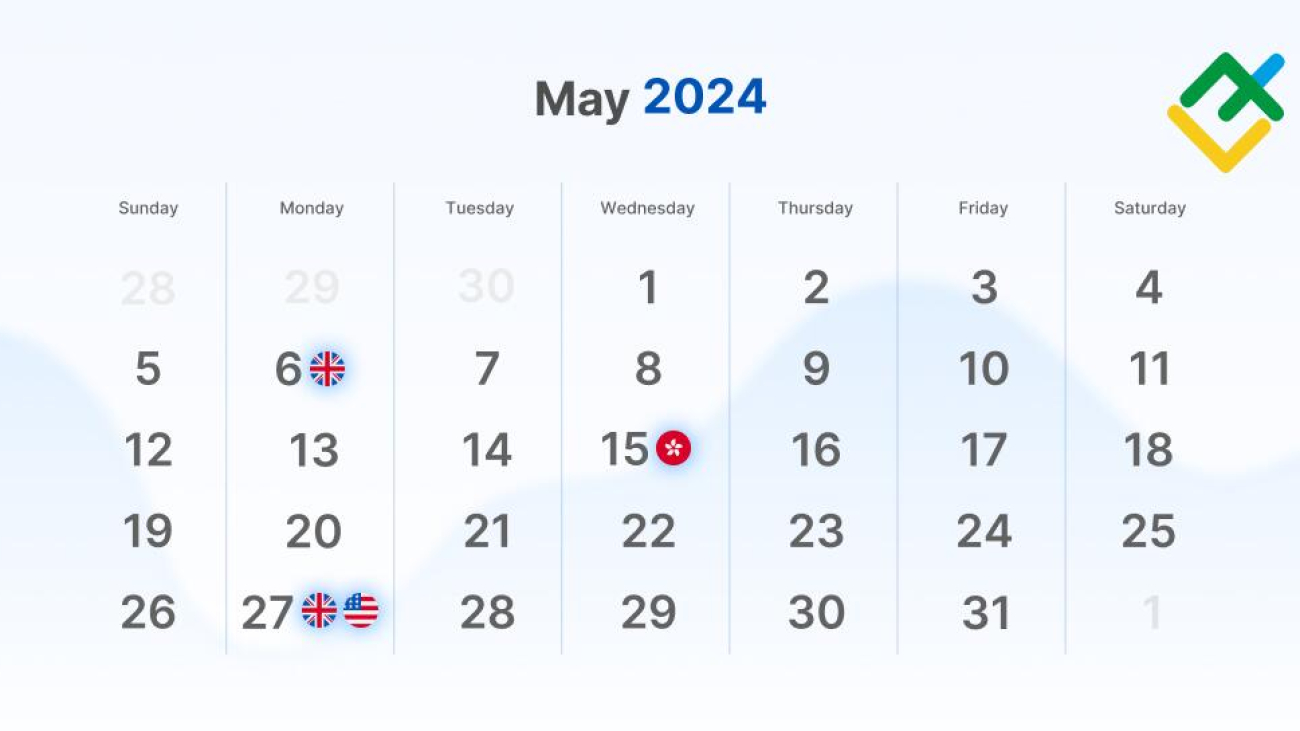
World stock market holidays: May 2024

Dear clients,

Please get acquainted with upcoming changes in LiteFinance’s trading schedule this month.

Early May Bank Holiday, UK – 06.05.2024

Trading instrument Closure Resumption
FTSE 03/05/2024 23:00:00 07/05/2024 3:00:00
XAUUSD 03/05/2024 23:58:59 06/05/2024 10:00:00
XAUEUR 03/05/2024 23:58:59 06/05/2024 10:00:00
XAGUSD 03/05/2024 23:58:59 06/05/2024 10:00:00
XPTUSD 03/05/2024 17:00:00 06/05/2024 10:00:00
XPDUSD 03/05/2024 17:00:00 06/05/2024 10:00:00
CFDs LONDON LSE 03/05/2024 18:30:00 07/05/2024 10:00:00
COFFEE 03/05/2024 20:30:00 06/05/2024 14:30:00
COCOA 03/05/2024 20:30:00 06/05/2024 14:30:00

Buddha’s Birthday, Hong Kong – 15.05.2024

Trading instrument Closure Resumption
HK50 14/05/2024 22:00:00 16/05/2024 4:15:00
USDKRW 14/05/2024 23:00:00 16/05/2024 3:05:00

Spring bank holiday, UK – 27.05.2024

Trading instrument Closure Resumption
FTSE 24/05/2024 23:00:00 28/05/2024 3:00:00
CFDs LONDON LSE 24/05/2024 18:30:00 28/05/2024 10:00:00
CORN 24/05/2024 21:20:00 28/05/2024 03:00:00
SOYBEAN 24/05/2024 21:20:00 28/05/2024 03:00:00
WHEAT 24/05/2024 21:20:00 28/05/2024 03:00:00
COFFEE 24/05/2024 20:30:00 28/05/2024 11:15:00
COCOA 24/05/2024 20:30:00 28/05/2024 11:45:00

Memorial Day, US – 27.05.2024

Trading instrument Closure Resumption
XAUUSD 27/05/2024 20:15:00 28/05/2024 1:00:00
XAUEUR 27/05/2024 20:15:00 28/05/2024 1:00:00
XAGUSD 27/05/2024 20:15:00 28/05/2024 1:00:00
XPTUSD 27/05/2024 17:00:00 28/05/2024 10:00:00
XPDUSD 27/05/2024 17:00:00 28/05/2024 10:00:00
UKBRENT 27/05/2024 20:15:00 28/05/2024 1:00:00
USCRUDE 27/05/2024 20:15:00 28/05/2024 1:00:00
XNGUSD 27/05/2024 20:15:00 28/05/2024 1:00:00
YM 27/05/2024 20:00:00 28/05/2024 1:00:00
SPX 27/05/2024 20:00:00 28/05/2024 1:00:00
NQ 27/05/2024 20:00:00 28/05/2024 1:00:00
NI225 27/05/2024 20:00:00 28/05/2024 1:00:00
HK50 27/05/2024 11:30:00 28/05/2024 4:15:00
CFD NYSE 24/05/2024 23:00:00 28/05/2024 16:30:00
CFD NASDAQ 24/05/2024 23:00:00 28/05/2024 16:30:00

* The schedule is formed according to the time of LiteFinance’s trading server (GMT+3 as displayed in the trading platform).

The instruments other than specified here are traded as usual. The actual trading schedule for each trading instrument is always displayed in the “Info on the instrument” section in the Client area at LiteFinance.

This information is for guidance purposes and subject to change. Please check this announcement on our site to be informed about other possible changes in the trading hours.

If necessary, adjust your trading strategy to these changes. Please contact our support service if you need assistance.

Best regards,

LiteFinance

World stock market holidays: May 2024

lll

AUD/USD retraces to near 0.6450 on slowdown in China’s PMI

The AUD/USD pair corrects sharply to near 0.6450 in Tuesday’s European session from the five-month high of 0.6500 posted on Monday. The Aussie pair retraces as the Australian Dollar (AUD) underperforms across the board due to a slowdown in business activity in China.

Australian Dollar PRICE Today

The table below shows the percentage change of Australian Dollar (AUD) against listed major currencies today. Australian Dollar was the strongest against the Swiss Franc.

USD EUR GBP JPY CAD AUD NZD CHF
USD -0.01% -0.24% -0.36% -0.03% 0.27% -0.11% 0.42%
EUR 0.01% -0.24% -0.36% -0.02% 0.27% -0.10% 0.43%
GBP 0.24% 0.24% -0.13% 0.21% 0.53% 0.13% 0.69%
JPY 0.36% 0.36% 0.13% 0.32% 0.63% 0.33% 0.80%
CAD 0.03% 0.02% -0.21% -0.32% 0.29% -0.09% 0.47%
AUD -0.27% -0.27% -0.53% -0.63% -0.29% -0.38% 0.19%
NZD 0.11% 0.10% -0.13% -0.33% 0.09% 0.38% 0.56%
CHF -0.42% -0.43% -0.69% -0.80% -0.47% -0.19% -0.56%

The heat map shows percentage changes of major currencies against each other. The base currency is picked from the left column, while the quote currency is picked from the top row. For example, if you pick the Australian Dollar from the left column and move along the horizontal line to the US Dollar, the percentage change displayed in the box will represent AUD (base)/USD (quote).

Signs of moderate growth in economic activities in China weigh heavily on the Aussie Dollar, given Australia’s significant reliance on its exports to Beijing.

Caixin Manufacturing and Services Purchasing Managers’ Index (PMI) data for April have demonstrated that businesses are facing pressure due to the fallout of higher tariffs by United States (US) President Donald Trump. Activities in both the manufacturing and the services sector expanded at a moderate pace. The exports from China to the US are facing a 145% import duty, limiting US companies from buying from their Chinese trading partners.

Domestically, firming expectations that the Reserve Bank of Australia (RBA) will reduce its Official Cash Rate (OCR) in the policy meeting later this month have also pushed the AUD on the backfoot.

Meanwhile, the US Dollar (USD) has recovered a majority of its intraday losses and has turned almost flat, with investors focusing on the Federal Reserve’s (Fed) monetary policy decision, which will be announced on Wednesday. The US Dollar Index (DXY), which tracks the Greenback’s value against six major currencies, rebounds from the day’s low of 99.50 to near 99.75.

According to the CME FedWatch tool, traders have fully priced in that the Fed will leave interest rates steady in the range of 4.25%-4.50% for the third straight meeting in a row.


litefinance-blog-audusd-05-04-22-768x419

USD/JPY has likely entered a consolidation phase – UOB Group

US Dollar (USD) is expected to trade in a 143.40/144.85 range vs Japanese Yen (JPY). In the longer run, USD has likely entered a consolidation phase and is likely to trade between 142.20 and 146.70 for now, UOB Group’s FX analysts Quek Ser Leang and Peter Chia note.

USD/JPY likely to trade between 142.20 and 146.70

24-HOUR VIEW: “Yesterday, USD dropped to a low of 143.52, closing at 143.70, down by 0.85%. Despite the decline, there has been no clear increase in downward momentum. Furthermore, conditions are oversold. The price action is likely part of a range-trading phase. Today, we expect USD to trade in a 143.40/144.85 range.”

1-3 WEEKS VIEW: “The initial rebound from the late April low of 139.86 has been strong, but upward momentum has since slowed. USD has likely entered a consolidation phase, and it is likely to trade between 142.20 and 146.70 for now.”

_XAU_USD

Gold snaps two-week high after German Parliament fails to nominate upcoming Chancellor

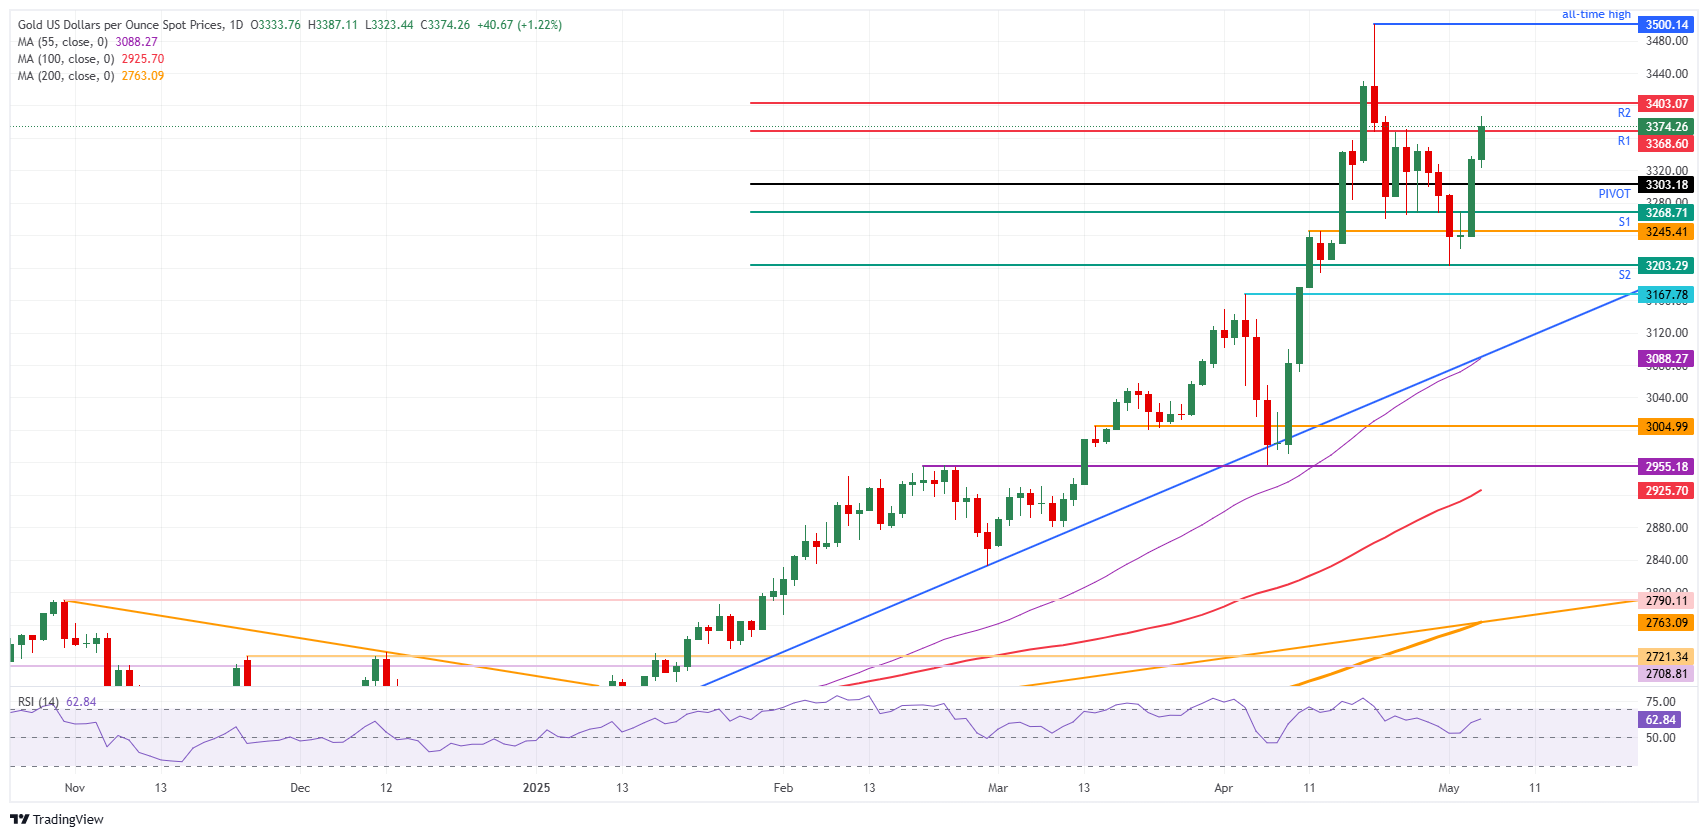
Gold (XAU/USD) sprints higher on Tuesday for a second consecutive day, as geopolitical tensions around the globe continue to support investors’ demand for safe-haven assets. In the Middle East, Israel is further preparing its ground offensive in the Gaza Strip with the aim of fully controlling the area.

In the United States (US), pressure is building on US President Donald Trump and his administration to finally announce a first trade deal. Trump and his cabinet have been very vocal about deals being imminent, with US Commerce Secretary Howard Lutnick saying that the first trade deal will be with a top ten economy, Fox News reported.

Meanwhile, some very sharp moves in the Forex market are also keeping investors on edge. Traders are trying to assess how to position themselves after the fallout of the Taiwan Dollar (TWD) move seen on Monday after it appreciated sharply against the US Dollar (USD). The bigger risk is having a domino effect on the US Dollar – which could weaken against other major Asian currencies – making it no longer a steady and reliable safe haven currency and thus benefiting Gold.

An additional element that pushes the precious metal even higher this Tuesday, comes from the German Bundestag, the German Parliament. A rather ceremonial vote to secure the nomination of Chancellor Friedrich Merz fell short of a majority. This event has never taken place in German history and means that the Chancellor already lost trust of the coalition majority, which opens up the door to German political uncertainty with no clues on when a new vote could take place, or a new Chancellor needs to be elected, or even new snap elections need to be held.

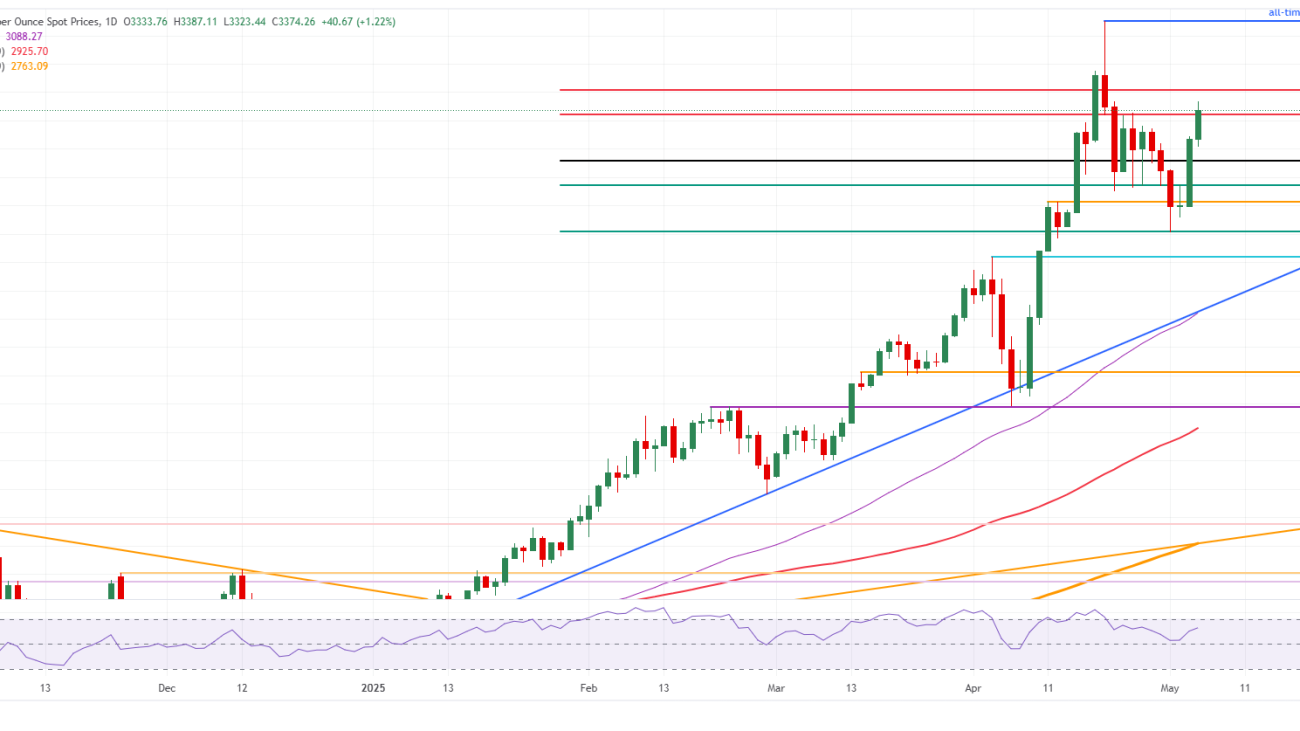
Gold Price Technical Analysis: Uncertainty rules again

Gold price is rallying higher in what looks to be a second wave of safe haven inflow in the precious metal. Balances and powers in financial markets are shifting, and one of them seems to be the Greenback losing its status as a safe haven in benefit of Bullion. In this scenario, Gold is set to rocket higher should President Trump and his administration be unable to soon announce a trade deal with any country, preferably a G20 one.

On the upside, the R1 resistance at $3,368 has already been broken in a topside test in early trading this Tuesday. Should some follow-through come, the R2 resistance at $3,403 might see a test very swiftly. The all-time high at $3,500 might be a bit too far off for traders to test already on Tuesday.

On the downside, the Pivot Point at $3,303 is the first level to watch. Further down, the daily S1 support comes in at $3,268, coinciding with the lows of last week on April 30, 28, 25 and 23. The technical level at $3,245 should do the trick and hold in case of any sudden reversals.

dollar

EUR/CHF falls despite soft Swiss CPI print – Danske Bank

April’s downside surprise in Swiss inflation has reinforced expectations of a June rate cut by the SNB, with markets now entertaining the possibility of a return to negative interest rates as the strong franc and global uncertainties weigh on growth and price stability, Danske Bank’s FX analysts report.

Swiss inflation miss sparks talk of SNB rate cuts

“Despite a significant downside surprise to Swiss inflation for April, EUR/CHF ended the day lower. Headline came in at 0.0% y/y (cons: 0.2%, prior: 0.3%) and core at 0.6% y/y (prior: 0.9%, cons: 0.8%). This falls significantly below the SNBs expectation for Q2 of 0.3% y/y. The low inflation print reflects the recent decline in energy prices but can also largely be attributed to the recent strengthening of the CHF, which puts significant downward pressure on imported inflation. ”

“More broadly, price pressures remain very muted in Switzerland. The growth backdrop has likewise worsened for the Swiss economy the past month with trade war uncertainty and the strong CHF acting as a headwind for the manufacturing sector. Markets reacted by pricing just above 30bp worth of cuts for the next SNB meeting in June and 45bp for 2025 and hence a return to a negative interest rate policy.”

“We stick to our long-held call of the policy rate being cut to 0% in June. However, following yesterday’s print the risks of a return to NIRP has notably increased. We expect the SNB to resort to FX intervention before negative territory is reached.”

images

EUR/USD Price Forecast: Remains confined in a range around 1.1300 ahead of FOMC meeting

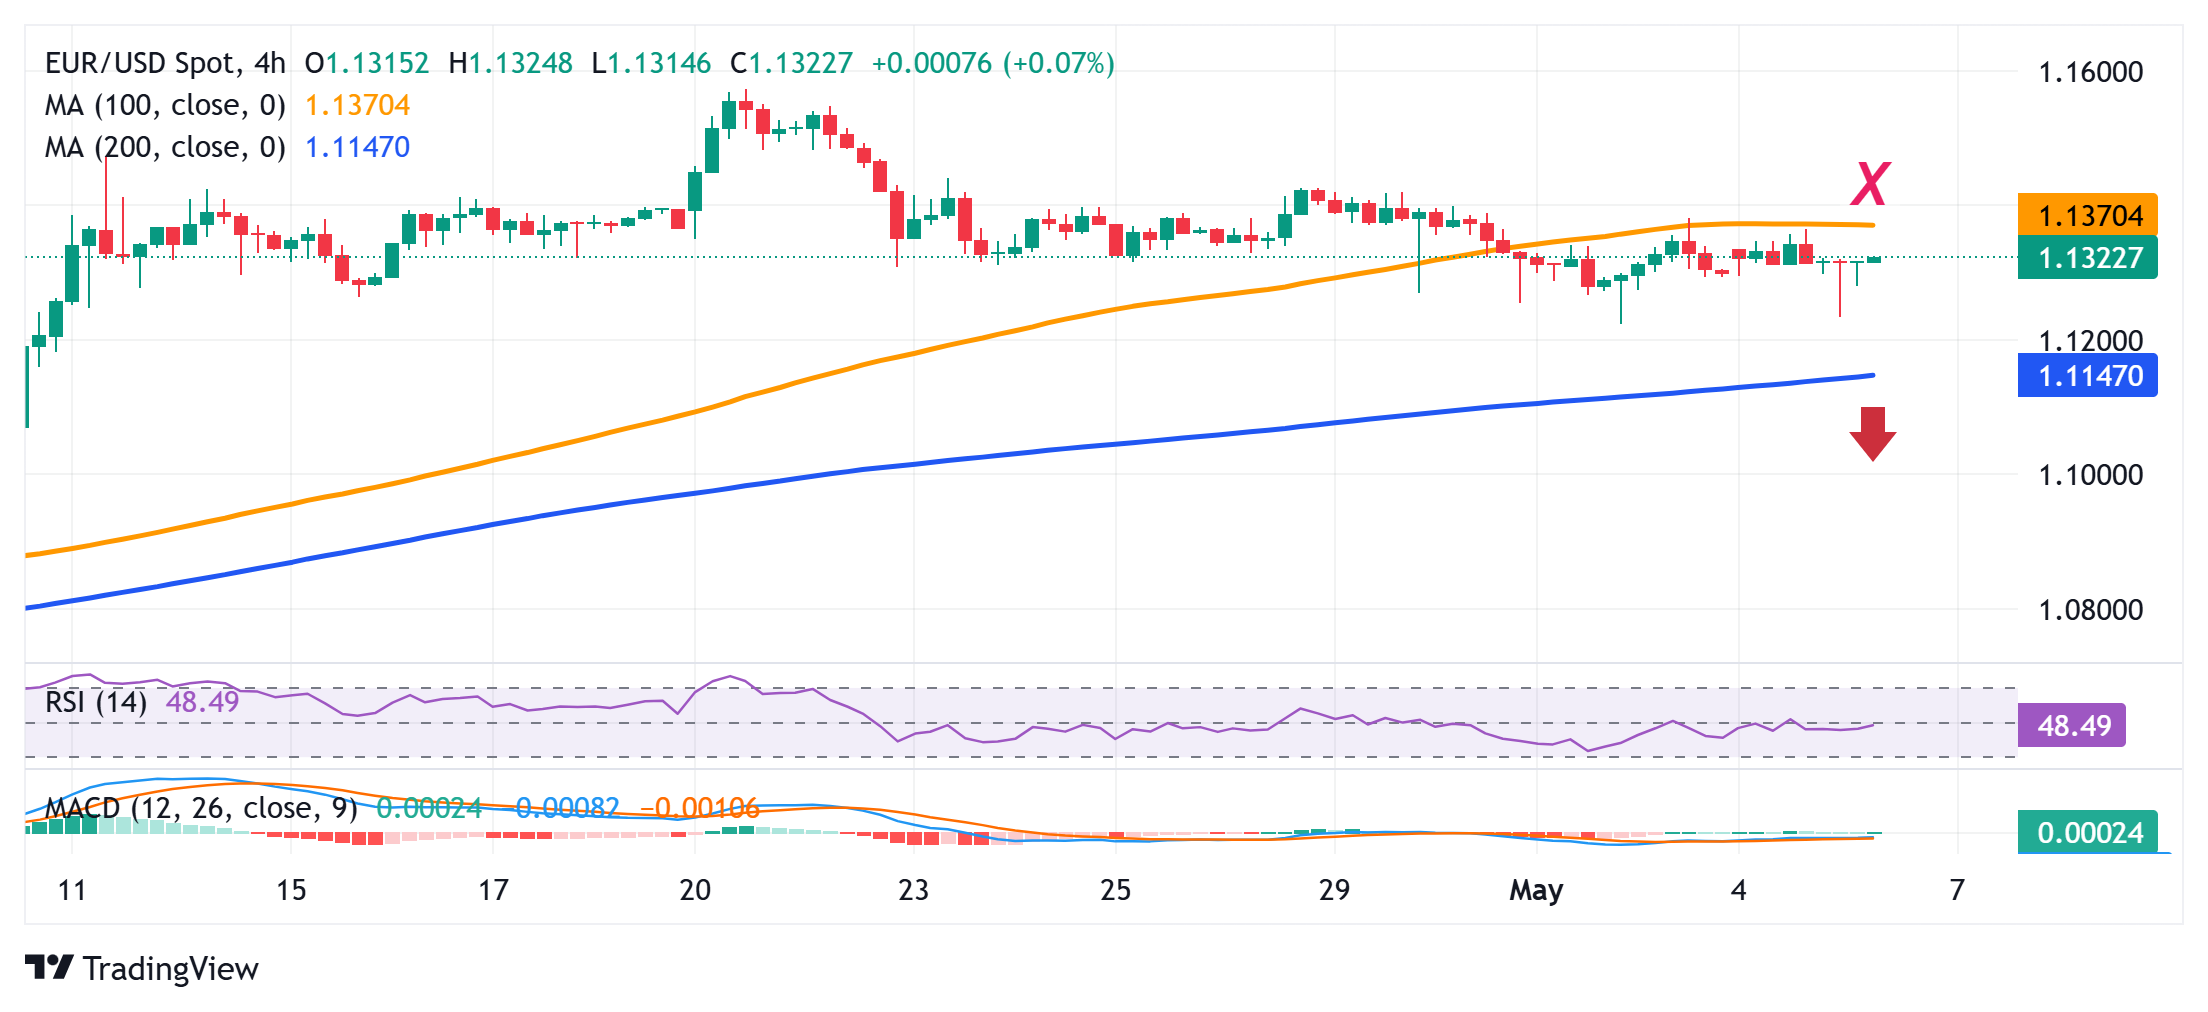
The EUR/USD pair reverses an Asian session tip to the 1.1280-1.1275 region on Tuesday and climbs a fresh daily high in the last hour, though it lacks strong follow-through buying. Spot prices remain confined in a multi-day-old trading range, close to the three-week low touched last Thursday, as traders opt to wait on the sidelines ahead of the crucial FOMC decision on Wednesday.

Heading into the key central bank event risk, Friday’s upbeat US jobs data and the US ISM Services PMI released on Monday eased market concerns about a recession. This, in turn, helps limit the downside for the US Dollar (USD) and acts as a headwind for the EUR/USD pair. However, the heightened economic uncertainty led by US President Donald Trump’s rapidly shifting stance on trade policies keeps the USD bulls on the defensive.

From a technical perspective, last week’s breakdown below the 100-period Simple Moving Average (SMA) on the 4-hour chart – for the first time since early April – was seen as a key trigger for bearish traders. However, oscillators on the said chart are yet to confirm a negative bias and are holding in bullish territory on the daily chart. This makes it prudent to wait for strong follow-through selling before positioning for any meaningful depreciating move.

In the meantime, the 100-period SMA on the 4-hour chart, currently pegged around the 1.1380 region, could act as an immediate hurdle ahead of the 1.1400 round figure.  A sustained strength beyond the latter should allow the EUR/USD pair to surpass the 1.1425-1.1430 intermediate barrier and aim toward reclaiming the 1.1500 psychological mark. The momentum could extend further towards the multi-year peak, around the 1.1575 region touched in April.

On the flip side, the 1.1265 region, or a three-week low touched last Thursday, might offer immediate support and should act as a key pivotal point. A convincing break below should pave the way for an extension of the EUR/USD pair’s corrective slide from the 1.1575 area, or the highest level since November 2021 touched last week. Spot prices might then weaken to the 1.1200 round figure before dropping to the 1.1140 area, or the 200-period SMA on the 4-hour chart.

EUR/USD 4-hour chart