Crude-Oil

Crude Oil price today: WTI price bullish at European opening

West Texas Intermediate (WTI) Oil price advances on Wednesday, early in the European session. WTI trades at $62.87 per barrel, up from Tuesday’s close at $62.16.

Brent Oil Exchange Rate (Brent crude) is also up, advancing from the $65.11 price posted on Tuesday, and trading at $65.76.

WTI Oil is a type of Crude Oil sold on international markets. The WTI stands for West Texas Intermediate, one of three major types including Brent and Dubai Crude. WTI is also referred to as “light” and “sweet” because of its relatively low gravity and sulfur content respectively. It is considered a high quality Oil that is easily refined. It is sourced in the United States and distributed via the Cushing hub, which is considered “The Pipeline Crossroads of the World”. It is a benchmark for the Oil market and WTI price is frequently quoted in the media.

images

UK CPI inflation leaps to 3.5% YoY in April vs. 3.3% forecast

The United Kingdom (UK) annual headline Consumer Price Index (CPI) jumped by 3.5% in April after recording a 2.6% growth in March, the data released by the Office for National Statistics (ONS) showed on Wednesday.

The market forecast was for a 3.3% acceleration in the reported period. The reading moves further away from the Bank of England’s (BoE) 2% target.

The core CPI (excluding volatile food and energy items) rose 3.8% year-over-year (YoY) in the same period, as against a 3.4% increase in March, beating the expected print of 3.6%.

Services inflation firmed up to 5.4% YoY in April from March’s 4.7%.

Meanwhile, the monthly UK CPI inflation jumped to 1.2% in April from 0.3% in March. Markets predicted a 1.1% reading.

GBP/USD reaction to the UK CPI inflation data

The UK CPI data provides a fresh boost to the Pound Sterling, driving GBP/USD briefly above 1.3450 before reversing to near 1.3432, where it now wavers. The pair is still up 0.32% on the day.

British Pound PRICE Today

The table below shows the percentage change of British Pound (GBP) against listed major currencies today. British Pound was the strongest against the US Dollar.

USD EUR GBP JPY CAD AUD NZD CHF
USD -0.36% -0.26% -0.55% -0.18% -0.35% -0.32% -0.63%
EUR 0.36% 0.10% -0.21% 0.16% 0.03% 0.04% -0.28%
GBP 0.26% -0.10% -0.27% 0.09% -0.05% -0.05% -0.39%
JPY 0.55% 0.21% 0.27% 0.34% 0.19% 0.21% -0.10%
CAD 0.18% -0.16% -0.09% -0.34% -0.17% -0.13% -0.47%
AUD 0.35% -0.03% 0.05% -0.19% 0.17% 0.02% -0.30%
NZD 0.32% -0.04% 0.05% -0.21% 0.13% -0.02% -0.33%
CHF 0.63% 0.28% 0.39% 0.10% 0.47% 0.30% 0.33%

The heat map shows percentage changes of major currencies against each other. The base currency is picked from the left column, while the quote currency is picked from the top row. For example, if you pick the British Pound from the left column and move along the horizontal line to the US Dollar, the percentage change displayed in the box will represent GBP (base)/USD (quote).

This section below was published at 02:15 GMT as a preview of the UK Consumer Price Index (CPI) inflation data.

  • The United Kingdom’s Office for National Statistics will publish the April CPI data on Wednesday.
  • Inflation, as measured by the CPI, is forecast to be much higher than in March.
  • The GBP/USD pair trades near its 2025 high and aims to advance beyond it.

The United Kingdom (UK) will release the Consumer Price Index (CPI) data for April on Wednesday at 06:00 GMT. The report, released by the Office for National Statistics (ONS), has a relevant impact on the Sterling Pound (GBP) amid its potential effect on future Bank of England (BoE) monetary policy decisions.

Inflation, as measured by the CPI, is foreseen to have risen by 1.1% on a monthly basis, much higher than the 0.3% posted in March. The annual figure is expected to be 3.3%, also higher than the previous 2.6%. Finally, the annual core CPI is forecast to hit 3.7% after posting 3.4% in the previous month.

What to expect from the next UK inflation report?

The UK CPI is then seen almost doubling the BoE’s goal of 2%. The news, while discouraging, would come as no surprise.

The BoE’s last decision on monetary policy was to cut the benchmark interest rate to 4.25% from 4.5%, with five out of the nine Monetary Policy Committee (MPC) members backing such a decision. Two other voting members aimed for a larger cut, while the other two preferred to keep rates on hold.

In the accompanying statement, policymakers noted, “There is also a lot of uncertainty from global developments, partly because of changes in global trade policies. We are assessing what this could mean for UK inflation closely.” Officials also added: “We expect an increase in inflation this year. It is likely to rise temporarily, to 3.7%, partly because of higher energy prices. Inflation is expected to fall back to the 2% target after that.”

Uncertainty has dominated central banks’ messages since United States (US) President Donald Trump arrived in the White House with his protectionist policies. Massive tariffs pose a risk to global growth and inflation. While the UK is among the economies less affected by Trump’s decision, it is indeed not exempt from suffering an economic setback due to levies.

Markets are cautiously optimistic amid a 90-day pause in levies and a reduction of retaliatory tariffs between Washington and Beijing. Still, it is worth noting tensions remain in the background, with trade negotiations underway without progress being reported.

Deutsche Bank senior economist Sanjay Raja adds: “April inflation will present the biggest test for the Monetary Policy Committee so far this year”.

How will the UK Consumer Price Index report affect GBP/USD?

The inflation uptick falls within the BoE’s predictions, but that does not make it less worrisome. Generally speaking, higher than anticipated CPI figures would suggest the BoE will adopt a more hawkish stance and refrain from trimming interest rates, resulting in a firmer GBP. The opposite scenario is also valid, with softer-than-anticipated inflationary pressures leaving the door open for additional rate reductions.

Ahead of the announcement, the GBP/USD pair comfortably trades above the 1.3300 mark, roughly 100 pips away from the 2025 peak at 1.3445 amid broad US Dollar weakness. The Greenback came under selling pressure after Moody’s Investors Service, a rating agency, downgraded the United States sovereign credit rating from Aaa to Aa1 on Friday, expressing concerns about piling up debt.

Valeria Bednarik, Chief Analyst at FXStreet, expects GBP/USD to reach higher highs for the year in the upcoming days. “Given the broad USD weakness and increasing price pressures in the UK, the GBP/USD pair is likely to resume its advance and challenge the yearly peak.”

Bednarik adds: “From a technical point of view, GBP/USD is in a consolidative stage since mid-April. The daily chart shows that moving averages have turned flat, reflecting the lack of directional strength, yet the pair holds above them all, with the 20 Simple Moving Average (SMA) providing support at around the 1.3300 mark. Below such level, buyers have been defending the downside at around the 1.3250 region, while the base of the monthly range comes at 1.3140.”

Finally, Bednarik states: “A steady advance beyond the 1.3400 mark should favor a run past the year high and towards the 1.3500 area, while additional gains expose the 1.3560 price zone, where GBP/USD peaked in September 2022.”

dollar

GBP/USD rises toward 1.3450 after strong UK inflation data

GBP/USD gains traction and climbs toward 1.3450 in the European morning on Wednesday. The data from the UK showed that the annual CPI inflation jumped to 3.5% in April from 2.6% in March, surpassing the market expectation of 3.3% and boosting Pound Sterling.

The Relative Strength Index (RSI) indicator on the 4-hour chart edges lower to below-60 but GBP/USD holds comfortably above the 20-period, 50-period, 100-period and the 200-period Simple Moving Averages (SMA), suggesting that the bullish stance remains intact, while losing some momentum.

On the upside, 1.3390-1.3400 (static level, round level) aligns as immediate resistance for GBP/USD before 1.3440 (upper limit of the latest uptrend) and 1.3500 (static level, round level). Looking south, supports could be spotted at 1.3300 (100-period SMA), 1.3270 (50-period SMA, Fibonacci 23.6% retracement of the latest uptrend) and 1.3225 (200-period SMA).

The US Dollar (USD) came under bearish pressure to start the week and fuelled GBP/USD’s rally on Monday, as markets reacted to Moody’s decision to downgrade the United States’ sovereign credit rating, citing an unsustainable deficit.

Early Tuesday, the cautious market stance caps GBP/USD’s upside. Additionally, the USD holds its ground, supported by the latest comments from Federal Reserve (Fed) officials. Atlanta Fed President Raphael Bostic repeated that he sees the Fed cutting the policy rate once this year. Additionally, Minneapolis Fed President Neel Kashkari and Fed Vice Chairman Philip Jefferson noted that they need to wait for more information before taking another policy step.

Meanwhile, Bank of England (BoE) Chief Economist Huw Pill argued early Tuesday that the quarterly pace of rate reductions would be “too rapid,” adding that he is concerned about indicators pointing to inflation pressure. These comments seem to be helping Pound Sterling stay resilient against its peers.

The economic calendar will not offer any high-tier macroeconomic data releases on Tuesday that could drive the USD’s valuation. Hence, investors will continue to scrutinize comments from central bank officials.

The CME Group FedWatch Tool shows that markets are pricing in a more than 70% probability that the Fed will cut the policy rate at least twice in 2025. In case Fed officials push back against this market expectation, the USD could gather strength and cause GBP/USD to lose its traction.

8-doji-star-candle-en

Trading Strategies Using the Doji Star Pattern

Understanding the intricacies of candlestick analysis is extremely important in trading. Among various candlestick patterns, a Doji Star stands out in particular, signaling a possible trend reversal. The formation of this pattern directly indicates a struggle between buyers and sellers, highlighting the state of equilibrium in the market.

The ability to recognize a Doji Star and correctly interpret its signals allows you to anticipate shifts in market sentiment and make more informed trading decisions. This article is devoted to the analysis of the Doji Star, its characteristics, and strategies for trading this pattern.

The article covers the following subjects:

Major Takeaways

  • A Doji Star is a reversal pattern on price charts, consisting of a candlestick from the preceding trend, a Doji candlestick, and a confirming candlestick.
  • A Doji Star is easy to recognize: look for a small Doji body separated by a gap from the previous candlestick, indicating a change in market sentiment.
  • Key features: small range of Doji fluctuations; a gap after the previous candlestick; located at the end of an uptrend or downtrend.
  • The pattern forms due to market uncertainty when there is a struggle between bulls and bears, signaling a possible reversal.
  • You can open a trade once the reversal is confirmed by the next candlestick. It is better to set a stop-loss beyond the Doji high/low to avoid false breakouts.
  • It is essential to confirm the pattern with other indicators to filter out false signals and use it in combination with support/resistance levels.
  • Pros: early reversal identification. Cons: requires confirmation; false signals are possible.
  • A Doji Star pattern can be found in any financial market, including Forex. However, it is more common on the charts of volatile instruments and time frames higher than H1.

What is the Doji Star Candlestick Pattern?

A Doji Star is a Japanese candlestick pattern that indicates a potential reversal. The pattern occurs at the top of an uptrend or at the bottom of a downtrend.

Key elements: a candlestick with a long body reflecting the current trend, followed by a price gap, and a Doji candlestick with a small body and long shadows. A Doji Star is confirmed by the next impulse candlestick moving in the opposite direction.

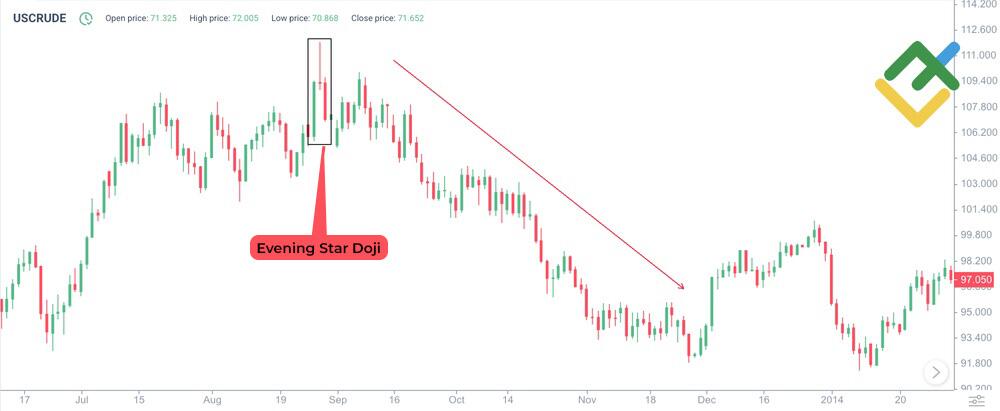
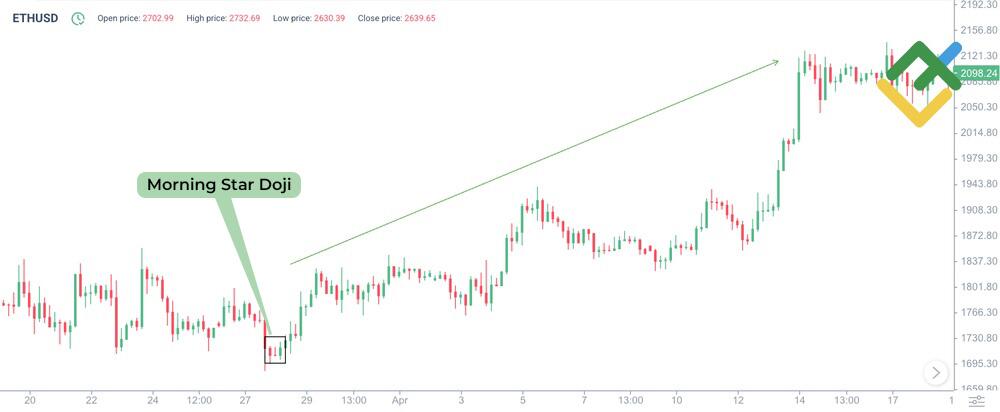
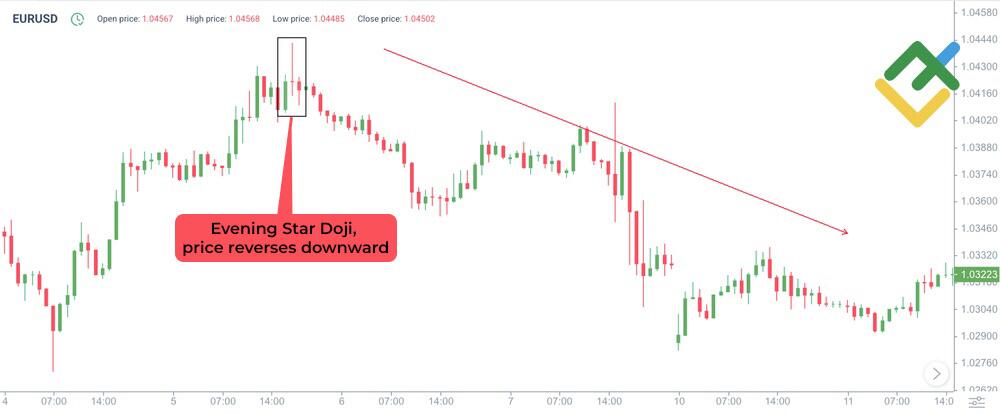
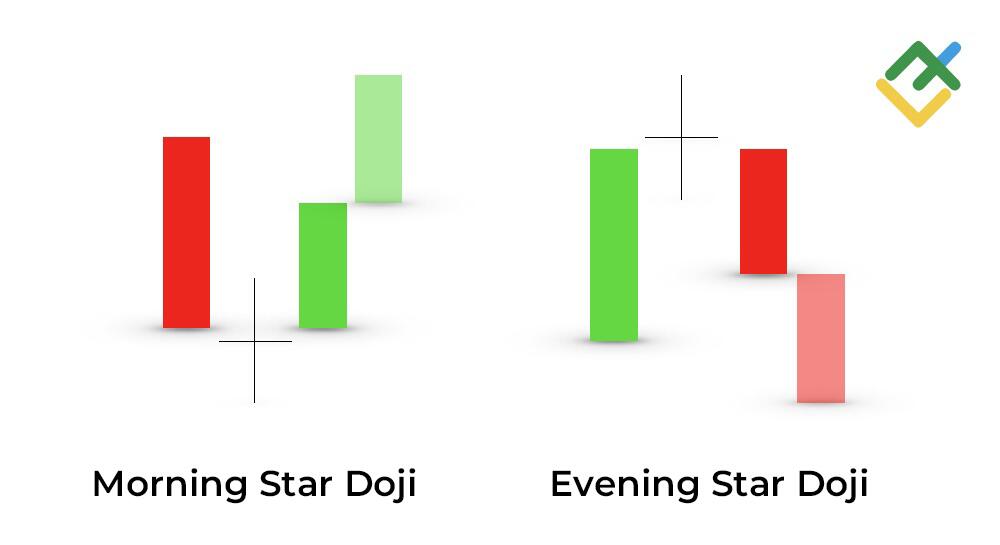
A bullish Doji Star candlestick, often referred to as Morning Star Doji, appears after a downtrend and indicates a potential start of an uptrend. A bearish Doji Star candlestick, also known as Evening Star Doji, forms after an uptrend and signals a possible decline in prices.

LiteFinance: What is the Doji Star Candlestick Pattern?

Types

A Doji Star pattern is a significant trend reversal signal. It consists of several candlesticks. The middle candlestick is a Doji. Its small body indicates market uncertainty.

The position of the Doji relative to the preceding and following candlesticks determines the type of signal and its strength. Let’s look at the main types of this pattern.

Identifying the Bullish Doji Star Pattern

Features and interpretation of a bullish Doji Star pattern:

  • Preceding downtrend. The pattern forms after a prolonged price decrease.
  • The first candle is bearish. This long downward candlestick (red or black) confirms the current bearish trend.
  • The second candle is a Doji. It has a small body, with almost equal opening and closing prices, which indicates uncertainty in the market. This candlestick forms with a downward gap after the previous candlestick.
  • The third candle is bullish. It is a long green or white candle that closes significantly above the middle of the first bearish candle.
  • A Doji Star suggests a trend reversal. The uncertainty in the Doji candlestick is replaced by a strong bullish impulse, which signals that bulls are taking control, and an uptrend begins. Besides, confirmation from subsequent candlesticks is required.

LiteFinance: Identifying the Bullish Doji Star Pattern

Identifying the Bearish Doji Star Pattern

A bearish Doji Star pattern signals a downward trend reversal. The following characteristics can be identified:

  • This pattern appears during an uptrend in the market.
  • As a rule, the first upward candlestick has a very long body, confirming the ongoing bullish momentum.
  • The second candlestick is a Doji with a small or no body at all. A Doji opens with an upward gap after the previous candlestick.
  • Confirmation of the reversal: the third candlestick is a long red candle, closing significantly below the middle of the first candle’s body.
  • The pattern signals weakening buying and strengthening selling pressure, which may lead to a downtrend.

LiteFinance: Identifying the Bearish Doji Star Pattern

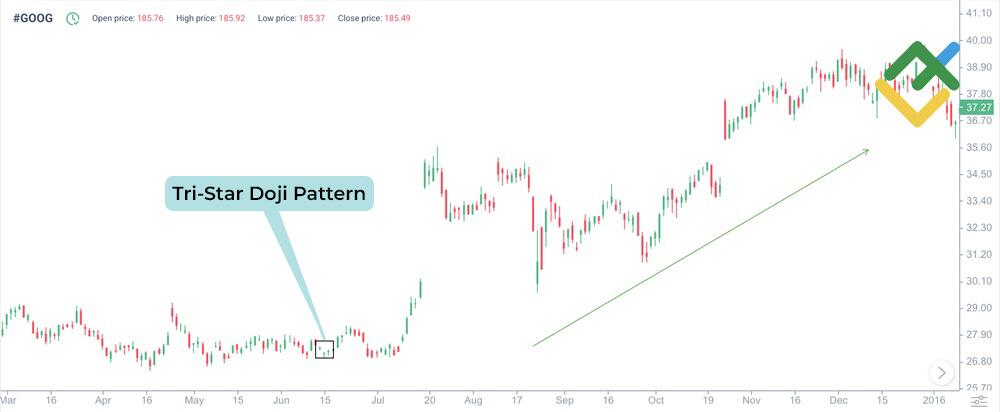
Identifying the Doji Tri-Star

A bearish Tri-Star Doji pattern consists of three consecutive Doji candlesticks, each opening and closing at approximately the same level. The appearance of this pattern in an uptrend signals a potential bearish reversal.

A bullish Tri-Star Doji pattern, on the contrary, forms during a downtrend and foreshadows an upward price reversal. Three Doji candlesticks that open and close at similar levels indicate indecision in the market. An upward trend reversal is possible in the future, although this pattern needs to be confirmed by other indicators.

LiteFinance: Identifying the Doji Tri-Star

Trading Strategies Using the Doji Star Pattern

This section provides a detailed overview of effective strategies using the Doji Star pattern for different market conditions.

LiteFinance: Trading Strategies Using the Doji Star Pattern

Doji Star in Uptrends

A bullish Doji Star candlestick pattern may signal a change from a downtrend to an uptrend. The pattern emerges after a prolonged decline, indicating a fading selling pressure and a possible strengthening of buyers.

LiteFinance: Doji Star in Uptrends

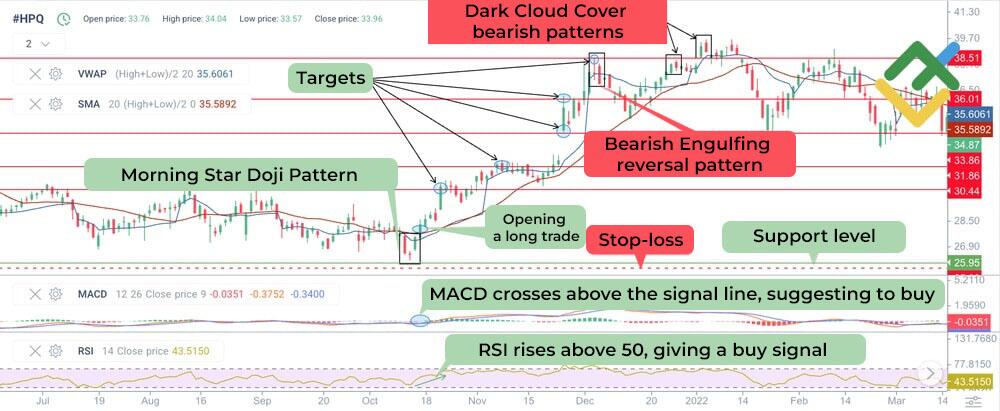
Let’s study an example of trading a bullish Doji Star pattern using the daily HP, Inc. stock chart.

  1. The chart shows that a bullish Doji Star pattern has formed at the support level after a long price consolidation.
  2. Key support and resistance levels are identified on the candlestick chart.
  3. The MACD trend indicator, the RSI stochastic oscillator, and the VWAP volume indicator with the SMA are added to the chart to confirm the potential transition from consolidation to growth. The MACD crosses above the zero line and rises in the positive zone, indicating a buy signal. RSI values have also rebounded from the lower boundary and started to increase, suggesting potential for further gains. The VWAP indicator’s weighted average price and the SMA20 line are below the market price, which also points to a buy signal and confirms the pattern.
  4. A long trade is opened after a bullish Doji Star pattern forms, with a stop-loss order set below the support level.
  5. Potential profit targets are at key resistance levels: 30.44, 31.86, 33.86, 36.01, and 38.51. Lock in 50% of the trade at each level.
  6. Bearish reversal patterns, such as a Dark Cloud Cover and Bearish Engulfing, appear in the 36.01–38.51 range, warning of increased selling activity in this zone. Therefore, it is advisable to exit the trade and lock in profits.

Doji Star in Downtrends

The bearish Doji Star candlestick pattern signals a potential reversal from an uptrend to a downtrend. Trading with this pattern also requires confirmation.

LiteFinance: Doji Star in Downtrends

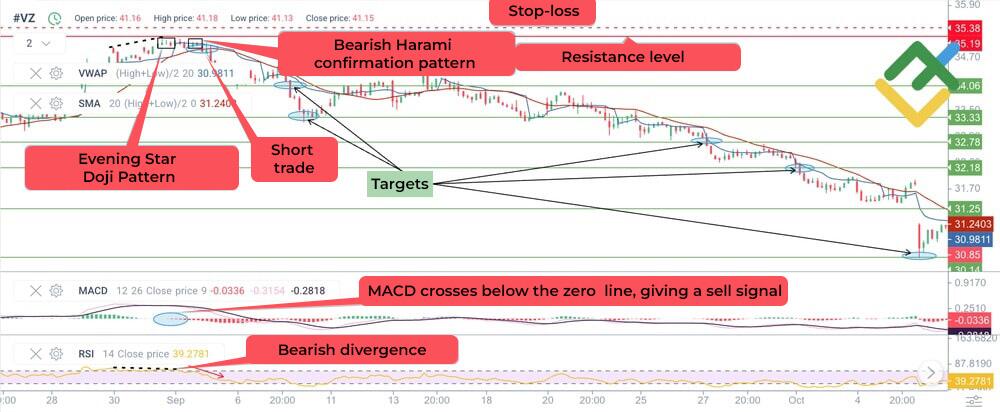
Let’s examine an example of trading a bearish Doji Star pattern on the hourly chart of Verizon Communications Inc. shares.

  1. A Doji Star has formed near resistance after a prolonged uptrend.
  2. The key support and resistance levels are determined.
  3. The MACD trend indicator, the RSI stochastic oscillator, and the VWAP volume indicator with a simple SMA moving average are added. The MACD shows a downward crossover of the zero line and a further decline in the negative zone, which is a sell signal. The RSI indicates a bearish divergence, with values falling from the overbought level. The VWAP indicator’s weighted average price and the SMA20 line are above the market price, pointing to a weakening of the bullish momentum in the market. Thus, a short trade can be opened.
  4. A Bearish Harami reversal pattern has also formed on the asset’s chart, confirming the Doji Star.
  5. Short positions are initiated after the pattern has developed, with a stop-loss level placed above the resistance level.
  6. Potential profit targets are at key support levels: 34.06, 33.33, 32.78, 32.18, 31.25, and 30.14. Lock in 50% of the trade at each level.
  7. Bulls have picked up momentum at 30.14, warning of a possible upward reversal. At this level, you should lock in the remaining profit and close your trades.

Common Mistakes to Avoid

  1. Insufficient confirmation. A Doji Star candlestick pattern alone does not guarantee a reversal. False signals may occur, so it is essential to wait for confirmation, such as a breakout of the resistance/support level.
  2. Weak market context. A Doji Star pattern may appear during consolidation, where it is less significant. Thus, it is crucial to analyze the overall trend and market context. If the market is trending sideways, a Doji Star may simply be a random fluctuation.
  3. Misidentification. A Doji Star should have a small body and long shadows located above or below the previous candlestick. Incorrect pattern identification can lead to trading mistakes. Therefore, carefully analyze the pattern.
  4. Excessive self-confidence. Even with confirmation and a favorable market context, stop-loss levels should not be ignored since no pattern guarantees a reversal.
  5. Lower time frames. Chart patterns on lower time frames, like 1-minute charts, are often subject to market noise and generate more false signals. Therefore, it is preferable to use higher time frames, such as daily or weekly charts, for better reliability.

Pros and Cons

Like any other pattern, a Doji Star has its advantages and disadvantages, which should be considered when making trading decisions.

Pros Cons
A strong reversal signal. The pattern often foreshadows a trend reversal, especially after prolonged upward or downward trends. Requires confirmation. The signal becomes more reliable only when confirmed by subsequent candlesticks.
Easy to identify. It is visually distinct from other patterns due to the unique shape of the Doji candlestick. The pattern can generate false signals. It does not always lead to a reversal, especially in highly volatile markets or when there is no clear trend.
It can be used to determine the best entry point. The effectiveness of the pattern depends on the overall market context, support/resistance levels, and other technical indicators.
Relatively easy to use. The pattern does not require complex calculations or in-depth knowledge of chart analysis methods. Difficult to interpret. Identifying a Doji candlestick can be challenging, especially when other candlesticks with small bodies are nearby.

Doji Star vs Other Candlestick Patterns

Let’s analyze how a Doji Star differs from other similar types of Doji candlestick patterns.

  1. A Doji Star features a candlestick with a small body (often virtually absent) and long shadows, indicating market indecision. It requires additional confirmation.
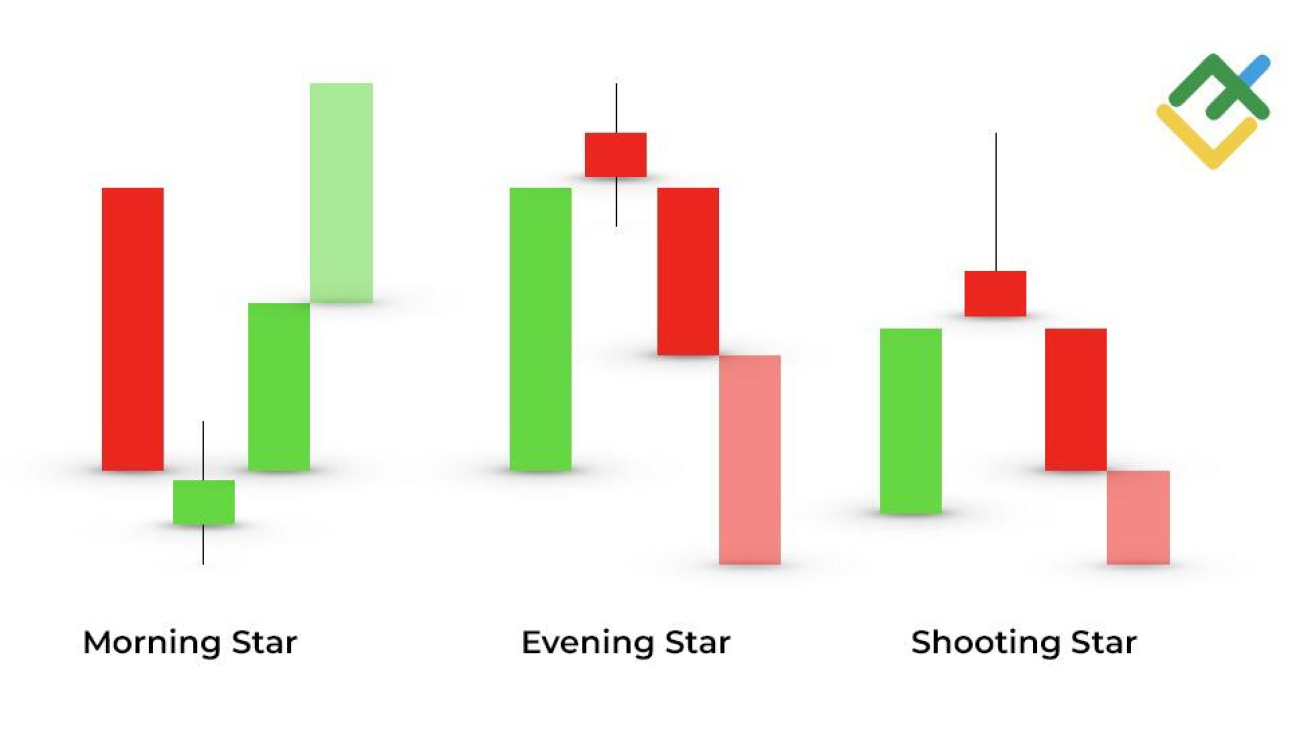
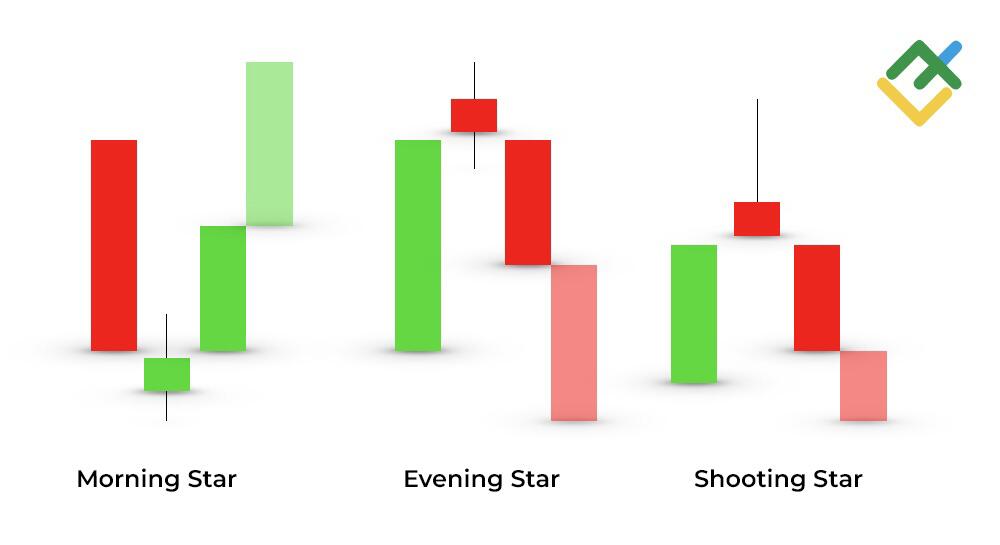
  2. An Evening Star pattern occurs during an uptrend when a small candlestick body (star) appears at the top with an upward gap, followed by a bearish candlestick. This pattern is a strong reversal signal. Unlike a Doji Star, an Evening Star Doji forms at the end of an uptrend.
  3. A Morning Star pattern is the opposite of an Evening Star. It forms during a downtrend when a star (small body) appears with a downward gap, followed by a confirming candlestick. Moreover, a Morning Doji Star pattern provides a strong signal of an upward reversal, especially when supported by high trading volume.
  4. A Shooting Star pattern forms after an uptrend and consists of two candles. The second candlestick in this pattern has a small real body and a long upper shadow. In contrast to a Doji Star, this candlestick is not necessarily a Doji. It signals a potential downward reversal.

LiteFinance: Doji Star vs Other Candlestick Patterns

Conclusion

Although a Doji Star is a strong signal, it requires confirmation from other technical analysis tools. A bullish Doji Star forms after a downward price movement and indicates that intense selling pressure is likely to subside. A bearish Doji Star appears at the end of an uptrend and warns of an imminent price decline.

Try trading a Doji Star candlestick pattern in your trading system on a LiteFinance demo account.

4-tweezr-hammer

Tweezer Top & Bottom Candlesticks

What Are Tweezer Tops and Tweezer Bottoms?

A Tweezer pattern is a reversal candlestick pattern and is considered one of the earliest candlestick patterns traders adopted to monitor trends.

LiteFinance: What Are Tweezer Tops and Tweezer Bottoms?

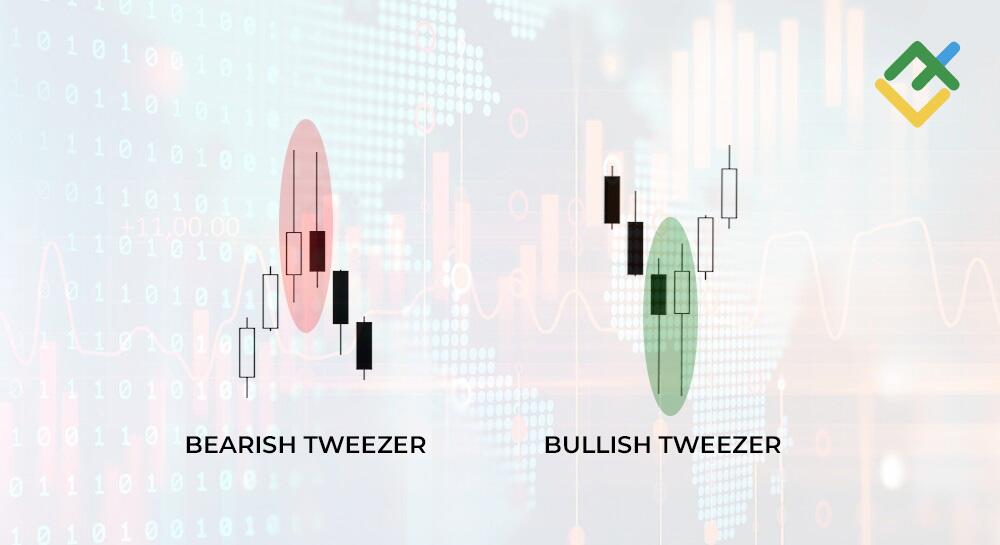
A Tweezer pattern comprises two successive candlesticks with small bodies and long shadows or wicks, positioned at the same level. The candlesticks typically have different colors, with their opening and closing prices being the same.

A Tweezer is a type of candlestick pattern that shows the strength of a market signal. The longer the candlestick shadows, the stronger the signal of a potential market reversal. Conversely, the shorter shadows suggest a weaker signal.

The strongest reversal signal is characterized by very small candlesticks with shadows that are at least three times longer than the bodies. Tweezer Top and Bottom candlesticks also indicate potential reversals and give buy or sell signals. A buy signal occurs when the Tweezer is at the bottom of a trend, while a sell signal arises when it appears at the top.

When Does the Bearish Tweezer Top and the Bullish Tweezer Bottom Show?

A Bearish Tweezer reversal pattern occurs at the top of a trend and looks like a Double Top pattern on a lower time frame. A Bearish Tweezer pattern, also known as a Tweezer Top, means that bulls are still pushing the price higher, forming a swing high. Afterward, traders lock in part of their profits, prompting the price to retreat and form the first candlestick with a long shadow. The next candlestick of a Tweezer Top signals a bearish trend reversal. Bulls initiate additional trades, hoping to continue the upward movement, but fail to maintain their gains.

After that, bears drag the price lower again, forming a second shadow and a resistance level. As a result, selling pressure outweighs bullish momentum, completely reversing the trend.

A Bullish Tweezer reversal pattern forms at the end of a downtrend and often resembles a Double Bottom on lower timeframes. Also known as a Tweezer Bottom candlestick pattern, this formation indicates that bears are still exerting downward pressure, setting a new swing low. However, as traders begin to lock in profits from their short positions, the price rebounds. The first candlestick with a long shadow forms, followed by a second candlestick that confirms the bullish reversal.

Bears, anticipating a price drop, initiate short trades but fail to break through the low. Meanwhile, bulls rally and push the price back up, creating a second shadow and establishing a support level. Consequently, buyers overpower sellers, leading to an upward trend reversal.

Identifying Tweezer Tops and Bottoms on Charts

To accurately identify a Tweezer on a price chart, it is essential to understand that the pattern comprises three key stages.

  1. First candlestick formation. Initially, the first bullish candlestick appears on a chart. It should have a small body and a long shadow, at least twice the length of the body.
  2. Second candlestick formation. The second candlestick of the pattern is almost identical to the first one. Its highs and lows, as well as its body, are approximately the same as those of the first candlestick.
  3. Reversal. Once the second candlestick closes, a rapid trend reversal typically occurs. Traders usually place a market order to enter a position during the opening of the first candlestick following a Tweezer pattern, which reflects a change in market sentiment.

LiteFinance: Identifying Tweezer Tops and Bottoms on Charts

If you want to enhance your chart analysis skills, you can use a candlestick patterns cheat sheet, which can help you recognize various patterns and start trading effectively.

How to Trade with Tweezer Patterns

Let’s find out how to identify a Tweezer pattern and use its signals in Forex trading.

LiteFinance: How to Trade with Tweezer Patterns

The 4-hour GBPUSD chart above shows three Tweezer patterns that formed within a couple of weeks.

Opening a short trade.

  1. The first Tweezer appeared at the top of the market, and the price fell sharply.
  2. It is better to set a sell order during the formation of the first candlestick after the pattern. On the chart above, it is black and opened with a gap.
  3. A stop-loss order is usually placed at the level of the longest shadow of the pattern or slightly above it.
  4. Setting a take-profit order is not as easy. A common approach is to set the target at a distance equal to the combined length of the body and shadow of the last candlestick in the pattern. However, this distance is often too small to generate significant profit. An alternative strategy is to use a trailing stop, which allows traders to profit from a strong price movement.

Opening a long trade.

  1. Now let’s examine the second Tweezer pattern, which formed at a swing low. The formation of this pattern signals a potential bullish reversal.
  2. Place a buy order at the opening level of the first candlestick after the pattern.
  3. A stop-loss order is usually set at the level of the longest shadow of the pattern or slightly below it.
  4. The profit target is determined in the same way as for short trades. If you use a traditional take-profit order, the target will be set at a distance approximately equal to the size of the entire bullish candlestick at which the trade was opened. However, a trailing stop can help you capture larger profits.

A Tweezer pattern is considered one of the most reliable candlestick signals and typically does not require additional confirmation, making it popular among Price Action traders. However, in modern trading practice, many traders tend to interpret it as a standard Engulfing pattern. In such cases, confirmation becomes necessary, as false signals are quite common.

The most effective tools for confirming signals are oscillators, such as the MACD, Awesome Oscillator, and the RSI. Classic trend indicators, such as Moving Averages or the Alligator indicator, are not as effective in confirming reversals. These technical indicators lag behind, often confirming a signal only after the third candlestick has closed. This delay can cause traders to miss out on significant profits.

Benefits and Disadvantages of Using Tweezer Top and Bottom Patterns

Although a Tweezer pattern is a highly reliable formation, like any other pattern, it has several limitations that should be considered when trading.

Tweezer Candles vs Other Reversal Patterns

Being a classic reversal formation, Tweezers may encompass other smaller reversal patterns, typically single candlesticks, that reinforce its signal.

Tweezers vs Hammer

A Tweezer pattern closely resembles a Hammer pattern. The main difference is that a Hammer consists of one candlestick, while a Tweezer consists of two. When two consecutive Hammers appear, they form an ideal Tweezer pattern.

LiteFinance: Tweezers vs Hammer

This occurs because both patterns arise from the same market conditions. In each case, buyers and sellers engage in a battle, and eventually, one side prevails.

Traders often spot a Hammer pattern on the chart and enter the market based on its signal. When a second candlestick forms a Tweezer pattern, it serves as additional confirmation of the trend reversal, giving traders a profitable opportunity to increase the volume of their position.

Tweezers vs Shooting Star

A Shooting Star consists of a single candlestick and is the opposite of a Hammer pattern. A Shooting Star pattern appears in a bullish market.

LiteFinance: Tweezers vs Shooting Star

Two consecutive Shooting Star patterns form a Bearish Tweezer pattern. The approach to placing pending orders remains the same as for a Tweezer pattern.

Similar to trading a Hammer pattern, traders enter the market right after a Shooting Star emerges. If a Tweezer pattern appears afterward, it serves as additional confirmation and provides an opportunity to add to the existing position.

Tweezers vs Engulfing Patterns

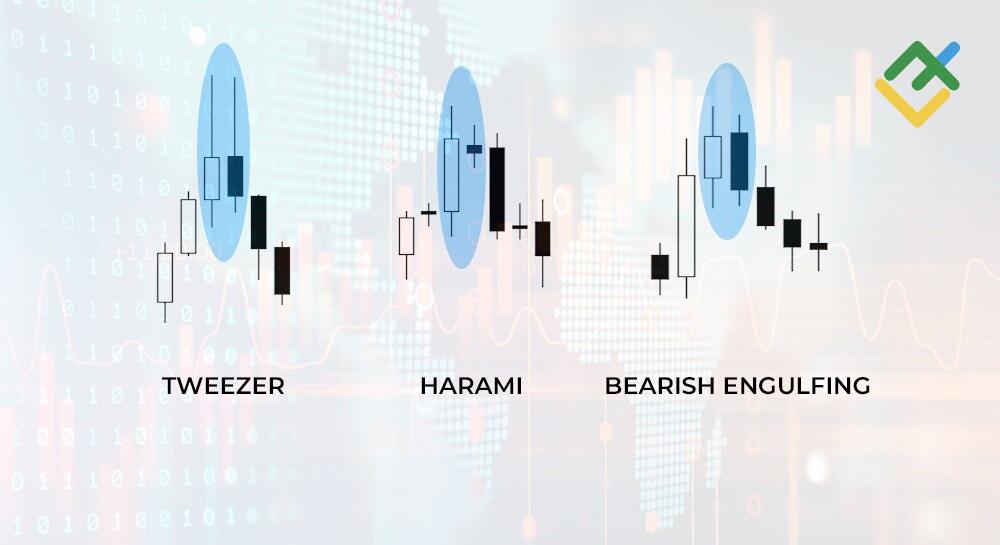
Essentially, a Tweezer pattern in technical analysis is the initial form of a classic Engulfing pattern. That is why, traders sometimes mistake it for other patterns, such as Bullish Engulfing or Harami.

LiteFinance: Tweezers vs Engulfing Patterns

All these patterns share a similar structure and are made up of two candlesticks. The logic behind the price movement is the same for both the Engulfing and Tweezer patterns: sellers overpower buyers in bearish setups, while buyers absorb selling pressure in bullish ones. The only exception is a Harami pattern, which works differently but is also considered a strong bullish or bearish reversal signal.

Conclusion

Trading with such technical analysis tools as candlestick patterns is particularly popular among traders with limited capital since candlestick patterns are easy to recognize on charts and are relatively reliable.

Although a Tweezer candlestick pattern is pretty rare, once you learn how to spot it, you can get a strong reversal signal. Moreover, to make your trading strategy even more effective, stick to the basics of effective trading and follow a few simple rules.

Only trade patterns that appear on higher time frames. Tweezers give the most reliable signals on a 4-hour and daily chart. When opening a position, be sure to set a stop loss and take profit. Once the price approaches the take-profit level, replace this order with a trailing stop. This approach will help you maximize your profits.

how-to-trade-eur-usd-5

Best Time to Day Trade EURUSD

The euro/dollar (EURUSD) currency pair is among the most traded pairs in the Forex market, favored for its high liquidity, narrow spreads, and substantial trading volumes. Its popularity stems from the strong interest of both institutional and retail traders, making it an appealing choice for beginners and seasoned market participants.

Traders, regardless of their experience, should grasp the unique traits of the EURUSD pair to capitalize on its trading potential. This article outlines effective strategies for the euro-dollar trading and explores why this pair is considered one of the most stable in the market.

Major Takeaways

  • EURUSD is the most traded currency pair on Forex, accounting for almost a quarter of all transactions.
  • The EURUSD exchange rate depends on the monetary policy of the US Fed and the European Central Bank.
  • The main factors affecting the EURUSD exchange rate include GDP growth rates, the inflation level, retail sales, and interest rates.
  • The EURUSD pair is highly liquid and volatile, which makes it commonly chosen by traders.
  • When trading the EURUSD pair, technical and fundamental analyses are employed, examining indicator readings alongside macroeconomic data.
  • The best time for day trading is during the overlap between the London and New York sessions.
  • Geopolitical events may significantly affect the EURUSD price.
  • A trading platform that offers a demo account is the ideal way to learn how to trade the EURUSD pair safely.

EURUSD Pair Overview

The US dollar, embodying the world’s largest economy, and the euro, the unified currency of the European Union, constitute one of the most influential currency pairs in global finance. In this pair, the euro is the base currency, and the US dollar is the quote currency. The EURUSD pair serves as a vital conduit for international trade and cross-border investment, with its valuation intricately tied to the political stability and economic trajectories of both the US and the Eurozone.

The history of the US dollar dates back to 1776, when it was adopted as the national currency following the country’s declaration of independence. Its global influence surged after World War II, as the weakened British economy left the pound unable to compete on equal terms. Meanwhile, Europe had long nurtured the ambition of creating a unified currency, which ultimately materialized in 1999 with the launch of the euro, the single currency for 19 Eurozone member states.

Since its inception, the EURUSD pair has evolved into the most actively traded currency pair in the world, influencing numerous cross rates such as EURJPY and GBPUSD. Therefore, traders need to monitor not only technical indicators but also global economic news and the monetary policies of major central banks.

LiteFinance: EURUSD Pair Overview

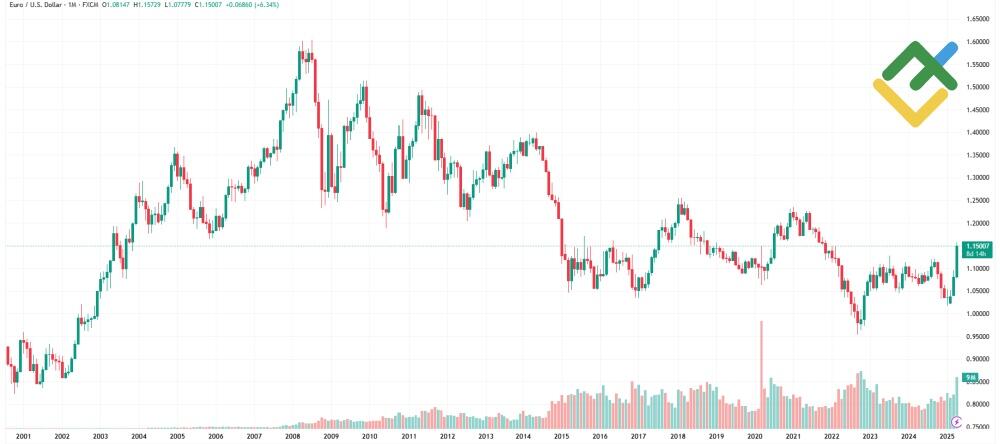
EURUSD Pair Performance in 1999–2025

The EURUSD pair is characterised by constant fluctuations. While it initially traded below parity following its introduction, it has mostly remained above the $1 mark since autumn 2002.

The EURUSD pair reached its all-time high of $1.6039 on 15.07.2008. The all-time low was recorded on 26.10.2000 when the pair declined to $0.8227.

Following the 2008 financial crisis, the exchange rate stood at $1.23. The economic landscape shifted dramatically during the COVID-19 pandemic, leading to sharp spikes in liquidity. In 2021, the exchange rate ranged between $1.17 and $1.23, highlighting the tensions surrounding the Federal Reserve’s monetary policy during that period.

In 2022, the euro dropped below parity with the dollar for the first time in quite a while, amid aggressive Fed rate hikes and the economic crisis in the EU. However, in 2023, the EURUSD pair stabilised in the $1.05–$1.10 range.

As of the first half of 2025, the EURUSD pair is trading in the range of $1.02–$1.15 due to global market uncertainty and a challenging geopolitical environment.

Reviewing the pair’s historical performance provides valuable insight into its cyclical nature and overall stability, helping make more informed forecasts about future movements. Notably, the EURUSD pair reacts not only to economic conditions in the US and EU but to broader global risks as well.

LiteFinance: EURUSD Pair Performance in 1999–2025

Latest EURUSD Trend Changes

In 2025, the EURUSD pair has shown significant volatility, with exchange rates ranging from $1.02 to $1.15. This fluctuation results from various factors, including the monetary policies of the Federal Reserve and the European Central Bank, macroeconomic reports, and global geopolitical tensions. Changes in interest rates by central banks trigger immediate responses in the Forex market.

Key economic data, such as retail sales and gross domestic product (GDP), also remain significant factors. These indicators affect investor sentiment and the price of the pair.

Factors Affecting the EURUSD Currency Pair

The EURUSD exchange rate depends on a variety of macro- and microeconomic factors:

  • Monetary policy decisions. Quantitative easing, programs tapering, or introducing new stimulus measures tend to immediately impact the exchange rate. The interest rate differential between the US and the EU also influences the EURUSD pair.
  • Key economic data. Consumer prices, retail sales, unemployment rate, and GDP may affect central banks’ decisions on future interest rates.
  • Geopolitical events. Instability in Europe or the US, elections, military and trade conflicts, or sanctions may temporarily increase the volatility of the traded currency pair.
  • Overall state of financial markets. Investors’ risk appetite (risk-on/risk-off) affects the attractiveness of foreign currencies, including the euro dollar pair.

Analysing these factors requires a systematic approach, allowing traders to make more informed decisions in both short-term and long-term trading.

Best Time to Day Trade EURUSD

Choosing the right time for trading is vital, particularly in day trading. The EURUSD pair sees its highest trading volumes during the overlap of the European and American sessions, from 15:00 to 18:00 GMT+3. During this period, major exchanges—London and New York—are open, leading to favorable conditions for significant price movements, especially with key economic data releases or central bank announcements.

Additionally, traders should monitor macroeconomic statistics. Reports on retail sales, GDP, consumer prices, and interest rate decisions are typically released at 15:30 and 17:00 GMT+3, often causing sharp price movements of 30–100 pips within minutes.

A trading day can be divided into periods of high and low volatility:

  • Asian session (02:00–10:00, GMT+3): low activity on the EURUSD pair.
  • European session (10:00–18:00, GMT+3): increased liquidity and trend formation.
  • American session (15:00–23:00, GMT+3): highest volatility.
  • Evening (after 18:00 GMT): lower activity, possible sideways movement.

LiteFinance: Best Time to Day Trade EURUSD

Understanding these regularities allows traders to develop strategies based on specific periods of the day and to follow risk management rules, such as avoiding trading when unexpected news is released.

EURUSD Technical Analysis

Technical analysis is an essential part of Forex trading. When applied to the EURUSD pair trading, it helps identify potential entry and exit points based on historical price movements. The main tools include technical indicators and chart patterns.

Popular Technical Tools

Practical Application Examples

  • A bullish crossover of the 50-period and 200-period MAs can signal an opportunity to open long trades.
  • If the RSI value exceeds 70, consider locking in profits on long trades.
  • The key levels of 1.1000, 1.1200, and 1.1500 are significant psychological thresholds often used by experienced market participants in their trading systems.

LiteFinance: Practical Application Examples

Conclusion: Technical analysis plays a vital role in both short-term and long-term strategies. Besides, its effectiveness increases significantly when it’s combined with fundamental analysis and solid risk management practices.

EURUSD Trading Strategies

A trading strategy is a systematic approach to opening trades based on market conditions and fundamental and technical analyses. There are many approaches to trading the EURUSD pair, as it is one of the most traded currency pairs.

1. Trend Trading

Trend trading is a strategy involving identifying a directional price movement. A trader determines the upward or downward trend using technical indicators and then opens positions in the trend’s direction.

Example: If the EURUSD pair breaks through the resistance level amid the release of a strong Eurozone GDP report, one may consider long trades. The MACD and moving averages can be used to confirm the trend.

2. Scalping

Scalping is a fast-paced intraday trading strategy in which traders open multiple positions within short-term time frames, from a few seconds to several minutes. This approach demands quick decision-making, a stable internet connection, and a high-quality trading platform.

Advantages: High trade frequency and the opportunity to generate steady profits.

Risks: High sensitivity to spreads and commissions, cognitive strain from constant focus.

3. Swing Trading

Swing trading is a medium-term strategy that involves holding positions open for several hours or days. It is based on a combination of technical and fundamental analysis.

Tools: RSI, support/resistance levels, candlestick patterns.

4. News Trading

News trading is suitable for those who closely follow the publication of key economic data. During the release of retail sales reports, consumer price data, or the publication of US Fed decisions, sharp price jumps are observed, creating attractive trading opportunities.

LiteFinance: 4. News Trading

Tip: In news trading, it is crucial to set stop-loss and take-profit orders in advance to minimise risks.

5. Automated Trading

Automated trading involves using expert advisors or robots customized for a specific trading system. This approach is especially relevant for the EURUSD pair due to its high liquidity and relative predictability.

Important: Test your strategy on a demo account and follow the risk management rules.

Every strategy requires discipline, skill, and analysis. Beginners are advised to start with swing trading or trend trading and then, as they build their experience, they can venture into other strategies.




Untitled

EUR/USD: Nothing new on the table, the pair remaining ”heavy” above 1.1250 level

The single European currency remains stable above 1,12 level but in a limited range of fluctuation as the very poor agenda of the last day along with investor caution have limited bets.

The start of the week did not bring any surprises, the European currency maintained a mild upward trend, consequently absorbing almost all of the losses of the previous week, where it was drop at the level of 1.1065.

President Donald Trump’s controversial policies remain high on investors’ agendas, and although concerns about an impending trade war between the United States and China have eased significantly in recent days, question marks remain.

Speculation surrounding US debt securities remains a major thorn in the side of the US dollar, especially following the recent downgrade of the US credit rating by Moody’s.

Despite yesterday’s decline, the 10-year bond remains close to the 4.50 level. Under normal circumstances, these high yields would have been a significant advantage for the US dollar and should have already led it to higher prices, but this is not happening at the moment and confirms the environment of confusion and great concern among investors.

The bigger picture of the market remains the same with the exchange rate not having any strong direction at the moment.

The European currency since it climbed to its high of 1.1575 has again come under mild doubt but on the other hand the American currency after the very good correction is struggling to continue to shine.

And today’s agenda is relatively poor, so the scenario of a limited trading range has some good chances.

No any changes in my thoughts, maintaining some good possibility in the scenario that the range of variation will remain between the levels 1.11 and 1.16 for the near future, maybe with some good deviations as we observed on last week.

Untitled

GBP/USD exits bearish channel

  • GBPUSD increases odds of bullish continuation. 
  • A break above 1.3440 could hand over control to the bulls.

Chart

GBPUSD has broken above a bearish channel, as Moody’s credit downgrade of the US economy and improving EU-UK trade relations have brought bullish momentum into play.

A close above the 20-day simple moving average (SMA), along with a positive slope in the momentum indicators, continues to favor the bulls. However, the 1.3400–1.3440 resistance zone could still pose a challenge. A decisive break above this ceiling is likely needed to trigger a swift rally toward the 1.3645 resistance zone. Beyond that, the 1.3750 level – aligned with the 2021 high – may be the next obstacle before the 1.3830 barrier.

On the downside, the 1.3260 support base could keep bearish pressure in check. If that level fails, the price may drop toward the 50-day SMA, located near the 23.6% Fibonacci retracement of the 2025 uptrend at 1.3130, or potentially down to the lower boundary of the downward-sloping channel at 1.3070. A further decline could then target the 38.2% Fibonacci level at 1.2933 and the 200-day SMA at 1.2870.

In summary, GBPUSD is shaping a bullish path, with investors awaiting a confirmed break above the 1.3440 level to ramp up buying activity.

Canada CPI set to ease in April amid inflation uncertainty from US tariffs

Canada CPI set to ease in April amid inflation uncertainty from US tariffs

All eyes will be on Statistics Canada this Tuesday as it releases the April Consumer Price Index (CPI), a key inflation gauge that the Bank of Canada (BoC) closely tracks when setting interest rates.

Headline inflation is expected to have eased sharply, with annual CPI forecast to fall 1.6% from 2.3% in March. On a monthly basis, however, inflation is projected to have picked up slightly, rising 0.5% versus the previous 0.3% increase.

The Bank of Canada will also release its preferred core inflation measures, which aim to strip out volatile price swings for a clearer view of underlying trends. In March, the BoC’s core CPI CPI rose 2.2% from a year earlier.

While recent inflation data suggests price pressures are moderating, markets are expected to tread carefully. The figures do not yet reflect the full impact of US trade tariffs recently imposed under the Trump administration—an element that could complicate the inflation outlook in the months ahead. As a result, a cautious tone is likely to prevail among investors and policymakers alike.

What can we expect from Canada’s inflation rate?

The BoC held its benchmark interest rate at 2.75% last month, pausing after seven consecutive cuts and citing mounting uncertainty surrounding US trade policy as a key reason for withholding its usual economic forecasts.

Officials said the unpredictability of US-imposed tariffs and the potential for a broader global trade conflict made it impossible to provide a reliable outlook. Instead of its regular quarterly projections, the bank released two hypothetical scenarios to illustrate possible outcomes:

In the more optimistic scenario, most tariffs are eventually rolled back through negotiation. The Bank said this would likely result in a temporary slowdown in Canadian and global growth, with inflation dipping to 1.5% for a year before returning to the 2% target.

A more severe scenario envisions a prolonged global trade war. In that case, Canada would enter a deep recession, and inflation would surge past 3% by mid-2026 before gradually easing back to target levels. The bank acknowledged that other outcomes were possible, underscoring the high degree of economic uncertainty.

In its annual Financial Stability Report (FSR), the central bank acknowledged that the system remains resilient for now, but it also flagged rising vulnerabilities if trade tensions drag on.

Officials pointed to the tariffs imposed by US President Donald Trump on Canadian goods and Ottawa’s retaliatory measures as potential threats. They said that while the financial sector is currently holding up well, ongoing tariff battles could eventually hurt banks and financial institutions by making it harder for households and businesses to manage their debt.

The BoC noted that, in the short term, the unpredictability of US trade policy could trigger more market volatility and strain liquidity. In more extreme cases, that kind of turbulence could escalate into broader market dysfunction.

Over the medium to long term, the bank said, a full-blown global trade war could have severe economic consequences.

When is the Canada CPI data due and how could it affect USD/CAD?

Canada’s April inflation data is due out on Tuesday at 12:30 GMT, and markets are bracing for a mixed picture. While there’s a general sense that price pressures may have eased somewhat, the details could go either way.

If inflation comes in hotter than expected, it might prompt the BoC to take a more hawkish stance, which could give the Canadian Dollar a boost. On the flip side, softer numbers would likely reinforce expectations for more rate cuts, putting some pressure on the Loonie.

That said, a sharp jump in inflation isn’t necessarily good news either. It could raise red flags about the health of the Canadian economy, and ironically, that kind of surprise might end up weighing on the currency too. In short, markets are watching closely—not just for the headline number, but for the broader message it sends about where policy and growth are headed.

Senior Analyst Pablo Piovano from FXStreet pointed out that USD/CAD has moved into a consolidative range just below its critical 200-day Simple Moving Average (SMA) at 1.4012.

“If the Canadian dollar manages to clear its 200-day SMA, the near-term outlook should shift to a more constructive one, allowing at the same time for the recovery to gather pace. That said, the 55-day SMA at 1.4098 should offer interim resistance prior to the April high of 1.4414, set on April 1, with a further barrier at the March peak of 1.4542. A breakout above that level could bring the 2025 high of 1.4792, posted on February 3, back into view,” he added.

The resurgence of the bearish tone could motivate USD/CAD to embark on a potential visit to its 2025 floor at 1.3838, marked on April 11,” Piovano said. “That would be followed by the November 2024 low at 1.3817, with the next key support seen at the September 2024 trough of 1.3418.”

From a technical standpoint, Piovano flagged that USD/CAD is currently signalling some sidelined mood based on the Relative Strength Index (RSI) around the 50 threshold. He added that the Average Directional Index (ADX) is easing toward 24 points to some loss of impetus of the current trend.

arr

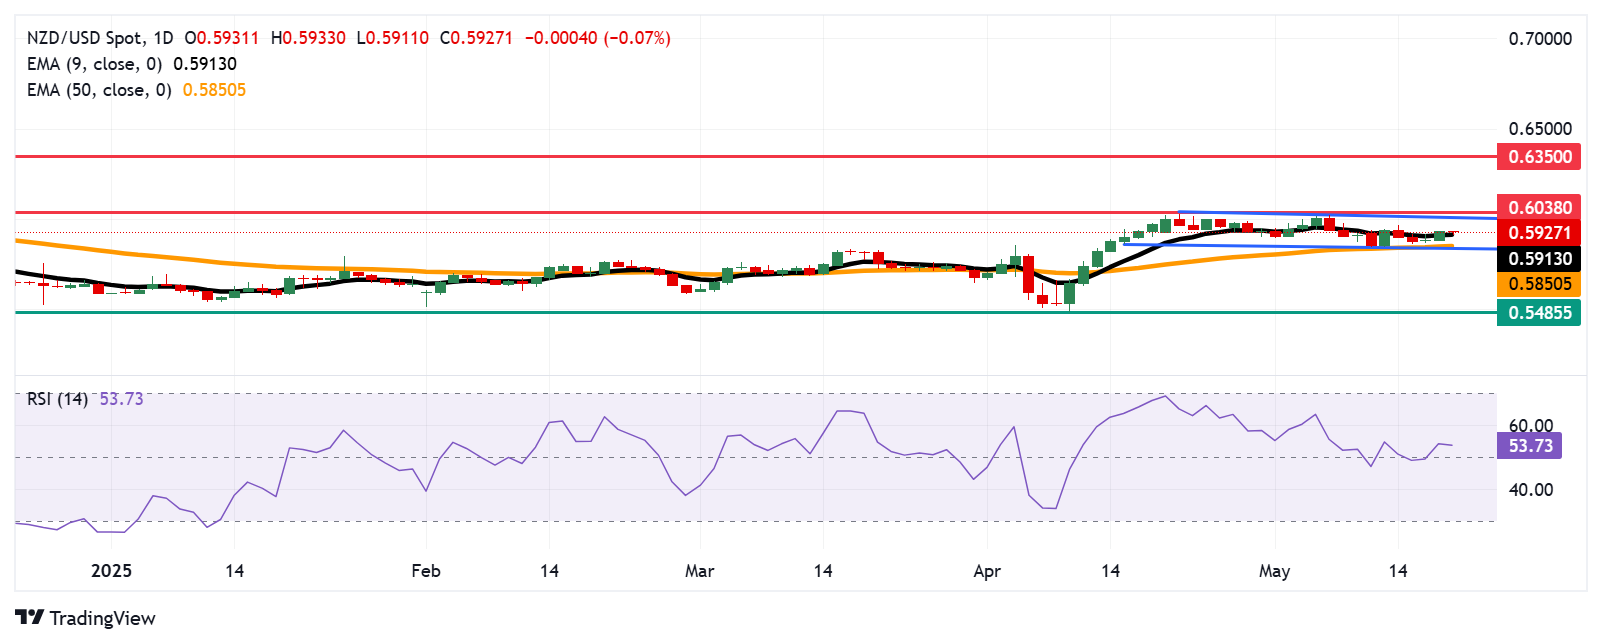
The NZD/USD pair halts its two-day winning streak, trading around 0.5930 during the European hours

The NZD/USD pair halts its two-day winning streak, trading around 0.5930 during the European hours on Tuesday. Daily chart technicals suggest a neutral outlook, with the pair remaining confined within a consolidation rectangle.

The 14-day Relative Strength Index (RSI) hovers just above the 50 mark, suggesting a slight bullish inclination. Meanwhile, the NZD/USD pair trades near the nine-day Exponential Moving Average (EMA), indicating neutral short-term momentum.

The NZD/USD pair may aim for the upper boundary of the consolidation range near 0.6000, with the next target at the six-month high of 0.6038, last reached in November 2024. A decisive break above this key resistance zone could pave the way for a move toward the seven-month high around 0.6350, marked in October 2024.

On the downside, initial support for the NZD/USD pair lies around the nine-day EMA at 0.5913. A break below this level would signal weakening short-term momentum, potentially driving the pair toward the 50-day EMA at 0.5850, which aligns with the rectangle’s lower boundary. A sustained move beneath this critical support zone could further erode medium-term momentum, opening the door for a deeper decline toward 0.5485 — a level not seen since March 2020.

NZD/USD: Daily Chart