08166635848

UK: Asking prices drop as ‘less frantic’ property market emerges – Rightmove

The housing market is becoming more price sensitive as listing values drop and cuts rise, Rightmove claims.

The portal’s latest data shows 7% of unsold properties had their prices reduced last month, slightly up on the 7.5% that were reduced in October 2019.

It is double the 4% of properties that had price cuts in October 2021.

Rightmove’s House Price Index showed the average listing coming to market is now valued at 1.1% lower than a month before, with annual growth slowing from 7.8% to 7.2%.

That puts average asking prices £366,999.

Rightmove said buyer demand is still up by 4% on the more normal market of 2019, but down by 20% on October last year

First-time buyer properties continue to be the most affected sector, with year-on-year demand down by 26% in October, while second stepper demand is down by 17%, and top of the ladder is down by 15%, according to the portal.

The analysis showed a 13% annual increase in new sellers coming to market, while average stock per agent dipped slightly from 50 to 49 in October.

The typical time on the market has also increased to the highest level since January 2022 at 40 days.

Tim Bannister, Rightmove’s director of property science, said: “The now largely superseded mini-Budget sped up the slowing of market activity that we had been seeing since the summer, and we’re now in another state of limbo as we wait for any surprises or help in Jeremy Hunt’s Autumn Statement on Thursday.

“The frenzied market of the past two years has turned into a more normal market more abruptly and less smoothly than we were expecting.

“Though many are getting on with moves, especially those with a purchase already agreed, understandably there are people who are pausing for thought.

“Some buyers have decided to turn their attention to Christmas instead, and be part of the New Year jump in home-moving activity.”

Bannister said there isn’t a glut of unsold properties, and the average number of enquirers for the low number of available properties for sale is still over a third higher than it was back in October 2019, which he said is helping to prevent any price falls by more than is usual at this time of year.

He added: “The era of historically low interest rates and the buying frenzy are over, which could make way for a more normal market that opens up potential opportunities for those who were put off entering the frantic market over the past two years.”

image1.png

Japanese Yen Boosted Against US Dollar on Soft US CPI. Has USD/JPY Broken Trend?

USD/JPY remains under pressure at the start of this week after tumbling lower into the weekend in the wake of softer US CPI data.

The deceleration in price pressures has led to perceptions that the Fed may not have to raise rates as far next year as had previously been anticipated.

The easing in the CPI number didn’t change the swaps and futures markets pricing for the December Federal Open Market Committee (FOMC) meeting. Both markets are pricing in a 50 basis point hike.

Last week saw Japanese PPI remain at an elevated level, with mixed results in the data. The month-on-month figure for October was 0.6% rather than the 0.7% forecast and previously.

The year-on-year read was 9.1% instead of the 8.8% expected and 9.7% prior. The disparity is explained by an upward revision to previous months.

It is a big week ahead for Japanese data. GDP, industrial production, machine orders and national CPI reports lead the way from Tuesday onwards.

The inflation print could be especially crucial in light of the market reaction to US CPI and the implications for the Bank of Japan’s (BoJ) approach to monetary policy going forward.

The BoJ have a policy rate of -0.10% and are maintaining yield curve control (YCC) by targeting a band of +/- 0.25% around zero for Japanese Government Bonds (JGBs) out to 10-years.

According to a Bloomberg survey of economists, Japanese GDP is forecast to grow 0.3% in the third quarter compared with the prior three months, yielding a year-on-year figure of 1.2%. Both readings are seasonally adjusted.

This is against 3.7% year-on-year CPI anticipated for October, which illustrates the Japanese economy’s susceptibility to stagflation at this time.

USD/JPY TECHNICAL ANALYSIS

USD/JPY broke below the lower bound of an ascending trend channel last week in an abrupt move that could signal the petering out of the bullish trend.

Previous support levels that have been broken might now offer breakpoint resistance at 140.35, 143.53, 145.11 and 145.47.

Support could be at the previous low and break point of 135.81 and 135.57 respectively.

image1.png

image1.png

EUR/USD Technical Outlook: Tough Barrier Ahead

EUR/USD TECHNICAL FORECAST – NEUTRAL

The Euro is running into pretty strong resistance that could at least temporarily stall the recent rally against the US Dollar.

EUR/USD is testing a tough converged ceiling: the 200-day moving average, the August high of 1.0370, near the January 2017 low of 1.0340. The last time the pair was above the long-term average was in mid-2021, so a decisive break above it will be bullish, and not just from a short-term perspective.

EUR/USD Daily Chart

image1.png

A break above the 200-day moving average would be a sign that the medium-term bearish outlook is changing. A decisive breach above could pave the way toward 1.0615 (the 38.2% retracement of the 2021-2022 slide). Momentum on shorter-time frame charts, including intraday and daily timeframes, remains positive, suggesting that a retreat is not imminent.

However, the trend and momentum on higher timeframe charts, including the weekly and the monthly, favor Euro weakness. Hence, the path of least resistance from a multi-week perspective remains sideways to down. In this regard, the key focus is on immediate support around 1.0250-1.0300. Any break below could push the pair towards 1.0120, near strong support at the late-October high of 1.0090. EUR/USD needs to stay above 1.0090 for the short-term upward pressure to hold.

EUR/USD Monthly Chart

image2.png

EUR/USD’s medium-term trend is down. The single currency’s break this year against the greenback below a slightly upward-sloping trendline from 2015 indicates that the broader picture remains bearish. The price objective following the breakout of the seven-year sideway range works out to around 0.8900.

image1.png

USD/CNH Technical Outlook: Short-Term Pullback to Continue?

USD/CNH SHORT-TERM TECHNICAL FORECAST – NEUTRAL

The Chinese yuan’s rise above key resistance against the US Dollar seems like confirmation that downward pressure on the Chinese currency has faded in the interim.

USD/CNH 240-minutes Chart

image1.png

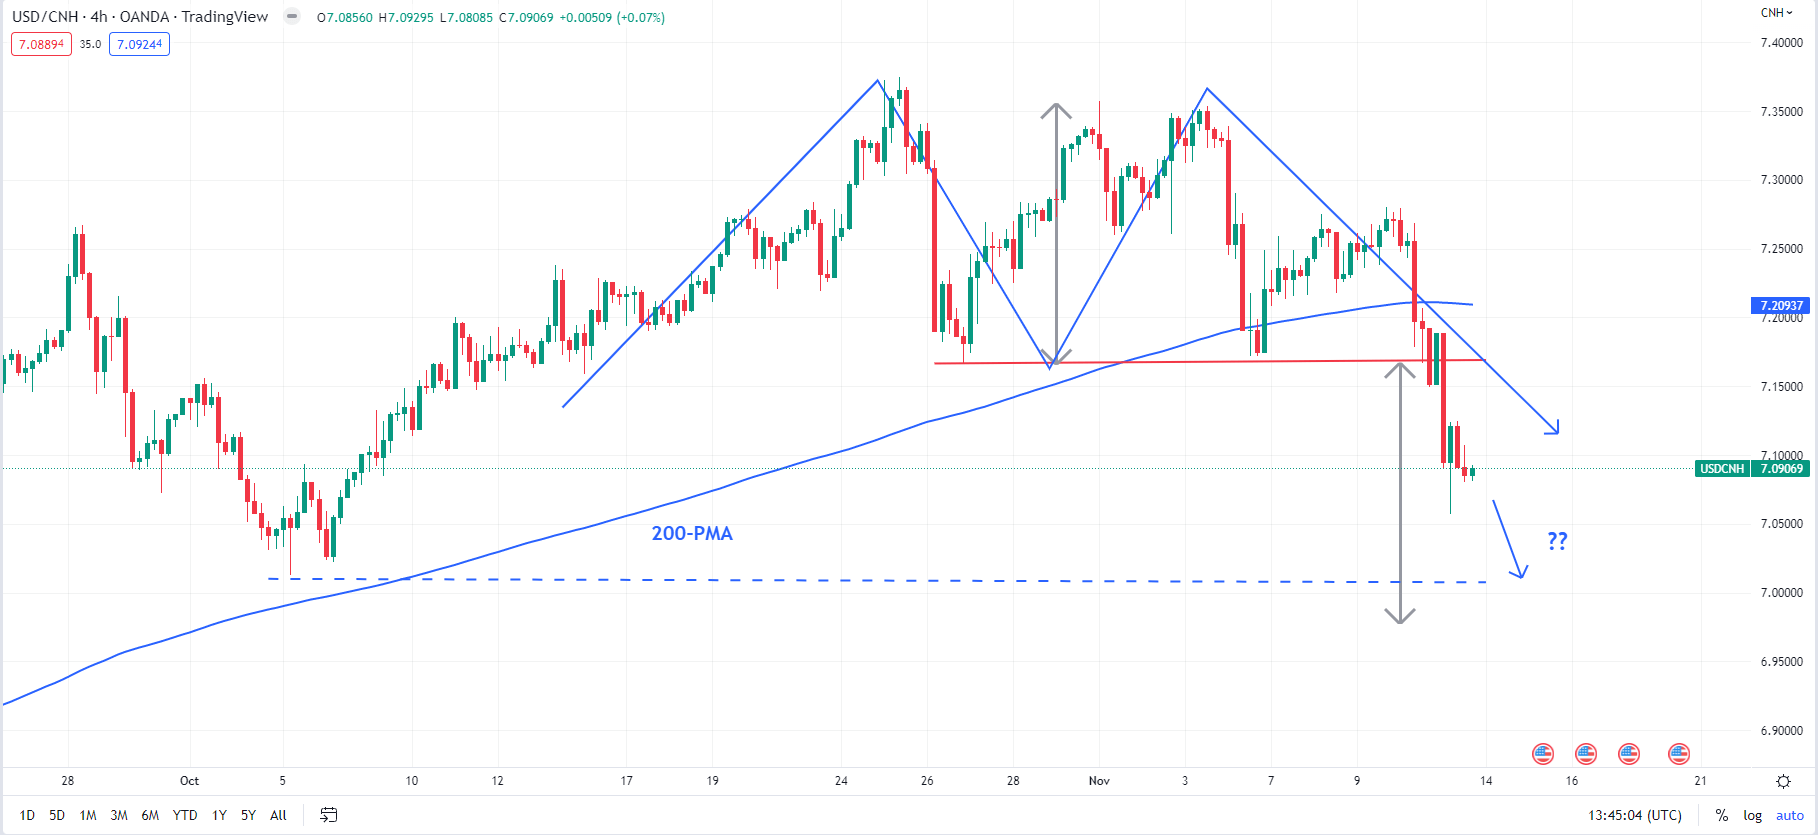
USD/CNH has fallen below quite a strong cushion at the October 27 low of 7.17, near the 200-period moving average on the 240-minute charts. It rebounded last week from this barrier but failed to cross above the mid-point of a slightly downward-sloping channel from the end of October (at about 7.25) –a path that was highlighted in the previous update. The bearish break has triggered a Double Top pattern (at the October and early-November highs), opening the way toward the October low of 7.01 (see chart above).

USD/CNH Monthly Chart

image2.png

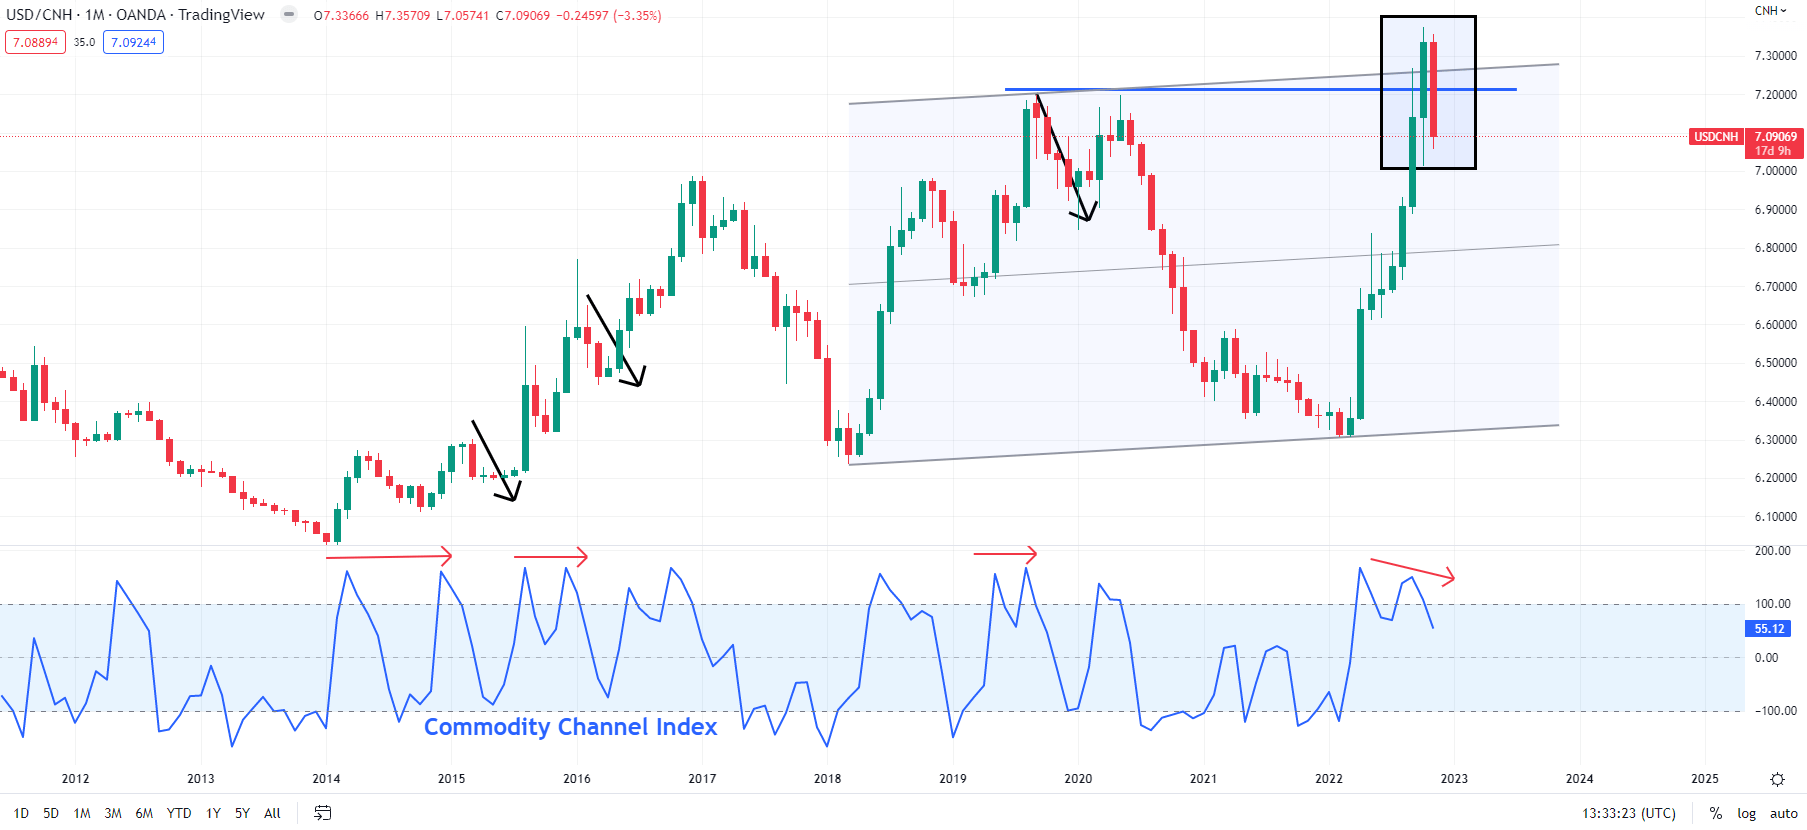
A month ago, I pointed out the risk of a pause in the USD/CNH bull run. At that time, the pair briefly rose above a major hurdle at 7.20, where the 2019 and 2020 highs coincided with the upper edge of a slightly upward-sloping channel from 2018 (see chart above). At the same time, negative divergence (rising price associated with stalling or weakening momentum) on the monthly, weekly, and daily charts indicated that the seven-month-long rally was showing signs of fatigue.

USD/CNH Daily Chart

image3.png

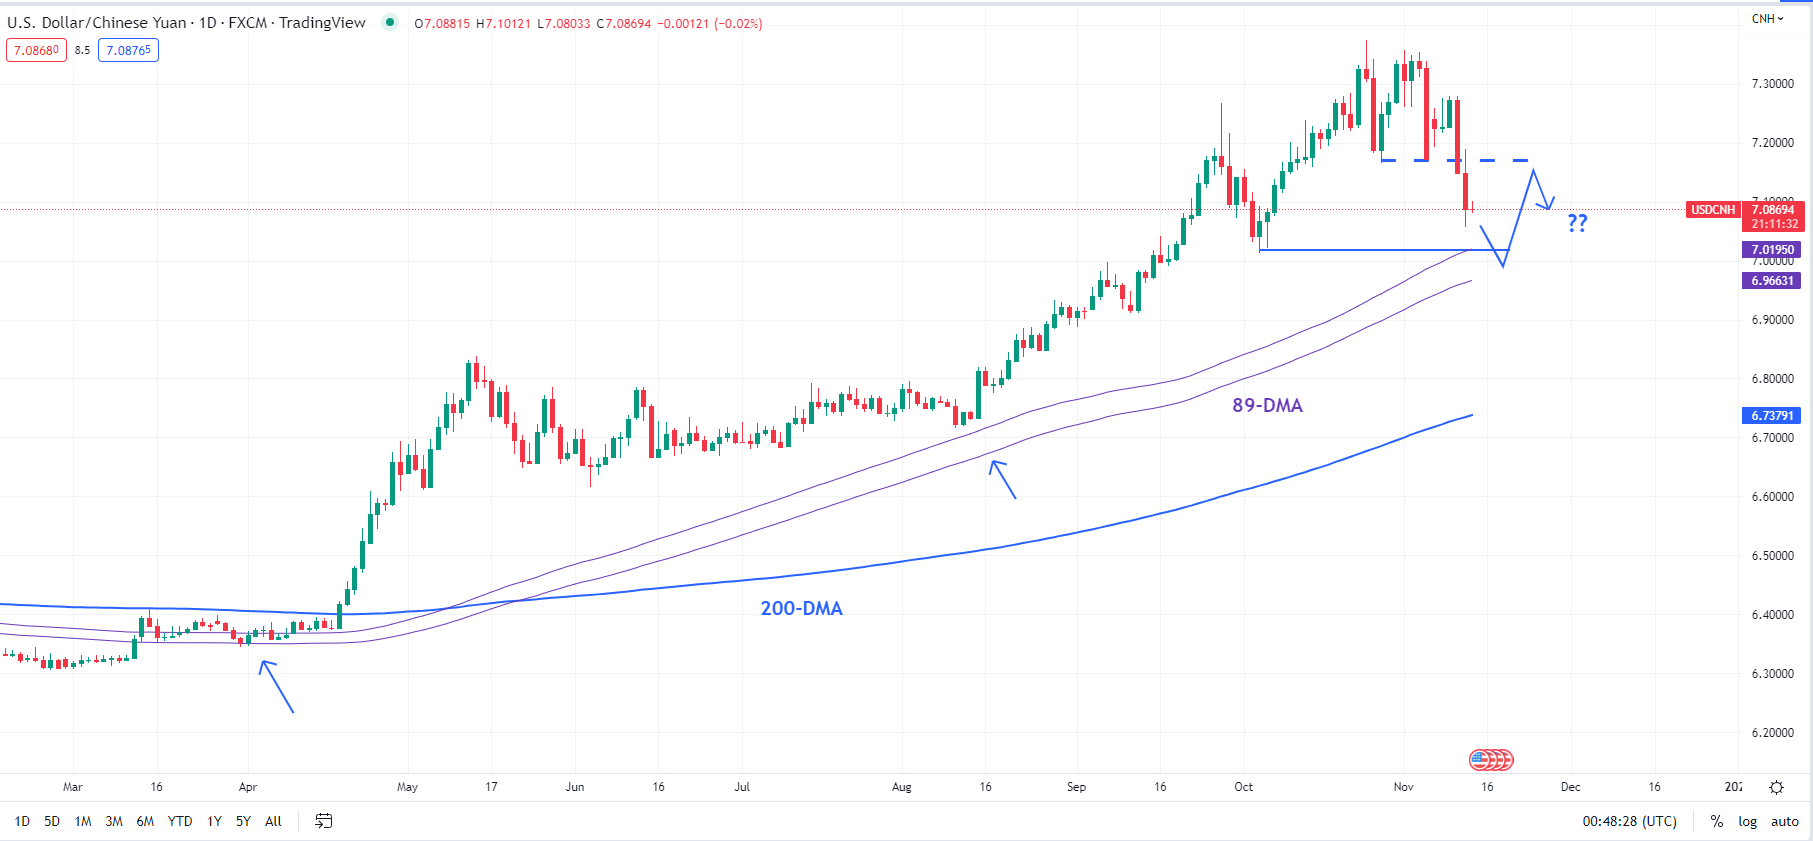
Zooming in on the daily charts, the floor at 7.01 is reinforced at the 89-day moving average (now at about 7.00), which hasn’t been broken since the USD/CNH rally began earlier this year. Hence, some sort of a rebound from around 7.00-7.01 wouldn’t be surprising. However, any such move could encounter stiff resistance marked by former support at 7.17. Still, upward momentum on longer-term charts, including the weekly and the monthly charts, remains strong (despite the recent drop in USD/CNH), so any retreat could be limited.

image1.png

Gold Looks Like Neither Inflation Hedge nor Safe Haven

For an asset often touted as some ultimate “safe haven” or “inflation hedge”, gold is having a difficult year.

If the metal really is what so many of its adherents believe it to be, then these should be some of the best days it has seen for years. After all, inflation has re-awakened across the globe. And that after decades of such obliging docility that a whole trading generation won’t have encountered price rises of current magnitude in their lives. Inured to a world in which even 2% inflation targets often proved elusive, 2022 has provided hard lessons.

And yet gold’s downtrend remains very much in place.

You don’t have to look very far to see need for a haven asset either. Russia’s invasion of Ukraine has crippled a European economy still utterly reliant on Putin’s regime for its energy needs. Tensions between China and the US threaten the last thirty years of largely peaceful globalization, to the point where many commentators are prepared to call it over. Covid has of course played its baleful part too, stunting global growth and, again, forcing a rethink of supply chains. Resilience is now prioritized where once price held sway. China’s neighbours increasingly eye its ambitions toward Taiwan with concern. Military budgets are rising across the region.

And still gold continues to weaken.

In truth the metal has spent much of the time since March behaving rather more like a classic ‘risk asset’ than any sort of haven.

image1.png

Stock markets and gold have been falling more or less together since March, which looks counterintuitive if the latter really is any sort of effective haven or inflation hedge.

Clearly, as can be seen on the chart above, prices do rise when disaster strikes or inflation rises. But it’s also clear that such gains have been short lived, and that neither has come close to breaking the prevailing downtrend.

Gold is Inflation-Sensitive, But Interest Rates Dominate

In truth gold is responsive to inflation, but really via the transmission channel of interest rate expectations.

The metal famously offers nothing beyond the prospect of price rises or, perhaps, capital preservation. There’s no yield on offer to the gold holder, no dividend. No perks of any kind, really. So, the years of historically low interest rates seen across the world and especially in the US since 2009 have flattered the asset. When yields are generally low, or even negative, the opportunity cost of holding onto a non-yielding asset shrinks too.

Now matters have gone into reverse. With interest rates rising sharply around the world, the appeal of non-yielding gold is fading.

In truth, the most powerful influence on the price of gold is the expected path of interest rates, especially in real terms. The lower the expected real rate goes, the greater is the appeal of an asset that yields nothing. Once they start to rise, gold looks short of good points.

There is possibly a caveat or two to add here. Gold’s fortunes may yet revive if the considerable firepower currently deployed by central banks in the inflation fight starts to look ineffective. The US Federal Reserve seems to be having some success in bringing prices to heel, but it’s certainly far too early for much optimism. Other monetary authorities are yet to ramp up their efforts, and it’s far from clear how successful they will be. Don’t forget that we’ve not seen inflation targeting tested in quite this manner before. In the recent past interest rate rises have been modest and quite pain-free for central banks. They’re not anymore. Increases in borrowing costs will mean real pain for businesses and consumers.

Gold Likely to Remain a Diversification Play

Moreover, in the increasingly uncertain economic and political environment we’re all getting used to, it’s hard to see precious metals being entirely evicted from portfolio recommendations. In hard times diversification is usually the watchword. The global environment might well become more supportive too. India may not have the world’s largest official holdings, but it has long been the country with the most gold within its national territory. In short, 1.4 billion people who have a long tradition of holding physical gold are getting richer. That may not see gold prices surge, but it’s bound to add some long-term support. Indeed, physical gold ownership is offered by retail banks across Asia in a way that would seem quite unfamiliar for most in the West.

But to participate in the gold market, it’s important to distinguish between investing in the metal and trading its shorter-term price moves.

If gold is viewed as some sort of defense against what we might call ultimate macro shocks, threats to the entire monetary system and fiat currency itself, then it seems illogical to hold it in any sense other than the physical. Gold products, exchange-traded funds and so on, make very little sense on this score, offering returns in the very fiat currencies which would supposedly be on the ropes should those macro shocks appear.

Trading price moves can of course be done via any method, but those keen to participate would be well-served to remember that what will matter over time are those interest-rate expectations even if the ‘haven’ or ‘inflation hedge’ impulses will clearly be seen to move the market from time to time.

As we’ve seen this year on a few occasions, those impulses fade before the interest-rate fundamentals, which seem to always reassert themselves.

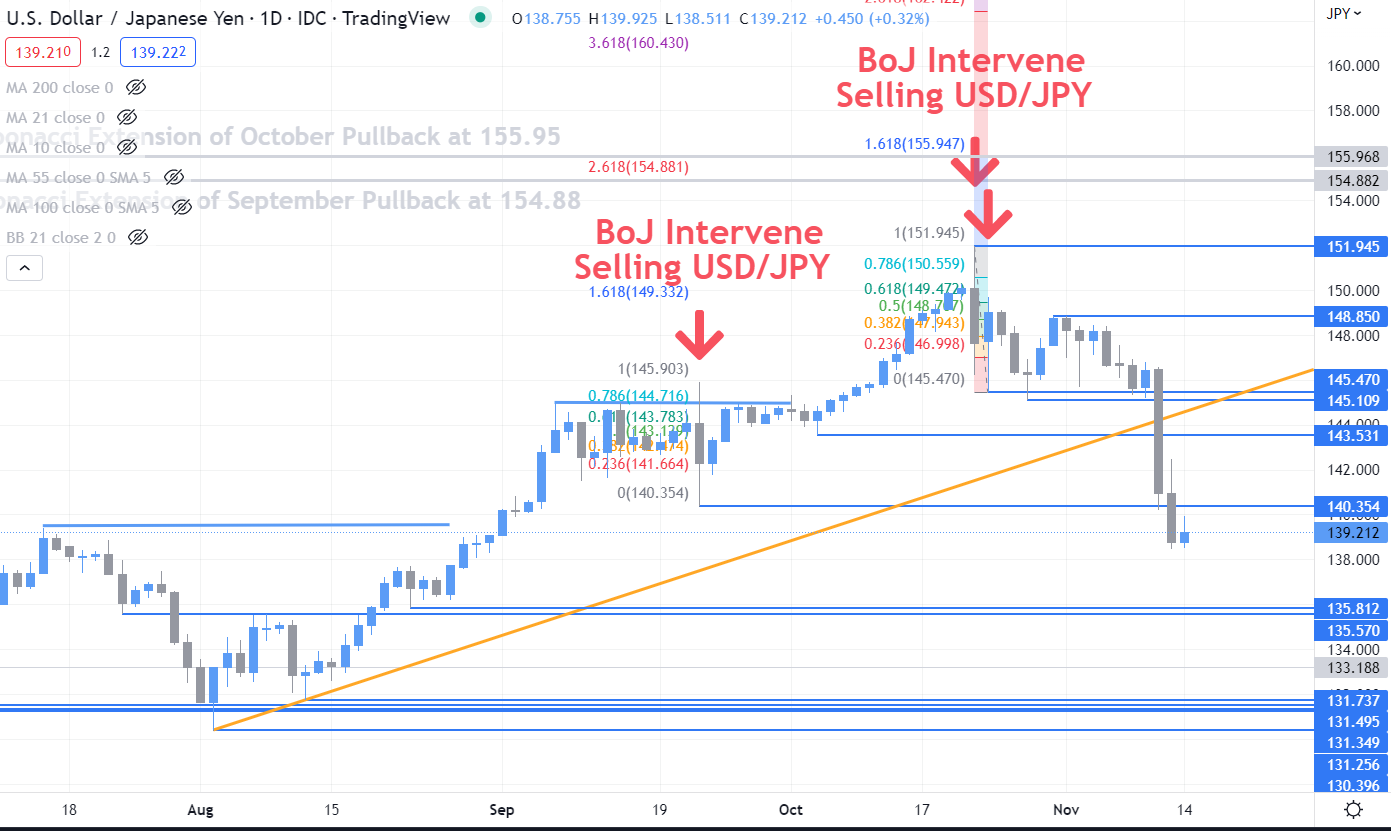
image1.png

US Dollar Finds Firmer Footing After Fed Clarification. Has the DXY Index Peaked?

The US Dollar recovered some of last week’s losses to start the week after Federal Reserve Governor Chris Waller re-iterated that he thought the Fed isn’t done with its hawkishness.

In comments made on Sunday, he said, “we’ve got a long, long way to go to get inflation down. Rates are going keep going up and they are going to stay high for a while until we see this inflation get down closer to our target.”

That target is somewhere close to 2% rather than the latest read of 7.7%.

He also highlighted that last Thursday’s softish US CPI number was only one data point. Several of his fellow board members have made this observation previously.

The British Pound and Swiss Franc have been the underperformers against the US Dollar today. Both are down around 0.50% going into European trade.

APAC equities were mixed, with Australia and Japan indices sliding slightly but China and Hong Kong bourses putting on solid gains.

This came after hints of a policy shift from the Chinese Communist Party toward Covid-19-related restrictions and support for the ailing property sector. Futures are pointing toward a soft start to the Wall Street cash session.

Cryptocurrencies continue to face scrutiny after some questions were raised about potential illegal withdrawals from FTX before its demise. Bitcoin is eyeing off last week’s low at 14925.

Crude oil is steady, with the WTI futures contract holding above US$ 89 bbl while the Brent contract is a touch above US$ 96 bbl. Gold is a bit softer, trading near US$ 1670 at the time of going to print.

Data is a bit light on for the Monday session, with Swiss industrial production being the highlight.

US President Joe Biden is anticipated to be meeting with Chinese President Xi Jinping later today ahead of the G-20 summit kicking off tomorrow. More broadly, it appears likely that the focus will be on any commentary on the relationship between China and Russia with the Western world.

The full economic calendar can be viewed here.

 DXY (USD) INDEX TECHNICAL ANALYSIS

The DXY Index snapped below a long-term ascending trend line that could potentially indicate that the bullish run has concluded for now.

Support may lie at the lows seen in June and August at 103.42, 103.67 and 104.64.

On the topside, resistance might be offered at the breakpoints of 107.43 and 107.68.

image1.png


Over half of Japan companies suffering from labor shortage: survey

Over half of companies in Japan are suffering from a shortage of full-time employees as the country’s labor crunch, caused by the aging population but temporarily eased due to the pandemic-induced economic slowdown, is compounded by recovering economic activities, a recent survey found.

Of over 11,000 businesses surveyed in September by Teikoku Databank Ltd., 50.1 percent said they felt a labor crunch, the first time a majority expressed that view since November 2019.

Eased border controls and the government’s travel discount program to boost tourism have raised hopes for a further industry recovery, but some firms were also concerned that they may not be able to cater to market demand due to the labor shortage, according to Teikoku Databank.

A total 30.4 percent of businesses also said there was a shortage of nonregular workers. Eateries and the hospitality sector, which traditionally have higher ratios of nonregular workers, were particularly hard hit at 77.3 percent and 62.3 percent, respectively.

For full-time employees, the crunch was most notably felt by the information services sector at 71.3 percent, followed by recruitment at 65.0 percent, and maintenance and security industries at 64.6 percent.

Teikoku Databank conducted the survey between Sept. 15 and 30, and received valid responses from 11,621 companies.


USDJPY adds 1.0% to pare US inflation-led slump above 142.00, US Michigan CSI eyed

USDJPY seesaws around the intraday high near 142.50 as it consolidates the biggest daily fall since October 1998 during Friday’s Asian session. In doing so, the yen pair takes clues from the market’s slightly sour sentiment, as well as inactive US Treasury yields, amid the sluggish session.

That said, the fears of coronavirus renew as China’s Beijing reports the biggest daily jump in the covid cases in over a year. For the nation as a whole, the daily coronavirus numbers grew past 10,000 for the first time in seven months. Elsewhere, the US 10-year Treasury yields remain inactive around the monthly low near 3.81%, flashed on Thursday, after registering the heaviest slump since early December 2021.

The reason for an inactive bond market could be linked to the bank holidays in the US and Canada, as well as the market’s waiting for more clues to confirm the slower rate hikes of the US Federal Reserve (Fed).

It should be noted that the increasing fears of Japan’s meddling in the forex market to defend the Yen and the Bank of Japan’s (BOJ) defense of the easy money policy, while also hoping for an economic rebound in the next years, also underpin the USDJPY rebound.

On Thursday, the US Consumer Price Index (CPI) for October surprised markets by declining to 7.7% YoY, the lowest since last March, versus 8.0% expected and 8.2% prior. More importantly, the Core CPI dropped to 6.3% compared to 6.5% market forecasts and 6.6% previous readings.

Following the data, Dallas Federal Reserve President Lorie Logan said that October CPI inflation data is a welcome relief while adding that (it) may soon be appropriate to slow pace of rate increases. On the same line, Federal Reserve Bank of Philadelphia President Patrick Harker said on Thursday that the US Federal Reserve could slow the rate hike pace in the coming months, as reported by Reuters. It should be noted that Kansas City Federal Reserve President Esther George, Federal Reserve Bank of Cleveland President Loretta Mester and San Francisco Fed President Mary Daly also recently promoted easy rate hikes for future meetings.

As a result, the CME’s FedWatch Tool signals a nearly 80% probability of the Fed’s 50 basis points (bps) rate hike in December versus around 55% just following the last week’s Fed meeting.

Given the latest hopes of an easy Fed rate hike in December, coupled with the BOJ’s favor for easy money policies, the USDJPY pair is likely to remain weak. However, today’s first readings of the US Michigan Consumer Sentiment Index (CSI) for November, expected 59.5 versus 59.9 prior, will precede Sunday’s meeting between US President Joe Biden and Japan’s Prime Minister (PM) Fumio Kishida to offer clear directions.

What’s Behind the Slowdown in U.S. Inflation

What’s Behind the Slowdown in U.S. Inflation

October’s U.S. Consumer Price Index (CPI) inflation data was even softer than many observers had expected, with core inflation gaining just 0.3% month-over-month (m/m) versus consensus expectations of 0.5%. Pre-holiday retail discounting, a decline in used car prices, and a welcome easing in rental inflation were key drivers of the overall decline in CPI.

While we would caution against calling a peak in U.S. inflation, as we suspect some of the categories that were particularly weak in October will temporarily re-accelerate in the months ahead, the October data was a welcome sign that the central bank’s actions to date are starting to cool the economy. Consistent with this, October’s data likely solidifies the U.S. Federal Reserve’s resolve to slow its pace of policy rate hikes in December (see our recent blog post, “Fed Sets Up a Pause, Not a Pivot”). October’s CPI report also bolsters our confidence that the Fed will pause when rates enter a 4.5%–5% range, as we discussed in our latest Cyclical Outlook.

October inflation report details: cars, retail goods, rent, health insurance

Most categories saw softer-than-expected inflation readings. Core goods prices were down 0.4% m/m, including in subcategories such as cars and furniture that tend to be more sensitive to interest rates. Services inflation also cooled to 0.5% m/m versus 0.8% m/m in September.

Core goods prices fell following price slashing across used car dealerships. Higher inventories and subdued rental car company buying had contributed to wholesale price declines in prior months; however, it wasn’t until October that dealers more fully passed on these declines to consumers. While this is good news for overall inflation, we believe used car prices may re-accelerate in the months ahead as relatively price-insensitive demand and auto damages from Hurricane Ian temporarily boost prices before they decline once again.

Meanwhile, early holiday discounting from several major retailers contributed to flat retail goods prices overall, and notable declines across household goods (notably furniture, which tends to be sensitive to interest rates) and apparel. We had been expecting to see goods price discounts at some point after inventory-to-sales ratios recovered and as other input costs, including shipping and logistics costs, eased earlier this year. However, this is the first month that CPI data reflected outright price declines across these categories.

Turning to core services, rents and owners’ equivalent rents (OER) cooled slightly in October after a string of shockingly strong reports. Alternative data on rental listing prices and rents recorded in new leases have already shown a notable cooling over recent months, as has the broader U.S. housing market. However, given the usual lags, we don’t expect this cooling to be fully reflected in CPI-reported OER and rentals until late 1Q or early 2Q next year. Until then, we anticipate OER inflation will remain relatively resilient.

Finally, healthcare insurance prices also dropped in October, and we expect this new pace will contribute to more moderate inflation in the broader healthcare category over the next year. Note that the Bureau of Labor Statistics (or BLS, which publishes the CPI) methodology uses data that is published only once per year and with a lag. CPI had been at higher levels given strength in health insurance margins due to the relative lack of medical procedures in 2020 during the pandemic, but this older data fell out starting with the October report.

Implications for the macro outlook

Overall, we believe October’s softer-than-expected CPI reading strengthened the case that inflation will indeed moderate in 2023 after a period of elevated inflation due to material pandemic-related supply constraints coupled with large fiscal transfers. Nevertheless, we still believe inflation is likely to be generally stickier, and to hang above the Fed’s target even when it does moderate. Furthermore, in the near term we wouldn’t be surprised to see some temporary re-acceleration as hurricane-related replacement demand temporarily lifts prices in some goods categories. Also of note, while we expect reported health insurance prices will continue to drop, because this data is not included in the PCE (U.S. Personal Consumption Expenditures and the Fed’s preferred inflation measure), the “wedge” between the two inflation measures is likely to narrow over time.

Finally, we believe the implications of the October CPI report were not universally positive for the economic outlook. Indeed, a surprisingly weak inflation reading likely reflects softer consumer spending, and increased margin pressures for the corporate sector. Retail margins overall have held up surprisingly well in recent quarters; however, we expect falling real consumption will tend to moderate retailers’ ability to maintain those margins. We will monitor retail sales data and major banks’ credit card data as well, but in any event, October CPI suggests there are downside risks in the outlook for consumer spending.

Shopping Basket
Chat now!
1