image1.png

New Zealand Dollar Whipped by Jumbo Rate Hike. Will NZD/USD Rally Continue?

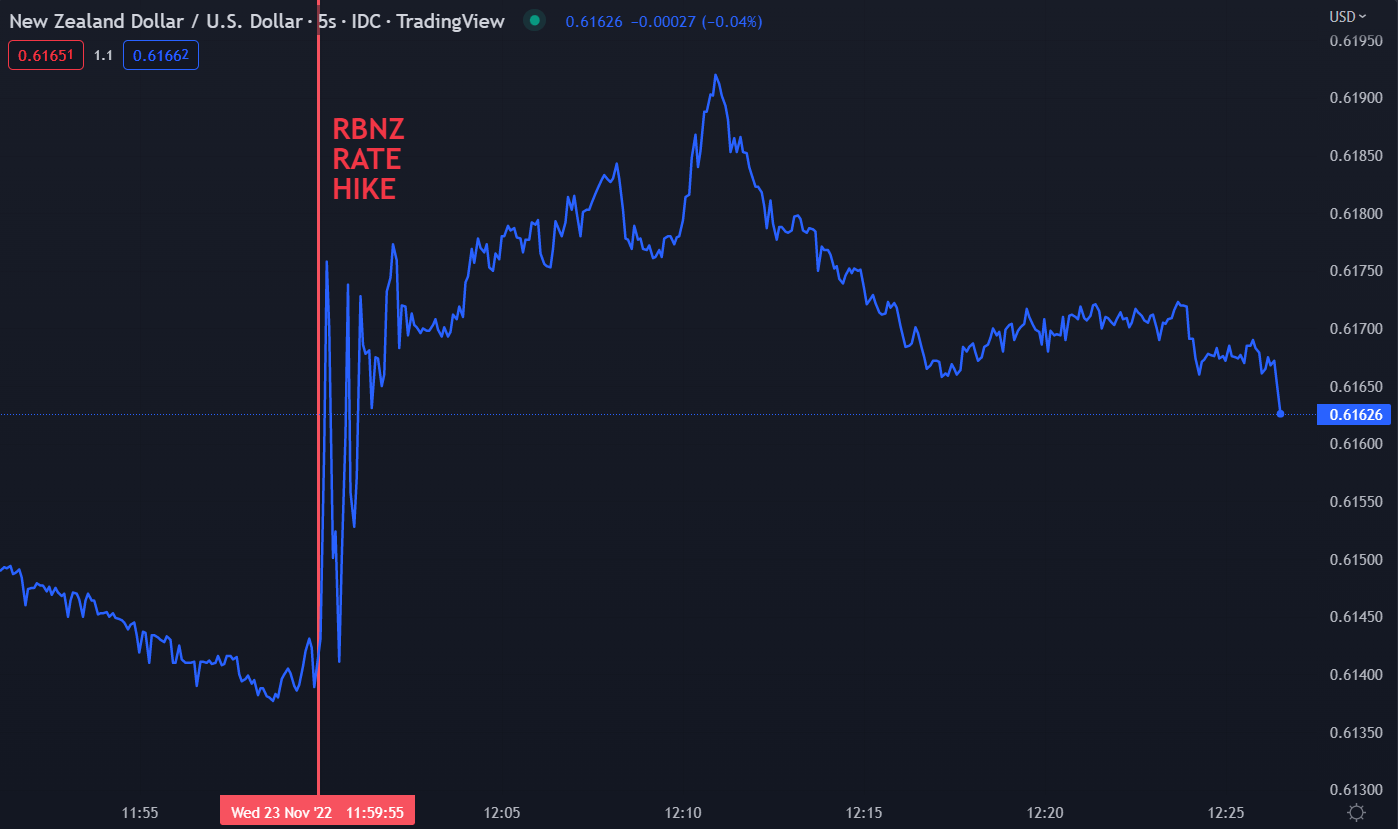
The New Zealand Dollar eventually skipped higher after the Reserve Bank of New Zealand (RBNZ) raised the official cash rate (OCR) target by 75 basis points (bp) to 4.25% from 3.50%.

The initial price reaction was quite erratic before the Kiwi found higher ground as it moved above 0.6190. A move above the recent peak of 0.6206 would make a new three month high.

The jumbo hike was mostly anticipated, with the overnight index swaps (OIS) market pricing in 66 bp prior to the decision. Most economist surveyed by Bloomberg forecast a 75 bp increase, although a minority were expecting 50 bp.

Prior to today’s decision, the RBNZ had raised their official cash rate by 50 bp at five consecutive meetings before this acceleration to 75 bp. This is the first change of this magnitude since the OCR inflation targeting regime was introduced in the 1999.

NZ Inflation is currently running at 7.2% year-on-year to the end of the third quarter. The bank has an inflation target band of 1-3%.

It would seem that the picking up of steam in price pressures pushed the RBNZ to their jumbo hike, after 3Q quarter-on-quarter inflation came in a 2.2%

Additionally, a tight labour market is showing the jobs market being above the RBNZ’s own measure of maximum sustainable level of employment. The unemployment rate remains near multi-generational lows at 3.3%.

The RBNZ said, “Core consumer price inflation is too high, employment is beyond its maximum sustainable level, and near-term inflation expectations have risen.”

With all the heat in the economy, a potential trigger for the outsized hike could be the fact that the RBNZ will not be meeting again for three months, on the 22nd of February 2023.

Of course, the Kiwi Dollar remains susceptible to external factors, not least has been the US Dollar of late with the Federal Reserve on their own inflation fight. The Fed have hiked by 75 bp three times and are anticipated by to lift by 50 bp at their December meeting.

After today’s meeting, the OIS market is now pricing the OCR to be near 6% in August next year, while the Fed is priced to be around 5% for their target rate.

NZD/USD REACTION TO RBNZ RATE HIKE

image1.png

Chart created in TradingView

image1.png

British Pound Pauses as US Dollar Takes Stock of Fed Outlook. Will GBP/USD go Higher?

The British Pound held onto to yesterday’s gains through the Asian session today, with the US Dollar remaining under pressure after Fed commentary.

Remarks from Cleveland Fed President Lorretta Mester and Kansas City Chief Esther George appeared to lead the market to believe that there might be a slowing of the aggressive hawkishness from the Fed.

None-the-less, the market is unchanged in anticipating a 50 basis point lift of their target rate at the Federal Open Market Committee (FOMC) meeting next month. This would be a deceleration from the consecutive 75 bp hikes at the 3 meetings prior.

Elsewhere, the RBNZ accelerated their fight on inflation, adding 75 bp to their official cash rate (OCR) today. NZD/USD was boosted as a result, making it the best performing currency so far on Wednesday.

Another surge in Chinese Covid-19 cases triggered more lockdowns on Wednesday, further undermining equity markets with benign price action despite a strong lead from Wall Street.

The FTX saga continues to play out with a bankruptcy filing in Delaware overnight. Initial findings point toward a substantial amount of assets that are missing or stolen. The court also said that the top 50 creditors will not be named.

Crude oil is barely changed since the North American close with the WTI futures contract near US$ 81 bbl, while the Brent contract is a touch above US$ 88 bbl.

A Japanese holiday appeared to contribute to lacklustre markets ahead of Thursday’s Thanksgiving holiday in the US.

Looking ahead, there are PMI numbers due across Europe, the US and other countries as well as US jobs data. The meeting minutes from the last Fed FOMC meeting will be released later in the day.

The full economic calendar can be viewed here.

 GBP/USD TECHNICAL ANALYSIS

When GBP/USD raced to a high above 1.2000, it broke the upper band of the 21-day simple moving average (SMA) based Bollinger Band. Once the price moved back inside the band, it consolidated sideways.

This type of a move could be a signal of a pause in the bullish rally, or a potential reversal.

Support may lie at the breakpoints of 1.1738 and 1.1646 or at the prior lows of 1.1334, 1.1148, 1.1061, 1.0924 and 1.0354.

On the topside, resistance could at the prior highs of 1.2029, 1.2293 and 1,2333.

image1.png


Forex triangle patterns

3 Triangle Patterns Every Forex Trader Should Know

Forex triangle patterns

– Reviewed by Nick Cawley, August 11 2022

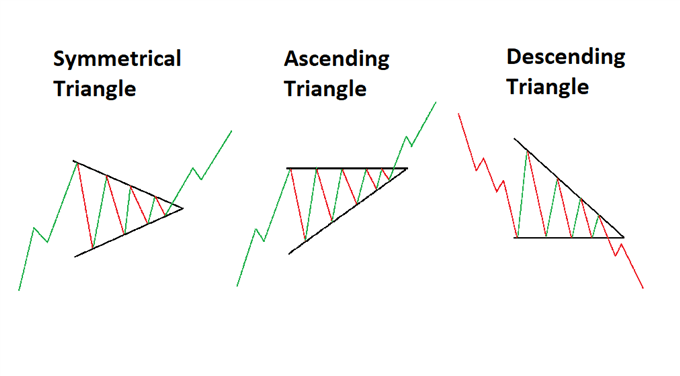
Triangle patterns have three main variations and appear frequently in the forex market. These patterns provide traders with greater insight into future price movement and the possible resumption of the current trend. However, not all triangle formations can be interpreted in the same way, which is why it is essential to understand each triangle pattern individually.

Forex triangle patterns main talking points:

  • Definition of a triangle pattern
  • Symmetrical triangles explained
  • Ascending and descending triangle patterns
  • Key points to remember when trading triangle patterns

Test your knowledge of forex patterns with our interactive Forex Trading Patterns quiz

What is a triangle pattern?

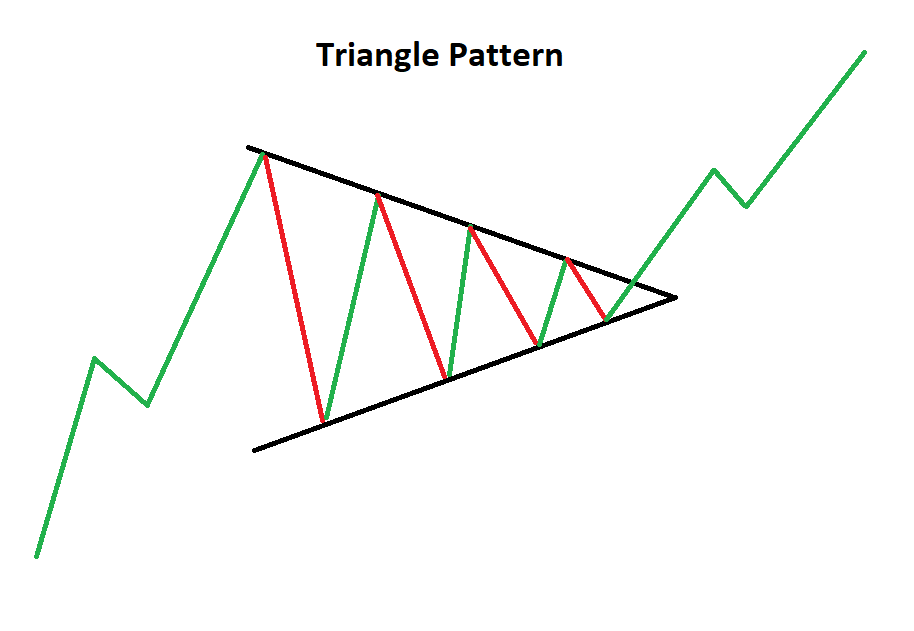
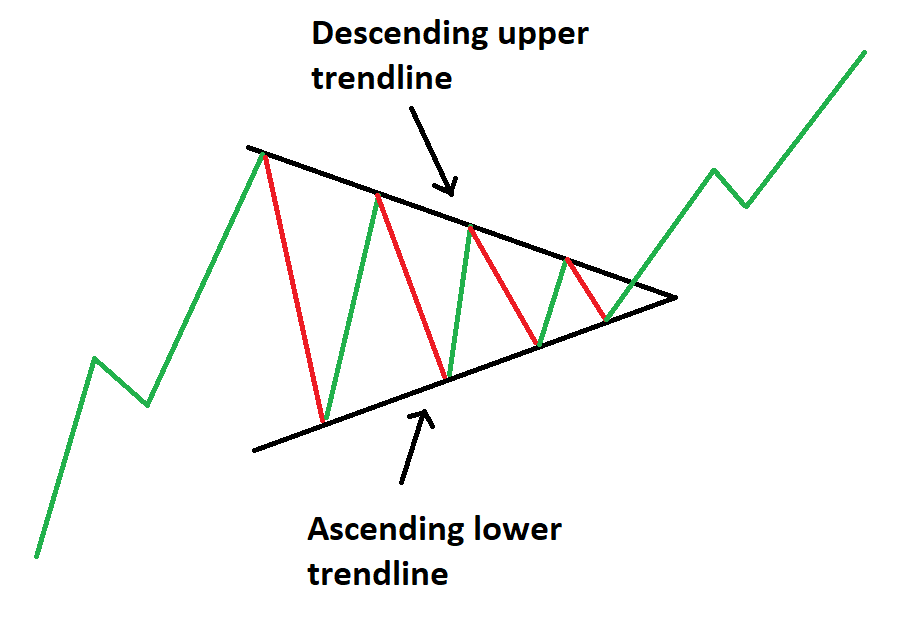
A forex triangle pattern is a consolidation pattern that occurs mid-trend and usually signals a continuation of the existing trend. The triangle chart pattern is formed by drawing two converging trendlines as price temporarily moves in a sideways direction. Traders often look for a subsequent breakout, in the direction of the preceding trend, as a signal to enter a trade.

Triangle chart pattern

This article makes use of line chart illustrations to present the three triangle chart patterns. Traders ought to familiarize themselves with the three technical analysis charts and figure out which one suits them best, although, most prefer using forex candlestick charts.

Symmetrical Triangles

The symmetrical triangle can be viewed as the starting point for all variations of the triangle pattern. As the name suggests, a triangle can be seen after drawing two converging trendlines on a chart.

The difference between the symmetrical and the other triangle patterns is that the symmetrical triangle is a neutral pattern and does not lean in any direction. While the triangle itself is neutral, it still favors the direction of the existing trend and traders look for breakouts in the direction of the trend.

Symmetrical triangle chart pattern

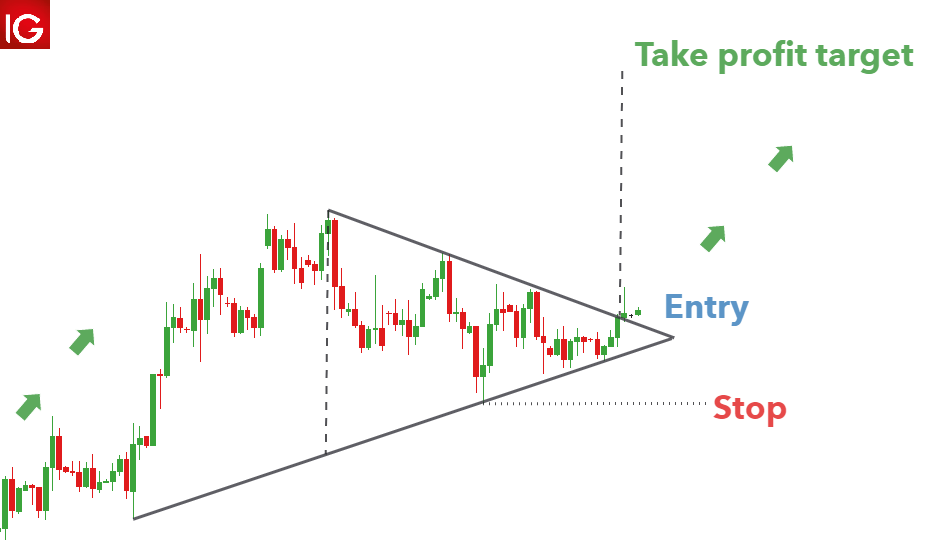
Symmetrical triangle trading strategy

Triangles provide an effective measuring technique for trading the breakout, and this technique can be adapted and applied to the other variations as well.

The AUD/USD chart below shows the symmetrical triangle. The vertical distance between the upper and lower trendline can be measured and used to forecast the appropriate target once price has broken out of the symmetrical triangle.

Its important to note that finding the perfect symmetrical triangle is extremely rare and that traders should not be too hasty to invalidate imperfect patterns. Traders ought to understand that triangle analysis is less about finding the perfect pattern and more about understanding what the market is communicating, through price action.

Symmentrical triangle pattern on forex pair AUD/USD

Ascending Triangle Pattern

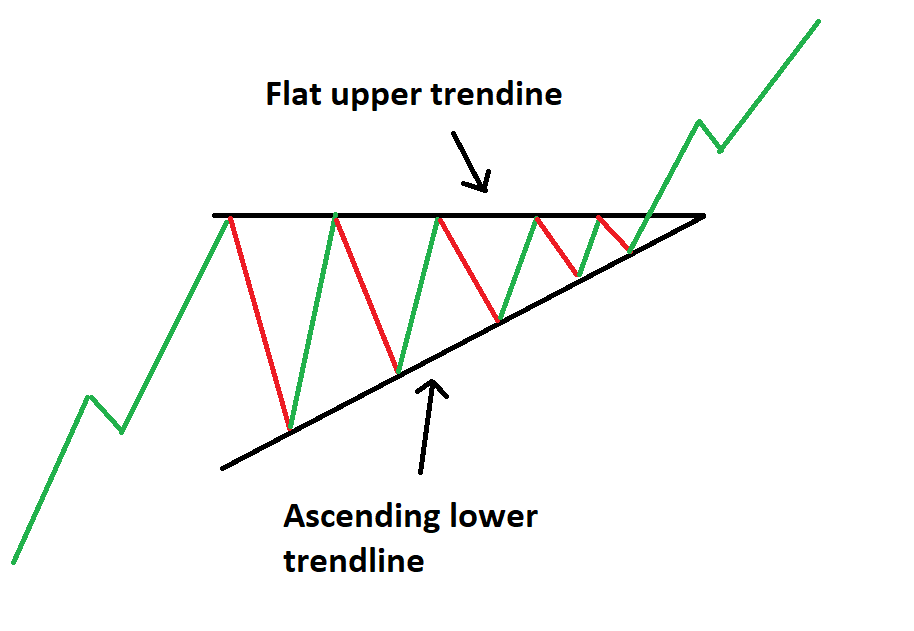
The ascending triangle pattern is similar to the symmetrical triangle except that the upper trendline is flat and the lower trendline is rising. This pattern indicates that buyers are more aggressive than sellers as price continues to make higher lows. Price approaches the flat upper trendline and with more instances of this, the more likely it is to eventually break through to the upside.

Ascending triangle chart pattern

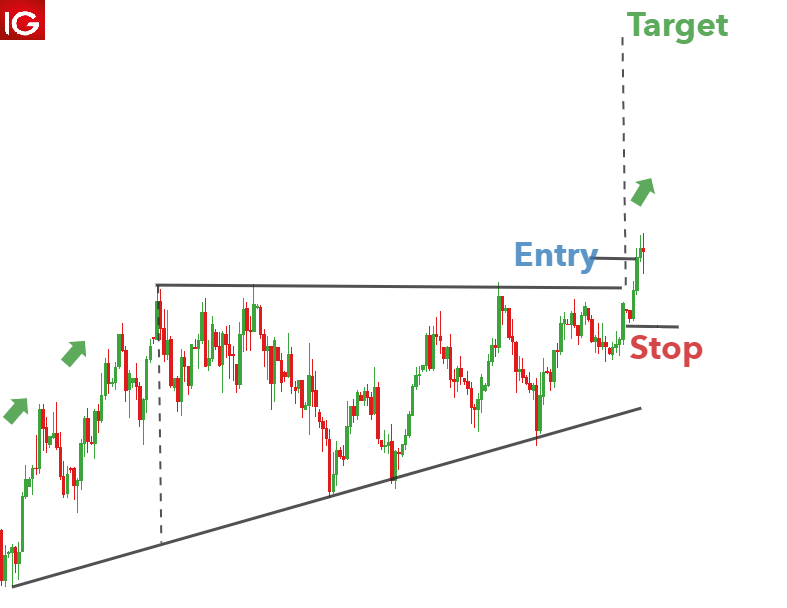
Ascending triangle trading strategy

An ascending triangle can be seen in the US Dollar Index below. Leading on from the existing uptrend, there is a period of consolidation that forms the ascending triangle. Traders can once again measure the vertical distance at the beginning of the triangle formation and use it at the breakout to forecast the take profit level. In this example, a rather tight stop can be placed at the recent swing low to mitigate downside risk.

Ascending triangle US dollar basket

Descending Triangle Pattern

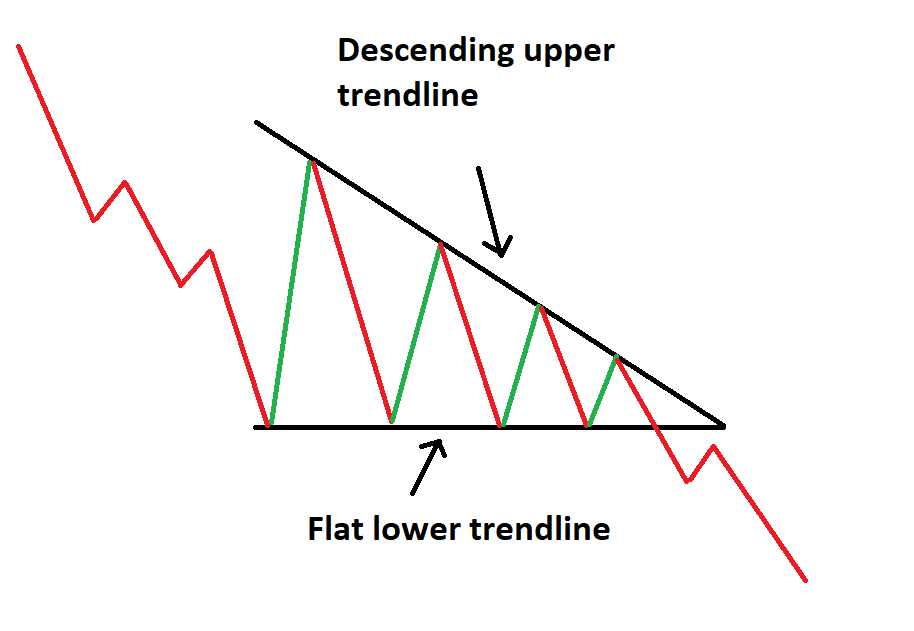
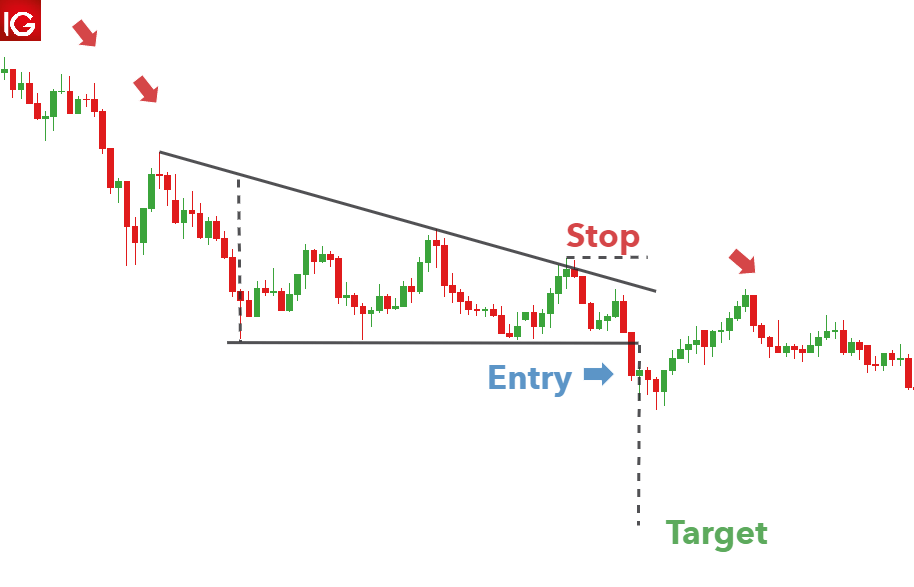
The descending triangle pattern on the other hand, is characterized by a descending upper trendline and a flat lower trendline. This pattern indicates that sellers are more aggressive than buyers as price continues to make lower highs.

Decending triangle chart pattern

Descending triangle trading strategy

Below is a good example of the descending triangle pattern appearing on GBP/USD. A downtrend leads into the consolidation period where sellers outweigh buyers and slowly push price lower. A strong break of the lower trendline presents traders with an opportunity to go short. In this example, it doesn’t take long for the position to move in the opposite direction, highlighting the importance of setting an appropriate stop level.

The take profit level is set using the vertical distance measured at the beginning of the descending triangle formation.

Descending triangle pattern on GBP/USD

Trading with Triangle Patterns: Key things to remember

  • Always be cognisant of the direction of the trend prior to the consolidation period.
  • Make use of upper and lower trendlines to help identify which triangle pattern is being formed.
  • Use the measuring technique discussed above to forecast appropriate target levels
  • Adhere to sound risk management practises to mitigate the risk of a false breakout and ensure a positive risk to reward ratio is maintained on all trades.

Further Reading on Forex Trading Patterns

U.S. excludes oil for Japan from Russia’s Sakhalin-2 from price cap

Oil from Russia’s Sakhalin 2 energy project bound for Japan will be excluded from facing a price cap the United States will roll out as part of efforts to squeeze Moscow’s revenues for its war in Ukraine, the Treasury Department said in its guidance released Tuesday.

The price cap, which other members of the Group of Seven and Australia have also agreed to introduce, will take effect Dec. 5 for crude oil. Japanese trading firms maintain stakes in the Sakhalin 2 project, which the government sees as an important energy supply source for the resource-poor country.

As for the price cap level, a senior Treasury official said discussions are taking place among members of the European Union before the entire international “Price Cap Coalition” can announce it.

Under the Treasury’s guidance, U.S. persons will be allowed to provide a range of services, including finance, insurance and shipping, for seaborne transportation of Russian oil only if the oil is purchased at or below the price cap.

The price cap application will start when a Russian entity sells crude oil for maritime transport through its first sale to a buyer on land. This means that once the Russian oil has cleared customs in a jurisdiction other than Russia, the price cap does not apply to any further onshore sale.

But if, after clearing customs, the Russian oil is taken back out on the water without being “substantially transformed,” such as by refining, the price cap still applies, according to the guidance.

Exemptions include the maritime transport of crude oil from Sakhalin-2, provided that the product “is solely for importation into Japan,” it said. The authorization for the Russian project will be effective through Sept. 30.

In August, a new operating company for the Sakhalin 2 oil and liquefied natural gas project was launched and Russia has authorized investments by Japanese trading houses Mitsui & Co. and Mitsubishi Corp.

Russia accounted for around 3.6 percent of total Japanese oil imports last year, according to government data.

The G-7 consists of Britain, Canada, France, Germany, Italy, Japan and the United States plus the European Union.

image1.png

Euro Price Action Setups: EUR/USD, EUR/JPY, EUR/GBP

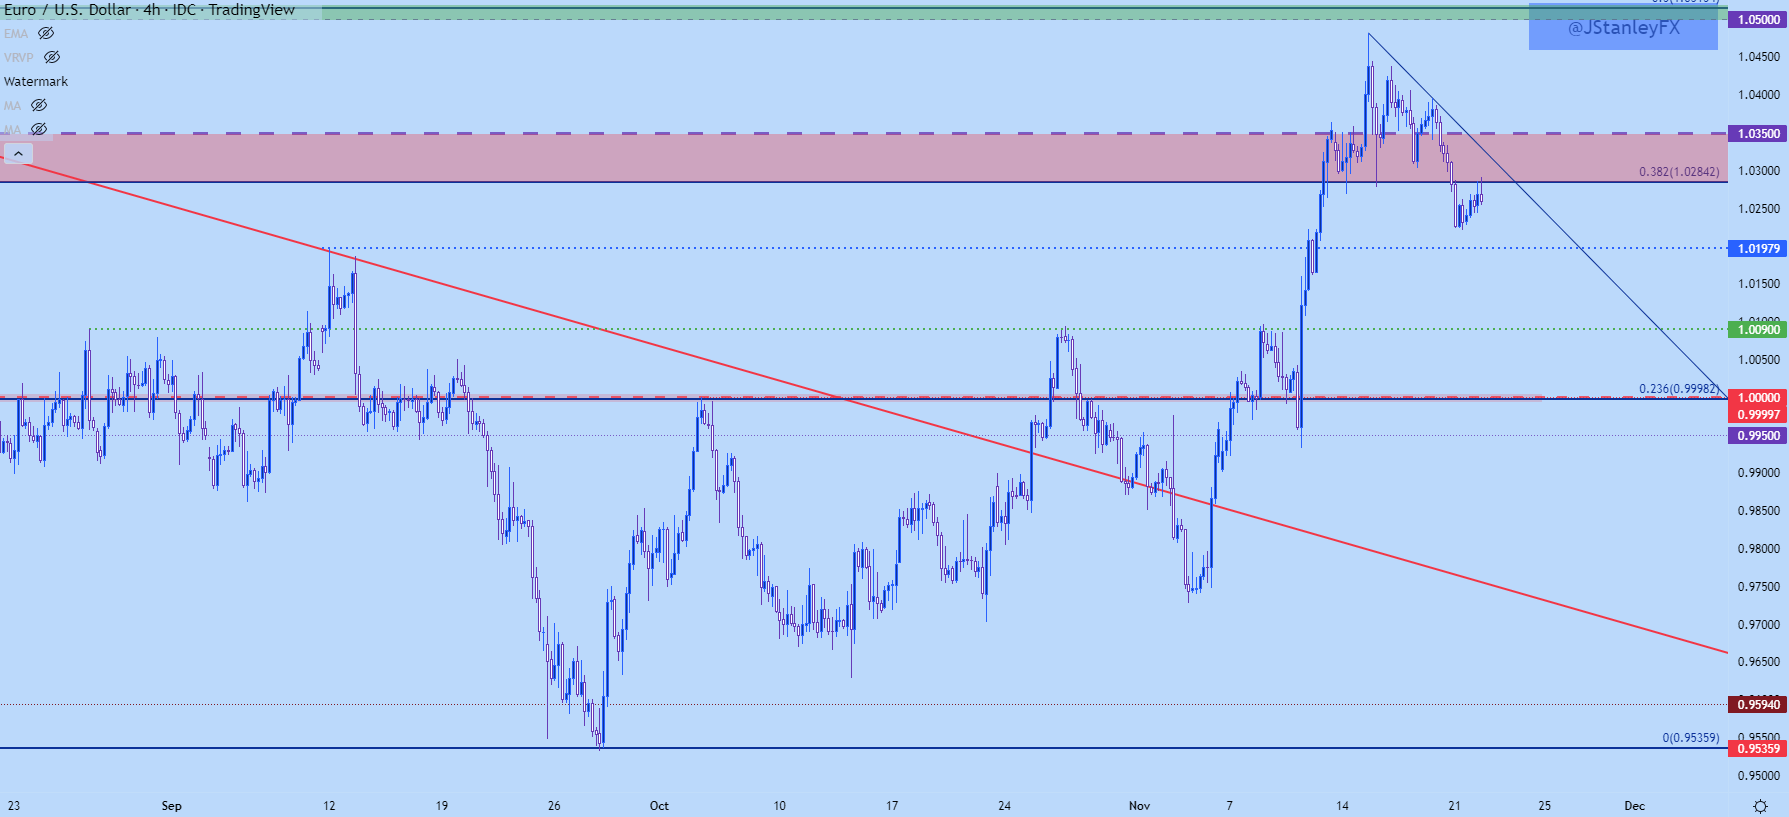
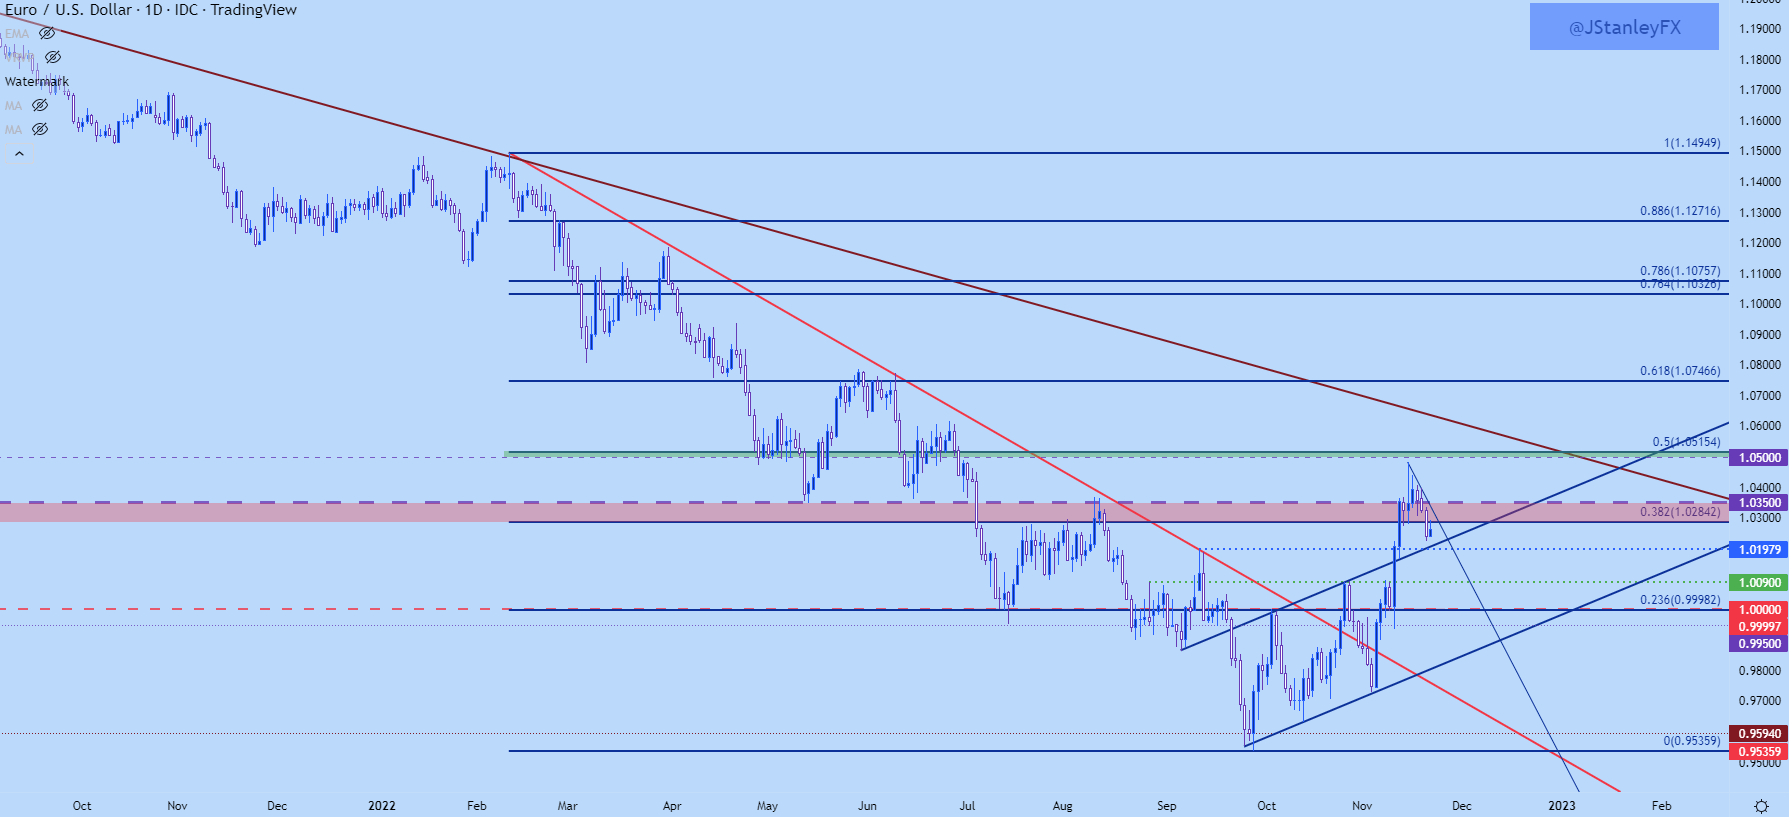
Has EUR/USD topped? I asked that question last Thursday and since then there’s been a continued build of evidence that this may be the case. This week opened with a push below a key area of support with EUR/USD setting a fresh weekly low, which happened as price was breaking below the 1.0282 Fibonacci level that had twice helped to set support last week.

EUR/USD tested through 1.0250 but didn’t quite make it down to the next area of support at 1.0197 before finding a bounce, and that bounce has since pushed right back into possible resistance at that prior spot of Fibonacci support.

EUR/USD Four-Hour Chart

image1.png

As I had looked at in this week’s tech forecast for the USD, there was a symmetrical triangle in EUR/USD which, in an of itself doesn’t carry a directional bias. If meshed up with the prior move, however, an argument could be made for a bull pennant – but for that to remain alive buyers would need to defend support from the formation’s lower trendline – and that did not happen as prices broke down to start this week.

This can keep the focus on bearish scenarios until either resistance is broken or a more solid area of support comes into play. Sitting below current price action is the 1.0175-1.0197 zone, and below that is the 1.0090 level that set the October monthly high.

If sellers can even take out that area, we’re back in the parity box which I’m stretching down to the .9900 handle. If this comes into play before the end of the year it’ll be a massive test for Euro bears.

 EUR/USD Daily Chart

image2.png

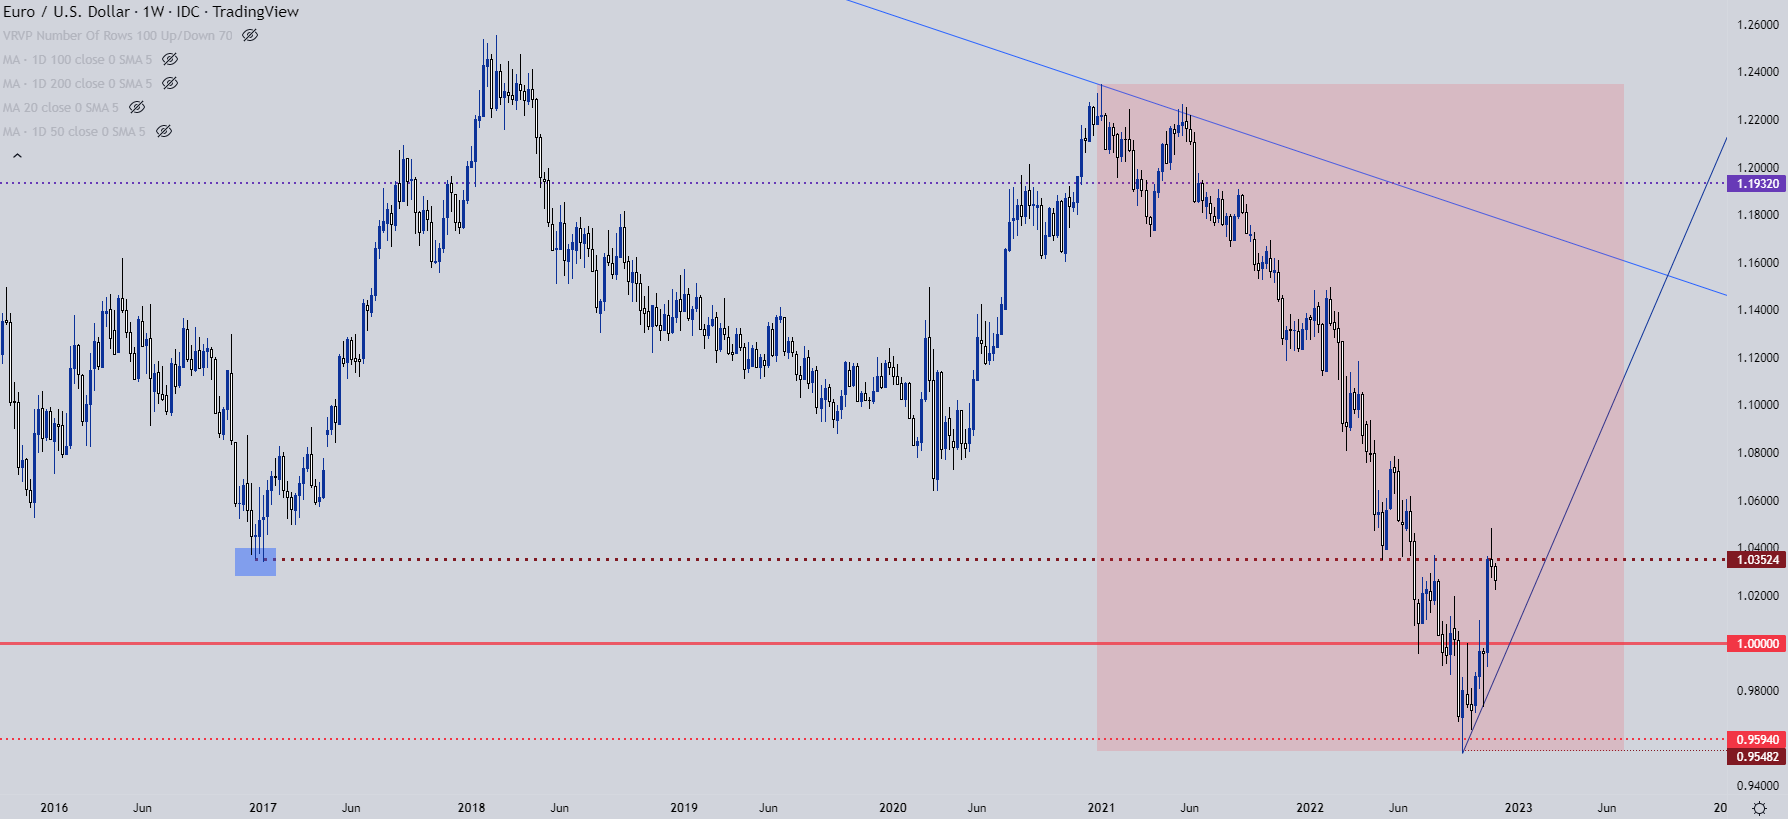
EUR/USD Big Picture

This is worthy of inclusion given its importance on the shorter-term matter but, from the weekly chart of EUR/USD we can see where the pair put in a strong reaction at a key spot last week of 1.0350. The pullback that we’ve seen thus far may be reignition of the bearish longer-term trend after a quick respite. But – it may also be the pair working on a longer-term bottom and all that we’d need to further feed that argument is some element of higher-low support taking-hold ahead of the parity level again, and this is why that 100 pip zone from .9900-1.0000 is so important right now.

EUR/USD Weekly Chart

image3.png

EUR/JPY

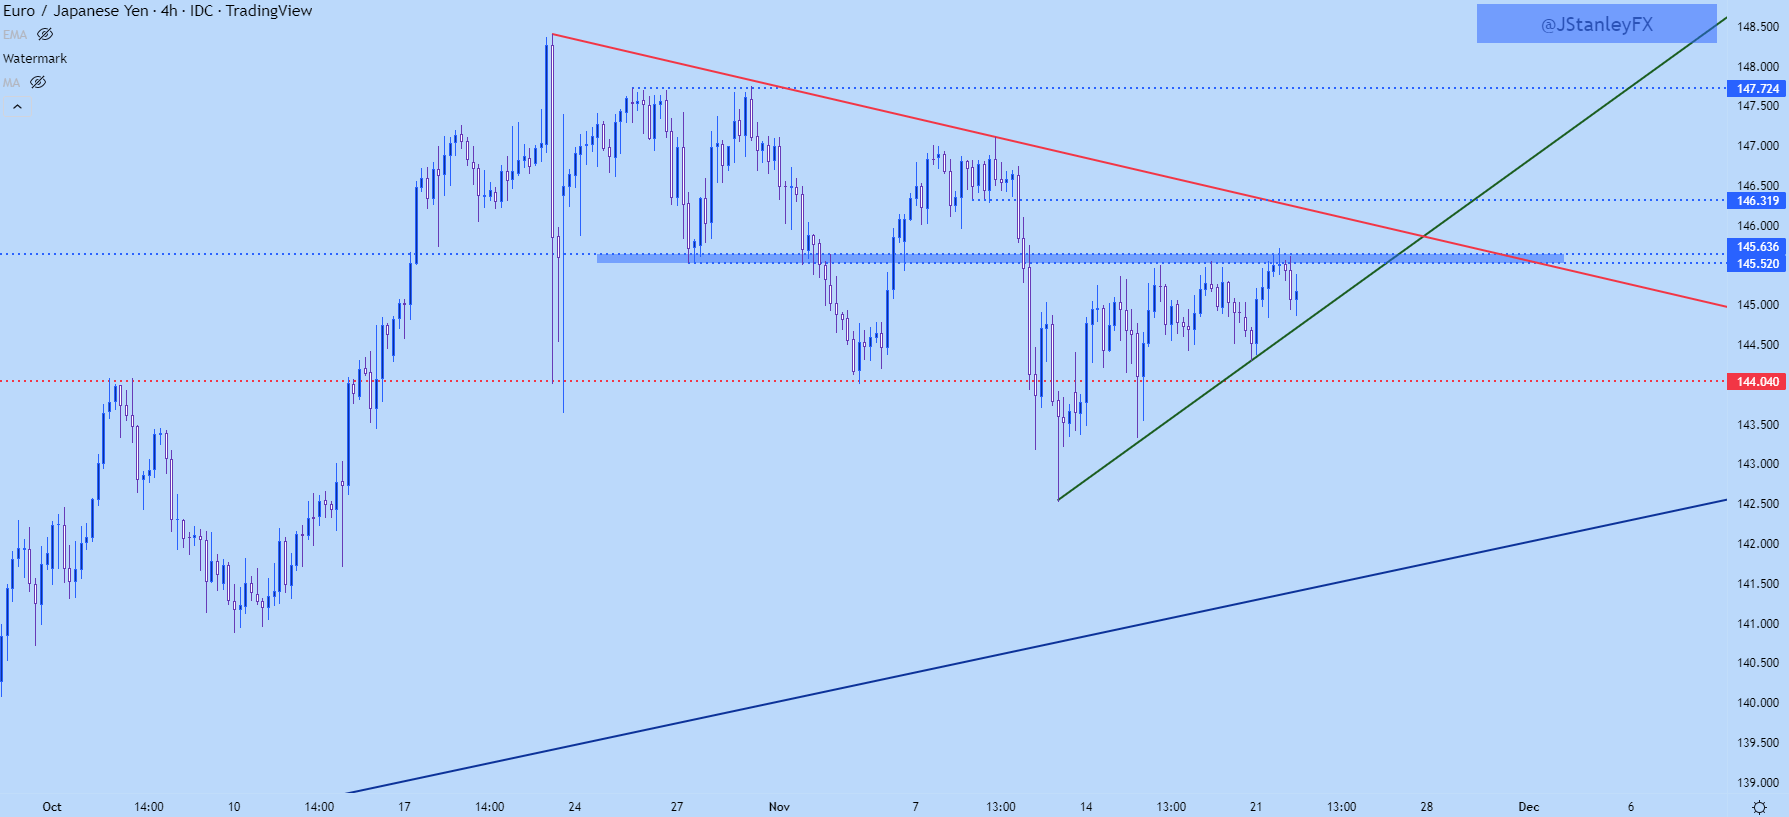
I had looked into EUR/JPY yesterday and the contrast between USD/JPY and GBP/JPY versus EUR/JPY was noticeable. While USD/JPY and GBP/JPY had already started short-term bullish breakouts, EUR/JPY was holding below a key spot of resistance, plotted at 145.52-145.64. This zone came into play again yesterday and it similarly produced a turn in the pair, although that turn hasn’t yet led to a lower-low in EUR/JPY.

EUR/JPY Four-Hour Chart

image4.png

EUR/JPY Triangle or Wedge?

Triangles and wedges may look similar and I’ll even see the two formations often get mixed up by technical analysts; but the way that they are approached is very different. And sometimes, both formations can be justified and this makes proper identification near-impossible until it’s too late.

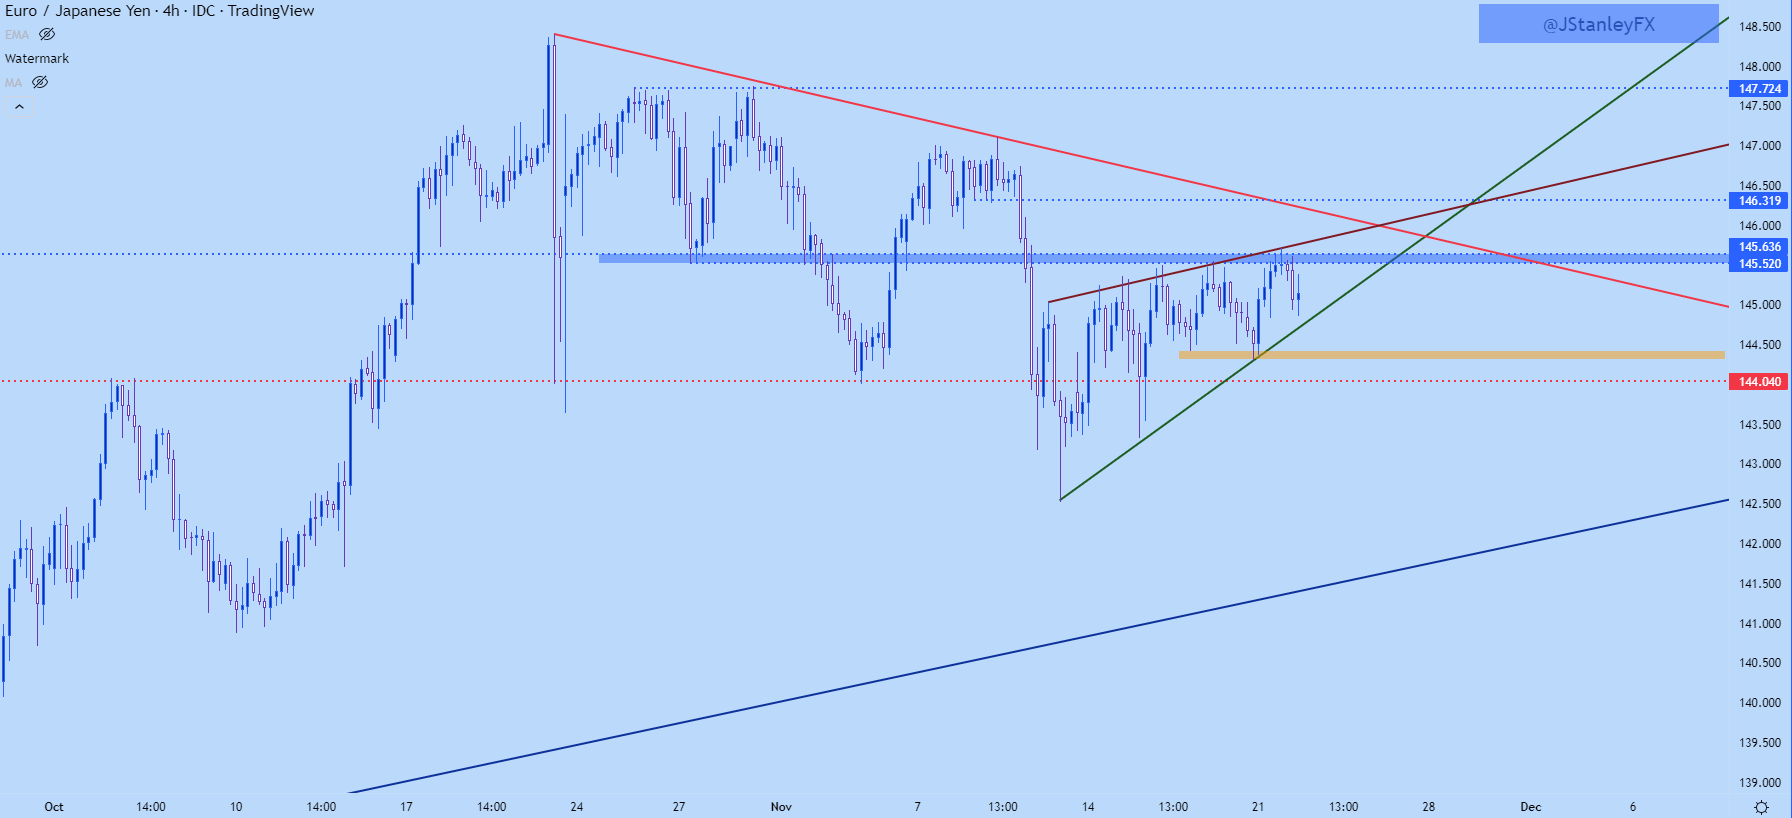
There’s a similar setup in EUR/JPY at the moment. There’s the horizontal resistance that’s remained in-play around 145.62-145.64 and that’s helped to hold the highs. There’s also a clear bullish trendline at support, helping to demarcate the lows.

So, if we take just that, there’s an ascending triangle – and that formation is often approached with the aim of bullish breakouts.

However – there’s been a build of slightly higher-highs leading into and existing around the test of that resistance, so a resistance trendline can be drawn atop price action and this too could be justified. But, at that point, we now have a rising wedge – which is approached in the exact opposite manner of the ascending triangle above, instead with traders looking for bearish breakdowns in the pair.

So, what is a trader to do when the formation is unclear?

One option is to wait…

Because if that initial breakout is going to lead into a trend, the trader doesn’t have to capture the very first move – they can allow the break to happen after which they look to trade the fresh trend after the break. And given context, there’s usually some nearby levels to use for such a purpose.

In the case of EUR/JPY, traders can wait for either a bearish or bullish break, and when that pulls back, can look to find higher-low support at prior resistance or lower-high resistance at prior support. And traders can incorporate other levels, too, such as I highlighted yesterday with the 144 level in EUR/JPY. So, bears can look to a breach of that level to signal bears’ willingness to extend the trend, after which they look to work the pullback off of lower-high resistance at an area such as 144.50. And on the top side, resistance is fairly well-defined, so if bulls can force a break, that becomes an area to look for higher-low support with the aim of bullish continuation.

EUR/JPY Four-Hour Price Chartimage5.png


A red and a blue candlestick with open and close wicks

How to Read a Candlestick Chart

Reading candlestick charts – Talking points:

  • Candlestick charts differ greatly from the traditional bar chart
  • Traders generally prefer using candlestick charts for day-trading because they offer an enjoyable visual perception of price
  • It’s important to understand the key components of a candle, and what they indicate, to apply candlestick chart analysis to a trading strategy

What is a candlestick chart?

A candlestick chart is simply a chart composed of individual candles, which traders use to understand price action. Candlestick price action involves pinpointing where the price opened for a period, where the price closed for a period, as well as the price highs and lows for a specific period.

Price action can give traders of all financial markets clues to trend and reversals. For example, groups of candlesticks can form patterns which occur throughout forex charts that could indicate reversals or continuation of trends. Candlesticks can also form individual formations which could indicate buy or sell entries in the market.

The period that each candle depicts depends on the time-frame chosen by the trader. A popular time-frame is the daily time-frame, so the candle will depict the open, close, and high and low for the day. The different components of a candle can help you forecast where the price might go, for instance if a candle closes far below its open it may indicate further price declines.

Boost your chart patterns expertise with our interactive quiz!

Our Forex Trading Patterns Quiz will test your knowledge of some of the most important trading patterns. Take the test today by clicking on the link and raise your technical analysis game!

Interpreting a candle on a candlestick chart

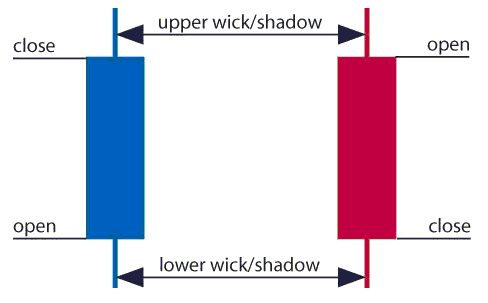
The image below represents the design of a typical candlestick. There are three specific points (open, close, wicks) used in the creation of a price candle. The first points to consider are the candles’ open and close prices. These points identify where the price of an asset begins and concludes for a selected period and will construct the body of a candle. Each candle depicts the price movement for a certain period that you choose when you look at the chart. If you are looking at a daily chart each individual candle will display the open, close, upper and lower wick of that day.

A red and a blue candlestick with open and close wicks

Open price:

The open price depicts the first price traded during the formation of the new candle. If the price starts to trend upwards the candle will turn green/blue (colors vary depending on chart settings). If the price declines the candle will turn red.

High Price:

The top of the upper wick/shadow indicates the highest price traded during the period. If there is no upper wick/shadow it means that the open price or the close price was the highest price traded.

Low Price:

The lowest price traded is the either the price at the bottom of the lower wick/shadow and if there is no lower wick/shadow then the lowest price traded is the same as the close price or open price in a bullish candle.

Close Price:

The close price is the last price traded during the period of the candle formation. If the close price is below the open price the candle will turn red as a default in most charting packages. If the close price is above the open price the candle will be green/blue (also depends on the chart settings).

The Wick:

The next important element of a candlestick is the wick, which is also referred to as a ‘shadow’. These points are vital as they show the extremes in price for a specific charting period. The wicks are quickly identifiable as they are visually thinner than the body of the candlestick. This is where the strength of candlesticks becomes apparent. Candlesticks can help traders keep our eye on market momentum and away from the static of price extremes.

Direction:

The direction of the price is indicated by the color of the candlestick. If the price of the candle is closing above the opening price of the candle, then the price is moving upwards and the candle would be green (the color of the candle depends on the chart settings). If the candle is red, then the price closed below the open.

Range:

The difference between the highest and lowest price of a candle is its range. You can calculate this by taking the price at the top of the upper wick and subtracting it from the price at the bottom of the lower wick. (Range = highest point – lowest point).

Having this knowledge of a candle, and what the points indicate, means traders using a candlestick chart have a clear advantage when it comes to distinguishing trendlines, price patterns and Elliot waves.

Bar Chart vs Candlestick Chart

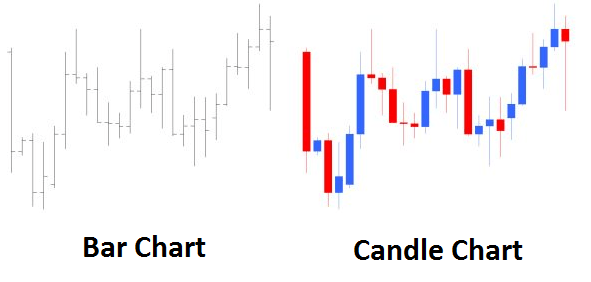
As you can see from the image below, candlestick charts offer a distinct advantage over bar charts. Bar charts are not as visual as candle charts and nor are the candle formations or price patterns. Also, the bars on the bar chart make it difficult to visualize which direction the price moved.

Difference between bar chart and candle chart

Forex for Beginners

Forex for Beginners
Recommended by David Bradfield
From margin to leverage and more: Key concepts explained
Get My Guide

How to read a candlestick chart

There are various ways to use and read a candlestick chart. Candlestick chart analysis depends on your preferred trading strategy and time-frame. Some strategies attempt to take advantage of candle formations while others attempt to recognize price patterns.

Interpreting single candle formations

Individual candlesticks can offer a lot of insight into current market sentiment. Candlesticks like the Hammer, shooting star, and hanging man, offer clues as to changing momentum and potentially where the market prices maytrend.

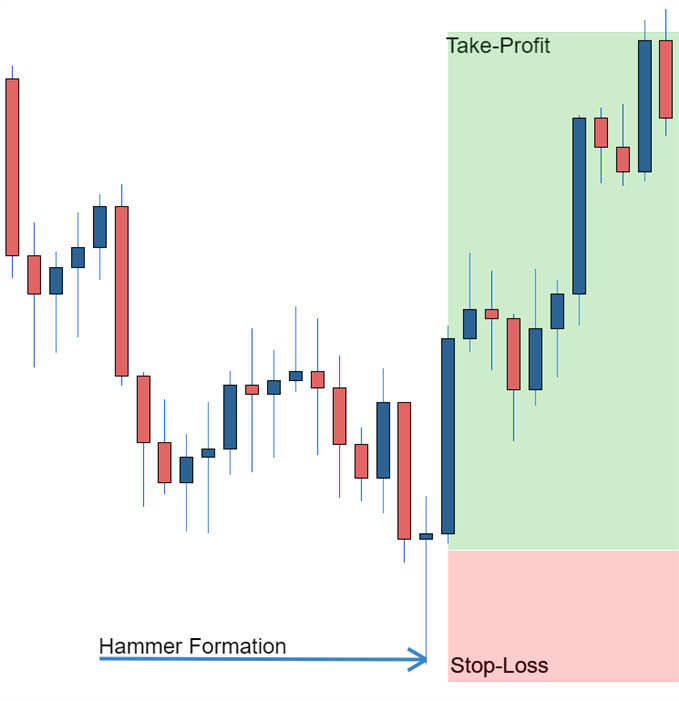
As you can see from the image below the Hammer candlestick formation sometimes indicates a reversal in trend. The hammer candle formation has a long lower wick with a small body. Its closing pricing is above its opening price. The intuition behind the hammer formation is simple, price tried to decline but buyers entered the market pushing the price up. It is a bullish signal to enter the market, tighten stop-losses or close out a short position.

Traders can take advantage of hammer formations by executing a long trade once the hammer candle has closed. Hammer candles are advantageous because traders can implement ‘tight’ stop-losses (stop-losses that risk a small amount of pips). Take-profits should be placed in such a way as to ensure a positive risk-reward ratio. So, the take-profit is larger than the stop-loss.

Hammer formation showing stop loss

Recognizing price patterns in multiple candles

Candlestick charts help traders recognize price patterns that occur in the charts. By recognizing these price patterns, like the bullish engulfing pattern or triangle patterns you can take advantage of them by using them as entries into or exit signals out the market.

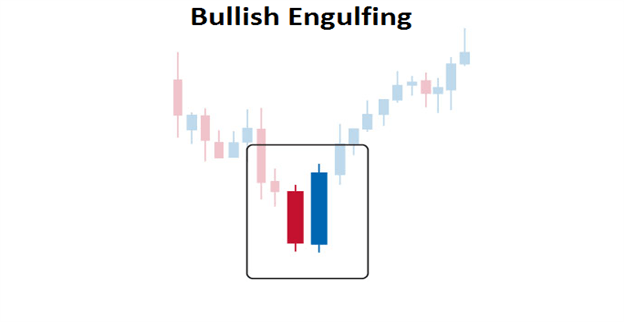
For example, in the image below we have the bullish engulfing price pattern. The bullish engulfing is a combination of a red candle and a blue candle that ‘engulfs’ the entire red candle. It is an indication that it could be the end of a currency pairs established weakness. A trader would take advantage of this by entering a long position after the blue candle closes. Remember, the price pattern only forms once the second candle closes.

As with the hammer formation, a trader would place a stop loss below the bullish engulfing pattern, ensuring a tight stop loss. The trader would then set a take-profit. For more forex candlestick charts check our forex candlesticks guide where we go in depth into the advantages of candlestick charts as well as the strategies that can be implemented using them.

Bullish engulfing pattern

Further tips for reading candlestick charts

When reading candlestick charts, be mindful of:

At DailyFX we offer a range of forecasts on currencies, oil, equities and gold that can aide you in your trading. It is also worth following our webinars where we present on a variety of topics from price-action to fundamentals that may affect the market.

long-term time frame monthly

What is the Best Time Frame to Trade Forex?

“Is there a best time frame to trade forex?” is a common question a lot of traders ask, especially those new to the forex market. The truth is, there is no single answer. It all depends on your preferred trading strategy and style.

Traders utilize varying time frames to speculate in the forex market. The two most common are long- and short-term-time frames which transmits through to trend and trigger charts. Trend charts refer to longer-term time frame charts that assist traders in recognizing the trend, whilst trigger chart pick out possible trade entry points. This article will explore these forex trading time frames in depth, whilst offering tips on which can best serve your trading goals.

Talking points:

  • How to decide the best time frame to trade forex
  • What are the main forex time frames
  • Using multiple time frame analysis

How to decide the best time frame to trade forex

As mentioned above, the best time frame to trade forex will vary depending on the trading strategy you employ to meet your specific goals. The table below summarizes variable forex time frames used by different traders for trend identification and trade entries, which are explored in more depth below:

CHART DAY TRADING SWING TRADING POSITION TRADING
TREND CHART 30 minutes – 4 hours Daily Weekly
TRIGGER CHART 5 – 60 minutes 2 – 4 hours Daily

Main forex trading time frames

Traders utilize different strategies which will determine the time frame used. For example, a day trader will hold trades for a significantly shorter period than that of a swing trader. Read our guide for a basic introduction to different trading styles.

1) Position trading time frames

The position trading time frame varies for different trading strategies as summarized in the table above. This could fluctuate from daily to yearly under the ‘long-term’ definition.

Many new traders tend to avoid this approach because it means long periods of time before trades are realized. However, by many accounts, trading with a shorter-term (day trading) approach can be far more problematic to execute successfully, and it often takes traders considerably longer to develop their strategy.

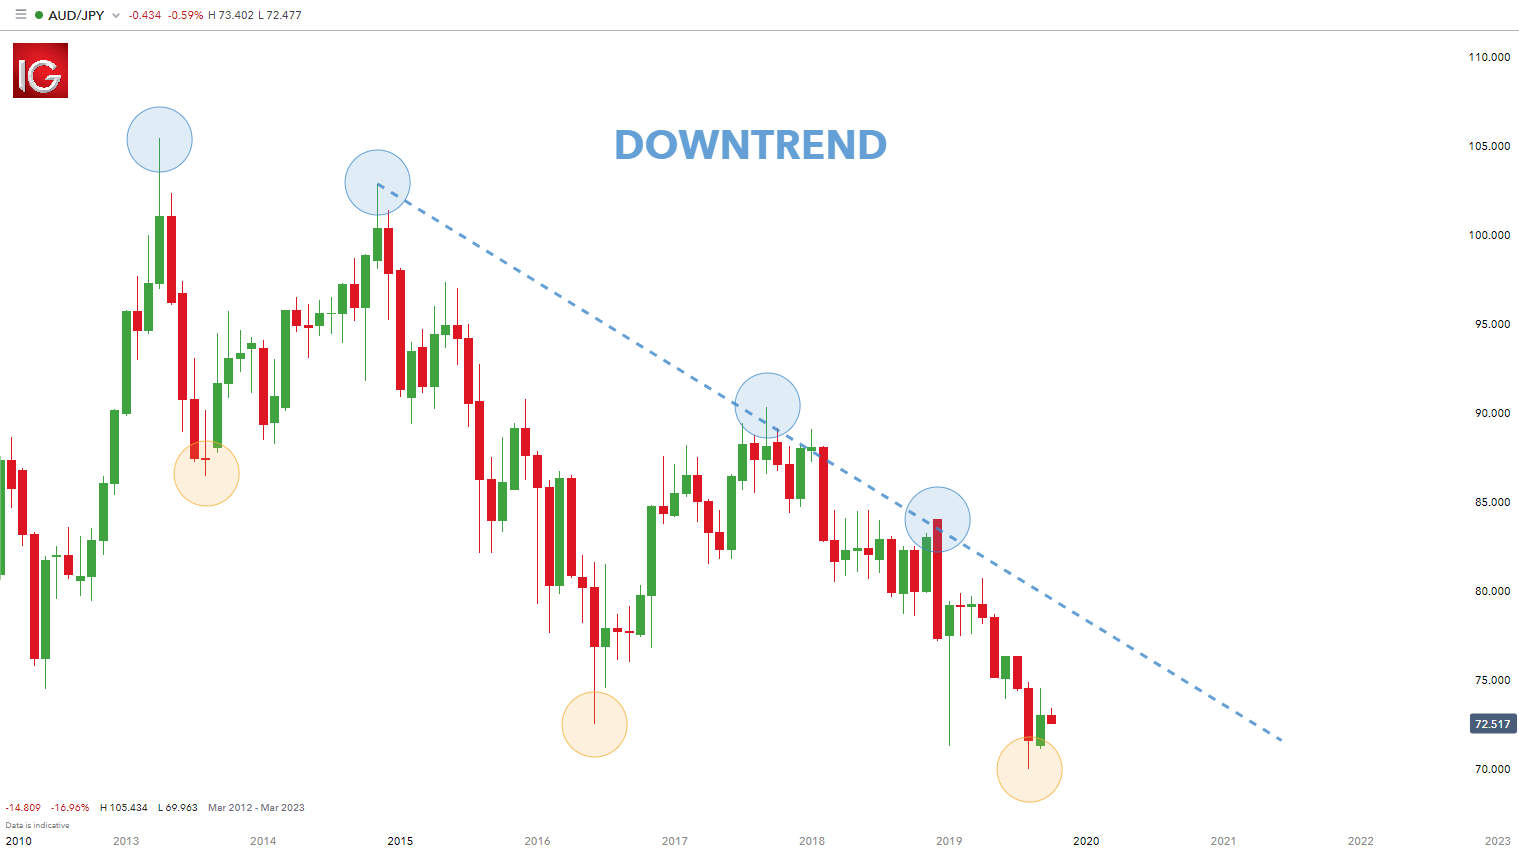
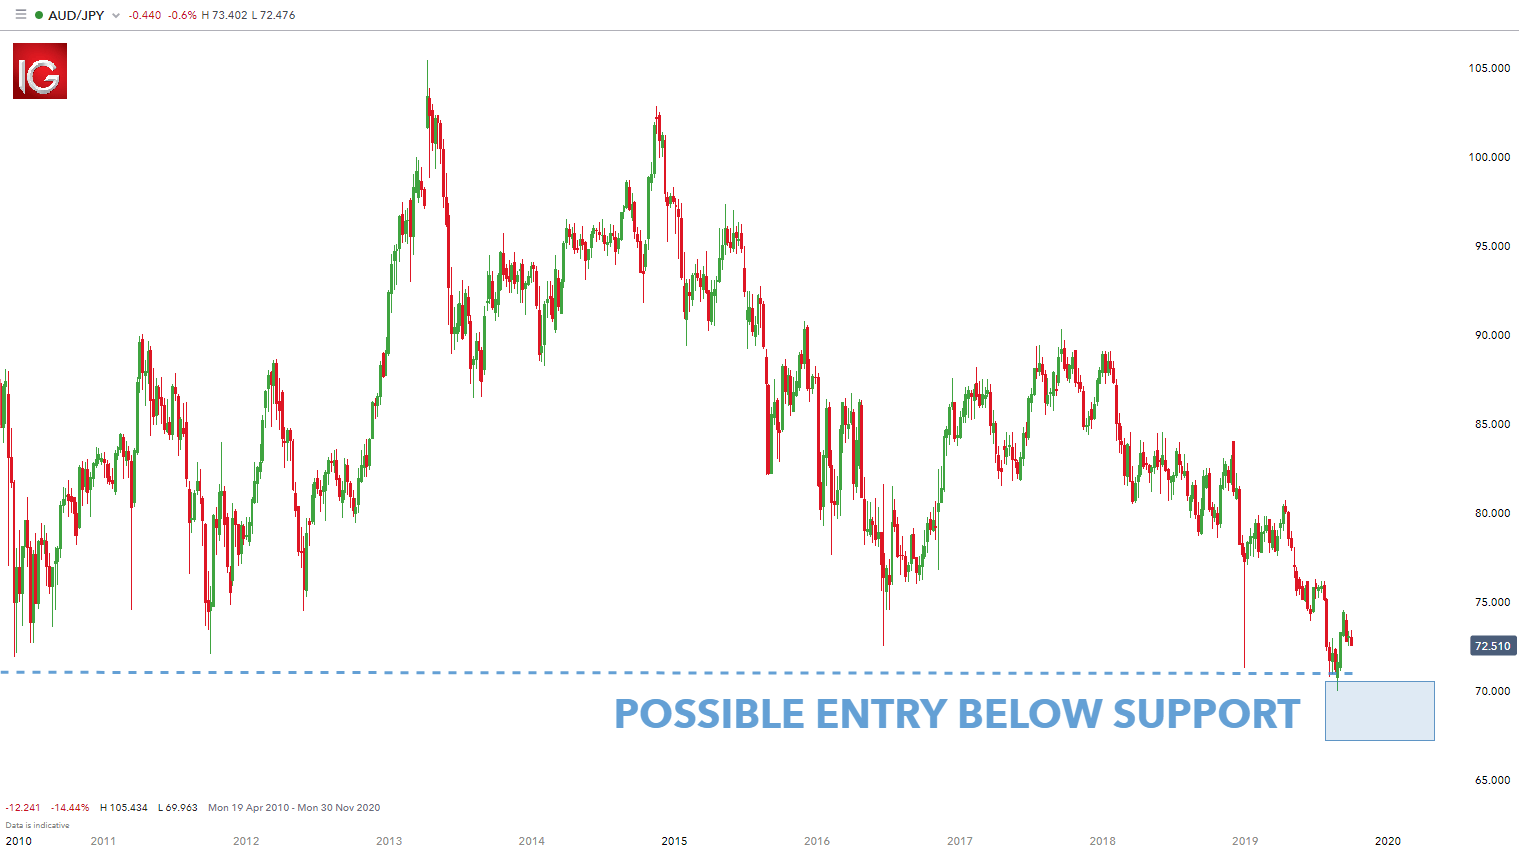
Position trading (longer-term) approaches can look to the monthly chart for grading trends, and the weekly chart for potential entry points.

Position trading example

After the trend has been determined on the monthly chart (lower highs and lower lows), traders can look to enter positions on the weekly chart in a variety of ways. Many traders look to utilize price action (as seen in the weekly chart below) for determining trends and/or entering positions, but indicators can absolutely be utilized here as well.

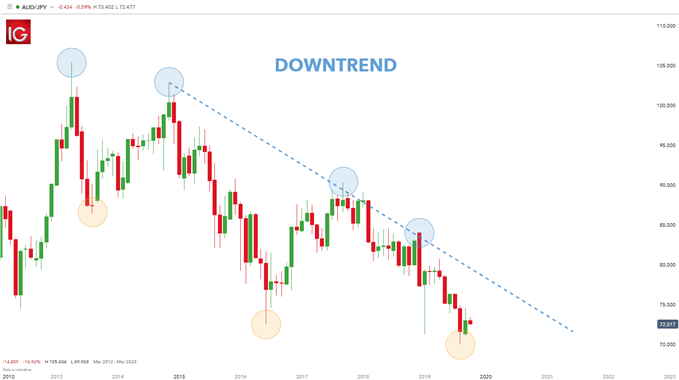
Monthly AUD/JPY trend chart:

long-term time frame monthly

Weekly AUD/JPY trigger chart:

long-term time frame weekly

2) Swing trading time frames

After a trader has gained comfort on the longer-term chart, they can then look to move slightly shorter in their approach and desired holding times. This can introduce more variability into the trader’s approach, so risk and money management should be addressed before moving down to shorter time frames.

Swing trading is a happy medium between a long-term trading time frame and a short-term, scalping approach. One of the best benefits of swing trading is that traders can get the benefits of both styles without necessarily taking on all the downsides. As a result, this makes swing trading a very popular approach to the markets.

Swing traders will check the charts a couple times per day in case any big moves occur in the marketplace. This affords traders the benefit of not having to watch markets continuously while they’re trading. Once an opportunity is identified, traders place the trade with a stop attached and monitor at a later stage to see the progress of the trade.

Another advantage of this approach is that the trader is still looking at charts often enough to seize opportunities as they exist. This eliminates one of the downsides of longer-term trading in which entries are generally placed on the weekly/daily charts.

Swing trading example

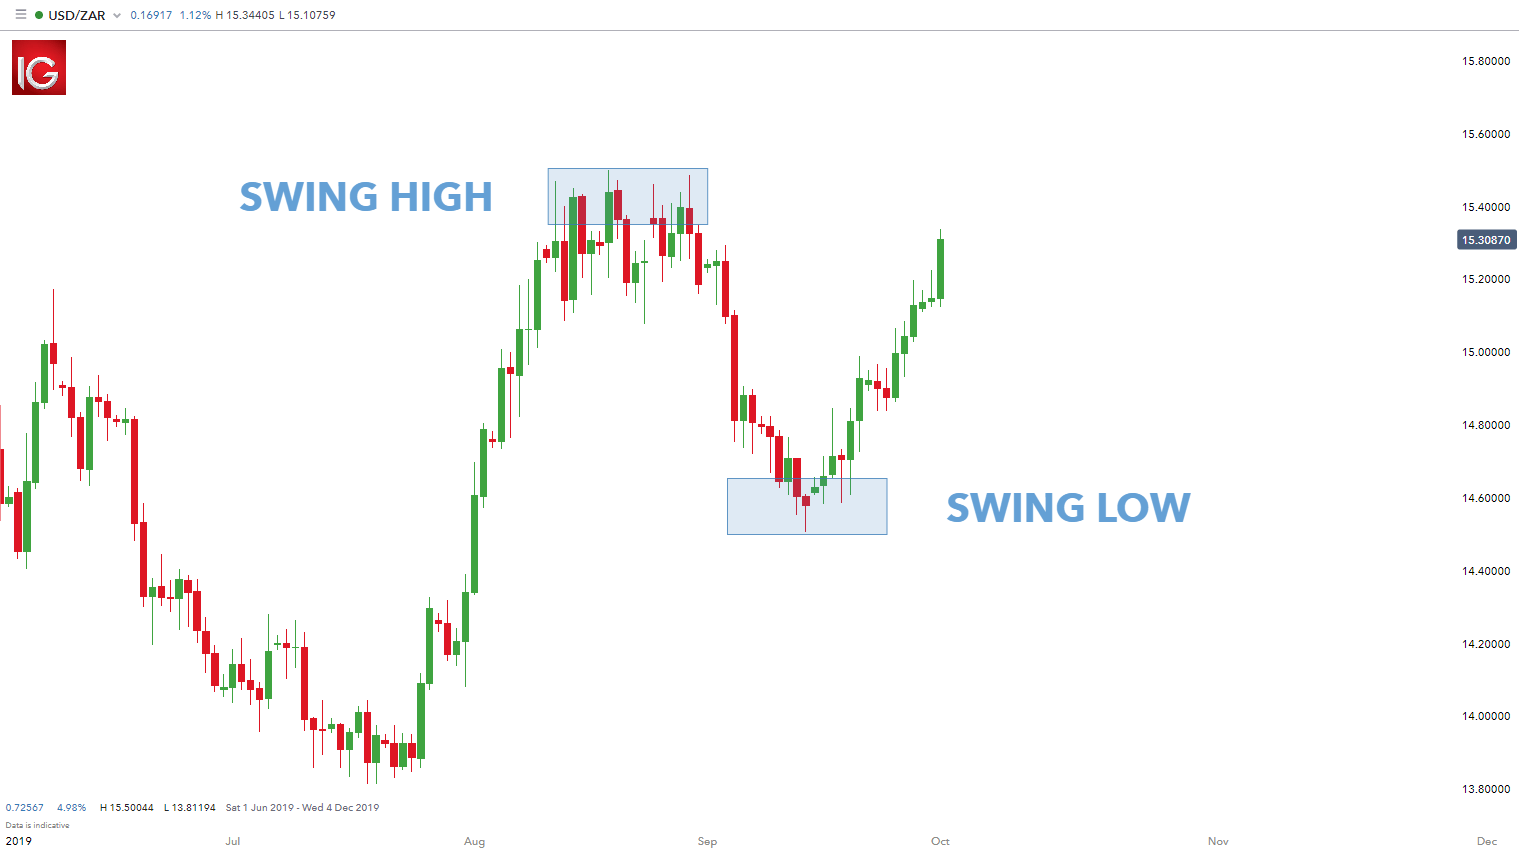
For this approach, the daily chart is often used for determining trends or general market direction and the four-hour chart is used for entering trades and placing positions (see below). The daily chart shows the recent swing high and low respectively. Traders usually trade swings back in the direction of the preceding trend – in this example the preceding trend is upwards.

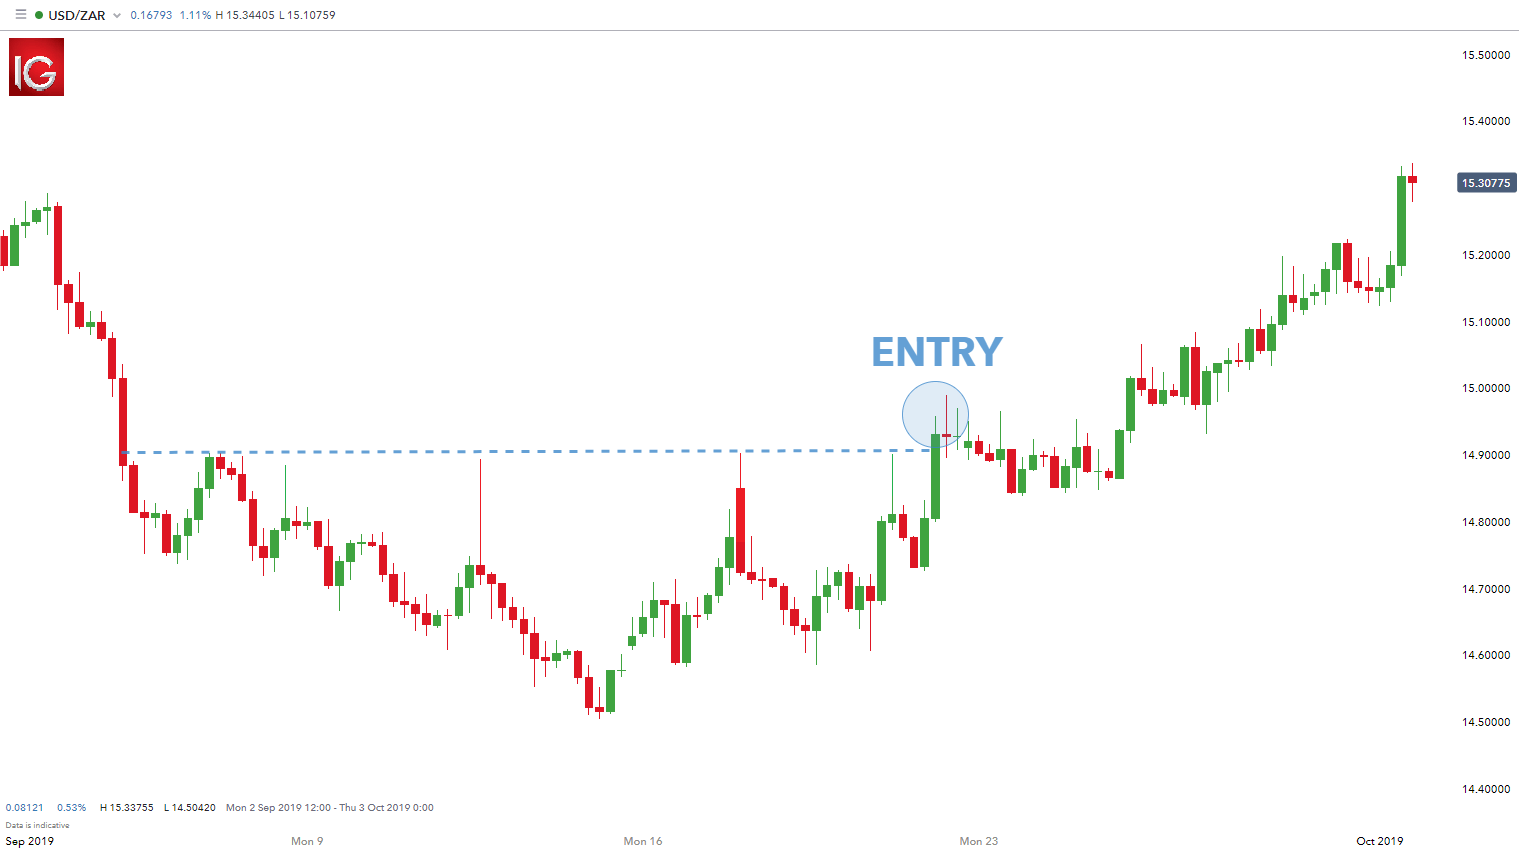
Now that the trade direction has been identified, the swing trader will then diminish the time frame to four-hours to look for entry points. In the example below, there is a clear price resistance level that the swing trader will look at when entering a long trade. Once price breaks or the candle closes above the designated resistance level, traders can look to enter.

Daily USD/ZAR trend chart:

medium-term time frame daily

4-hour USD/ZAR trigger chart:

medium-term time frame 4-hour

3) Day trading time frames

Day trading can be one of the most difficult strategies of finding profitability. Newer traders implementing a day trading strategy are exposing themselves to more frequent trading decisions that may not have been practiced for very long. This combination of experience and frequency opens the door for losses that might have been prevented had the trader opted for a slightly longer approach like swing trading.

The scalper or day trader is in the unenviable position of needing the price to move quickly in the direction of the trade. Therefore, the day trader becomes tied to the charts as they seek the market’s trends for that day. Obsessing over charts for long periods of time can lead to fatigue. The shorter-term approach also affords a smaller margin of error.

Generally, there is less profit potential in short-term trading which leads to tighter stops levels. These tighter stops mean higher probability of failed trades as opposed to longer-term trading.To trade with a very short-term approach, it’s advisable for a trader to get comfortable with a longer-term, and swing-trading approach before moving down to the very short time frames.

Resembling longer-term trading, day traders can look to evaluate trends on the hourly chart and locate entry opportunities on the ‘minute’ time frames such as five or ten-minute charts. The one-minute time frame is also an option, but extreme caution should be used as the variability on the one-minute chart can be very random and difficult to work with. Once again, traders can use a variety of triggers to initiate positions once the trend has been determined – price action or technical indicators.

Day trading example

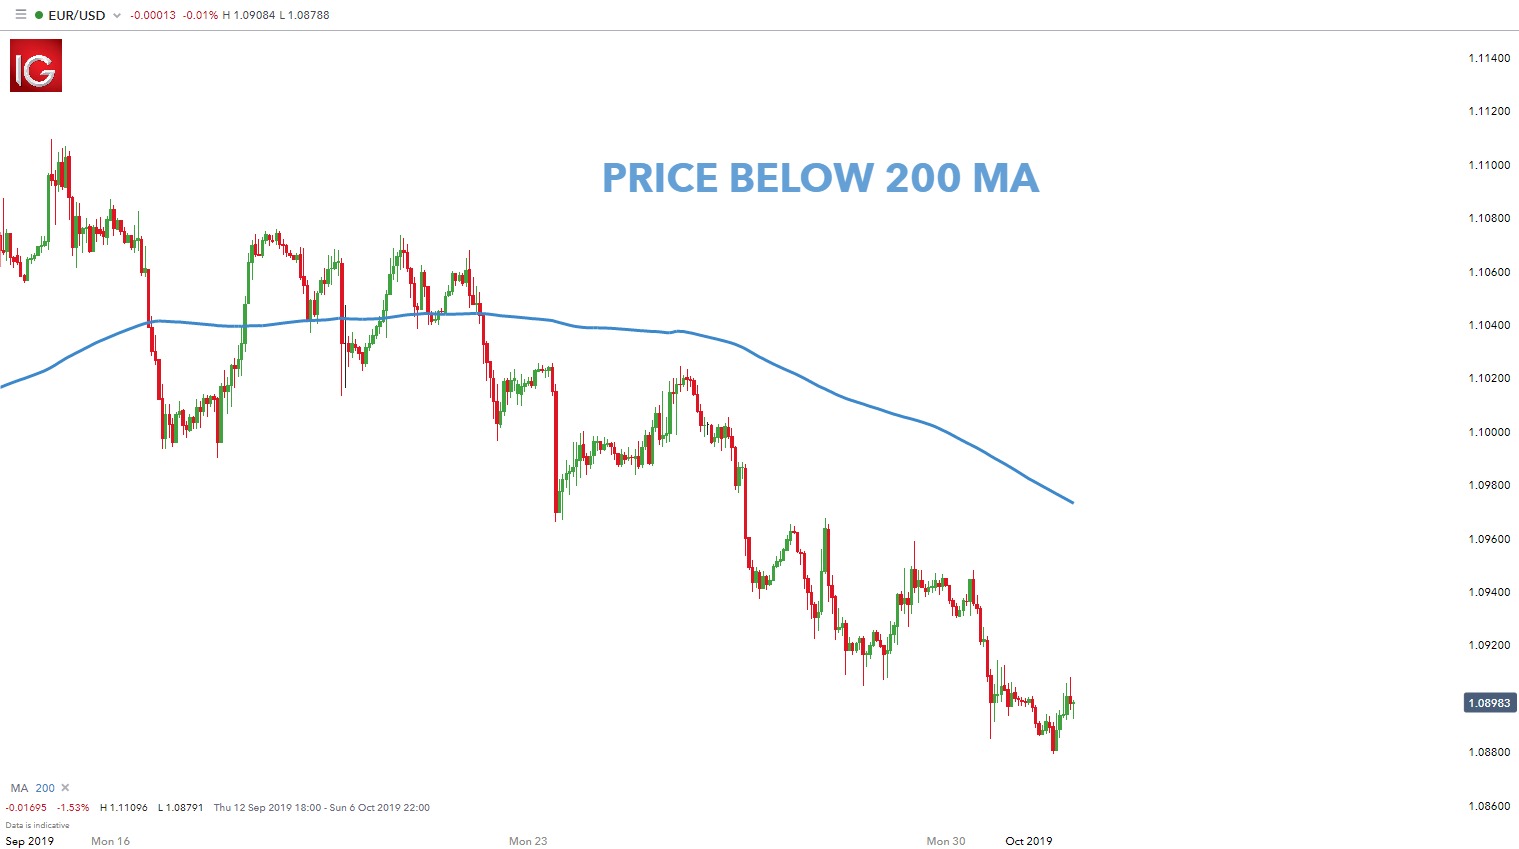
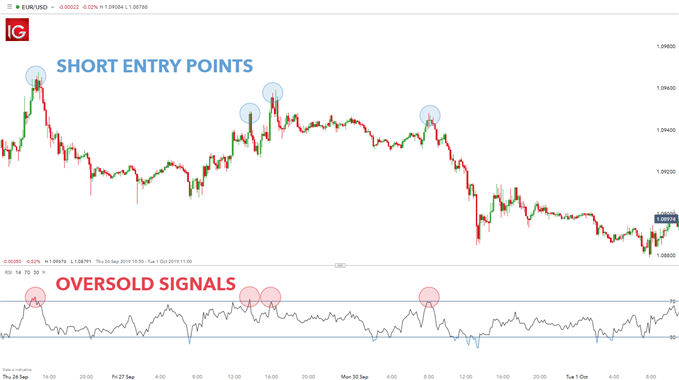
The charts below use the hourly chart to determine the trend – price below 200-day moving average indicating a downtrend. The second 10-minute chart uses the RSI indicator to assist in short-term entry points. In this case, the trader only identifies overbought signals on the RSI (highlighted in red) because of the longer-term preceding downtrend.

Hourly EUR/USD trend chart:

short-term time frame hourly

10-minute EUR/USD trigger chart:

short-term time frame 10 minute

Using multiple time frame analysis

Euro area monthly balance of payments: September 2022

Euro area current account balance

(EUR billions unless otherwise indicated; working day and seasonally adjusted data)

Source: ECB.

The current account deficit of the euro area amounted to €8 billion in September 2022, narrowing by €19 billion compared to the previous month (Chart 1 and Table 1). Deficits were recorded for secondary income (€12 billion) and goods (€11 billion). These were partly offset by surpluses for primary income (€9 billion) and services (€6 billion).

Table 1

Current account of the euro area

(EUR billions unless otherwise indicated; transactions; working day and seasonally adjusted data)

Source: ECB.

Note: Discrepancies between totals and their components may be due to rounding.

Data for the current account of the euro area

In the 12 months to September 2022, the current account recorded a deficit of €50 billion (0.4% of euro area GDP), compared with a surplus of €336 billion (2.8% of euro area GDP) in the 12 months to September 2021. This change in the balance was largely driven by a switch from a surplus (€362 billion) to a deficit (€41 billion) for goods and, to a lesser extent, by a reduction in the surplus for primary income (down from €65 billion to €19 billion). These developments were partly offset by a larger surplus for services (up from €75 billion to €134 billion) and a slightly lower deficit for secondary income (down from €166 billion to €162 billion).

Chart 2

Selected items of the euro area financial account

(EUR billions; 12-month cumulated data)

Source: ECB.

Notes: For assets, a positive (negative) number indicates net purchases (sales) of non-euro area instruments by euro area investors. For liabilities, a positive (negative) number indicates net sales (purchases) of euro area instruments by non-euro area investors.

In direct investment, euro area residents made net investments of €206 billion in non-euro area assets in the 12-month period to September 2022, following net investments of €86 billion in the 12 months to September 2021 (Chart 2 and Table 2). Non-residents disinvested €60 billion in net terms from euro area assets in the 12-month period to September 2022, following net disinvestments of €38 billion in the 12 months to September 2021.

In portfolio investment, euro area residents’ net sales of non-euro area equity amounted to €146 billion in the 12 months to September 2022, following net purchases of €518 billion in the 12 months to September 2021. Over the same period, euro area residents’ net sales of non-euro area debt securities amounted to €20 billion, following net purchases of €475 billion in the 12 months to September 2021. Non-residents’ net purchases of euro area equity decreased to €103 billion in the 12-month period to September 2022, down from €511 billion in the 12 months to September 2021. Over the same period non-residents’ net sales of euro area debt securities amounted to €124 billion, decreasing from €343 billion in the 12 months to September 2021.

Table 2

Financial account of the euro area

(EUR billions unless otherwise indicated; transactions; non-working day and non-seasonally adjusted data)

Source: ECB.

Notes: Decreases in assets and liabilities are shown with a minus sign. Net financial derivatives are reported under assets. “MFIs” stands for monetary financial institutions. Discrepancies between totals and their components may be due to rounding.

Data for the financial account of the euro area

In other investment, euro area residents recorded net acquisitions of non-euro area assets amounting to €362 billion in the 12 months to September 2022 (following net acquisitions of €46 billion in the 12 months to September 2021), while their net incurrence of liabilities decreased to €533 billion (down from €721 billion in the 12 months to September 2021).

Chart 3

Monetary presentation of the balance of payments

(EUR billions; 12-month cumulated data)

Source: ECB.

Notes: “MFI net external assets (enhanced)” incorporates an adjustment to the MFI net external assets (as reported in the consolidated MFI balance sheet items statistics) based on information on MFI long-term liabilities held by non-residents, available in b.o.p. statistics. B.o.p. transactions refer only to transactions of non-MFI residents of the euro area. Financial transactions are shown as liabilities net of assets. “Other” includes financial derivatives and statistical discrepancies.

The monetary presentation of the balance of payments (Chart 3) shows that the net external assets (enhanced) of euro area MFIs decreased by €148 billion in the 12-month period to September 2022. This decrease was driven by euro area non-MFIs’ net outflows in direct investment, other investment and other flows. These developments were partly offset by the current and capital accounts surplus and by euro area non-MFIs’ net inflows in portfolio investment equity and, to a lesser extent, in portfolio investment debt.

In September 2022 the Eurosystem’s stock of reserve assets increased to €1,135.8 billion, up from €1,130.6 billion in the previous month (Table 3). This increase was driven by positive exchange rate changes (€6.0 billion) and, to a lesser extent, by net acquisitions of assets (€3.6 billion), which were partly offset by negative price changes (€4.4 billion).

Table 3

Reserve assets of the euro area

(EUR billions; amounts outstanding at the end of the period, flows during the period; non-working day and non-seasonally adjusted data)

Sunak’s Britain Is Starting to Have Second Thoughts About Brexit

Even after years of division and vitriol, it seems like Britain still needs to talk about Brexit.

More than six years after voting to leave the European Union, the UK is facing a prolonged recession and a deep cost-of-living crisis. Last week’s Autumn Statement heralded years of higher taxes and cuts to public spending.

The gloomy prognosis has re-opened the debate over Brexit, previously the deadly third rail of Conservative Party politics, which many thought ended for good with the signing of a free trade deal at Christmas 2020.

Days after being forced to accept sweeping changes in fiscal policy, Brexiters were last weekend confronted with a Sunday Times story that said senior figures in Prime Minister Rishi Sunak’s government are seeking a closer “Swiss-style relationship” with the European Union.

Read More: UK Brexit Debate Returns With Sunak Under Pressure on Immigrants

The language angered hardliners who oppose anything that trades away Britain’s newly won regulatory freedoms. Yet the very fact that the possibility was broached in public — and attributed to a senior government source — is a departure from the bombastic “have cake and eat it” era of Boris Johnson or the short-lived low-tax vision of his successor, Liz Truss.

Chancellor of the Exchequer Jeremy Hunt has privately said that the UK should seek a closer trading arrangement with the EU, in line with the Sunday Times report, multiple senior government figures familiar with his thinking said. In the first sign of dissatisfaction with Hunt from within Sunak’s camp, one senior official criticized the chancellor for speaking too loosely.

A spokesman for Hunt declined to comment. Hunt’s views have been over-interpreted by the media, people familiar with his thinking said.

Yet Hunt’s tone mirrors a shift in public attitudes, with a new poll of polls overseen by UK elections guru Professor John Curtice showing that Britons reject Brexit by 57% to 43%. Last week, YouGov Plc reported that a record high 56% of respondents now believe Brexit was wrong. Some 19% of those voted for Brexit but now regret their choice, YouGov said.

“There is a gradual, slow erosion of support for Brexit,” said Curtice, professor of politics at Strathclyde University, in an interview.

The current government — in power for 12 years — simply isn’t very popular any more, Curtice noted, and faces a demographic problem. “With every cohort of 18-year-olds who enter the electorate, there are more people who are pro-EU.”

For now, though, Brexit remains divisive enough to force the prime minister — a long-term Brexiter who backed Vote Leave in 2016 — to speak out on Monday.

“Under my leadership the United Kingdom will not pursue any relationship with Europe that relies on alignment with EU laws,” Sunak told the Confederation of British Industry’s annual conference. Regulatory freedom, he said, is “an important opportunity of Brexit.”

Sunak’s clear and rapid rebuttal was cheered by David Frost, who served as Boris Johnson’s lead negotiator and called Sunak’s remarks “welcome and reassuring.”

Others were less convinced. In a message to the Conservative MPs’ WhatsApp group on Sunday, seen by Bloomberg, former Cabinet minister Simon Clarke told colleagues that the Treasury has a “long-held ambition” to align the UK with EU rules in order to secure the economic benefit of access to its markets.

Parliamentary arithmetic also matters. Many Conservative MPs elected in 2019 are pro-Brexit, making any new overtures to Brussels unlikely before the next election, due by Jan. 2025, multiple Tories said. Brexiteer MPs would attempt to oust Sunak if he tried that, one MP claimed.

Even so, the European Research Group of hard-line Brexiters, a thorn in the side during Theresa May’s premiership, is not the force it once was. Erstwhile ringmaster Steve Baker is now a minister, and last month the group could not agree on who to back for prime minister.

Few expect a dramatic policy shift anytime soon. Those involved in ongoing talks over Northern Ireland’s post-Brexit status on both the UK and EU side were surprised by the reports, with one EU diplomat saying a Swiss-style arrangement is not on offer. Two EU sources told Bloomberg they felt the proposal was aimed at testing appetite in the UK — and within the Conservative Party — for deepening the UK-EU economic relationship.

Unsettled Times

That question is becoming ever more relevant as the economic backdrop darkens further, and as experts break cover to speak up about the consequences of Brexit.

Last week, former Bank of England rate-setter Michael Saunders told Bloomberg TV that the “UK economy as a whole has been permanently damaged by Brexit.”

Current BOE policy maker Swati Dhingra told lawmakers last Wednesday: “It is undeniable now that we are seeing a much bigger slowdown in trade in the UK compared to the rest of the world.”

According to the Office for Budget Responsibility, Brexit will reduce UK GDP by 4% over the longer term. Analysis by Bloomberg Economics shows the UK lagged the trade performance of other big nations before the pandemic — and has failed to fully share in the rebound since then.

Economic growth has been stronger than in Italy and Germany, according to OECD data. But measuring living standards in the biggest European economies, only Spain has performed worse than the UK.

Markets have suffered too. Sterling has fallen 10.5% against the trade-weighted basket of currencies, 20% against the dollar and 11% against the euro. Earlier this month the Paris bourse overtook the London Stock Exchange in market worth. In 2016, British stocks were collectively worth $1.5 trillion more.

The volatility has unsettled businesses, which are battling inflation at four-decade highs while they struggle to recruit staff amid a tight labor market.

Speaking at the CBI conference, Sarah Pollard, chief financial officer of PZ Cussons Plc, said that Brexit had a “very clear impact on access to talent and consumer confidence.” A closer “tie-up with Europe” would create more “resilience and buoyancy” in the economy, Pollard said.

GBPUSD within tight range after advance pauses near 1.2000

The short-term oscillators are currently indicating a cautiously bullish near-term tone. Specifically, the RSI is hovering above its 50-neutral mark, while the MACD histogram is flat above both zero and its red signal line.

To the upside, bullish actions could propel the price towards the recent resistance of 1.2028. Piercing through this region, the price could challenge the July peak of 1.2290. Even higher, the 1.2400 hurdle could curb any further advances before the May high of 1.2666 comes under examination.

Alternatively, should the positive momentum fade and the price reverses downwards, initial support could be met at 1.1645. Sliding beneath that floor, the bears might target 1.1260 before the spotlight turns to the November low of 1.1144. A violation of the latter could open the door for the October resistance of 1.1060.

Overall, GBPUSD appears to be losing steam after managing to break above its long-term restrictive trendline. Nevertheless, a break above the 1.2028 ceiling would most likely signal the continuation of the short-term uptrend.