US New-Home Sales Unexpectedly Rise, Driven by Demand in South

Sales of new US homes unexpectedly rose in October, largely driven by an increase in the South and likely representing a pause in an otherwise weak housing market.

Purchases of new single-family homes increased 7.5% to an annualized 632,000 pace last month after falling in September, government data showed Wednesday. The median estimate in a Bloomberg survey of economists called for a 570,000 rate.

Sales in the South rebounded after a sharp retreat a month earlier when Hurricane Ian slammed into Florida and parts of Georgia and South Carolina. The October pace in the South was still slower than in August.

Even with the surprising pickup in sales, buyer demand has rapidly evaporated this year amid the Federal Reserve’s aggressive interest rate hikes to tame inflation. Mortgage rates, which topped 7% by the end of October, have more than doubled this year. That’s put a brake on sales and construction while also helping to push down home prices.

Looking ahead, though, a recent drop in mortgage rates may help to stabilize housing demand. The 30-year fixed mortgage rate has dropped nearly a half percentage point in the past two weeks, the most since 2008 according to Mortgage Bankers Association data released Wednesday.

In addition to the 16% sales pickup in the South, demand in the Northeast also increased. Purchases in the Midwest and West fell.

The report, produced by the Census Bureau and the Department of Housing and Urban Development, showed the median sales price of a new home rose 15.4% from a year earlier, to $493,000.

For Sale

There were 470,000 new homes for sale as of the end of last month, though the overwhelming majority remain under construction or not yet started. The number of for-sale dwellings under construction, however, was the smallest in six months. At the current sales pace, it would take 8.9 months to exhaust the supply of new homes.

Earlier this month, Michael Murray, co-chief operating officer at D.R. Horton Inc., one of the largest US homebuilders, said the company closed fewer homes than expected in the latest quarter due to slower sales, more cancellations and continued construction delays.

New single-family home construction declined in October to the slowest pace since May 2020, according to government data last week. Permits also declined, and homebuilder sentiment has declined every month this year.

The number of homes sold in October and awaiting the start of construction — a measure of backlogs — increased to the highest level since January.

New-home purchases account for about 10% of the market and are calculated when contracts are signed. They are considered a timelier barometer than purchases of previously-owned homes, which are calculated when contracts close.

The new-homes data are volatile; the report showed 90% confidence that the change in sales ranged from a 13.3% decline to a 28.3% increase.

Copper Trading: Copper Trading Tips and Strategies

Copper Trading: Copper Trading Tips and Strategies

  • Copper is a highly tradeable commodity.
  • Copper is priced in US Dollars; so the price of the dollar affects the price of copper.
  • Copper is gaining more traction as an investment option along with various other alternatives.
  • As looked at in our primer for copper, copper prices tend to do well when emerging markets are growing as demand derives from building and construction.
  • Trading strategies for copper can include both technical and fundamental analysis.

Copper is a global commodity that has several key uses throughout industry and is highly correlated to economic growth. Copper trading is often used by hedgers and speculators as protection or exploitation of future price movements. Both individuals and institutions are able to gain exposure to copper and copper trading, making this metal popular choice within the commodity trading spectrum.

Why Trade Copper and How Does Copper Trading Work?

One advantage of copper trading is accessibility. Copper is traded through a variety of avenues like futures, options, equities and CFDs. You can also gain exposure to copper via copper ETFs (exchange traded funds) like CPER (United States Copper Index Fund) or JJCB (iPath Series B Bloomberg Copper Subindex Total Return ETN).

Copper is a soft malleable metal with properties like gold and silver. It derives most of its demand from building construction, transportation equipment and electronic products. It is a strong conductor of electricity and heat, and therefore has a wide range of industrial uses which also leads it to trade in high volumes – a good thing for traders because it can lead to reduced spreads and potentially cleaner chart patterns.

Movements in the price of copper are heavily dependent on demand from emerging market economies like China and India. During times of economic growth, these nations demand large quantities of copper, the demand of which helps to increase the metal’s price. Alternatively, during economic downturns demand for copper drops, price tends to fall as well. Traders should be aware of this dynamic when trading copper.

Many copper traders use technical and/or fundamental analysis to inform their trading strategy which helps a trader forecast whether the price of copper will rise or fall. Once a trader is confident in their forecast, he/she can buy or sell copper in an attempt to profit from price movements. In this way, a trading strategy can also help a trader to manage their risk, identify buy and sell signals in the market and set reasonable take-profit and stop-loss levels with aim of positive risk to reward ratios.

Copper Trading Hours

Copper trades on the CME Globex and CME ClearPort:

Sunday – Friday 6:00 p.m. – 5:00 p.m. (5:00 p.m. – 4:00 p.m. Chicago Time/CT) with a 60-minute break each day beginning at 5:00 p.m. (4:00 p.m. CT)

What Factors Affect the Price of Copper?

US Dollar

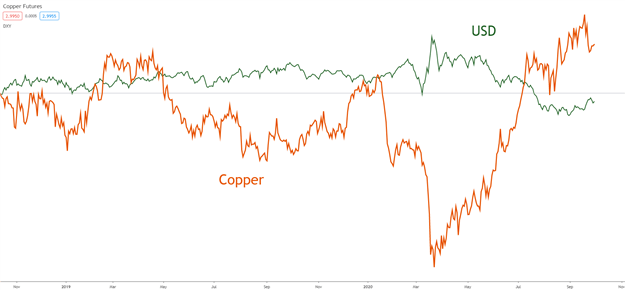
Like many other metals, copper is inversely correlated (see chart below) to the US Dollar which means that when the US Dollar depreciates, copper prices generally rise and vice versa. It is important to note that this relationship is not one-to-one (delta 1) but does carry a high degree of correlation.

The reason why the US Dollar is an influencing factor on copper is because copper is priced in USD. For example, when the Dollar falls, a buyer will have to pay fewer of his/her domestic currency to purchase a specified amount of copper. Therefore, the commodity (copper) becomes cheaper to buy. This tends to cause an increase in demand and ultimately a rise in the price of copper.

Copper and USD chart inverse correlation representation:
Oil

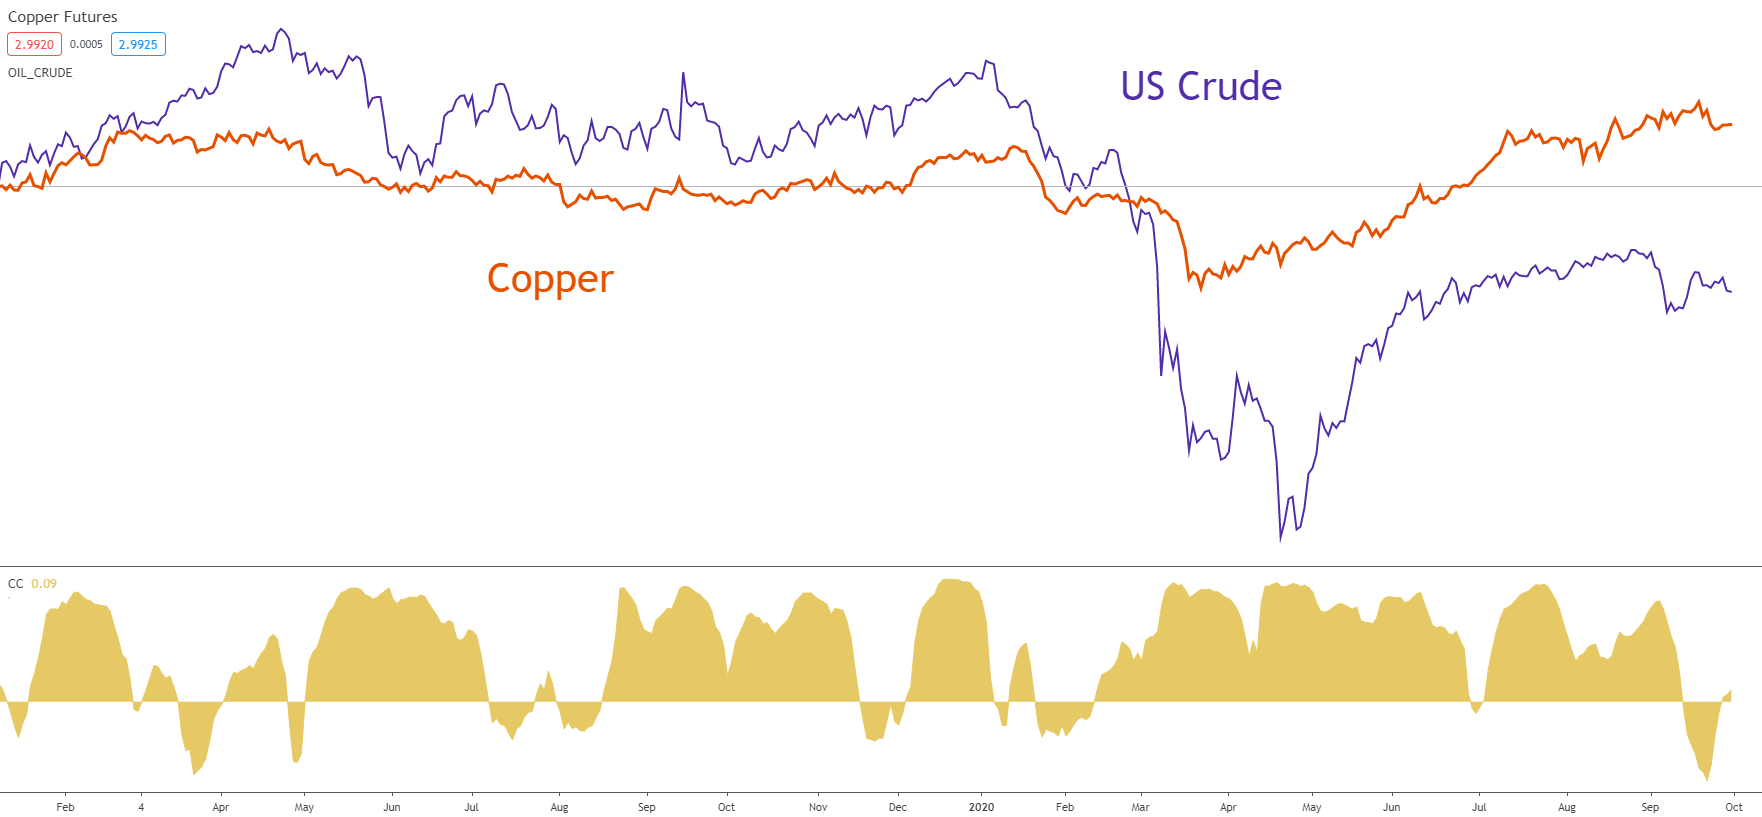
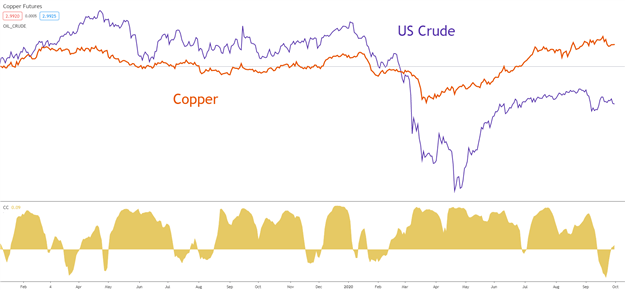
The refining of copper involves melting down the metal to remove impurities. This process is extremely energy exhaustive and accounts for a large portion of overall cost. Oil prices tend follow a similar trajectory to copper (see chart below). This being said, oil prices are affected by many of the same factors as copper which could support the traditional positive relationship. Regardless of specifics it is clearly noticeable that a relationship exists between both copper and oil, which could provide valuable insight into the copper market. Renewable energy sources are growing in popularity which could interrupt the historical price dynamic between copper and oil.
Copper as a Barometer for Global Growth

Copper is often linked to industrial growth and therefore overall economic growth. Infrastructure, manufacturing and construction now play a huge role in economic expansion which heavily relies on copper. Consumption (demand) for copper tends to reflect in the price of copper as an increase in demand is generally followed by an increase in copper price and vice versa. Copper is broadly regarding as the king amongst base metals as it is the most widely used metal in growing both emerging market and established economies.

The general economics of supply and demand are observed which can be used as a rule of thumb when trading copper:

  • Increase in supply ? Lesser demand
  • Decrease in supply ? Higher demand

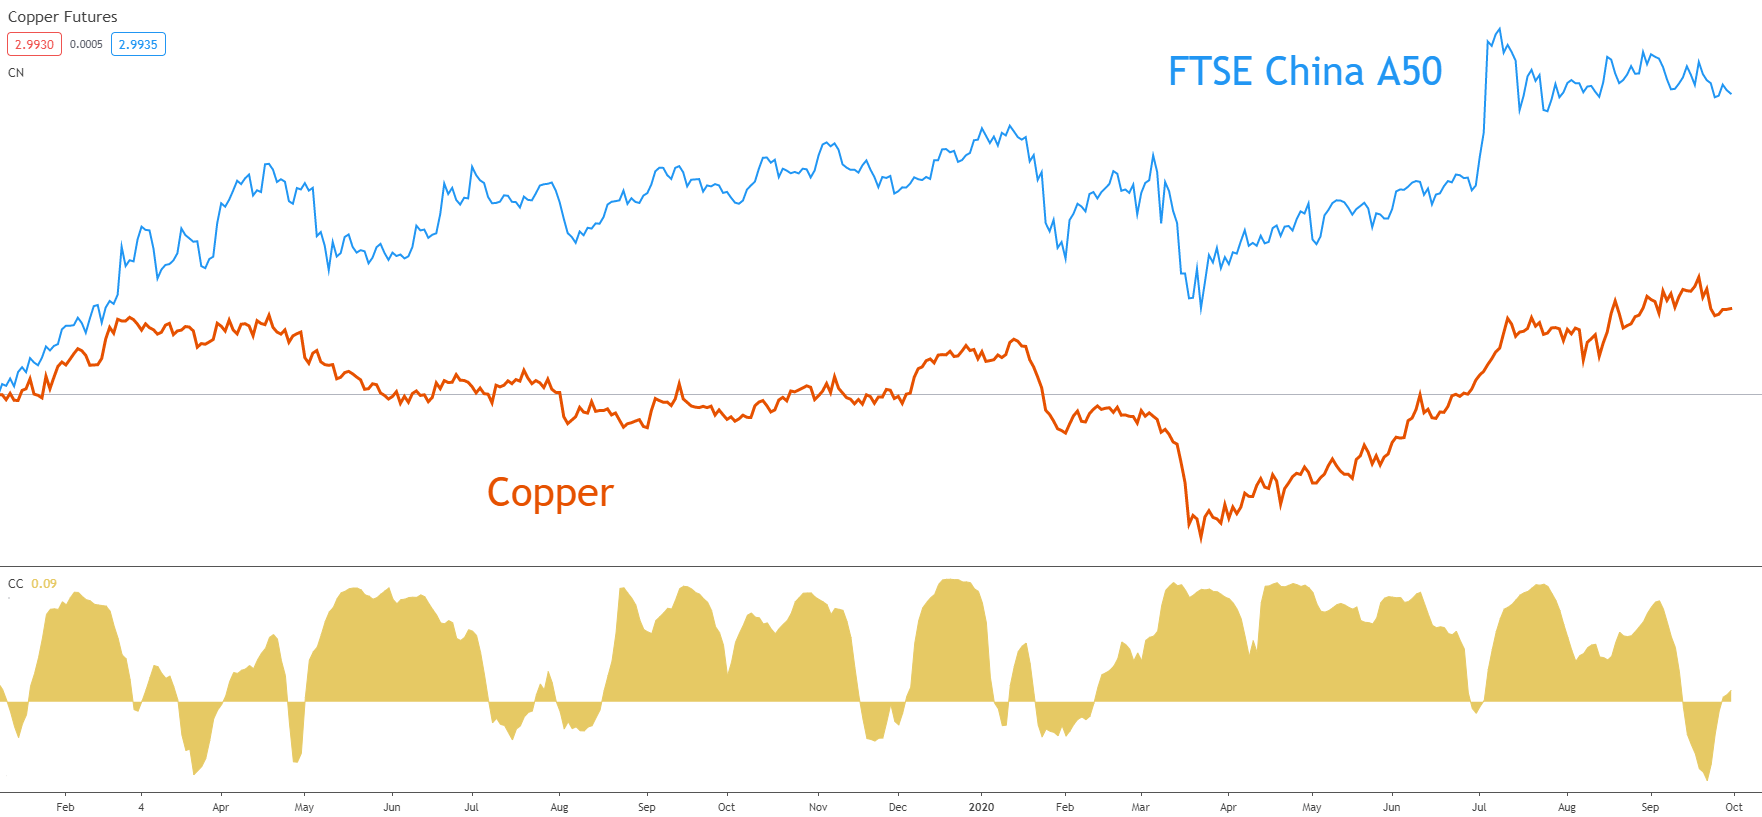
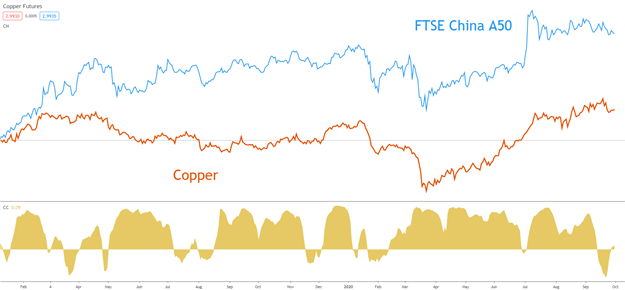
A major influence on the demand/supply of copper comes via China. China is the single biggest buyer of copper in the world. Although China has mines of its own, Chinese demand requires additional supply which is sourced from other major copper producing countries. This is why the Chinese economy is such an important factor to consider when trading copper. If China continues on its growth trajectory, one can expect sustained demand for copper (see chart below). It is important to note that China is determined on being self-sufficient in the long-term which could disrupt future supply/demand dynamics.

Copper and FTSE China A50 chart positive correlation representation:
Copper supply and production costs

Copper mining is primarily focused within South America which can have a large bearing on the price of copper. Shortage of supply, quality of copper and the variations in production costs can all have resultant impacts on price. This leads on to country specific risk which can affect supply due to political instability or work related issues.

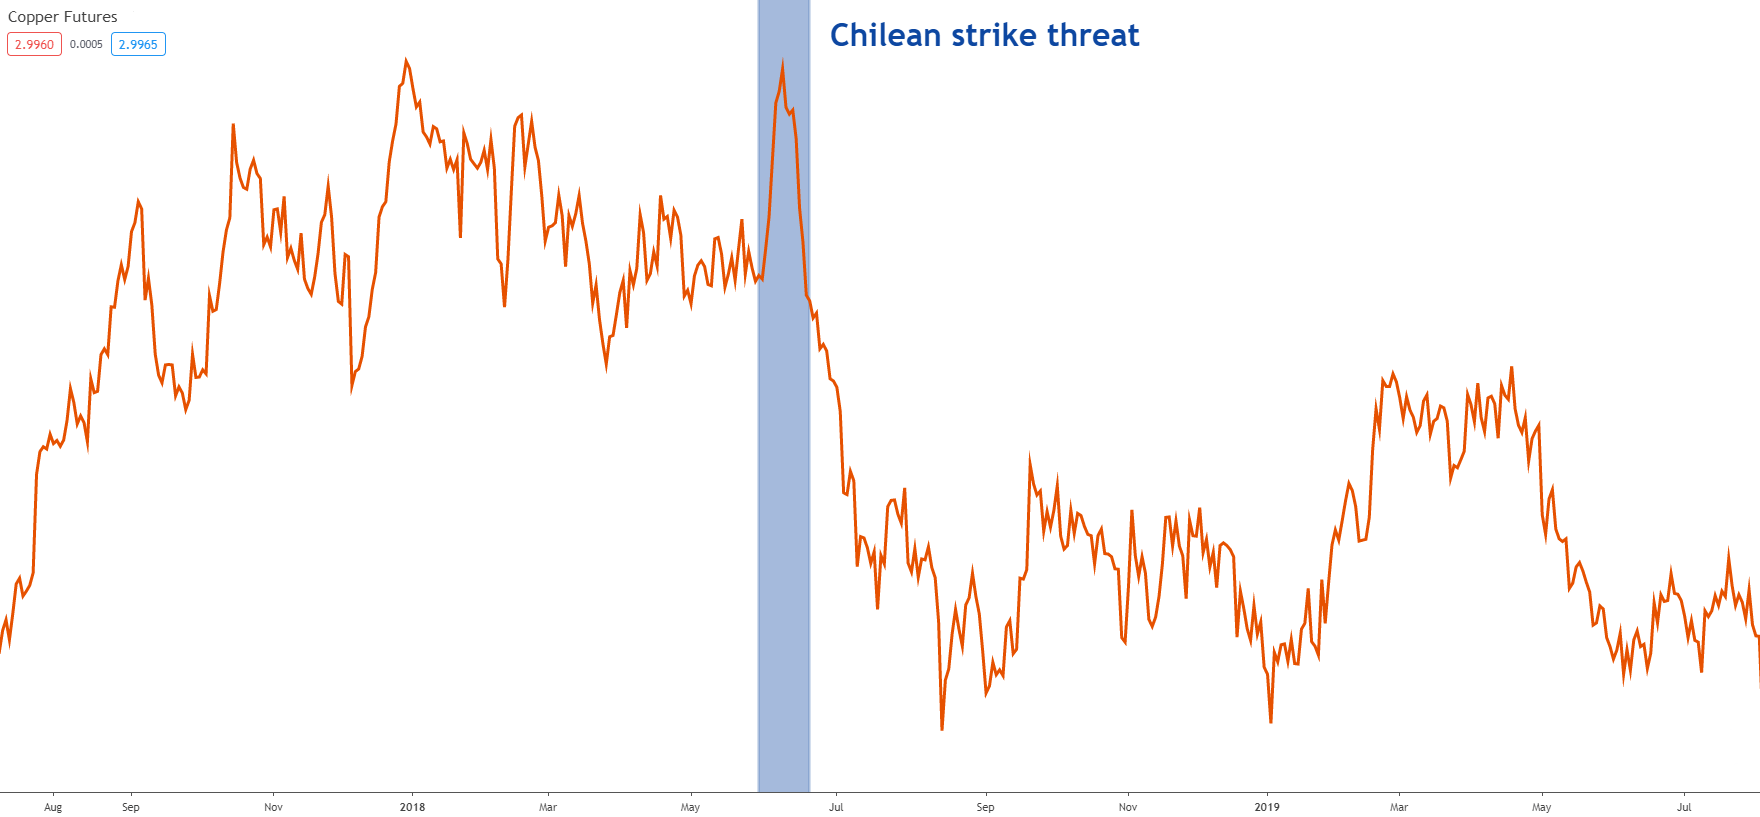
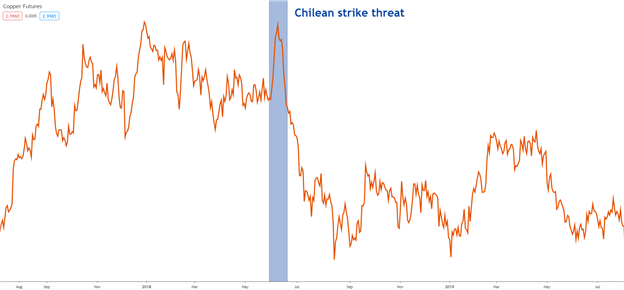
In mid 2018, Chilean (worlds largest copper producer) copper workers declared they would strike unless their increased wage demands were met. This significantly manipulated copper prices as the threat of a supply shortage may ensue, causing a surge to multi-year highs at the time (see chart below).

Copper price reaction to Chilean copper strike:
Copper as an Investment

Copper has historically been regarded as a commodity without many investment benefits. The majority of copper trading was executed as a hedge against future price fluctuations to lock in a specific price. This has changed over the past few decades as speculative traders have increased their impact on copper prices. Large institutions and hedge funds have increased their stake in copper as an investment which is highly correlated to economic growth. For example, a fund manager bullish on economic growth may also be bullish on copper. There may be some cyclicality to this, and could be a good diversification tool away from traditional alternatives.

Trading Copper: Strategies

Copper’s versatility and dependency on various fundamental factors create a diverse combination in terms of trading strategies. Trading strategies can be purely technical, fundamental or a combination of both. Understanding how the technical and fundamental components work both individually and in unison with one another can lead to a comprehensive copper trading strategy.

Technical Strategy example:

The example below incorporates several technical analysis techniques to derive a trading decision. It is important to note that this is only one of various approaches that can be implemented into a technical strategy.

To learn more on alternative technical trading strategies, visit our DailyFX education center!
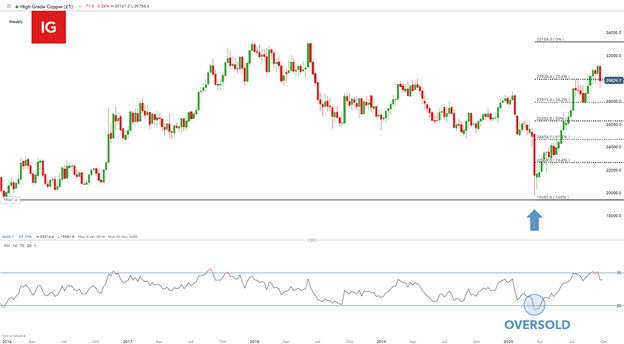
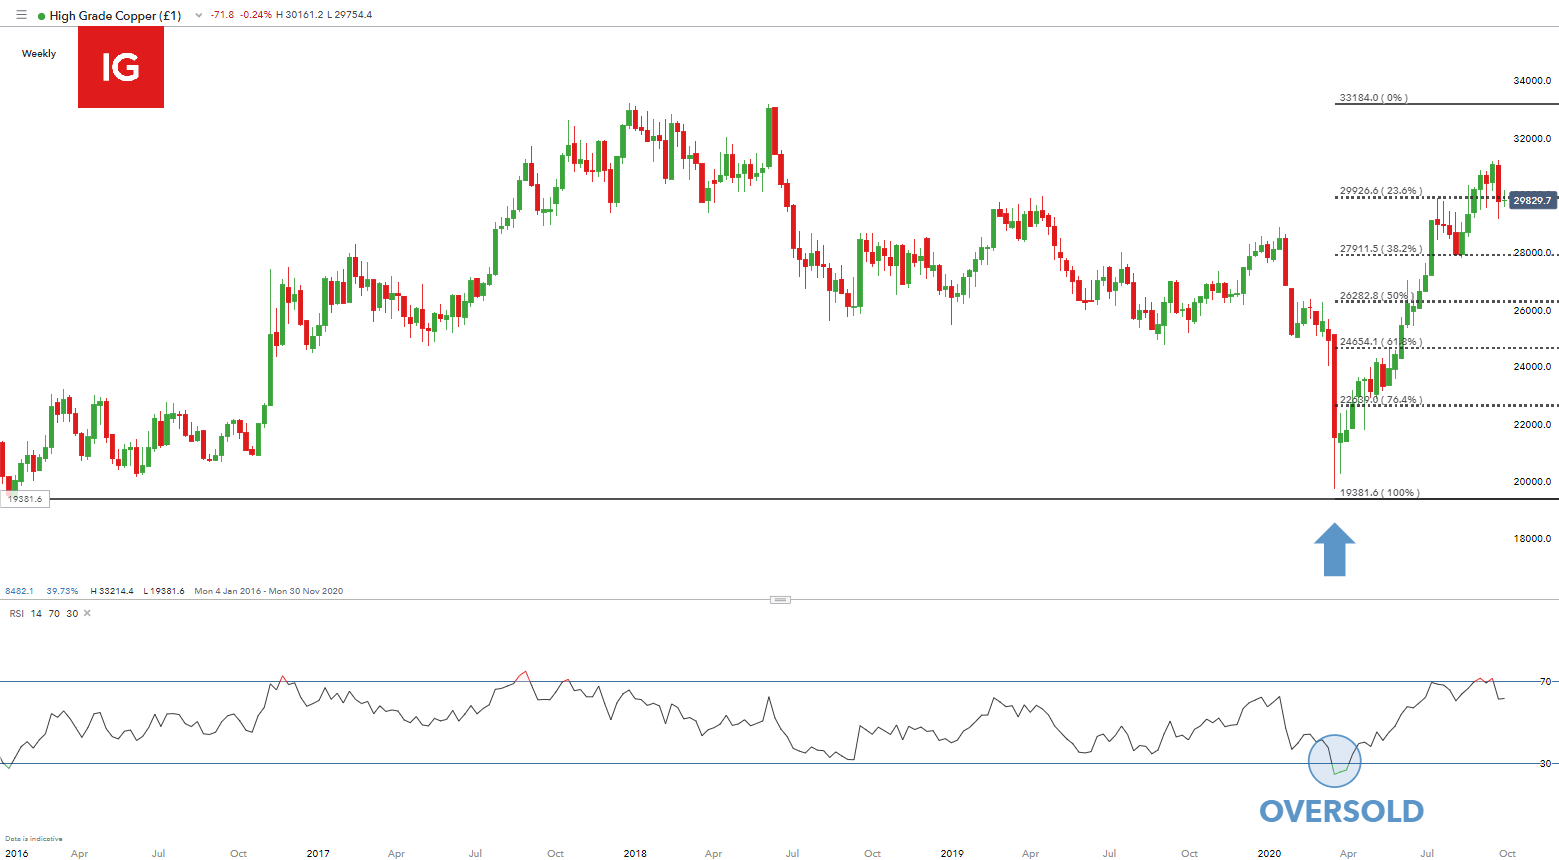
The weekly copper chart above uses price action, support and resistance and a technical indicator to determine a possible setup in copper. The Fibonacci retracement drawing is taken from the January 2016 low to the June 2018 high. This drawing has resulted in several support and resistance zones. It is clear that several of these zones are areas of confluence to which price adheres/respects.

The $1.93 per pound low (black) was a significant level of support as price approached in March 2020. From a technical perspective, as price moved toward the 2016 low the inclination would be to buy if price did not break through the $1.93 support zone.

The Relative Strength Index (RSI) supported this rationale with an oversold signal below the 30 level (blue). Combining these two simple techniques gave a stronger motivation for a long position. In this case, a long trade would have been successful as price reversed into the current medium-term upward trend.

Fundamental Strategy example:
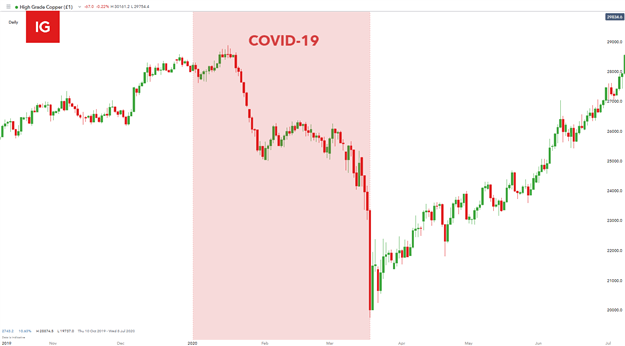
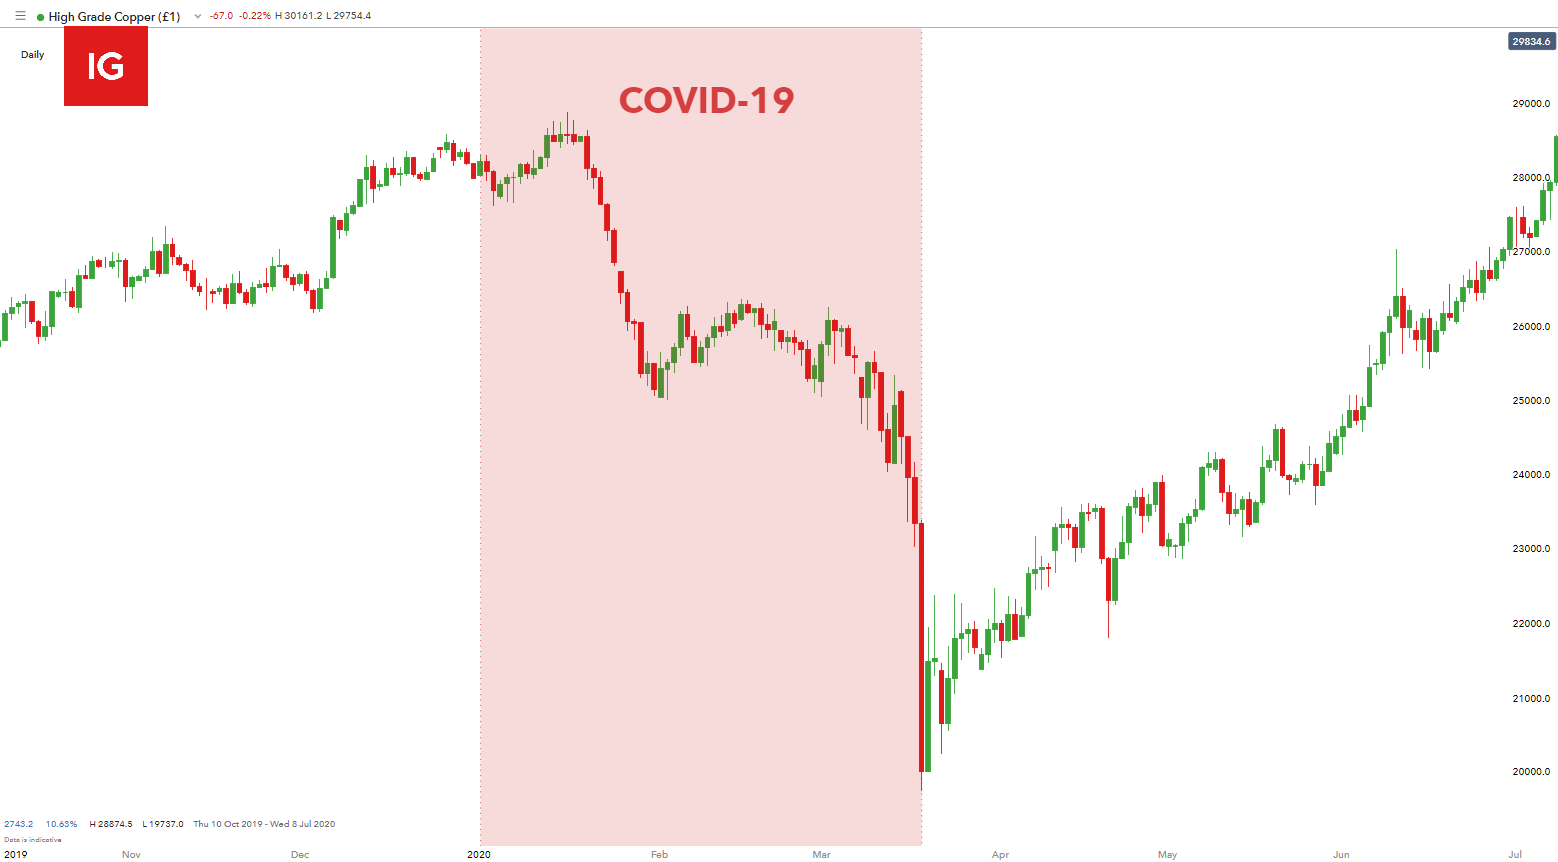
Becoming familiar with the fundamental levers involved in copper trading will allow for appropriate trading strategies to follow. The daily chart above shows the impact of the global COVID-19 pandemic and its influence on copper.

Reverting back to the factors affecting copper, it is well-known that copper is highly correlated (positive) with economic growth. Therefore, a disruption in economic growth should in theory, disrupt supply and demand subtleties. With the global pandemic ensuing at the start of 2020, it is sensible to forecast a slump in economic growth as the virus spreads around the globe.

As expected, a decline in economic growth was realized with copper following suit. From January 2020 to mid March 2020, copper prices fell roughly 30% due to the COVID-19 pandemic. This is one such scenario whereby understanding the dynamics of fundamentals in copper trading can result in prudent decision-making.

Fundamental and Technical Strategy example:

Utilizing both fundamental and technical analysis in a trading strategy requires more time but this extra effort may produce a superior model as it will include more input data. At the beginning of 2019 copper prices were trading at a one and a half year low due to trade tensions between the US and China along with a decrease in import volume by the Chinese. However, as trade tensions fizzled out with support from a weaker US Dollar copper prices appreciated over the next few months.
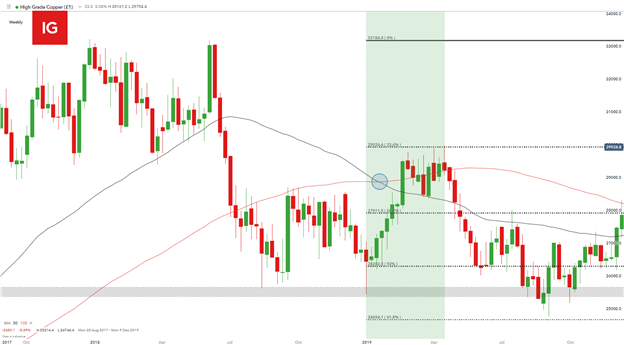
Managing these complexities from a trading perspective may start with a basic technical set up beginning with a simple Fibonacci retracement. The Fibonacci drawing above was taken from the January 2016 low to the June 2018 high as used in the prior technical example. Using the Fibonacci alone reveals that the 50% $2.62 per pound zone is a key area of support at the start of January. At this point, there is no directional bias as fluctuates around this support zone.

This is where fundamental factors play an integral role in trading copper. Market participants who follow macroeconomic events such as the US-China trade talks would be aware of decreased volatility and intensity around the topic as it slowly dissolved. With this knowledge supplemented by a dwindling USD, the likelihood of copper prices rising in the near term would gain more traction. With prices respective of the 50% $2.62 per pound Fibonacci level, and the bullish macroeconomic environment, a copper trader may look to enter into a long position from this support zone in anticipation of an upward price move.

Stop losses could have been placed at the recent swing low around the $2.54 – $2.56 support zone (black) for more risk seeking traders or the 50% $2.62 level for more risk averse traders. Risk management is key to any strategy and should be practiced consistently and appropriately to ensure sensible trading.

The next level of resistance would have been the 38.2% $2.79 per pound Fibonacci level whereby traders may look to exit long positions and look for possible reversals or an extension of the already strong bullish move. In this case, the Moving Average (MA) indicator was useful as the 50-day MA (red) crossed above the 100-day MA (black) which is suggestive of a bullish price movement. This crossover appeared in mid January 2019 and with sustained supportive macroeconomic conditions, copper prices extended further. Additional data inputs such as the bullish MA crossover can give traders the information required to select a focused trade.

How to Trade Copper: Summary

Copper has progressed into a well diversified metal and can now been seen as an investment possibility. Perceptive interpretation of copper technicals and fundamentals can place market participants in favorable positions to exploit price movement. These wide ranging influences on copper can prove difficult to navigate through but greater exposure and awareness should allow for more clarity.

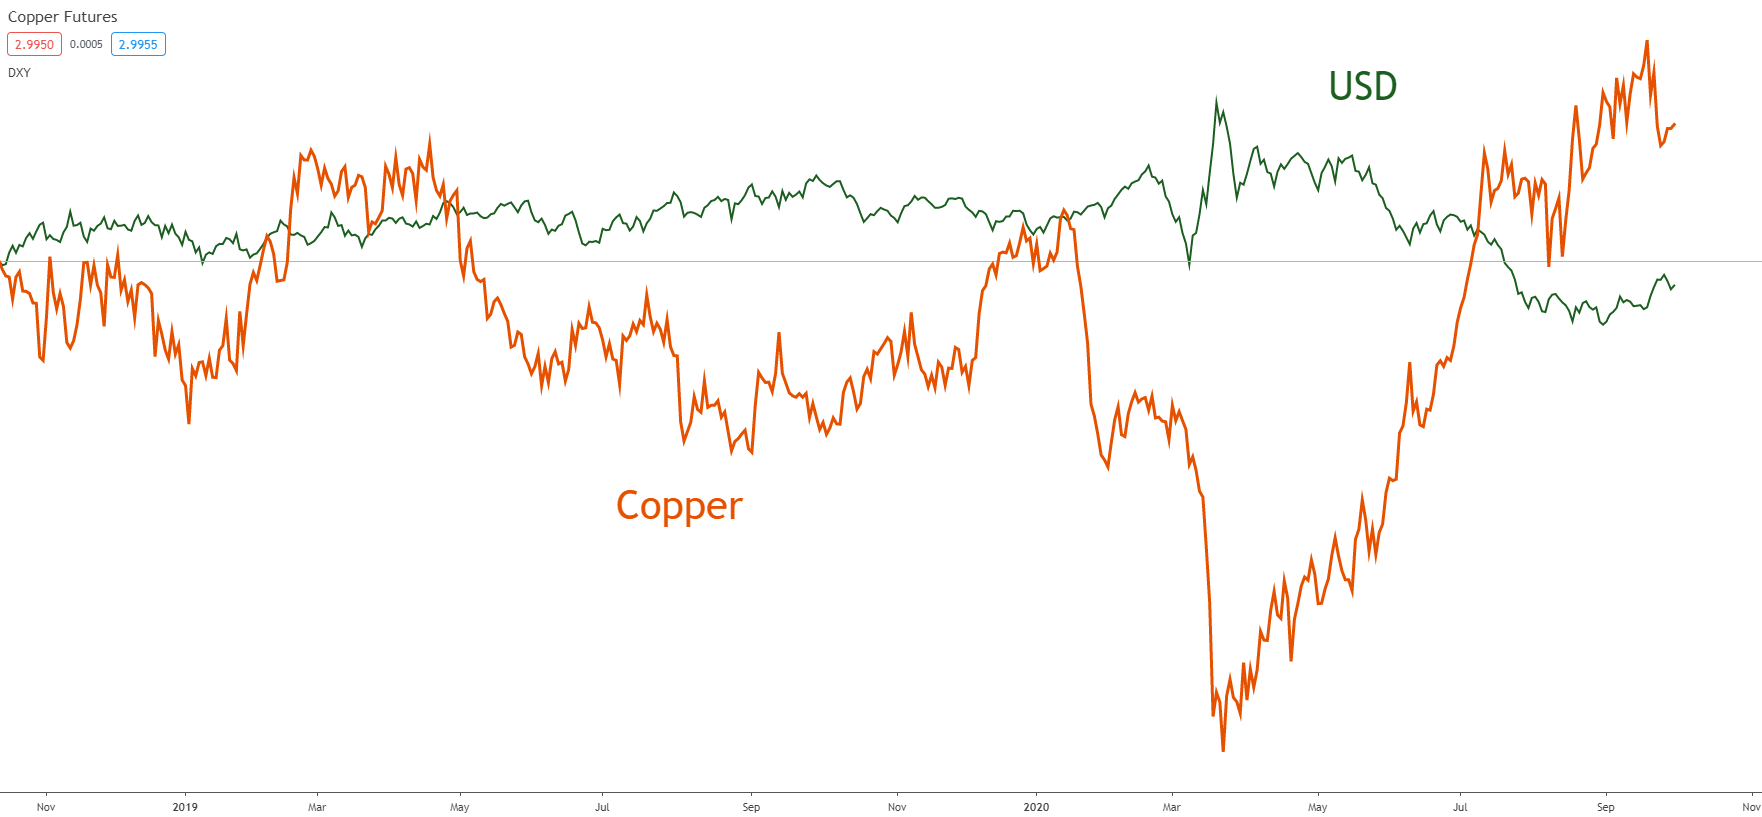
image1.png

Bitcoin Technical Outlook: Down But Not Out

BITCOIN SHORT-TERM TECHNICAL OUTLOOK – NEUTRAL

The apparent failure of Bitcoin to extend its losses in the past two weeks could be an early sign that cryptocurrencies may have run their bearish course for now.

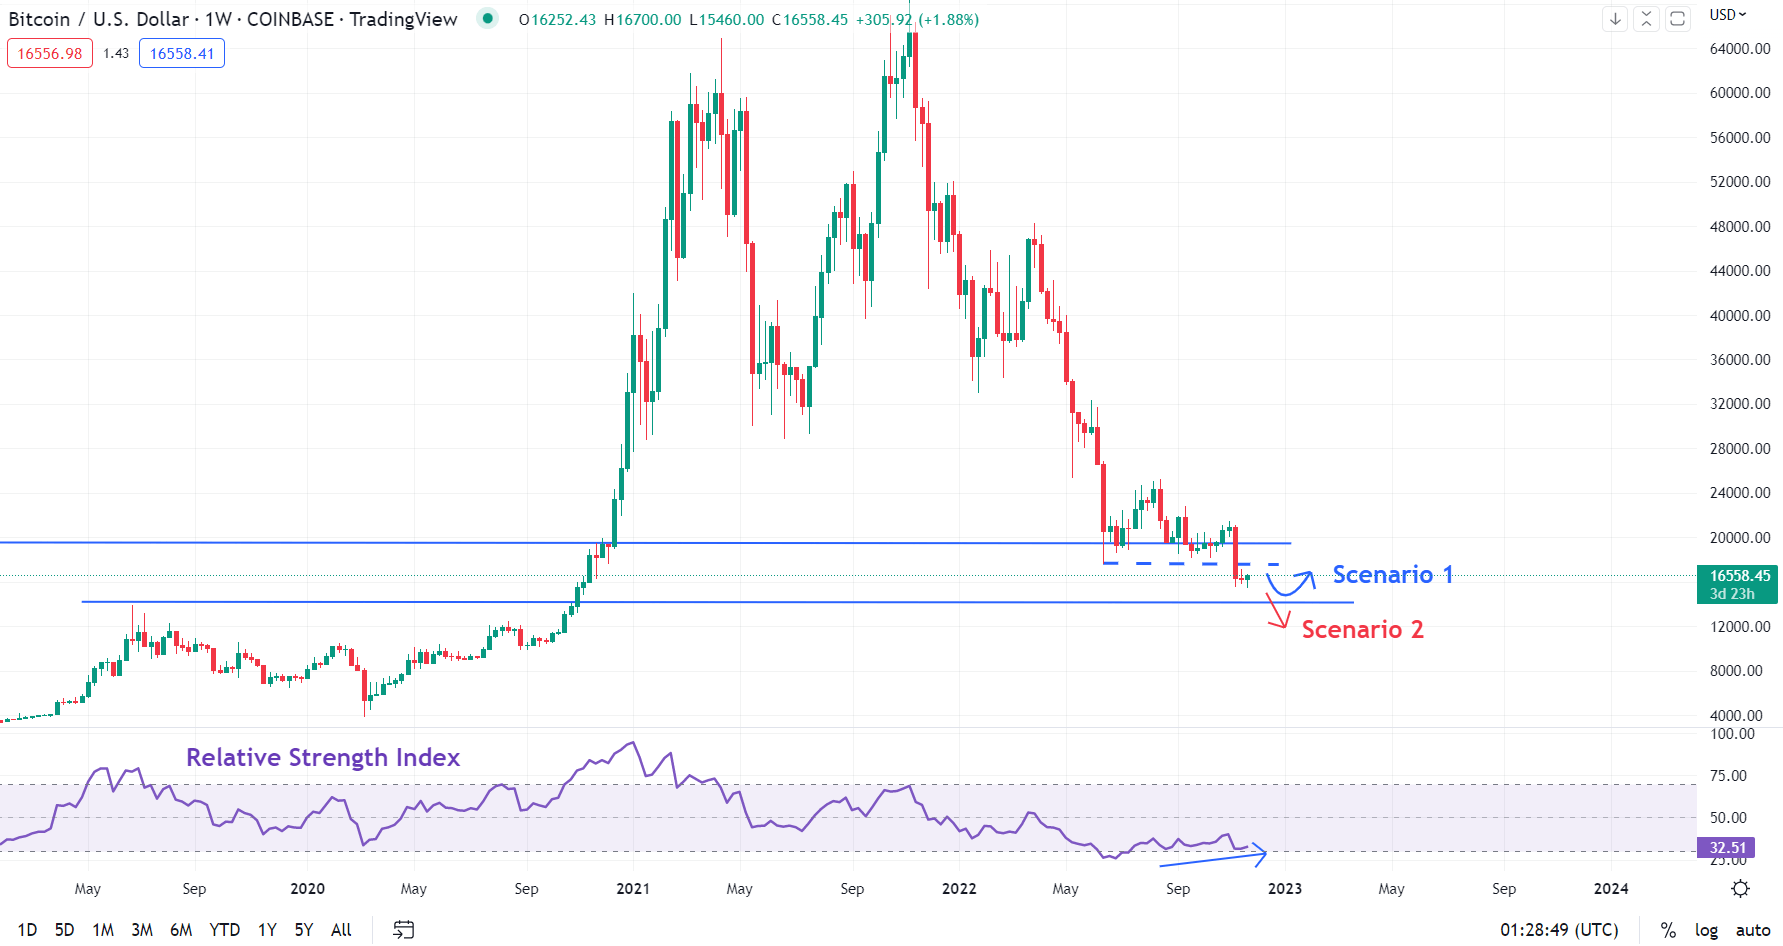
Granted, price action is still unfolding and BTC/USD could still embark on another leg lower. However, the stalling of the down move recently keeps alive the possibility that the early-November decline could be ‘capitulation’. If this were indeed the case, a base-building process in BTC/USD could be in play – a relatively high probability scenario highlighted on November 15.

BTC/USD Weekly Chart

image1.png

Momentum on the weekly chart didn’t make a new low as spot fell below its June bottom of 17590. Momentum is indicative of force, and when support levels are broken with stronger downside conviction, this generally signifies further weakness in price. The 14-week Relative Strength Index (RSI) is now above its June low, suggesting positive momentum divergence (a new low in price associated with a higher low in momentum).

BTC/USD Daily Chart

image2.png

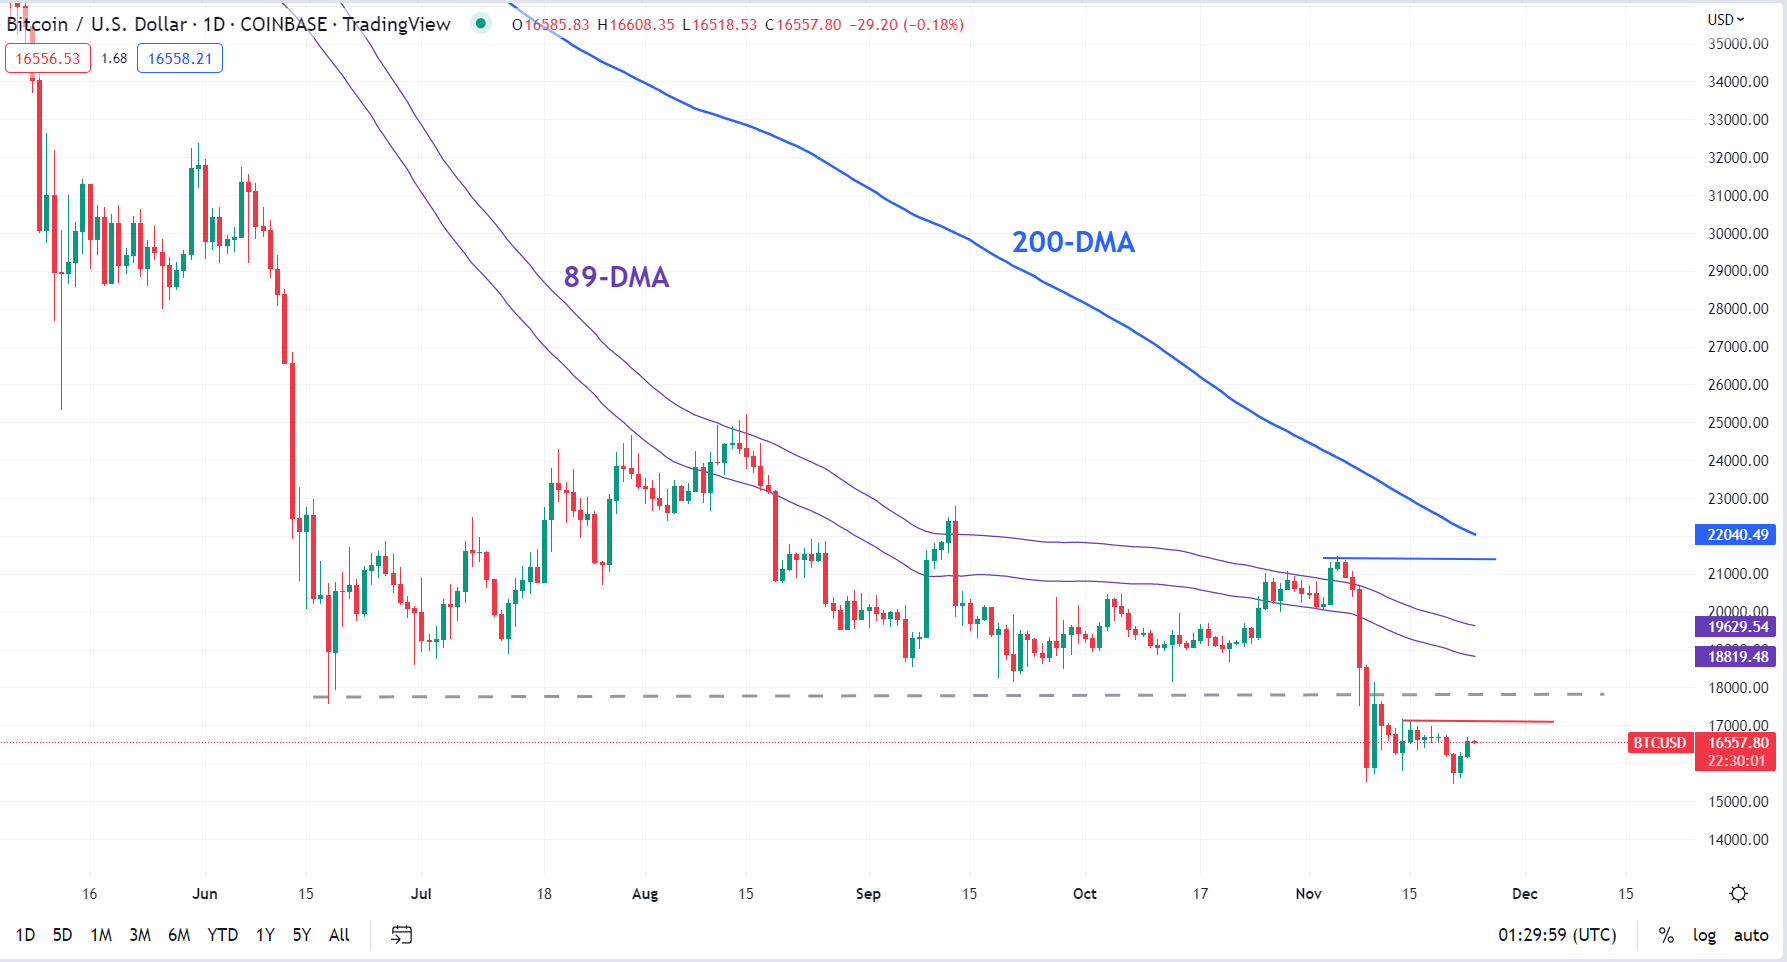
One of the signposts to watch for Scenario 1 to play out would be a break above immediate resistance at the mid-November high of 17170. Such a move would indicate that immediate downward pressure is beginning to ease. A stronger signal would be a rise above the November 10 high of 18140, which could bring into play the 5 November high of 21470, near the 200-day moving average.

The second scenario, and a relatively low probability one, would see BTC/USD extend its weakness initially toward the 2019 high of 13895, and possibly lower. A decisive break below the November 9 low of 15510 could be the first signpost to watch for the bearish scenario to unfold.

US Freight rail strike could cost US economy $1 billion in first week

A US freight rail strike could cost the US economy $1 billion in the first week of the strike, according to a new analysis from the Anderson Economic Group.

In the first three days alone, US workers and consumers could see potential losses of a quarter billion dollars as a transit strike involving rail is one of the most expensive and disruptive events that can happen to the economy.

“Economic impacts caused by a national railroad strike include lost wages for the industry’s workers and production slowdowns due to non-delivery of critical components in some vulnerable industries,” the report from Anderson Economic Group said.

Those industries could include ethanol, retail, and agriculture. The Retail Industry Leaders Association is calling on policy makers to intervene to “avoid a self-inflicted economic disaster.”

“Calculations show a first-day impact of approximately $60 million, including $30.9 million for lost freight, $3.8 million for long-term passenger rail disruption and $25 million in lost railroad industry wages,” the analysis revealed. It does not include indirect effects or losses on other industries or income losses for rail company investors and managers.

Second and third day strike losses would increase to $91 billion per day because of lost agricultural goods and food spoilage.

The four rail unions who voted down the tentative agreement with US freight railroads have set a joint strike date of December 9 if they do not reach a deal on a new contract.

Congress could impose a contract on the four unions or extend the cooling off period to avert a nationwide strike, but rail companies and the unions have been far apart on the key sticking point – the absence of paid sick time.

image1.png

Australian Dollar Soars as the US Dollar Sinks. Will AUD/USD Make a New Peak?

The Australian Dollar scampered higher overnight after the US Dollar took a beating in the wake of the Federal Reserve meeting minutes from earlier this month.

The minutes showed a willingness by some board members to step back from the jumbo 75 basis point (bp) hikes that have been seen at four consecutive meetings, including the last one.

This message has been telegraphed by several Fed speakers since that Federal Open Market Committee (FOMC) meeting. The market priced a 50 bp hike at the December gathering before and after this month’s meeting. It continues to do so now.

The market appears to have interpreted the meeting minutes as somewhat dovish despite very little new information emanating from them.

Nonetheless, equities went north while Treasury yields sailed south along with the US Dollar. Metal commodities generally got a boost, and this has given the Aussie Dollar an extra tailwind.

At the same time, crude oil has taken a hit and the Canadian Dollar is noticeably lower. The weakness in the Loonie was compounded by comments from Bank of Canada Governor Tiff Macklem.

This remark seemed to gain most attention: “The tightening phase will come to an end, and we are getting closer, but we are not there yet.”

That has been interpreted by the market as less hawkish than previously. As a result, AUD/CAD is approaching a two-month high above 90 cents.

Holiday conditions lie ahead today with Thanksgiving in the US and markets could be somewhat illiquid, potentially providing skittish conditions.

AUD/USD TECHNICAL ANALYSIS

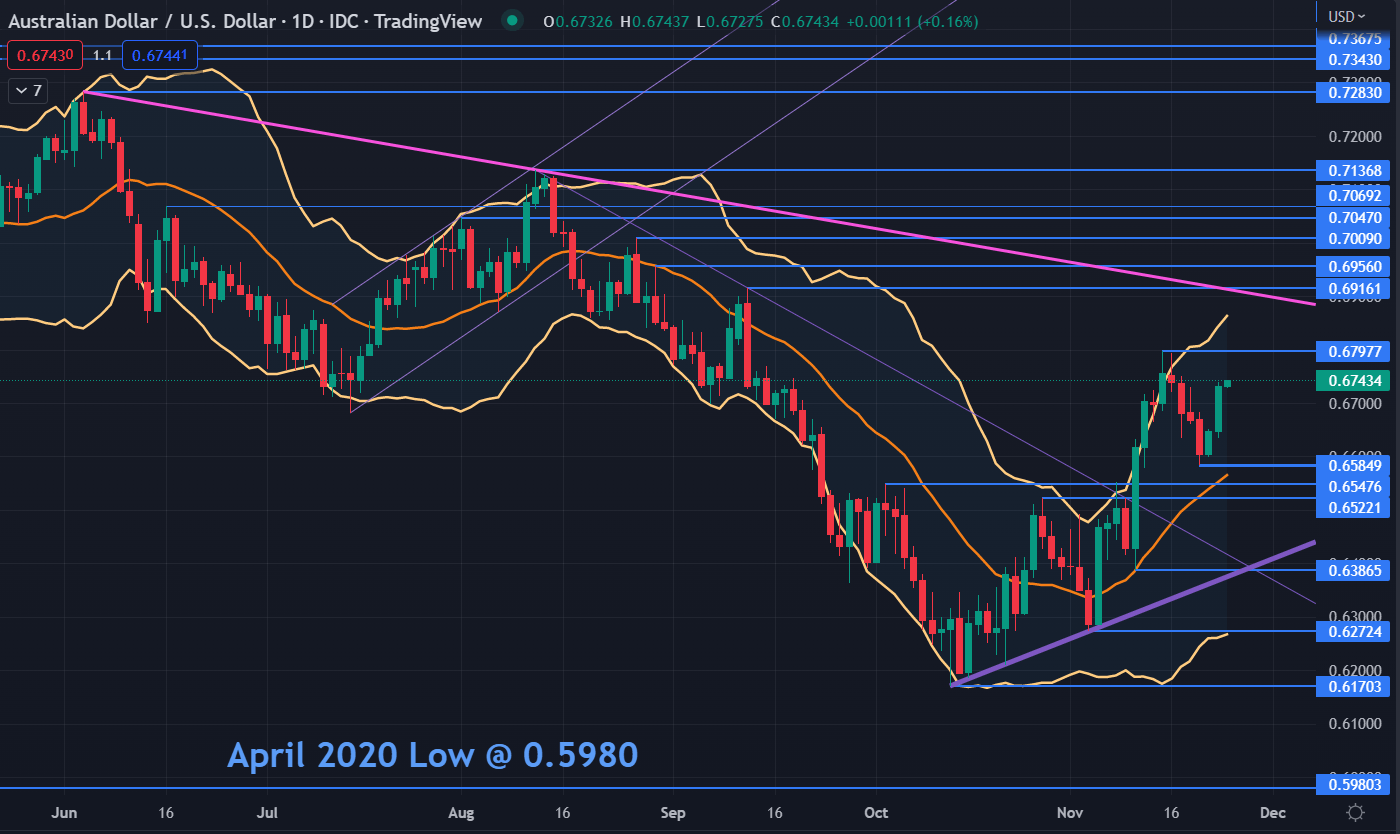
AUD/USD peaked just under 68 cents last week and on that move it broke the upper band of the 21-day simple moving average (SMA) based Bollinger Band. Once the price moved back inside the band, it slid lower before the rally over the last few days.

A move back inside the Bolling band can potentially be an indication of a pause in the bullish rally, or a potential reversal. A break above that recent high of 0.6798 might nullify that signal. There could be resistance ahead of that level.

The September high of 0.6916 currently coincides with a descending trend line and may offer resistance.

Further up, the prior high and breakpoints of 0.6956, 0.7009, 0.7047, 0.7060 and 0.7138 could also offer resistance.

On the downside, support may lie at the recent low of 0.6585 ahead of possible breakpoint support at 0.6547 and 0.6522. Below there, an ascending trend line currently dissects with the a prior low at 0.6386 and may provide support.

image1.png


French economy contracts for the first time since February 2021

France’s private sector economy contracted in November, according to the latest ‘flash’ PMI survey by S&P Global, marking the first month of decline since February 2021. Manufacturing production volumes continued to fall during November, a sixth successive month in which this has been the case, although a renewed drop in service sector activity was the principal factor behind the overall contraction. Economic activity levels were quelled by falling new business intakes during November, with survey data signalling weakening demand conditions yet again. Backlogs of work subsequently fell although.

China may have ‘passed the point of no return’ as Covid infections soar

Surging Covid infections across mainland China make it harder for the government to achieve zero-Covid without reverting to a harsh lockdown, Macquarie’s Chief China Economist Larry Hu said.

In the last few days, the daily case count has climbed to around or more than 28,000 — near levels seen in April during a stringent lockdown in Shanghai, according to CNBC calculations of Wind Information data. The figures showed the last time mainland China saw only a handful of daily infections was in June, shortly after Shanghai eased its restrictions.

The latest Covid wave has hit the southern city of Guangzhou, the capital city of Beijing and many central parts of China — prompting local officials to tighten restrictions on business and social activity this month.

“China might have already passed the point of no return, as it’s unlikely to achieve zero Covid again without another Shanghai-style hard lockdown,” Hu said in a report Tuesday. “What policymakers could do now is to slow the spread of virus, i.e. flatten the curve, by tightening the Covid controls for the time being.”

Hu pointed to slight changes this month in government policy and propaganda as signs authorities are preparing for reopening in the next six to nine months. But he noted that “the road to reopening is set to involve lots of back-and-forth.”

Markets have speculated for weeks about the timing of China’s departure from its stringent zero-Covid policy. The controls have weighed on the economy, which barely eked out growth while Shanghai was locked down and has posted growth of only 3% during the first three quarters of the year.

image1.png

Euro Breaking News: EUR on Offer Despite EZ PMI Upside Surprise

EURO FUNDAMENTAL BACKDROP

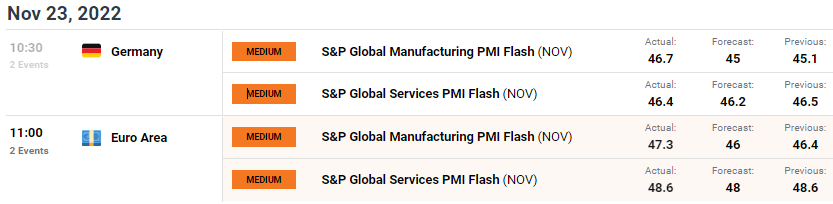
German PMI’s laid the pathway for eurozone data (see economic calendar below) which beat estimates on both services and manufacturing prints. Although the region remains in contractionary territory, the rate of decline was slower than predicted due to softer inflationary forces impacting input prices with regards to the manufacturing sector leading to moderated selling prices.

EUR/USD ECONOMIC CALENDAR

image1.png

Unfortunately for the euro, the data beat was not enough to deter the bearish sentiment around the euro including recessionary risks as well as the inability by ECB hawks to support a 75bps interest rate hike in the next meeting. The day ahead should provide more volatility for EUR/USD with U.S. data taking center stage.

TECHNICAL ANALYSIS

EUR/USD DAILY CHART

image2.png

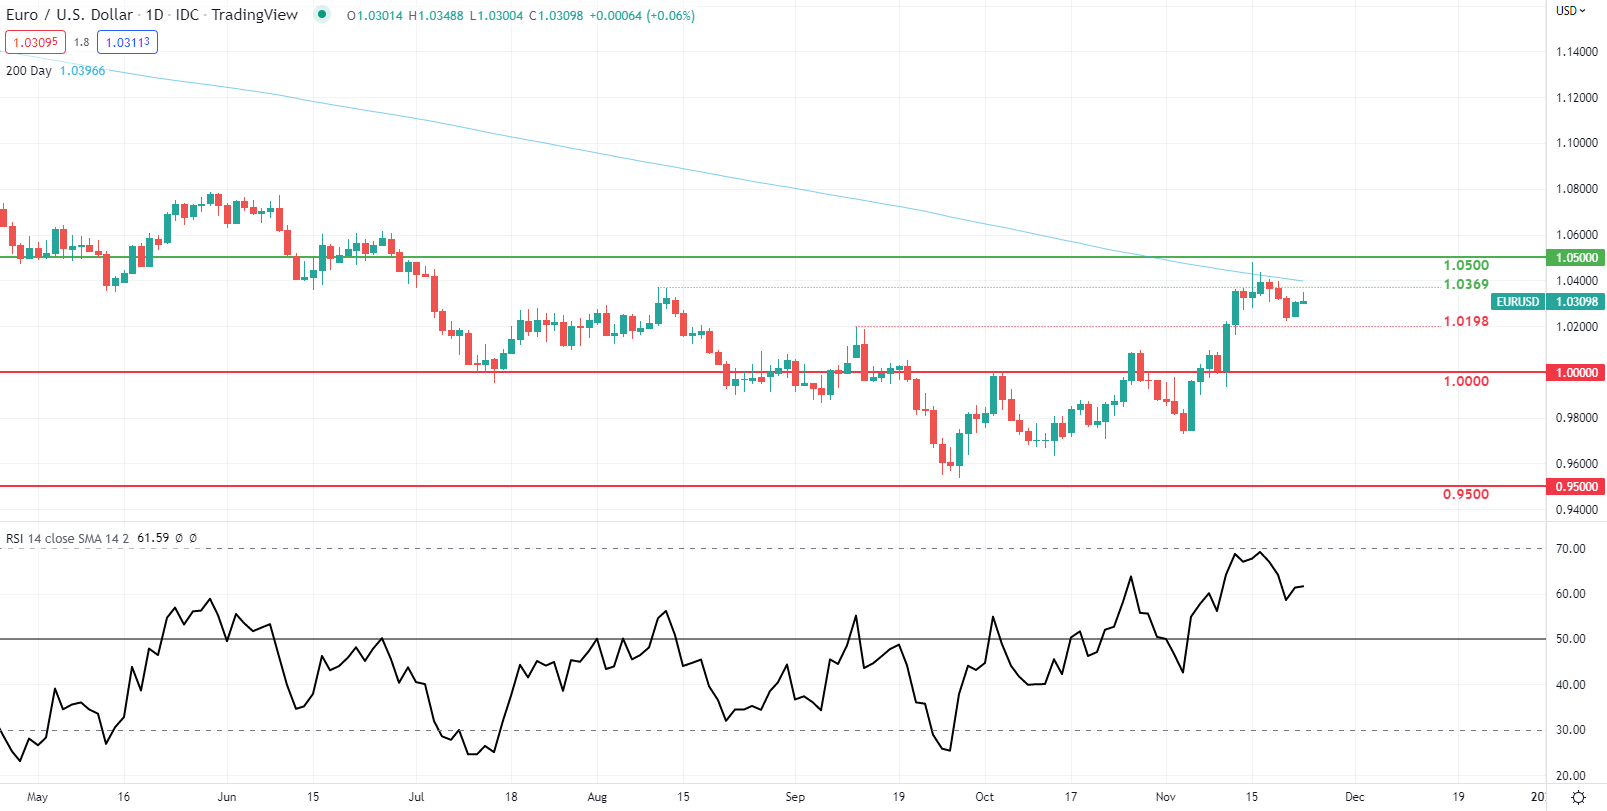
EUR/USD price action responded negatively to the aforementioned PMI data and currently resembles a long upper wick on the daily candle which could point to subsequent weakness should the candle close in this fashion.

Resistance levels:

  • 1.0500
  • 1.0369

Support levels:

  • 1.0198

US dollar holds firm but on edge ahead of Fed minutes, kiwi rises

SINGAPORE : The U.S. dollar held firm on Wednesday, with investors on tenterhooks before the release of minutes of the Federal Reserve’s latest policy meeting which could offer clues on the outlook for inflation and the pace of interest rate hikes.

The dollar index, which measures the currency against a basket of six counterparts including the yen, the euro and sterling, was last trading at 107.110, having slipped 0.65 per cent overnight.

Carol Kong, a currency strategist at Commonwealth Bank of Australia, said Tuesday’s move reflected better risk sentiment, with stocks and bonds rallying on the back of better corporate earnings and expectations of slower rate hikes from the central bank.

The kiwi rose after New Zealand’s central bank raised interest rates by 75 basis points to a near 14-year high of 4.25 per cent and said the cash rate needed to rise faster than it had previously indicated.

The New Zealand currency spiked to flirt with a three-month high of $0.6207, and was last up 0.47 per cent at $0.6173. The central bank also warned that the economy might have to spend an entire year in recession to bring inflation under control.

In China, a spike in COVID-19 cases has clouded hopes for a swift reopening of the world’s second largest economy.

Shanghai abruptly cancelled an auto industry event on Wednesday, while the city of Chengdu plans to conduct mass testing for residents for five straight days.

“The imposition of new restrictions near-term undoubtedly will have a negative economic impact, but at least for now the market seems to focus on the fact that over the medium term China is looking to gradually move towards a strategy of living with COVID,” said Rodrigo Catril, a currency strategist at National Australia Bank.

“That said, we think that setbacks are very likely in this process, thus we should expect spikes in market volatility along the way.”

The euro rose 0.11 per cent to $1.0313, after gaining 0.6 per cent overnight, while sterling was last trading at $1.1874, down 0.08 per cent on the day.

The Australian dollar fell 0.15 per cent to $0.664.

Cryptocurrencies remained volatile, with bitcoin swinging between losses and gains. It was last up 1.79 per cent at $16,477.

EUR/USD holds steady.

EUR/USD and Sub-$1.02 in the Hands of Private Sector PMIs and the Fed

It is a busy day for the EUR/USD on the economic calendar. Prelim November private sector PMIs for France, Germany, and the Eurozone will be in the spotlight.

After a quiet start to the week on the economic data front, today’s stats will give the markets further guidance on how the Eurozone economy is performing. Growth forecasts for 2023 are unimpressive, and ECB members have started talking about smaller rate hikes.

Know where EUR/USD is headed? Take advantage now with

Trading Derivatives carries a high level of risk to your capital and you should only trade with money you can afford to lose. Trading Derivatives may not be suitable for all investors, so please ensure that you fully understand the risks involved, and seek independent advice if necessary. A Product Disclosure Statement (PDS) can be obtained either from this website or on request from our offices and should be considered before entering into a transaction with us. Raw Spread accounts offer spreads from 0.0 pips with a commission charge of USD $3.50 per 100k traded. Standard account offer spreads from 1 pips with no additional commission charges. Spreads on CFD indices start at 0.4 points. The information on this site is not directed at residents in any country or jurisdiction where such distribution or use would be contrary to local law or regulation.

Weaker-than-expected numbers will pressure the EUR/USD ahead of a busy US economic calendar. Economists forecast the Eurozone Manufacturing PMI to fall from 46.4 to 46.0 and the Composite PMI to decline from 47.3 to 47.0.

However, the markets will also need to consider ECB member commentary. ECB members Luis de Guindos and Edouard Fernandez-Bollo speak today.

Recent ECB member commentary has delivered mixed signals. ECB Chief Economist Philip Lane suggested a smaller rate hike in December, while other ECB members continue to support a 75-basis point interest rate hike. On Tuesday, ECB member Robert Holzmann backed a 75-basis point hike.

EUR/USD Price Action

At the time of writing, the EUR was flat at $1.03034. A mixed start to the day saw the EUR/USD rise to an early high of $1.03049 before easing back.

EUR/USD holds steady.
EURUSD 231122 Daily Chart

Technical Indicators

The EUR/USD needs to avoid the $1.0283 pivot to target the First Major Resistance Level (R1) at $1.0328. ECB member chatter needs to be hawkish, and the private sector PMIs need to beat forecasts to support a breakout session.

In the case of an extended rally, the bulls will likely test the Second Major Resistance Level (R2) at $1.0353 and resistance at $1.04. The Third Major Resistance Level (R3) sits at $1.0423.

A fall through the pivot would bring the First Major Support Level (S1) at $1.0258 into play. However, barring another sell-off, the EUR/USD pair should avoid sub-$1.020. The Second Major Support Level (S2) at $1.0213 should limit the downside. Dovish ECB and hawkish Fed chatter could deliver another sharp pullback.

The third Major Support Level (S3) sits at $1.0143.

EUR/USD resistance levels in play above the pivot.
EURUSD 231122 Hourly ChartLooking at the EMAs and the 4-hourly chart, the EMAs send a bullish signal. The EUR/USD sits above the 50-day EMA ($1.02665). The 50-day EMA widened from the 100-day EMA, with the 100-day EMA pulling away from the 200-day EMA, delivering bullish signals.

A hold above the 50-day EMA ($1.02665) would support a breakout from R1 ($1.0328) to target R2 ($1.0353) and $1.04. However, a fall through the 50-day EMA ($1.02665) would bring sub-$1.02 into play. The 200-day EMA sits at $1.00676.

EMAs remain bullish.
EURUSD 231122 4 Hourly Chart

The US Session

It is a busy day ahead on the US economic calendar. Prelim November private sector PMIs, consumer sentiment, jobless claims, and core durable goods will be in focus. Barring a spike in jobless claims, expect the services PMI and consumer sentiment to have the most impact on the dollar.

Late in the session, the FOMC meeting minutes will also draw attention. FOMC members have delivered mixed signals, leaving the markets uncertain about the December move. While the minutes will provide some guidance, the latest stats continue supporting another 75-basis point rate hike.

Today’s economic indicators and FOMC member chatter could provide more clarity. According to the FedWatch Tool, the probability of a December 75-basis point rate hike stood at 24.2% this morning.