Tokyo Inflation Hits Fastest Pace Since 1982 as Food Prices Soar

Tokyo’s inflation outpaced forecasts to hit its fastest clip since 1982, an acceleration that suggests nationwide price growth will also quicken in November after months of yen weakness and elevated energy costs.

Consumer prices excluding fresh food rose 3.6% in the capital in November, with the faster pace driven by further gains in processed food prices, according to the ministry of internal affairs Friday. The reading was the highest since April 1982 and stronger than a 3.5% forecast by analysts.

The continued acceleration in core inflation challenges Bank of Japan Governor Haruhiko Kuroda’s view that the current cost-push inflation is only temporary and that continued stimulus is required to ensure price growth becomes sustainable.

With gains in energy costs likely to ease as ramped-up government subsidies come into effect in the coming months, economists largely agree with Kuroda that Japan’s inflation will soften, though views differ over the extent.

That means the BOJ is likely to stick with its rock-bottom interest rates during the remainder of Kuroda’s term. Market speculation is largely focused on what will happen after the governor departs in April.

“Given what the BOJ has said and its current inflation forecasts, I don’t think monetary policy will change in fiscal 2022,” said SMBC Nikko Securities chief economist Yoshimasa Maruyama. “But if the new governor is pressured by the government over the weak yen, the BOJ could still move on policy” in fiscal 2023.

The Tokyo figures showed processed food prices rose 6.7% in November, contributing about 1.4 percentage point to overall inflation and outstripping the impact of energy. Much of that food including raw materials is imported and therefore directly impacted by the yen’s weakness.

Some 833 food items including dairy products saw price increases in November, according to a Teikoku Databank survey. The report also forecast that Japan will be hit by another wave of price hikes in February or March next year, with the costs of another 2,000 items expected to go up.

Real wages have been declining since April, adding to factors eating into consumers’ purchasing power and contributing to BOJ fears that a premature increase in interest rates could upend the economy.

To cushion the blow to consumption from rising prices, Prime Minister Fumio Kishida put together an economic stimulus package last month, partially funded by an extra budget worth 29.1 trillion yen ($210 billion).

What Bloomberg Economics Says…

“Looking ahead, we see core inflation hovering around 3.4% in 4Q and then slowing quickly in 1Q23. The weak yen should continue to buoy prices of processed foods and other imports. But subsidies to support discounts on electricity and gas bills starting in January could reduce core CPI inflation by as much as 0.8 percentage point in 1Q.”

US Dollar headed for weekly loss as investors brace for slower Fed hikes

SINGAPORE, Nov 25 (Reuters) – The dollar stood close to a three-month low and was on track for a weekly loss on Friday, as the prospect of the Federal Reserve slowing monetary policy tightening as soon as December dominated investors’ minds and kept the mood buoyant.

Trading was thin overnight due to the Thanksgiving holiday in the United States, though most currencies extended their gains against a softer greenback before paring them slightly in early Asia trade.

Sterling GBP=D3 rose more than 0.5% overnight and last stood at $1.21125, close to its over three-month high of $1.2153 hit in the previous session and on track for a nearly 2% weekly gain.

The Japanese yen JPY=EBS jumped roughly 0.7% overnight, and last bought 138.60 per dollar.

Minutes from the Fed’s November meeting released earlier this week showed that a “substantial majority” of policymakers agreed it would “likely soon be appropriate” to slow the pace of interest rate hikes — remarks that sent the greenback tumbling.

The Fed’s aggressive interest rate hikes and market expectations of how high the central bank could take them has been a huge driver of the dollar’s =USD 10% surge this year.

Against a basket of currencies, the U.S. dollar index =USD stood at 105.94, testing its three-month trough of 105.30 hit last week. It was headed for a weekly loss of nearly 1%.

Also aiding risk sentiment slightly was a survey that showed that German business morale rose further than expected in November.

European Central Bank (ECB) policymakers fear that inflation may be getting entrenched in the euro zone, accounts of its October meeting showed overnight. However, markets are now expecting a more modest, 50 bp move at the December meeting.

“We have the euro zone inflation numbers next week, so I think they are going to be a big test of market pricing … were we to get another upside surprise on that, then I think that would bring 75 bp back on the agenda,” said Attrill.

The Aussie AUD=D3 fell 0.17% to $0.6753, after rising more than 0.4% overnight. The kiwi NZD=D3 slid 0.19% to $0.6252, but that was not far off its three-month peak hit in the previous session.

The New Zealand dollar was headed for a weekly gain of more than 1.5%, aided by the Reserve Bank of New Zealand’s 75 bp rate hike earlier in the week and its hawkish rate outlook.

Over in China, markets were also closely watching an impending cut in banks’ reserve requirement ratio (RRR).

China will use timely cuts in banks’ RRR, alongside other monetary policy tools, to keep liquidity reasonably ample, state media quoted a cabinet meeting as saying.

“We believe it’s likely the PBoC (People’s Bank of China) may cut RRR by 25 bp for most banks in the next couple of weeks (or even days),” said analysts at Nomura.

“That being said, the RRR is likely to only have a limited positive impact, as we believe the real hurdle for the economy lies in local officials’ more zealous implementation of Covid restrictions rather than insufficient loanable funds.”

The Chinese offshore yuan CNH=D3 was last 0.1% lower at 7.1759 per dollar.

image1.png

New Zealand Dollar Technical Outlook: Rally Could Stall

NZD/USD SHORT-TERM TECHNICAL FORECAST – NEUTRAL

After a spectacular six-week rally, the New Zealand dollar appears set to shed some of its recent gains against the US dollar.

NZD/USD, up 14% since mid-October, is now testing solid resistance on the 200-day moving average –a possibility highlighted in the previous update. In addition to the long-term moving average, there is a resistance on a downtrend line from June and a slightly upward sloping trendline from July.

NZD/USD Daily Chart

image1.png

While there is no sign of reversal of the uptrend yet, even on intraday charts, negative momentum divergence on the daily and intraday charts (rising price associated with declining or stalling of momentum) indicates that the rally is showing signs of fatigue.

If history is any guide, a retreat would not be surprising. The rallies in late 2021 and early 2022 ran out of steam at the long-term moving average. The pullback in NZD/USD was preceded by a negative momentum divergence, similar to the current divergence.

NZD/USD 240-minutes Chart

image2.png

Any retreat could open the way toward last week’s high of 0.6205. Any break below would confirm that the upward pressure had eased, opening the way toward a key cushion at the November 17 low of 0.6060. This support is fairly strong and would be tough to crack, at least on the first attempt. Indeed, the floor could provide a platform for a retest of Thursday’s high of 0.6290.

NZD/USD Weekly Chart

image3.png

Looking beyond the short term, NZD/USD last month held major support at the 2020 low of 0.5465. The rally since setting a 31-month low has been convincing, raising the prospect that an interim low is in place.

Black Friday: Cost of living crisis may hit UK sales rush

The cost of living crisis may dampen this year’s Black Friday sales rush, retail experts have predicted.

This is the first festive season without Covid rules in place in three years, so the number of people hitting the shops is expected to be up on 2021.

But purse strings will be tighter as prices are rising at their fastest rate in 41 years.

Experts have said sales and profits are expected to be lower compared with 2021 as a result.

Retail expert Richard Lim told the BBC he was expecting Black Friday to be a more “muted affair” with sales down on last year.

“Inevitably, I think what we’re going to see is consumers being much more careful with their spending,” he said.

Although it is one of the busiest days in the retail calendar, this year Black Friday has to compete with football World Cup matches – including England v USA and Wales v Iran.

Overall, footfall at shops around the UK is still expected to be below pre-pandemic levels, retail experts at Springboard said.

For many, it will be the first chance to see High Streets and shopping centres lit up for Christmas as many stayed away during lockdowns, said Springboard’s marketing and insights director, Diane Wehrle.

But she also warned that those shoppers would be looking for a hard bargain. “People will be trying to outpace the 11.1% inflation rate,” she said.

Louise, 40, from Suffolk, said she would not be rushing out for this year’s Black Friday sales.

“I use price trackers and can see that some things I want are cheaper in advance, about four to six weeks ahead of the sales, so I do my Christmas shopping around then,” she said.

She said all of her household bills were going up. Now shopping feels like a luxury, when she feels like she should be saving.

Black Friday has morphed from its former one-day shopping frenzy of a decade ago, to offers stretched over the week. Consumer group Which? found that many of the discounts found on Black Friday in 2021 could be found at other times of the year too.

Amazon said it was offering savings during the festive season as well as throughout the year.

“We are acutely aware of the cost pressures customers are facing at the moment,” said John Boumphrey, UK Country Manager for Amazon.

Richard Lim said that rising costs and interest rates were squeezing not just low-income households, “but the crisis is spreading to the middle classes as well”.

Ed Connolly, chief commercial officer at Currys, said more people were paying for electrical goods by credit compared with last year.

People “are looking for ways to spread cost over a longer period of time,” he told the BBC’s Today programme.

“When you put that together with some of the other shopping behaviours we’re seeing, the types of products that people are buying – such as energy efficient products being significantly on the rise – I think you can draw from that that customers are worried about their finances and more concerned perhaps about their future finances than they were this time last year.”

Andy Mulcahy, an analyst at IMRG, analysed figures for the first week of November, when many major retailers launched their Black Friday deals online, to see if they would give a clue on retail’s performance on Friday.

But he said: “Electronics, where retailers focused heavily on TVs for watching the World Cup, were still down -9.4%, against -14% for the same week in 2021, so that feels like a disappointing response from shoppers.”

Meanwhile, brand consultant Ello Group – which is behind some customer loyalty schemes including Tastecard for restaurants – surveyed 1,000 people and one-third said they could not afford to shop this Black Friday, with 25 to 34-year-olds struggling the most.

Ello’s Michael Kalli said that with costs rising rapidly, people’s shopping priorities are now “moving from treats to necessities.”


A Price Action Tell: Support at Prior Resistance, Resistance at Prior Support

As we talked about in our introduction to price action, markets are cyclical creatures. Prices go up, prices go down and as traders, the most we can hope to do is ride on the right side of the wave for a bit.

But along the way there’s a number of deductions that traders can make that can allow for strategy to enter the picture, and in terms of trend, support and resistance is fairly important. Bullish trends will often price-in a series of higher-highs and higher-lows while bearish trends will show the opposite. But – markets aren’t always trending, as we’ll often see ranges or digestion pop-up when prices are fairly equalized. That’s what brings on inside bars and we’ll talk about those a little later in this sub-module.

Price Action Support and Resistance

As discussed throughout our education section, there’s a plethora of ways to find support and resistance levels. Fibonacci is a popular tool and psychological levels can carry some significant weight. But, if markets don’t acknowledge that support or resistance – what is its point? There isn’t one, right? The only utility for support and resistance is the ability to highlight something that may happen, while allowing the trader to adopt an objective framework for their own activity within a market.

As we looked at in our Price Action Support and Resistance article, there’s a couple of primary ways to use prior price action to find actionable levels to work with. But we also ended by saying that there’s one more way that traders can incorporate prior price movements in the effort of finding support and resistance, and that’s by incorporating older levels that may come back into the picture.

Support and Old or Prior Resistance

When in an up-trend, prices will often ebb and flow with a general bias towards the ebbing as opposed to the flowing. And when prices do pullback, traders are often looking for that point with which it becomes attractive again to buy. One possible reference point – prior swing-highs or prior points of resistance. And, in the case of down-trends, prior swing-lows or points of support as potential resistance. Let’s look at an example in GBP/USD to illustrate.

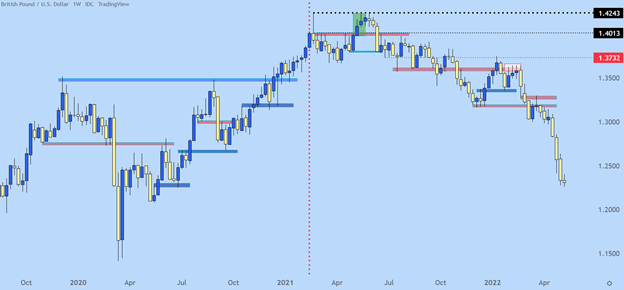
Each of the blue lines below indicate an area of prior resistance that came into play as support. And red lines indicate an area of support that’s come into the picture as resistance.

GBP/USD Weekly Price Chart

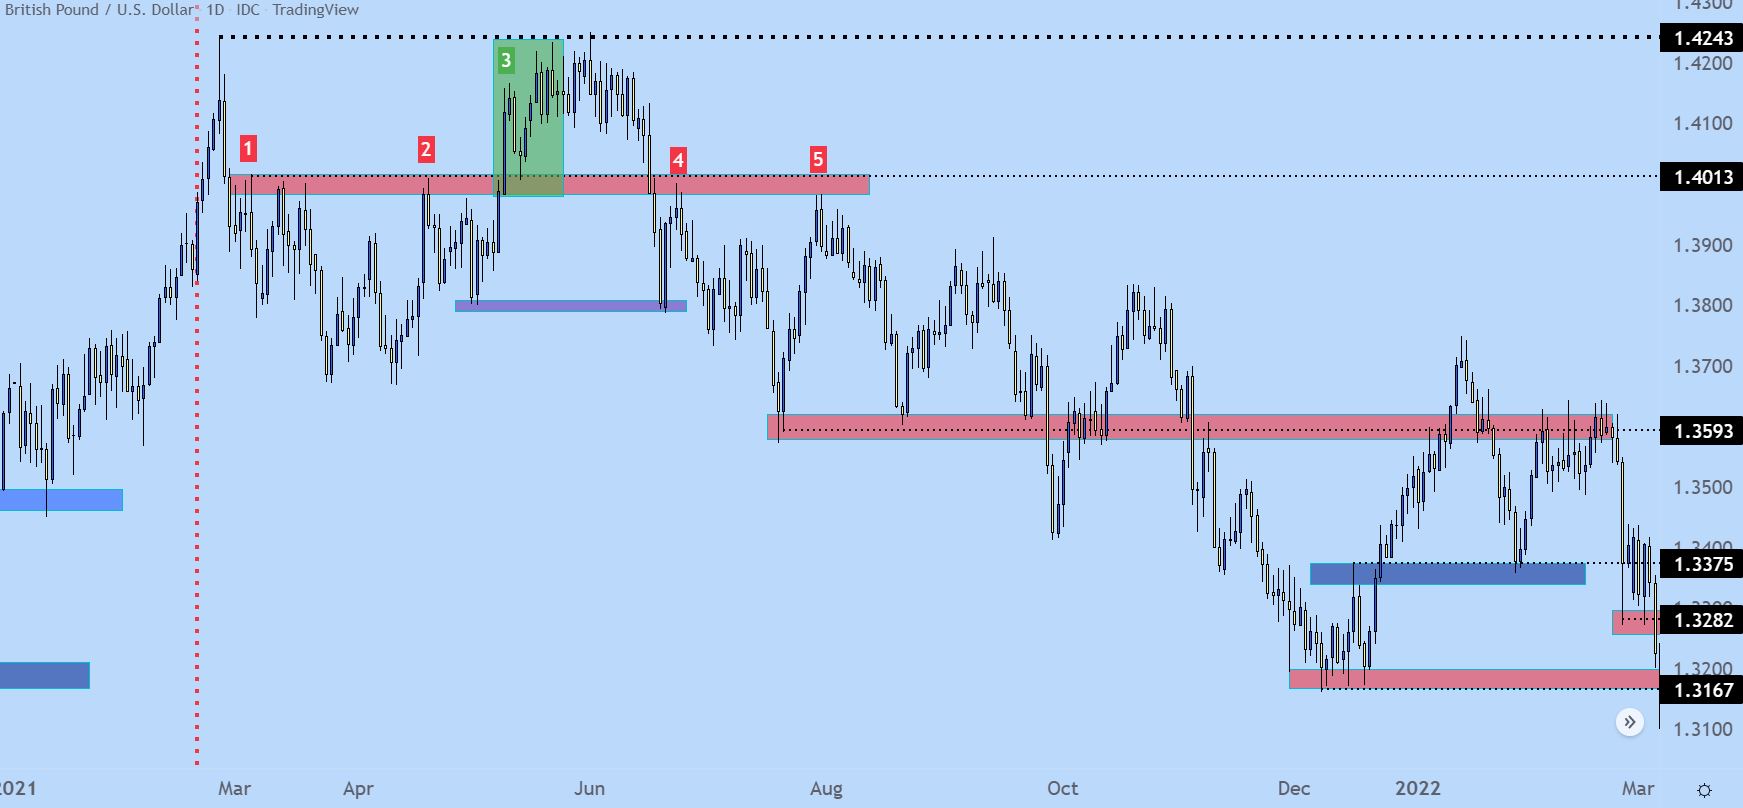
Let’s get a bit more granular with this situation, using the below chart. We’ll begin with the red vertical line, after which price action puts in a swing at the 1.4013 level (marked as ‘1’ on the below chart). You can see multiple wicks on the daily chart in the red box accompanying that line, and this is highlighting a resistance reaction that holds from early-March through the May open (marked as ‘2). That resistance offered a few different inflections but buyers eventually break through, indicated by the green box in early-May (marked as ‘3’).

But, buyers are thwarted at the same exact level that had come into play a few months earlier, plotted at 1.4243, and after bulls failed to breakthrough, sellers eventually take control and elicit a breakdown back-below the 1.4013 price. Buyers push down to the purple box, around 1.3800, before a bounce develops and that sends prices right back into that same zone of resistance (marked as ‘4’).

That inflection leads to another fresh low, around the 1.3600 area, but sellers still don’t have full control, as price pushes back up to that same resistance zone but fails to get all the way there. This is a lower-high, and indication that sellers were on the sidelines and unwilling to wait for price to test the high. They enter a bit earlier, and this leads to a lower high before sellers swing a bit more aggressively (marked as ‘5’).

GBP/USD Daily Price Chart (2021 – Feb 2022)

After that second resistance reaction (marked by ‘5’ above), sellers push price right back to support, which isn’t ready to give way yet. That happens a couple of months later.

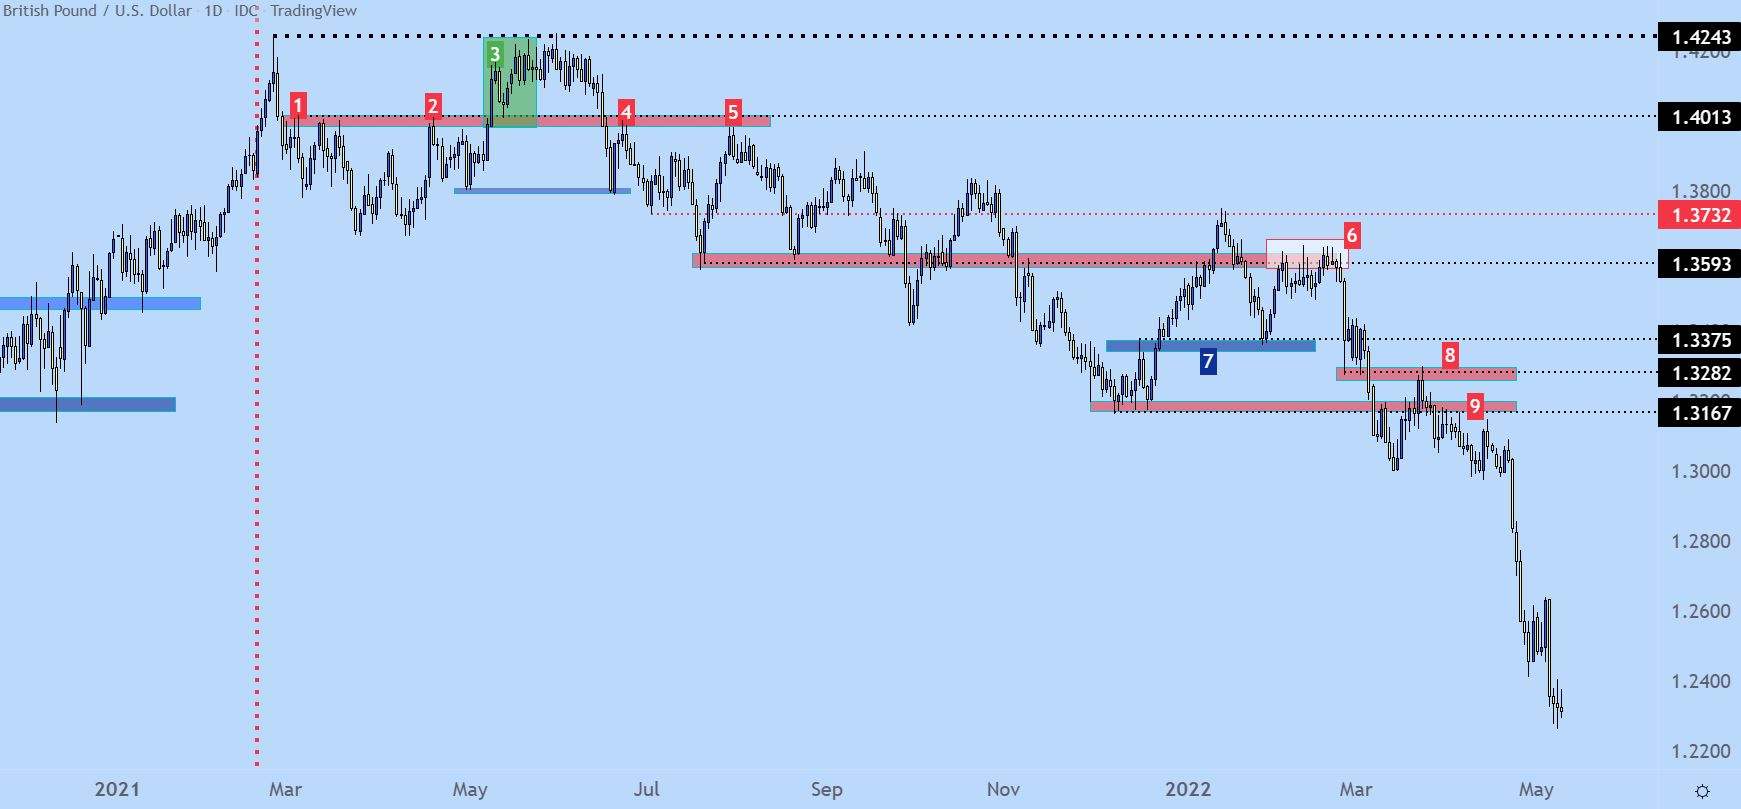
But, perhaps more importantly, in early 2022 trade, that same zone around the 1.3600 handle becomes a massive spot of resistance. This gyration has now taken six months but there’s still a discernible bearish bias as indicated by the lower-highs. But, notably, notice how intense the resistance reaction is in the white box on the right side of the chart (marked as ‘6’). This took almost three weeks to resolve but, once it did, prices started a sell-off that ran for a long time. Along the way there were more items of short-term resistance coming in as support (marked as ‘7’) and prior items of support coming in as resistance (marked as ‘8’). In box 9, I wanted to highlight the build of lower-highs, below box 8 as that prior swing was continuing to help form some resistance.

GBP/USD Daily Price Chart (2021 – May 2022)

trading the range with support and resistance

Supply and Demand vs Support and Resistance

How to use support and resistance to trade supply and demand

Trading Supply and Demand

The first thing traders need to do before placing a trade based on supply and demand is to decide whether the environment is expected to stay the same or to rapidly change. This can be assessed by market volatility measures such as significant political strife or economic news. This is the dichotomy between the decision to trade for a range or trade for a breakout.

Trading the Range

When trading a range, traders are anticipating the environment to stay about the same; with support or resistance standing its ground allowing for traders to ‘buy low,’ and ‘sell high’. The chart below illustrates how a trader can use price alone to identify those points in the market at which demand begins to outstrip supply (creating increased prices) or supply begins to overrun demand (creating decreased prices).

Trading the range with a GBP/USD chart

trading the range with support and resistance

Trading the Breakout

The other side of the coin is the trader that is expecting the environment to change, with breaks of support or resistance to create new highs or new lows.

With this style, the trader’s objective changes from the range-bound condition. The goal is now to ‘buy high, and sell back at a higher price,’ or to ‘sell low and buy back to cover at a lower price.’

Trading the breakout with a EUR/USD chart

trading the breakout with supply and demand

Since these environments can be considerably more chaotic than what might be expected in ‘ranging’ markets, traders are usually best served by altering the risk management condition to account for the increased risk of trading in a rapid market. For more information, read our guide to forex risk management techniques.

GBP/USD Price Analysis: Establishment above 1.2000 is a prerequisite for further upside

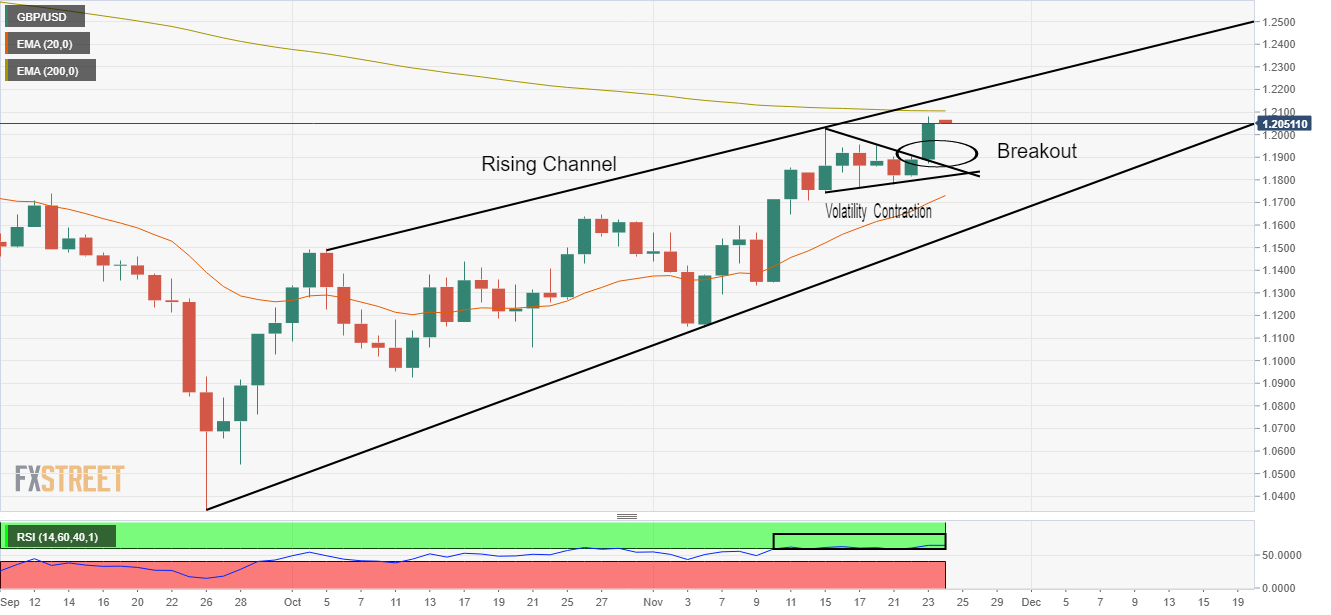
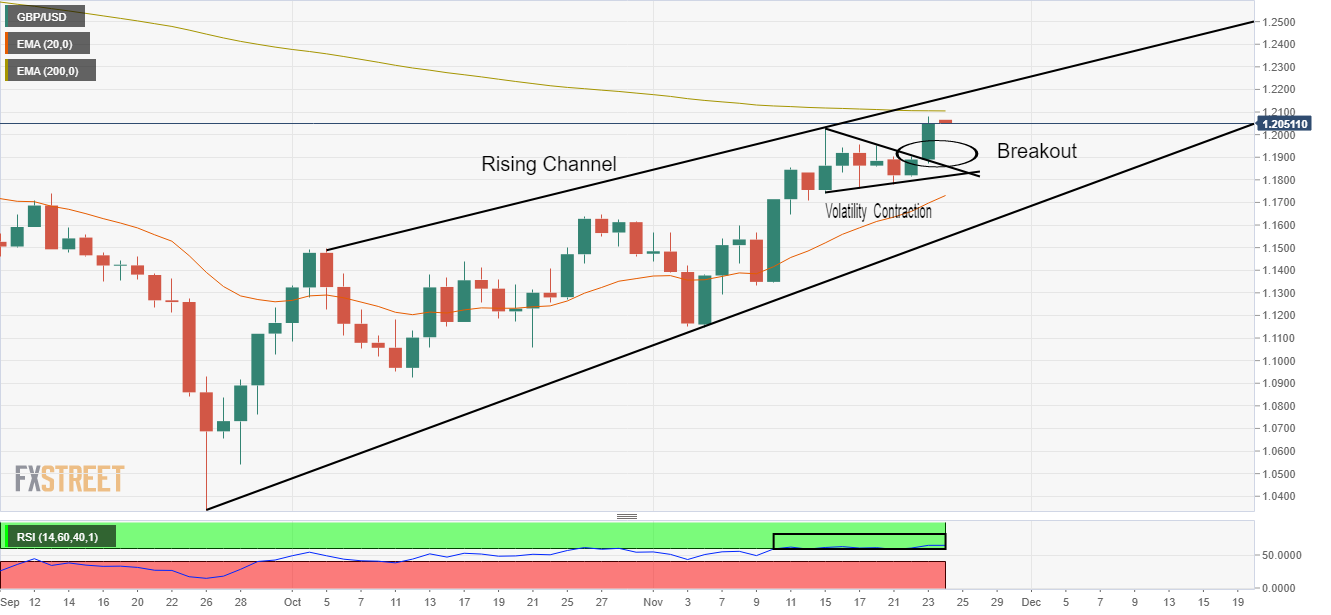
The GBP/USD pair is displaying a sideways performance in the early Tokyo session after a juggernaut rally to near 1.2080. The Cable witnessed an immense buying interest after sustaining above the round-level resistance of 1.1900. A significant improvement in investors’ risk appetite strengthened the Pound Sterling.

Meanwhile, the US dollar index (DXY) has dropped 106.00 despite a firmer jump in the US Durable Goods Order data. It seems that less-hawkish cues on interest rate guidance from the Federal Open Market Committee (Fed) minutes have impacted the US Dollar. Investors should know that US markets are closed today on account of Thanksgiving Day.

On a daily scale, the Cable has delivered a breakout of a Volatility Contraction Pattern (VCP) that results in the formation of wider ticks and heavy volume. Broadly, a Rising Channel formation satisfies the condition of a long-term upside trend. Also, advancing the 20-period Exponential Moving Average (EMA) at 1.1738 adds to the upside filters.

Adding to that, the Relative Strength Index (RSI) (14) has shifted into the bullish range of 60.00-80.00, which indicates that the upside momentum is active.

Going forward, the mighty 200-period EMA at 1.2110 could be a hurdle for the Pound Sterling bulls.

For further upside, the asset is required to establish firmly above the psychological resistance of 1.2000. But for a run-up, the Cable is needed to overstep the 200-EMA at 1.2110 firmly, which will drive GBP/USD towards the round-level resistance of 1.2200, followed by August 2 high at 1.2280.

On the flip side, a drop below Monday’s low at 1.1780 will drag the asset toward November 14 low at 1.1710. A slippage below November 14 low will expose the asset to the horizontal support plotted from October 27 high at 1.1646.

GBP/USD daily chart

GBP/USD

image1.png

Gold and Silver Technical Outlook: Range Play

GOLD SHORT-TERM TECHNICAL OUTLOOK – NEUTRAL

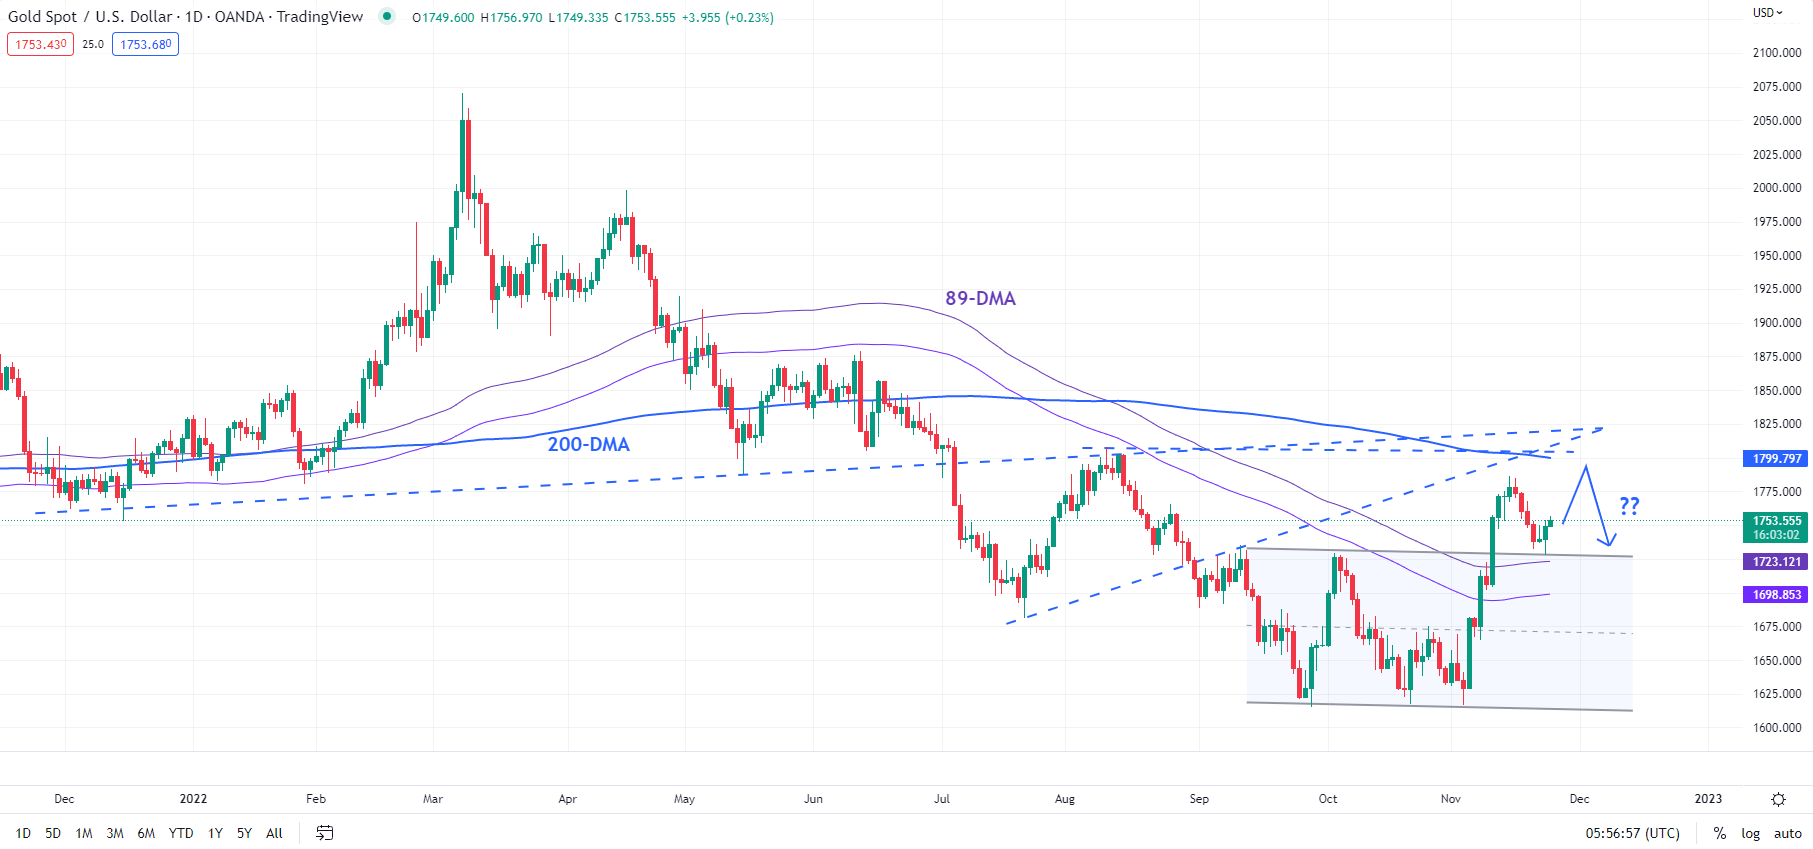
The limited retreat this week and still-buoyant momentum suggest that gold could make one more attempt to test key resistance that has been held so far this month.

Last week, XAU/USD turned lower from near a key barrier,a bit earlier than anticipated. The converged ceiling is at 1800-1820, which includes the 200-day moving average and at least three trendline resistances – one from the end of 2021, another from July, and the third from August.

XAU/USD Daily Chart

image1.png

This follows a break earlier in the month above a key ceiling at the October high of 1729, confirming that downward pressure has faded for now. It is the first time since April that the yellow metal has crossed above an important pivot/price high.

Despite the recent retreat, gold has held a vital cushion – the resistance-turned-support at 1729, roughly around the 38.2% retracement of the November 3-15 rise. Given that the Moving Average Convergence Divergence (MACD) indicator is comfortably in positive territory (indicating that the trend is up), a retest of 1800-1820 can’t be ruled out.

While short-term dynamics point to a ranging scenario, it remains unclear if the rebound this month is a precursor to a reversal (of the downtrend) or a corrective rally given the steep losses this year. In the context of a multi-week picture, the trend remains down.

SILVER SHORT-TERM TECHNICAL OUTLOOK – NEUTRAL

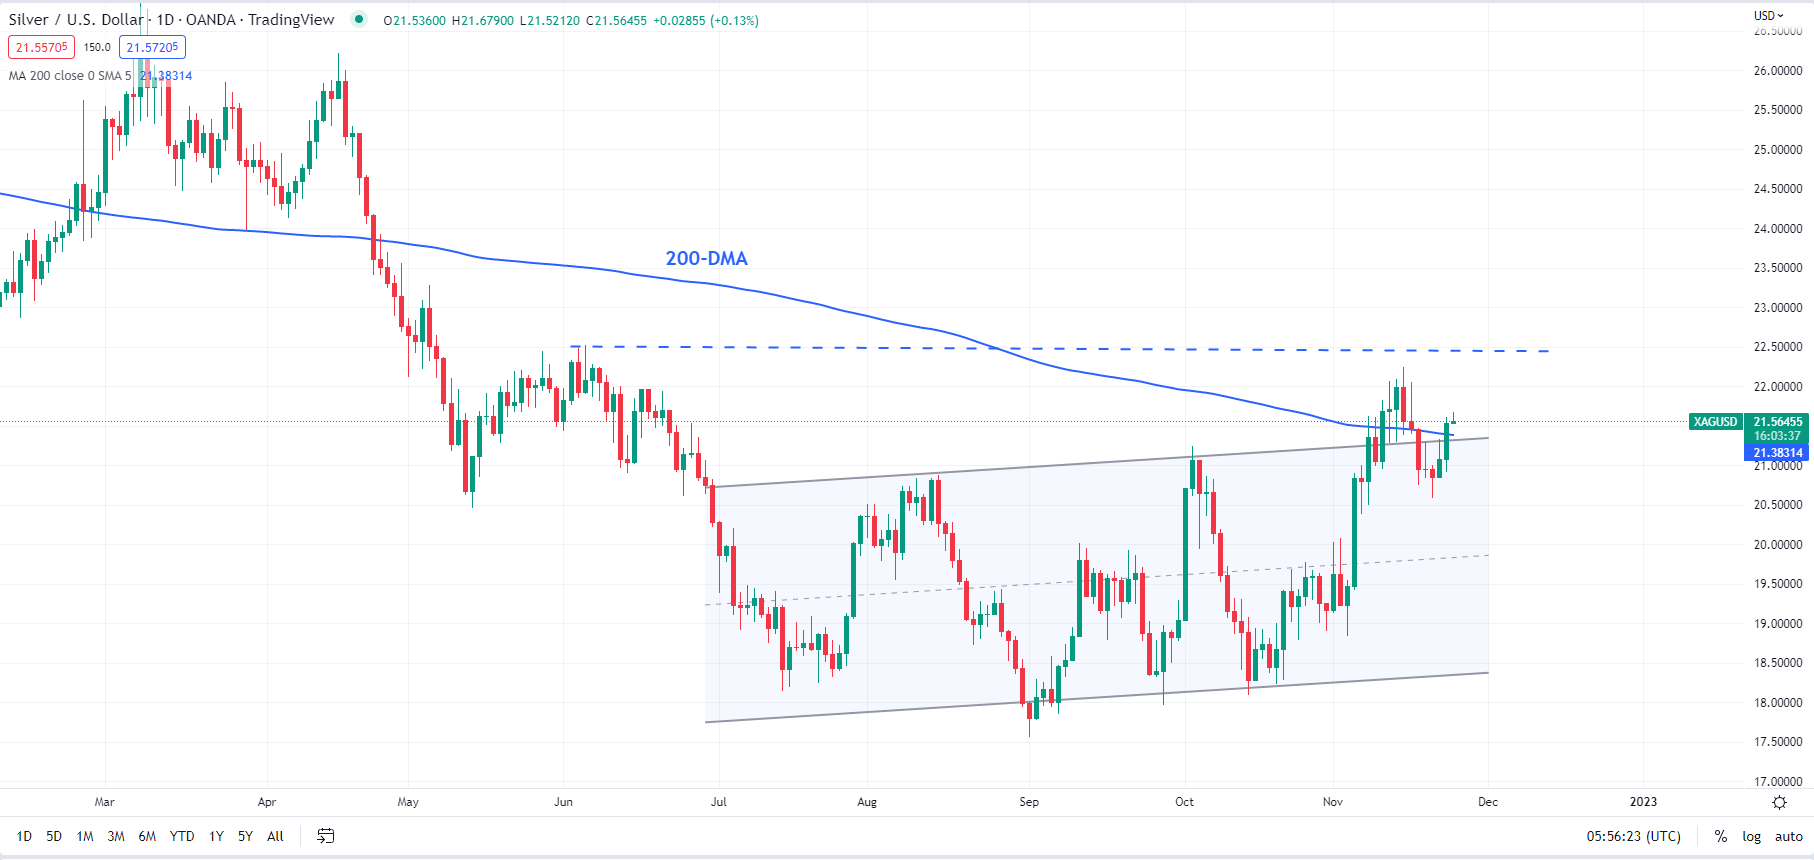
While gold has managed to stay under the 200-day moving average, its peer silver briefly rose above the long-term average but failed to stay there. The bearish reversal on November 15, highlighted in last week’s update, has kept a lid on the precious metal.

XAG/USD Daily Chart

image2.png

The long-term average in XAG/USD is roughly around another hurdle at the top edge of a slightly upward-sloping channel from August, but slightly below the June high of 22.50. This barrier is critical for the short-term outlook. A decisive break above it could clear the path for further gains in XAG/USD.

On the downside, a cross below Monday’s low of 20.55 would reaffirm the range bias in the near term.

Nigeria hopes new currency notes curb inflation, corruption

Nigeria on Wednesday launched newly designed currency notes, a move that the West African nation’s central bank says will help curb inflation and money laundering.

The newly designed denominations of 200 (5 U.S. cents), 500 ($1.10) and 1,000 naira ($2.20) also would drive financial inclusion and economic growth, said Godwin Emefiele, governor of the Central Bank of Nigeria.

Experts, however, are skeptical about such results in a country that has battled chronic corruption for decades, with government officials known to loot public funds that has caused more hardship for the many struggling with poverty.

Nigeria’s currency has not been redesigned in 19 years, and the new initiative is the latest introduced by policymakers in Africa’s biggest economy in their quest for a cashless and more inclusive economy.

The naira is “long overdue for a new look,” Nigerian President Muhammadu Buhari said at the launch. The new paper notes designed in Nigeria and featuring enhanced security “will help the central bank to design and implement better monetary policy objectives.”

More than 80% of the 3.2 trillion naira ($7.2 billion) in circulation in Nigeria are outside the vaults of commercial banks and in private hands, Emefiele said. Regulators last month announced a Jan. 31 deadline for old notes to either be used or deposited at banks.

With inflation at a 17-year high of 21.09% that is driven by soaring food prices, Emefiele said the new notes “will bring the hoarded currencies back into the banking system” and help the central bank regain control of the money being used in the country.

“The currency redesign will also assist in the fight against corruption as the exercise will reign in the higher denomination used for corruption and the movement of such funds from the banking system could be tracked easily,” the central bank chief said.

Analysts, however, say that the newly designed notes would yield little or no results in managing inflation or in the fight against corruption in the absence of institutional reforms.

“If you want to curb money laundering, your financial system needs to be better; if you want to curb ransom payment, security needs to be better; if you want to curb inflation, the level at which the total money supply in the economy is growing has to slow down — so it is not about cash,” said Adedayo Bakare, an analyst with Lagos-based Money Africa.

Bakare said the move by Nigeria’s central bank is at best an “expensive process that will cost the public a lot of pain because of the short period” required to either use or deposit cash in circulation.

At least 133 million people, or 63% of Nigeria’s citizens, are multidimensionally poor, according to government statistics.

“It could potentially slow down the economy if people do not have cash and people cannot exchange their cash for new notes at a fast pace,” he said. “You can’t phase out cash without fixing financial inclusion or electronic payment and even at that.”

image1.png

US Dollar Nosedives Post Fed Meeting Minutes. Will the USD (DXY) Index Push Lower?

The US Dollar is on the backfoot again after the market viewed the Federal Open Market Committee (FOMC) meeting minutes as having a dovish tilt.

Notes from the gathering revealed that some board members are considering rate rises of less than the four successive outsized 75 basis point (bp) hikes already seen to date. The last few weeks saw several Fed speakers sing from this song sheet.

Short term interest rate markets had already factored this in with a 50 bp hike at the December conclave before and after this month’s meeting. It continues to do so now.

Treasury yields are softer across the curve, with tenors beyond 5-years particularly so. The 10-year note is below 3.70%.

In any case, Wall Street was quite enamoured with the news and finished higher on the day with the Nasdaq leading the way, adding almost 1%.

APAC stocks are mostly in the green, with the exception China’s CSI 300. More Covid-19 cases were reported across several major metropolises on the mainland.

Elsewhere, Bank of Canada Governor Tiff Macklem crossed the wires with comments that were also interpreted as dovish.

Crude oil sinking didn’t help the Loonie’s cause, and these factors contributed to the Canadian Dollar joining the ‘big dollar’ at the bottom of the currency table. The Japanese Yen has been the best performing currency so far today.

Concerns around the slowdown from China’s lockdowns played a role in oil’s slide, as well a report that EU countries are debating a price cap on Russian supply. It appears that some countries feel that US$ 55 bbl is too generous to Russia.

The WTI futures contract is below US$ 78 bbl while the Brent contract is nearing US$ 85 bbl. Gold has seen modest gains, trading above US$ 1,750.

Germany’s IFO gauge on their business climate will be the data highlight today. A number of speakers from the ECB and Bank of England will be crossing the wires on this Thanksgiving holiday in North America.

The full economic calendar can be viewed here.

DXY (USD) INDEX TECHNICAL ANALYSIS

The DXY index price has moved below all short, medium and long term Simple Moving Averages (SMA) and this might indicate that bearish momentum is evolving.

Support could be at the prior lows of 105.34, 106.64, 103.67 and 103.42.

On the topside, resistance might be offered at the breakpoints of 107.43, 107.68 or the recent peak at 107.99.

image1.png