Japanese Yen Price Action Setups: EUR/JPY, USD/JPY, AUD/JPY

Japanese Yen Price Action Setups: EUR/JPY, USD/JPY, AUD/JPY

JAPANESE YEN BACKDROP

The Japanese Yen has continued to both surprise and intrigue as market participants do not seem to be getting the message from the Bank of Japan (BoJ). Market participants had hoped for a swift change in policy following the arrival of Governor Ueda, however the Governor continues to be steadfast in his rhetoric and assessment that a change is not imminent.

Comments in this morning once more indicate the Governors position, as he stated “We’re going to continue QQE until achievement of our inflation target. Inflation expectations have remained low because of prolonged zero inflation and deflation.” The recent Yen recovery is thus surprising, however last week we heard comments from both Governor Ueda and the Japanese Finance Minister around the currency and exchange rate which hinted at the potential for intervention.

We did of course see intervention from the BoJ in October 2022 when USD/JPY reached the 150.00 handle. It is rather difficult to tell whether this is the reason for the recent resilience by the Japanese Yen or are markets still optimistic of a shift or tweak in policy?

The Yen is likely to face renewed pressure this month as rate hikes is expected from both the ECB and the BoE, while US Federal Reserve picture looks a little less certain. The weeks ahead could prove pivotal for the Japanese Yen as we head toward Q3.

PRICE ACTION AND POTENTIAL SETUPS

EURJPY

EUR/JPY Daily Chart

image1.png

EURJPY rallied into the psychological 150.00 level yesterday before retreating to a low of 148.80 today. On the daily timeframe a candle close here would see a new lower high printed signaling the potential for further downside in search of a lower low.

It will be interesting to see whether the Yen is able to sustain its resilience particularly if we see a return of Euro bulls. The Euro hasn’t been particularly strong of late with the majority of hawkish rhetoric and data likely priced in already and thus resulting in some short-term Euro weakness. A daily candle close below immediate support around 148.70 could clear a path toward the 50-day MA, which hovers near a key support area at 147.60.

Alternatively, a push by Euro bulls has to contend with the 150.00 handle first before looking toward resistance at the 151.00 handle before the YTD high comes into focus at 151.61.

Key Levels to Keep an Eye On:

Support levels:

  • 148.70
  • 147.60
  • 145.50

Resistance levels:

  • 150.00
  • 151.00
  • 151.61

USDJPY

USD/JPY Daily Chart

image2.png

From a technical perspective, the daily chart for USD/JPY looks eerily similar to EUR/JPY. Yesterday’s daily candle closed as a doji candlestick in what could be a mirror image of the EURJPY daily close. USDJPY however has looked to tick higher since the start of the European session as the Dollar Index found support around the 103.80 handle.

Overall USDJPY remains bullish without a daily candle close below the 137.90 handle (previous lower swing high). Mixed signals here and similar to EURJPY as we wait for a potential breakout. We could very well see USDJPY rangebound for now between the recent swing high around 141.00 and the swing low around the 138.40 handle.

Key Levels to Keep an Eye On:

Support levels:

Resistance levels:

  • 140.00
  • 141.00
  • 142.13

AUDJPY

AUD/JPY Daily Chart

image3.png

Source: TradingView, prepared by Zain Vawda

The AUDJPY chart saw a similar doji candlestick close on the daily yesterday but the decision to hike rates by the RBA has reignited the interest of Australian Dollar bulls. The pair has pushed higher taking out yesterday’s highs before rallying into resistance around the 93.000 area. Given that we are at a resistance level and have printed a higher high we could very well be in for a short-term pullback toward intraday support around 92.50.

Given the RBA rate we could very well push higher here with the next area of resistance resting around the 94.00 mark, before the psychological 95.00 area comes into focus. The only apprehension I do have regarding further upside would be that the 14-day RSI is approaching overbought territory. However, a push to the resistance at 94.00 could line up perfectly with the RSI entering overbought territory and could result in a pullback, offering would-be-shorts a better a risk-to-reward opportunity.

Cable (GBP/USD) Settles into Consolidation Channel – Breakout Levels Analysed

Cable (GBP/USD) Settles into Consolidation Channel – Breakout Levels Analysed

GBP/USD Appears to be Favouring Sideways Consolidation

Cable has headed lower after the since Friday’s massive NFP beat and continues to test the zone of support around 1.2445 with secondary support appearing around 1.2345. The pair has exhibited moments where a directional move provided hope for a loner lasting trend to set it but has ultimately settled into more of a choppy, sideways trading environment.

As such, range trading strategies could become favourable, particularly with price action trading largely between 1.2345 and 1.2676. Breakout levels can be considered around 1.2345 to the downside and 1.2676 for a bullish breakout. Looking at the weekly chart, the longer-term bull trend would suggest that upside breakouts may carry more weight with prices trading well above the 200 SMA. Bulls ought to be aware of the massive zone of resistance at the psychological level of 1.2700 and the 61.8% Fibonacci retracement level of the 2021 to 2022 major decline (1.2750) which has kept bulls at bay thus far and provides a stern challenge to further upside.

GBP/USD Daily Chart

image1.png

Source: TradingView, prepared by Richard Snow

The weekly chart shows the longer-term uptrend which is coming to an apex around the psychologically important 1.2700 mark. It would appear that a new bullish catalyst may be needed to extend above the zone of resistance which may not necessarily arrive next week. The Fed is likely to issue a hawkish pause – meaning that the rhetoric around the inflation and interest rate scenario is likely to warn of further hikes in the face of stubborn inflation despite potentially pausing on a hike for June. Markets are extremely hawkish when it comes to Bank of England rate hike expectations, currently pricing in another 90 basis points worth of hikes which could land up rivalling the Fed. Strong rate expectations appear to be supporting the pound but with a lack of a catalyst GBP/USD may continue on its current trajectory for some time.

GBP/USD Weekly Chart

image2.png

Source: TradingView, prepared by Richard Snow

Major Risk Events Ahead

This week is rather quiet as far as high impact economic data is concerned, as is typically the case the week before the major central bank decisions. Next week, the Bank of England (BoE) will have some inflation-sensitive data to work with as UK average earnings data is due and crucial US inflation data will reveal if core price pressures can dip below the sticky 5.5% – 5.7% range.

image3.png

Customize and filter live economic data via our DailyFX economic calendar

IG Client Sentiment Reveals a Tricky Trading Outlook as Cable Offers Little Clues

IG client sentiment has been switching from net long to net short and visa versa, which renders the contrarian indicator largely ineffective. Client sentiment provides stronger signals when markets are trending, preferably when markets are in a strong trending environment.

image4.png

GBP/USD:Retail trader data shows 54.06% of traders are net-long with the ratio of traders long to short at 1.18 to 1.

We typically take a contrarian view to crowd sentiment, and the fact traders are net-long suggests GBP/USD prices may continue to fall.

The number of traders net-long is 1.23% higher than yesterday and 7.99% lower from last week, while the number of traders net-short is unchanged than yesterday and 11.29% higher from last week.

Positioning is more net-long than yesterday but less net-long from last week. The combination of current sentiment and recent changes gives us a further mixed GBP/USD trading outlook.

​​Dow and Nasdaq 100 Look to Move Higher but Hang Seng Struggles​

​​Dow and Nasdaq 100 Look to Move Higher but Hang Seng Struggles​

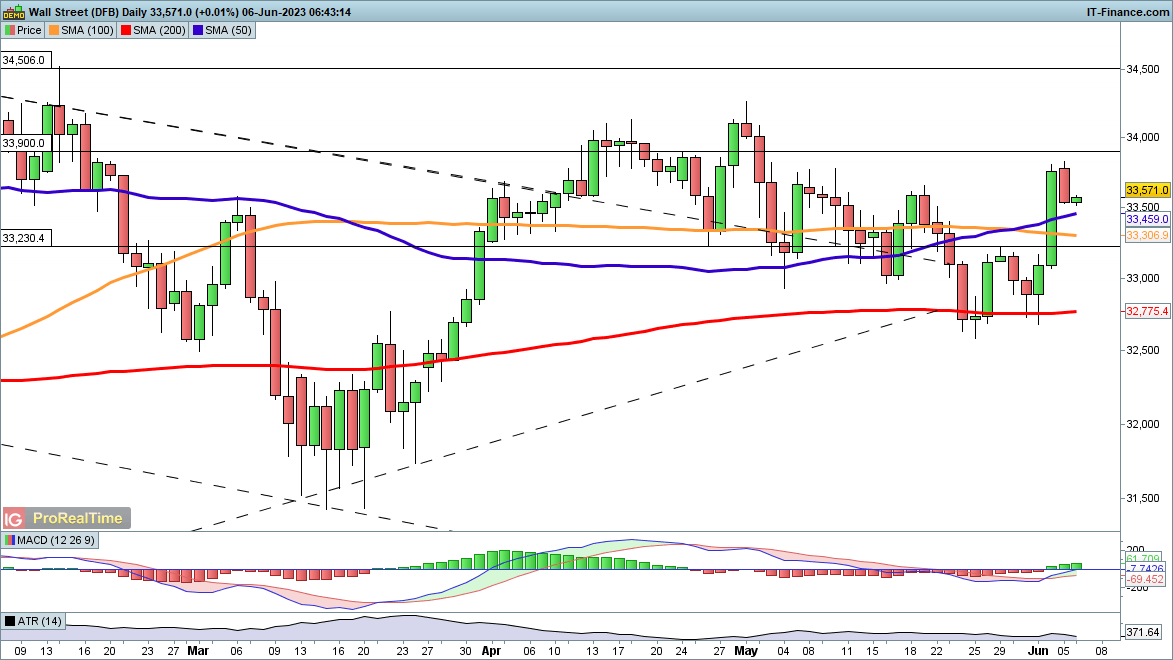
After surging on Friday the index has run into resistance around 33,800. If buyers can step in above the 50-day SMA then a more bullish view may yet prevail; indeed this might remain the case even if the price drops back towards 33,200.

​Further upside above 33,800 opens the way to 34,200 and the highs from early May, while beyond this the January and February highs around 34,345 beckon.

​​Sellers will want to see a drop back below 33,200 to set up another potential test of the 200-day SMA and the May lows around 32,600.

Dow Jones Daily Price Chart – June 6, 2023

​Nasdaq 100 hits new one-year high

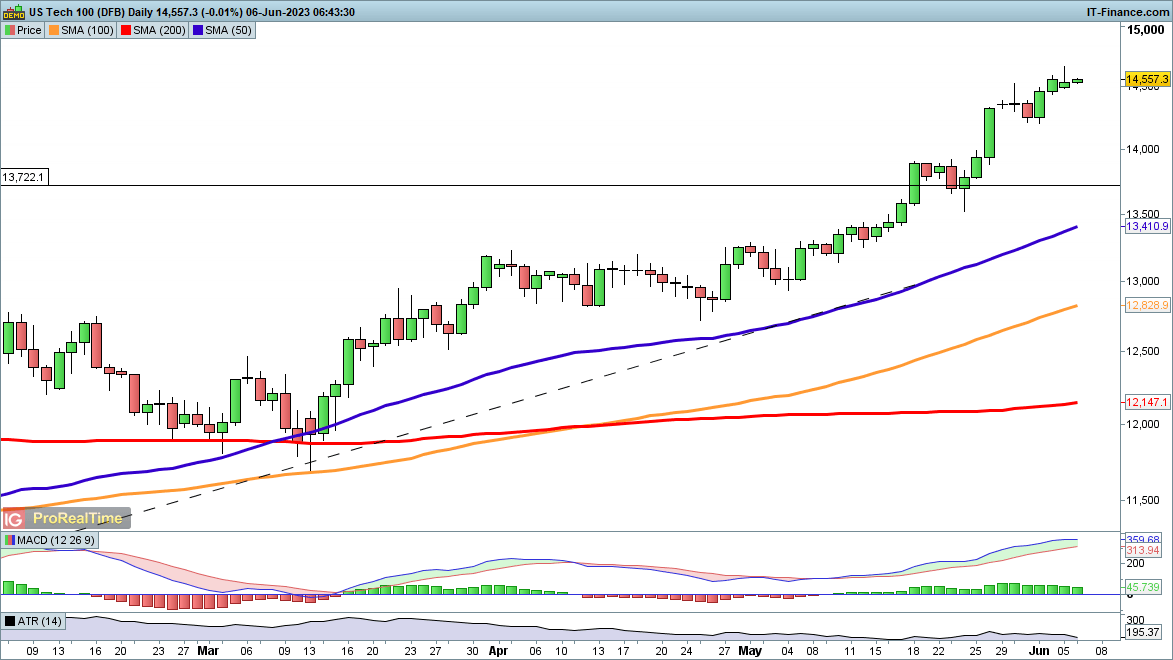
​While other indices faltered on Monday this index made a fresh one-year high, buoyed by euphoria around AI stocks.

​​The steady gains from late April remain in place, with around 1800 points added to the index in that time. The index shows no sign of reversing or even consolidating for now. For this to occur we would need to see a drop back below 14,200 and then on below 14,000.

​​March 2022’s highs around 15,230 continue to be the next target if the index continues to make headway.

Nasdaq 100 Daily Price Chart – June 6, 2023

​Hang Seng struggles to hold gains

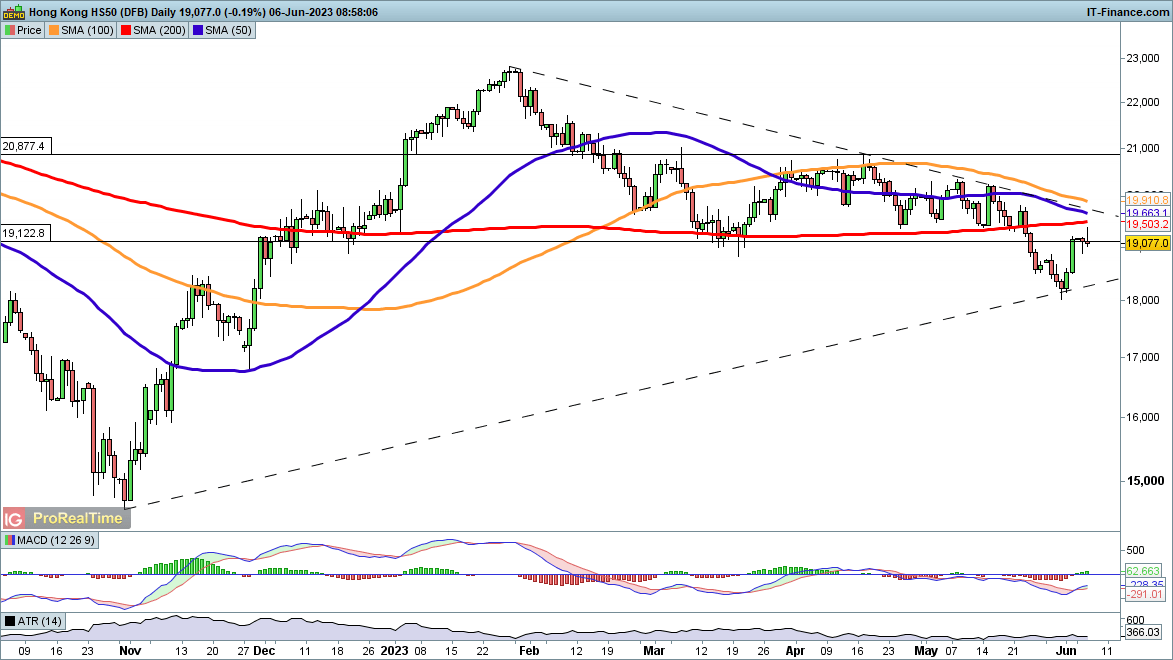
​The index rebounded from a six-month low last week, and may have established a new trendline from the October 2022 lows.

​However, little further upside has been seen since last week’s surge, leaving the index below the 200-day SMA. It has been able to move above 19,000 a key area of support in December 2022 and in March 2023.

​A reversal back below 18,700 might flag another potential test of trendline support from the October 2022 lows, or a drop towards last week’s lows of 18,000.

Hang Seng Daily Price Chart – June 6, 2023

Canadian Dollar to Look Past Saudi Arabia Oil Cuts as WTI Fills a 4% Gap Within a Day

Canadian Dollar to Look Past Saudi Arabia Oil Cuts as WTI Fills a 4% Gap Within a Day

Canadian Dollar Takes Little from Another OPEC Meeting

The Canadian Dollar weakened against the US Dollar over the past 24 hours. This is despite relevant news in the crude oil space. Over the weekend, the latest OPEC meeting concluded with Saudi Arabia cutting production by about 1 million barrels per day (bpd) from July. It was a rather unusual meeting, with the coalition failing to come to a wide agreement on the need to cut output to revive oil prices.

Even though WTI gapped over 4 percent higher to start the trading week on this news, within 24 hours the commodity filled it, ending the session unchanged. From a fundamental standpoint, the road ahead remains tough for crude oil. Global monetary policy tightening is working as a brake for growth. This was recently seen in the form of disappointing manufacturing data out of China.

With that in mind, if there is no comprehensive coordination between OPEC+ members, it might be difficult for one nation alone to prop up the market. This is relevant to Canada and USD/CAD because oil is a key local export. A material deviation in the price trajectory of the commodity could have key implications for the economy, inflation and the Bank of Canada.

In the meantime, the Loonie might remain focused on the ongoing story of where global growth is heading. Looking at the remaining 24 hours, the economic docket is rather light outside of the Reserve Bank of Australia rate decision. But, USD/CAD might remain focused on market sentiment. A rather pessimistic Wall Street trading session could spell cautious headwinds for the currency ahead.

Canadian Dollar Technical Analysis

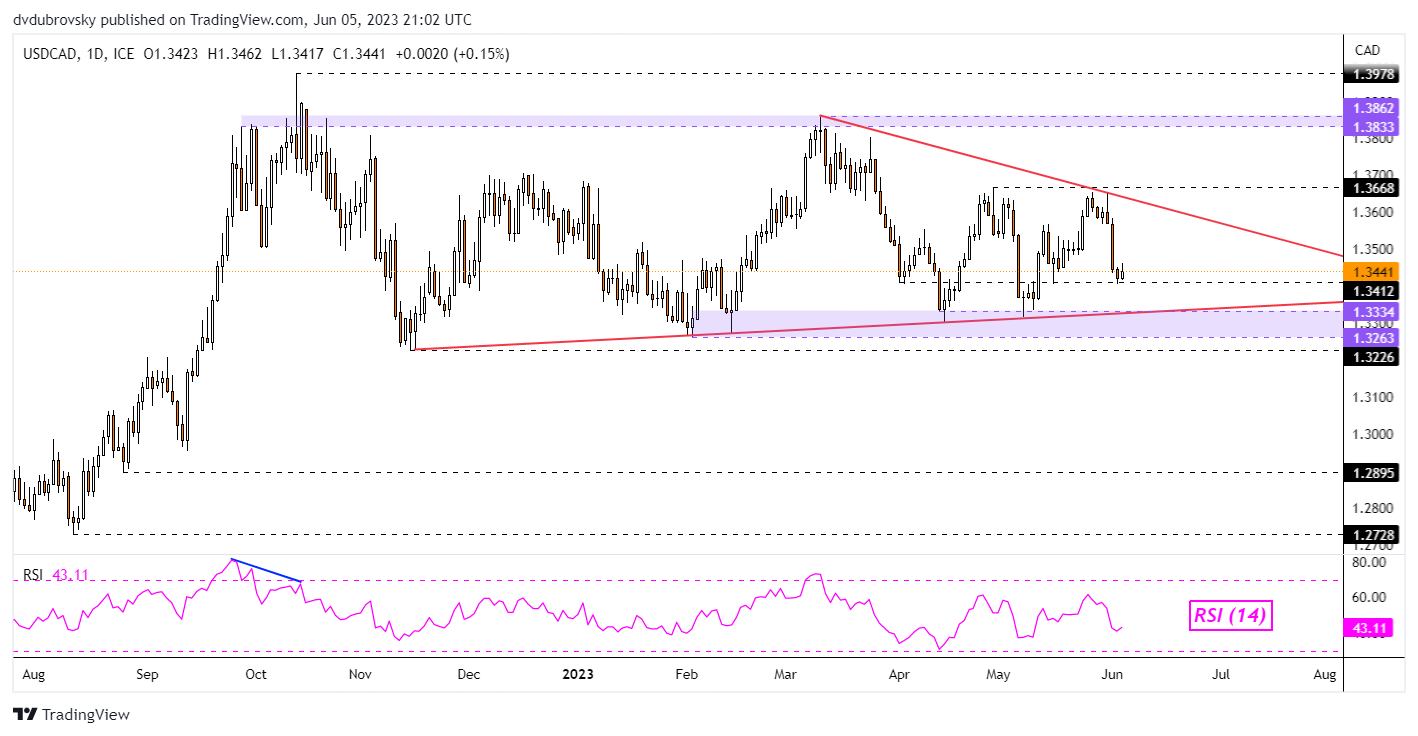
On the daily chart, USD/CAD appears to have support around the 1.3412 inflection point. A turn higher from here places the focus on a falling trendline from March. This could hold as resistance. Meanwhile, a drop through the inflection point exposes a rising trendline from November, which may hold as support. As such, consolidation might be the path ahead for the Loonie until meaningful breakouts are achieved.

USD/CAD Daily Chart

USD/CAD Daily Chart


Euro Technical Outlook – Trends Questioned as Ranges Emerge. Is EUR/USD Trapped?

Euro Technical Outlook – Trends Questioned as Ranges Emerge. Is EUR/USD Trapped?

EUR/USD TECHNICAL ANALYSIS

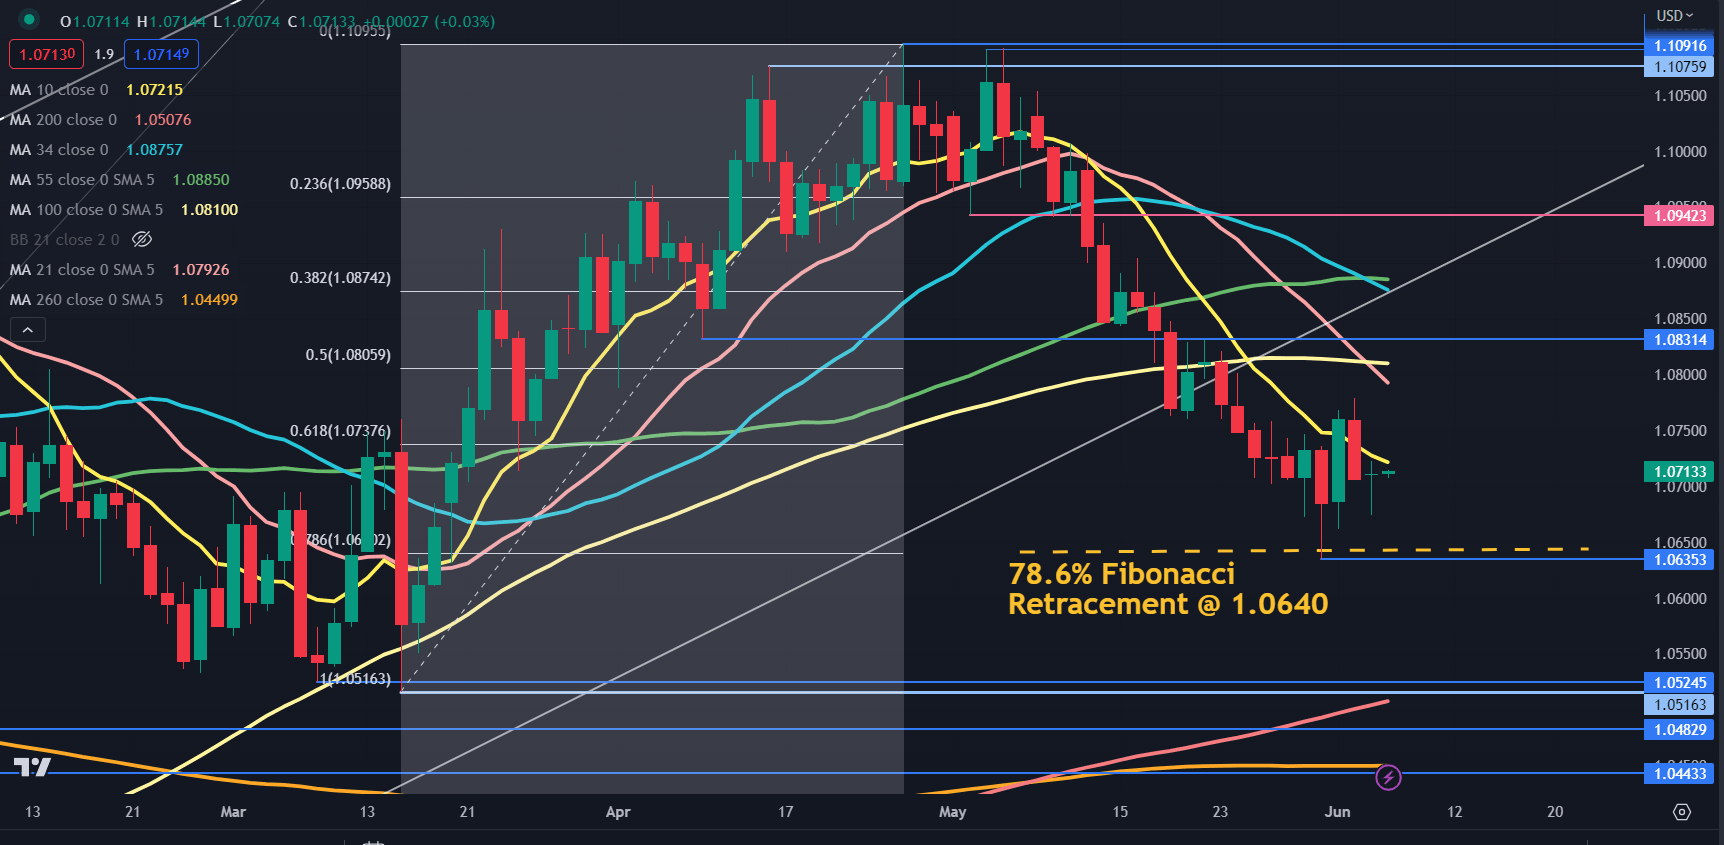
EUR/USD has recovered from the 10-week low seen last week at 1.0635. This was only a fraction below the 78.6% Fibonacci Retracement of the move from 1.0516 to 1.1096 at 1.0640.

This may see the 1.0635 – 40 area set up as a potential support zone ahead of the prior lows at 1.0525, 1.0516, 1.0483 and 1.0443.

The longer-term 200- and 260-day simple moving averages (SMA) are in among the cluster of lows between 1.0443 to 1.0525 and might lend support.

Since breaking below the trend line established from a series of lows seen between September and November last year, the price has remained below the 10-, 21-, 34, 55- and 100-day SMAs.

This could suggest that short and medium-term bearish momentum might be intact. On the flip side, the price remains above the 200- and 260-day SMAs, which may suggest the underlying longer-term bullish trend is yet to be undone.

A break above the trend line axis has the potential to reinstate the ascending trend. It currently dissects with the 34-day SMA near 1.0875. The 34-day SMA has just broken below the 55-day SMA, creating a Death Cross.

Similarly, the 21-day SMA has also created a Death Cross by crossing below the 100-day SMA. A Death Cross is a potential signal for an evolving bearish trend.

In April and May, a series of highs were seen in the 1.1075 – 95 area and this might offer a resistance zone. In the bigger picture, a clean take out of these levels may confirm the resumption of the ascending trend.

These tops created an extension of a Double Top formation that heralded the sell-off last month. It should be noted though that past performance is not indicative of future results. The neckline from this formation is at 1.0942 and it might offer resistance.

The price action on Monday saw a Spinning Top Candlestick emerge which may indicate indecision in the market for EUR/USD direction, potentially setting up a range trading type environment.

As laid out above, there are mixed signals in EUR/USD for now. As always, sound risk management is the foundation for trading.

image1.png


Asia Day Ahead: Wall Street on a breather as Apple failed to commit to all-time high

Asia Day Ahead: Wall Street on a breather as Apple failed to commit to all-time high

A mixed showing in Wall Street eventually saw the Nasdaq pare its initial gains by the close, partly as optimism around Apple’s share price fizzled, following the unveiling of its augmented-reality headset, Vision Pro. The company’s share price briefly pushed to a new all-time high intraday but failed to find the commitment for a confirmation close. With overbought technical conditions and a rejection of its all-time high, any follow-through weakness from the index’s heavyweight (Apple) could mean downward pressure on the wider markets.

On the economic data front, further cracks in US economic conditions were unveiled with a downside surprise in the US ISM services PMI read (50.3 versus 52.5 forecast). While the moderation in its prices sub-index looks promising on the inflation front, the trade-off for growth is clearly presented with a decline in the services employment sub-index into contractionary territory while new orders slowed significantly. April’s factory orders underperformed as well (0.4% versus 0.8% forecast).

Weaker data brought Treasury yields lower, prompting the US dollar to pare its initial gains. A lacklustre US dollar is positive news for gold prices, which defended its key trendline support at the US$1,940 level, at least for now. Aside, optimism in oil prices on a lower-supply outlook largely saw some fading.

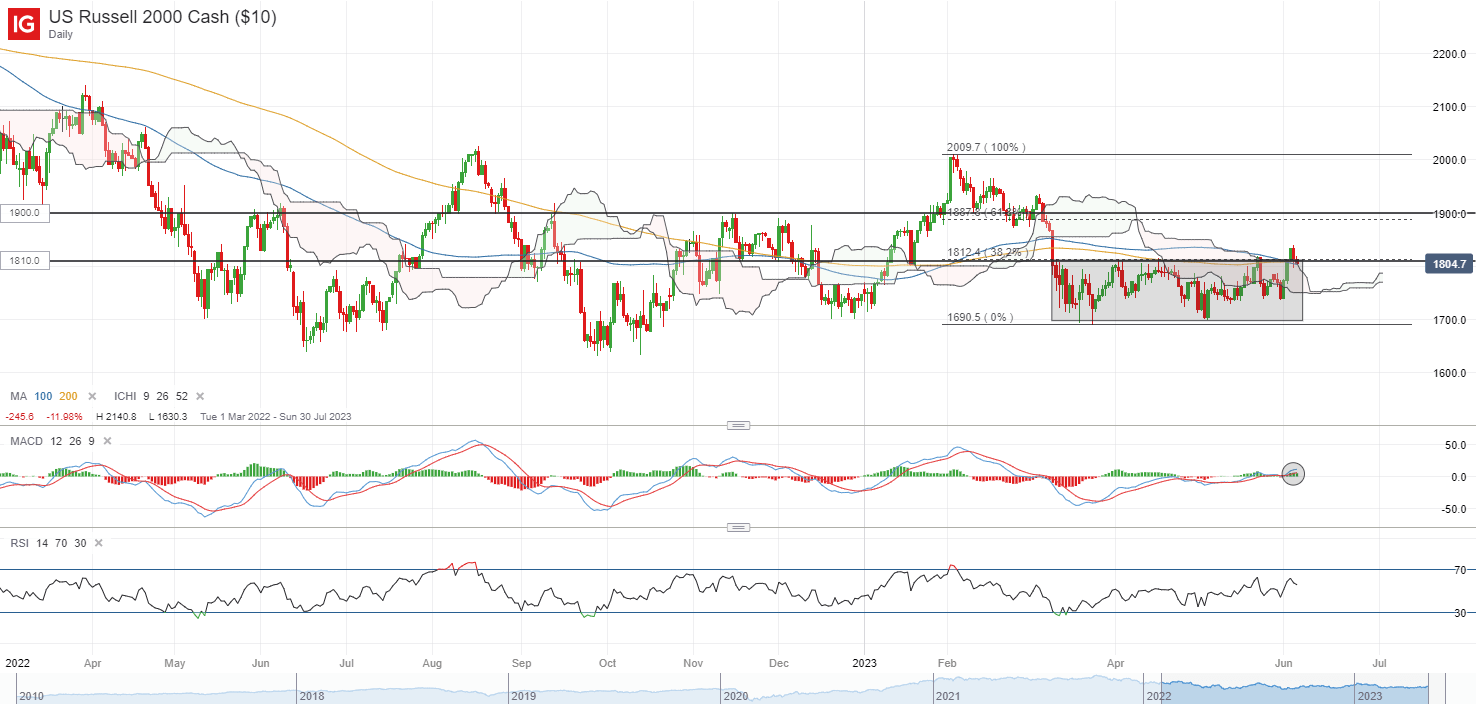
Having traded in a range since March this year, the break of the upper bound in the Russell 2000 index last week could reflect greater control from buyers but the new resistance-turned-support 1,800 level will have to see some defending ahead. Market breadth has been supportive for now, with the percentage of stocks above its 50-day moving average breaking to a new multi-month high. Any failure to defend the 1,800 level ahead could point to a potential false breakout scenario, which could draw some selling pressure in challenging the 1,740 level next.

image1.png

Asia Open

Asian stocks look set for a downbeat open, with Nikkei -0.22%, ASX -0.72% and NZX -0.36% at the time of writing. South Korea markets are off for holiday.

The RBA interest rate decision will be the central event today, with cash rate futures pricing for a rate pause (64% probability) at the upcoming meeting but still expecting an additional hike in subsequent meetings. This leans towards a hawkish-pause scenario, as untamed inflation in April failed to provide the much-needed conviction for an extended pause.

Any hints towards the terminal rate will be on the lookout. Current market pricing are leaning towards the rate of 4.1% (current rate at 3.85%), which still suggests that we are heading towards the final phase of the tightening cycle. Any pushback on that front will likely prompt a hawkish recalibration in those expectations and be supportive of the AUD in the near term.

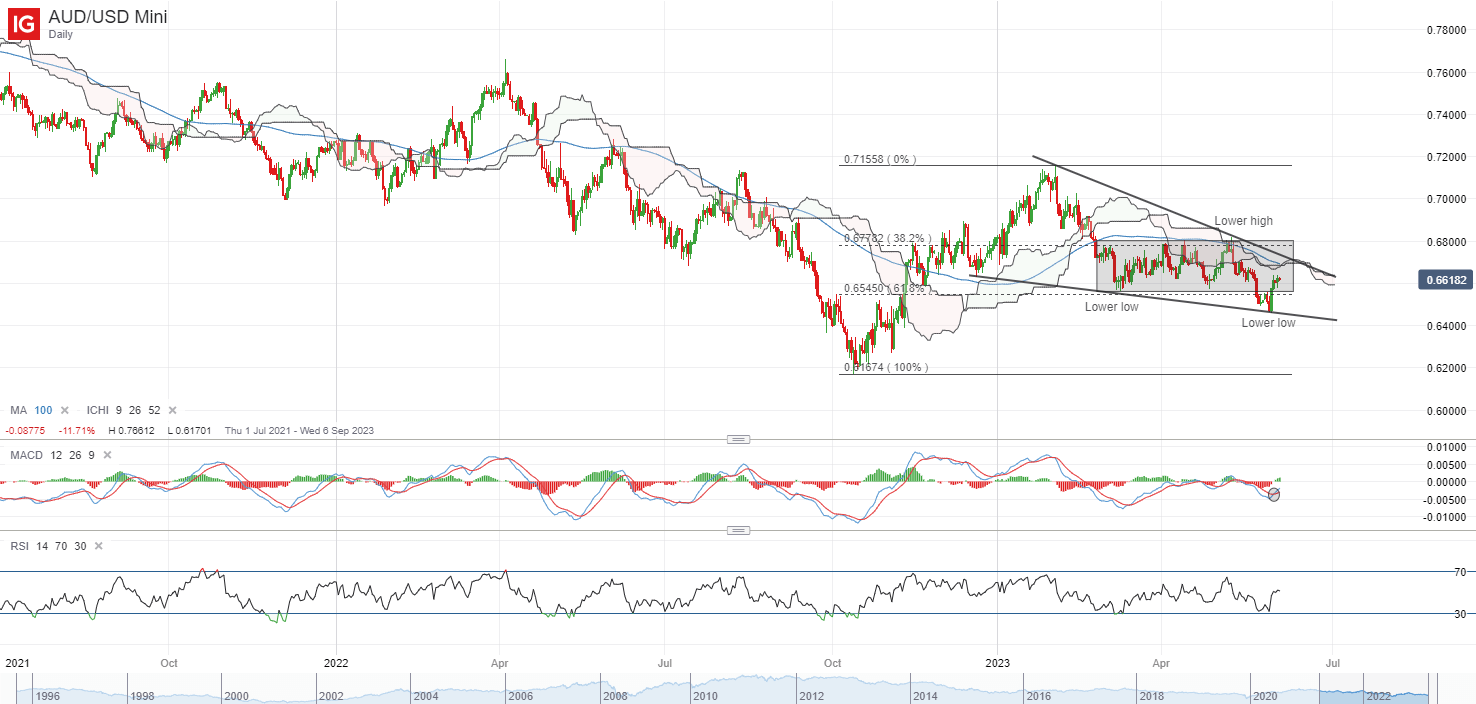
Having broken below the lower bound of a rectangle pattern (consolidation zone) in late-May, the AUD/USD is quick to reclaim the 0.656 level last week, with a bullish MACD crossover on the daily chart pointing to a potential turnaround in short-term momentum. That said, the pair seems to be trading within a falling wedge pattern on lower highs and lower lows since February this year, which could still leave a downward bias in place, until a series of resistance are overcome. This may include the upper wedge trendline resistance, its Ichimoku cloud, its 100-day moving average and the upper bound of its consolidation pattern, which could force the formation of another lower high.

image2.png

On the watchlist: Silver prices’ formation of bullish pin bar on retest of 100-day MA

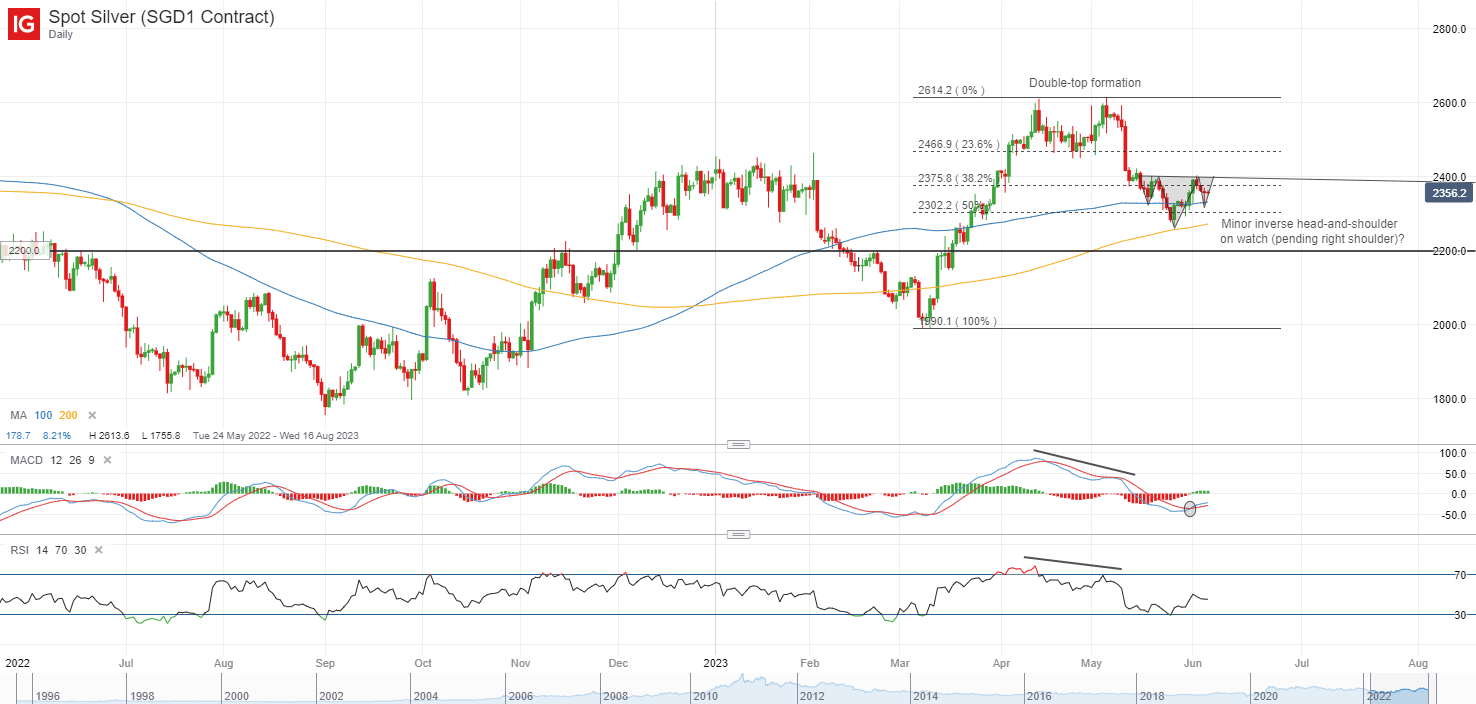
A slight breather in the US dollar has translated to some resilience in silver prices overnight, as a retest of its 100-day MA was met with the formation of a bullish pin bar, reflecting signs of some near-term dip buying. Any upside at this point could potentially aid to complete the right shoulder of a minor inverse head-and-shoulder pattern in place since mid-May this year, although for now, it is still premature to conclude that the pattern will be formed.

The US$24.00 level will be the key resistance to overcome to provide greater conviction for the bulls. Prices have failed to move past the level on two occasions over the past month. Reclaiming this level may also mark a break of the neckline of the inverse head-and-shoulder pattern, potentially paving the way towards the US$24.70 level next.

image3.png

US Dollar Pauses as Cross Market Volatility Rolls Over. Will Markets be Data Dependent?

US Dollar Pauses as Cross Market Volatility Rolls Over. Will Markets be Data Dependent?

The US Dollar steadied through the Asian session today after taking a tumble after some soft data.

The ISM services PMI survey results for May missed estimates, coming in at 50.3 rather than the 52.2 anticipated and 51.9 prior. This appears to have given the market further hope for a pause at Federal Open Market Committee (FOMC) meeting on Wednesday, June 14th.

Wall Street finished the cash session slightly lower and APAC equities have seen somewhat lacklustre trade, although Hong Kong’s Hang Seng Index (HSI) managed some decent gains.

The RBA raised its cash rate today by 25 basis points today to 4.10%. AUD/USD went half a cent higher in the immediate aftermath as interest rate markets had not factored in the move. The ASX 200 fell over 1% at the same time.

Treasury yields have barely moved so far today although the 1-year note remains near 23-year highs at around 5.25%.

The front-month COMEX gold futures bounced off an ascending trend line support overnight and it remains steady today above US$ 1,970.

Likewise, crude oil has quietened down after the fireworks seen on Monday after OPEC+ cut its production target again. The WTI futures contract is a touch under US$ 72 bbl while the Brent contract is near US$ 76.50 bbl. Updated commodity prices can be found here.

With markets behaving as they are, volatility across many asset classes has taken a tumble. The widely watched VIX index, a measure of market-priced volatility on the S&P 500, dipped to its lowest level since November 2021 this week.

Similar measures of volatility across bonds, currencies, oil and gold have crumbled in the last few days. See the chart below. A lower level of volatility might lend itself to more range trading scenarios.

A potential contributing factor to the reduction in price fluctuations might be the resolution of the US debt ceiling issue over the weekend.

The focus for the market may turn toward the next FOMC meeting where the interest rate swaps and futures markets are not expecting a hike. They have placed a roughly 70% probability of a 25 basis point lift at the July meeting though.

Speculation around the rate path might be driven by data points going forward and could be the trigger for bouts of volatility.

The full economic calendar for data events can be viewed here.

CROSS MARKET VOLATILITY CHART – BONDS (MOVE), S&P 500 (VIX), OIL (OVX), GOLD (GVZ) AND FX (EVZ)

image1.png


Australian Dollar Jumps as RBA Hikes; How Much More to Go For AUD/USD?

Australian Dollar Jumps as RBA Hikes; How Much More to Go For AUD/USD?

The Australian dollar jumped after the Reserve Bank of Australia (RBA) surprisingly hiked interest rates by 25 basis points and said some further tightening may be required in its determination to return inflation to its target.

The RBA was generally expected to keep its benchmark cash rate on hold at 3.85%, but last week’s minimum wage hike made it a close call. The market was pricing in roughly a 30% chance of a 25-basis-point rate hike at today’s meeting, with the benchmark rate to reach 4.18% by September. At the time of writing the odds show continued to show a terminal rate of 4.26%.

AUD/USD 5-minute Chart

image1.png

Chart Created Using TradingView

The central bank said upside risks to the inflation outlook have increased and the board has responded accordingly. It maintained a hawkish bias saying a further increase in interest rates is to provide greater confidence that inflation will return to target within a reasonable timeframe.

The Australian central bank surprised markets by raising rates last month after pausing in April and maintained a hawkish tone in a bid to tame price pressures. Australia’s inflation has been running well above the target, and the minimum wage rise could further delay achieving the price target, thereby requiring higher interest rates.

Commodity Prices and US Recession Odds; Australia Inflation

image2.png

Source data: Bloomberg; Chart prepared in Excel

Inflation is only projected to return to the top of the RBA’s 2-3% target range by mid-2025 – headline inflation rose 6.8% on-year in April and 7.0% in the first quarter, down moderately from a peak of 7.9%. Moreover, the jobs market has been tight with the unemployment rate hovering around five-decade lows, but signs of moderation in the labour market are emerging.

AUD/USD Daily Chart

image3.png

Chart Created Using TradingView

AUD/USD jumped in reaction to the ‘hawkish hike’. In recent days, the Australian currency has received a boost after the US House of Representatives passed the debt ceiling bill and reports that China is working on new measures to support the property market.

On technical charts, AUD/USD has managed to recoup some losses, rising above an immediate hurdle at the March low of 0.6560. However,as highlighted on Monday, unless AUD/USD breaks above the crucial barrier at 0.6805, the path of least resistance remains sideways to down. On the upside, any break above 0.6805 could clear the path toward the February high of 0.7160.

XAU/USD Price Forecast: Gold Tame in Low Vol Environment

XAU/USD Price Forecast: Gold Tame in Low Vol Environment

XAU/USD FUNDAMENTAL FORECAST

Gold prices remain steady this Tuesday morning after yesterday’s rally on the back of the US ISM non-manufacturing PMI miss that reached fresh yearly lows – approaching contractionary territory. The US being a principally services funded economy meant the print brought significant downside for the US dollar and consequently upside for bullion.

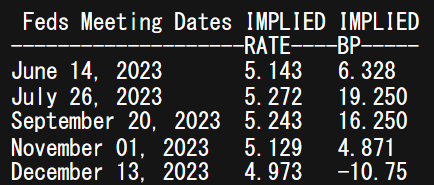
The resultant impact on Fed funds futures (refer to table below) was a dovish repricing of interest rate expectations with a 75% probability of a rate pause next week.

FEDERAL RESERVE INTEREST RATE PROBABILITIES

image1.png

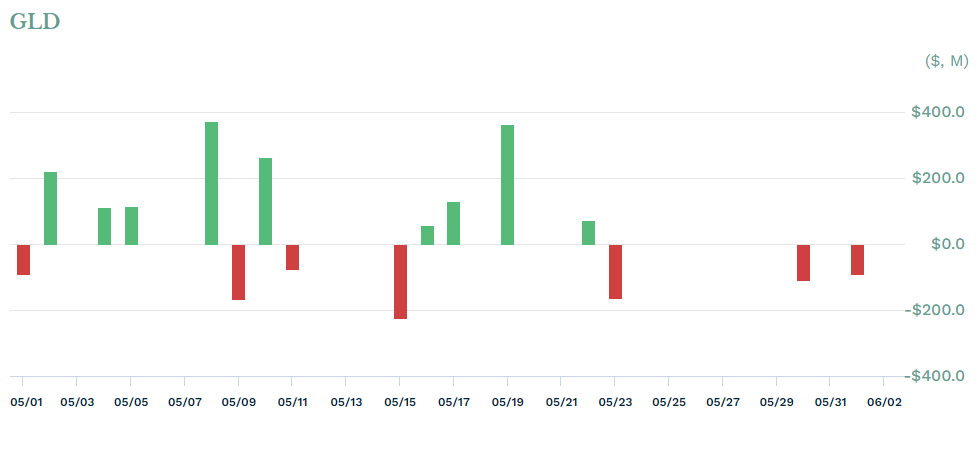
While economic data has been weighing on the greenback of recent, fund flows from the worlds largest physically backed gold ETF have been on the decline. Traditionally, gold prices move in tandem with this metric and with recent negative readings, gold upside has been capped.

SPDR GOLD TRUSDT ETF FUND FLOWS

image2.png

Source: etf.com

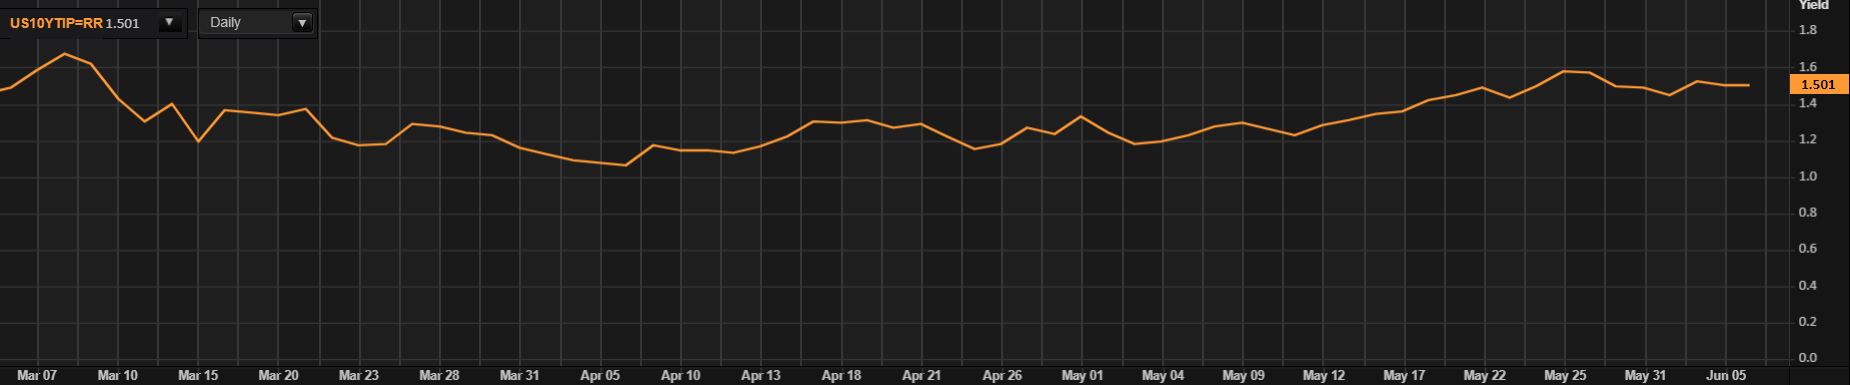
In addition, real yields (below) have plateaued around the 1.5% mark showing no real directional bias for gold to move with. Considering there is no further high impact US data for the week, I do not expect much in terms of gold price movement. The Volatility Index (VIX) has also been on the decline which is generally a net negative for the yellow metal.

US REAL YIELDS

image3.png

TECHNICAL ANALYSIS

GOLD PRICE DAILY CHART

image4.png

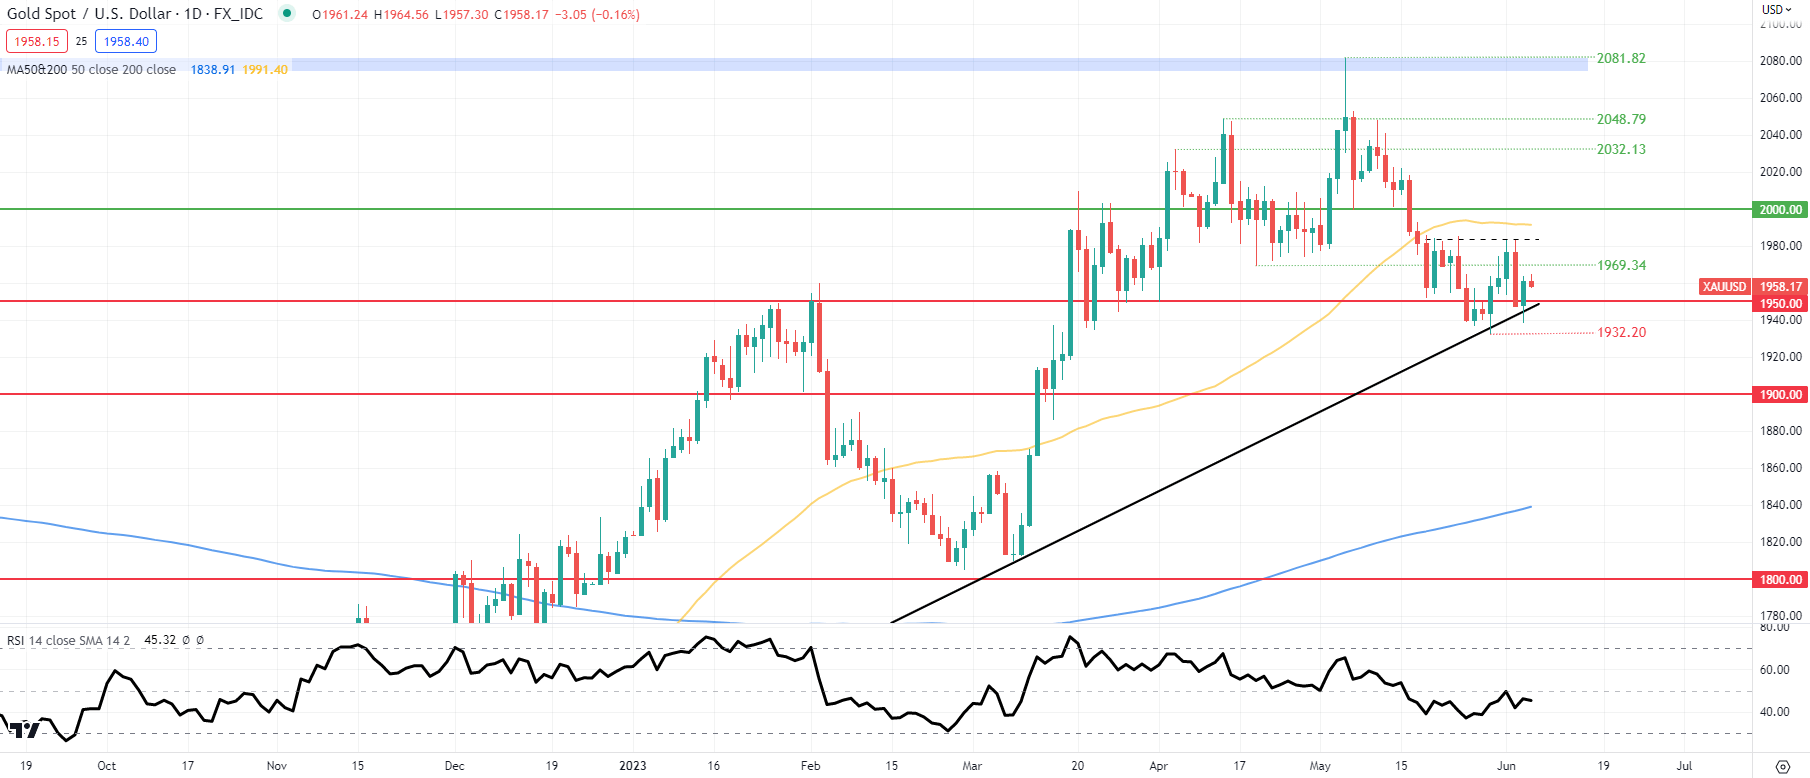
Daily XAU/USD price action has managed to hold its head above the 1950.00 psychological handle in respect of the long-term trendline support (black). On the resistance side, bulls seem unable to penetrate above the 1980.00 -1985.00 zone (dashed black line) which has now formed a short-term ascending triangle pattern. It may be a while before this zone can be tested once more – most likely via next week’s FOMC and CPI releases. The formation will be invalidated should bears push below the 1950.00/trendline support respectively, with a confirmation candle close.

Resistance levels:

  • 50-day MA (yellow)
  • Triangle resistance
  • 1969.34

Support levels:

  • 1950.00/Trendline support
  • 1932.20

IG CLIENT SENTIMENT: BULLISH

IGCS shows retail traders are currently distinctly LONG on gold, with 68% of traders currently holding long positions (as of this writing). At DailyFX we typically take a contrarian view to crowd sentiment but due to recent changes in long and short positioning, we arrive at a short-term upside bias.

Exploring Seasonality in Wall Street, Europe, and Asia-Pacific Stock Markets

Exploring Seasonality in Wall Street, Europe, and Asia-Pacific Stock Markets

Have you ever wondered whether or not certain months of the year are consistently better or worse for stock markets? If such a relationship does exist, then we would describe it as seasonal. Seasonality is something you often see in all kinds of data. For example, you can probably guess which months of the year ice cream sales consistently spike or when people repeatedly purchase more winter clothing.

Businesses use seasonality every year to plan their ventures, but can investors do the same with stock markets? If we assume that markets are efficient, reflecting all available information at a given time, then changes in stock prices every day (or in this case every month) should behave as white noise. In other words, we should not be able to predict the future based on past performance because markets are random.

I will put this simplified theory to the test for global stock markets. We will analyze the Dow Jones, S&P 500 and Nasdaq Composite on Wall Street. Then, we will do the same for the DAX 40, FTSE 100 and CAC 40 to gauge European indices. Finally, I will wrap up with a few major benchmark indices from the Asia-Pacific region: the Nikkei 225, ASX 200 and Hang Seng Index.

Each heatmap chart below contains identical parameters:

  1. Average monthly percent change (+2.5 means the index rose 2.5% on average in that month)
  2. Which months are significant (based on a 95% confidence interval from a regression model)
  3. The average goodness of fit between the 3 regression models (1 for each stock index)

These parameters will be discussed in further detail below.

Dow Jones, S&P 500, Nasdaq Composite Monthly Seasonality

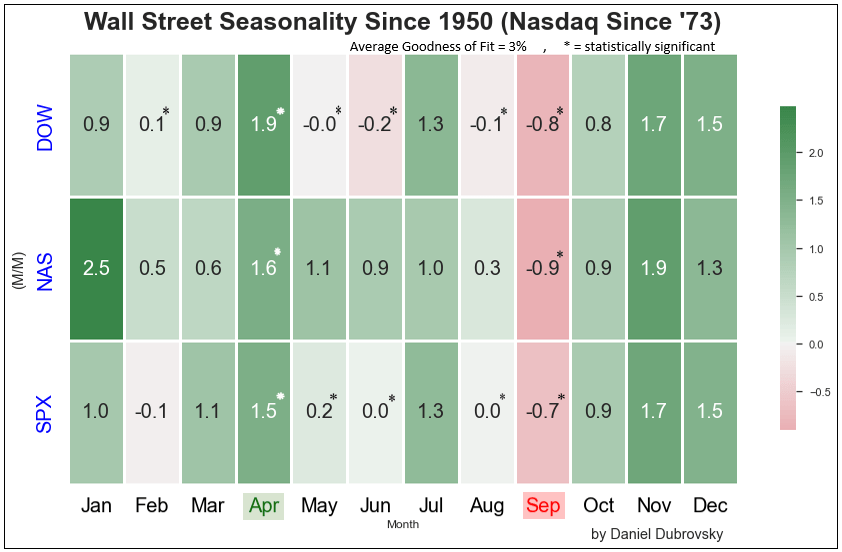
Starting with Wall Street, I have used data on the Dow Jones and S&P 500 since 1950. For the Nasdaq Composite, information since 1973 was used. The most recent month pulled was from December 2022, which applies to all European and Asia-Pacific indices as well. Are there any seasonal effects? Yes!

Historically, it seems that April has been the best month for Wall Street. On average the Dow, S&P and Nasdaq rallied +1.67% in this month. These are also statistically significant. In other words, there is about a 2.6% chance that this +1.67% effect on Wall Street is due to chance within the context of this study.

Meanwhile, September is the only month where all 3 indices have averaged negative and are statistically significant. In this month, the indices averaged -0.8%. I have also highlighted which other months are statistically significant with a “*”. Note that January seems to be a very strong month for the Nasdaq, but it is not significant because, over the years, this month has become progressively weaker.

Finally, and arguably more importantly, notice that the average goodness of fit between the 3 models is 3% (out of a maximum of 100%). What does that mean? On average, about 3% of the variation on Wall Street since the 1950s (‘70s for the Nasdaq) can be explained by seasonality alone (without factoring in any other variables like monetary policy or the unemployment rate).

In other words, while we found meaningful seasonality in April and September, seasonality by itself did a very poor job of explaining how stock markets traded in these months.

Dow Jones, S&P 500, Nasdaq Composite Monthly Seasonality

DAX 40, FTSE 100, CAC 40 Monthly Seasonality

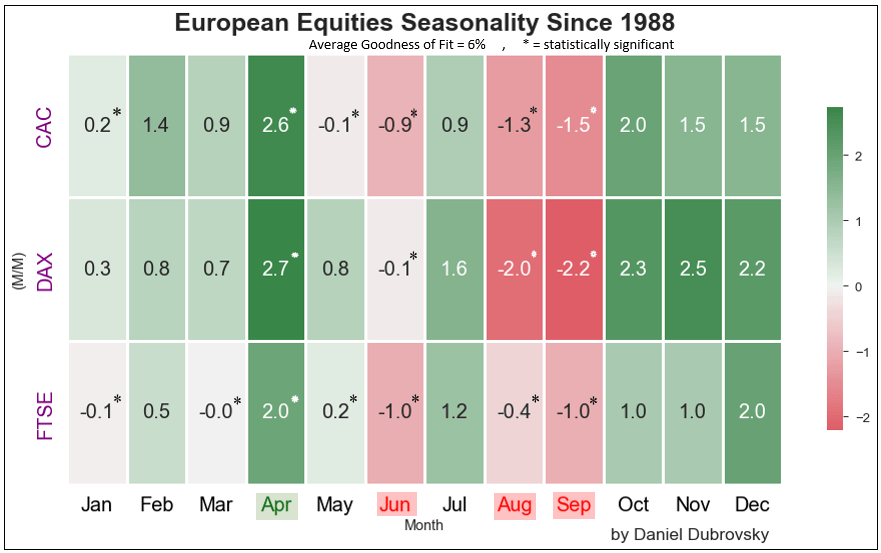
Now let us switch to European indices. It should be noted that the data is not as comprehensive as Wall Street, only going back to 1988. This means that compared to the Dow Jones and S&P 500, we have almost half the number of observations for the DAX 40 (German), FTSE 100 (United Kingdom) and CAC 40 (France).

Still, April has consistently been the best month, similarly to Wall Street. In this month, these European indices averaged 2.43%. For all 3 of them, this month is statistically significant.

Meanwhile, June, August and September have consistently been some of the worst months, averaging -0.67%, -1.23% and -1.57%, respectively. These are all statistically significant. As such, it seems you can find more weak months for this corner of global stock exchanges.

Similarly, with Wall Street, the average goodness of fit for seasonality in European indices is quite low at 6%. Once again this means that while we can identify meaningful seasonality, by itself it is not a good indicator of how these markets have performed in April, June, August and September over the years.

DAX 40, FTSE 100, CAC 40 Monthly Seasonality

Nikkei 225, ASX 200, Hang Seng Index Monthly Seasonality

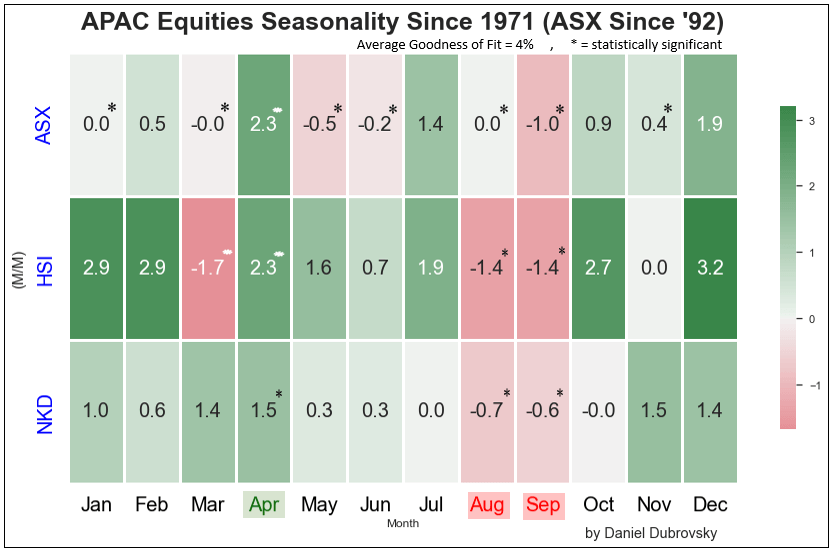
Wrapping up with Asia-Pacific markets, we will be analyzing the Nikkei 225 (Japan) and Hang Seng Index (Hong Kong) since 1971, along with the ASX 200 (Australia) since 1992.

Much like with Wall Street and European indices, April appears to have consistently and significantly been the best month for these APAC stock markets. The Nikkei 225, Hang Seng Index and ASX 200 averaged about 2% over the years.

Meanwhile, August and September have consistently and significantly been the worst periods. During these months, the indices returned -0.7% and -1% on average, respectively.

Like with other markets, the average goodness of fit was approximately 4%. Once again, while we can identify meaningful seasonality, by itself it did not do a good job of explaining how these markets performed in April, August and September over the years.

Nikkei 225, ASX 200, Hang Seng Index Monthly Seasonality

Should We Care About Seasonality in Stock Markets?

The takeaways from this deep dive can be split up into 4 key findings:

  1. Statistically significant seasonality is present in global stock markets
  2. April has consistently been the best month between the US, Europe and Asia
  3. September is the only month between all areas that has consistently disappointed
  4. Seasonality by itself has been a poor predictor of performance

For those with a keen eye, you might have noticed that October, November and December have historically been strong months for these global markets. But, as tested with the regression model, for the most part, these months have not been statistically significant.

With that in mind, while we can identify reoccurring patterns in global stock markets, which to a certain extent pours cold water on the “white noise” hypothesis, it probably will not hurt much to brush aside these effects in analyzing stock markets generally.