Bitcoin Price Action Setup: Down but Not Out

Bitcoin Price Action Setup: Down but Not Out

BITCOIN TECHNICAL OUTLOOK – BULLISH

The retreat in recent days in Bitcoin appears to be a consolidation rather than a reversal of the two-month-long uptrend, at least yet.

Bitcoin has pulled back from a tough barrier at the August 2022 high of 25200, near the 200-week moving average (now at about 25100) – a possibility highlighted in the previous update. See “Bitcoin doesn’t appear to be ripe for a bullish break just yet”, published Feb. 19. Moreover, as highlighted in recent weeks, BTC/USD needs to clear 25200 for the medium-term downward pressure to ease, including the August 2022 high. (See the mid-January update.)


BTC/USD Daily Chart
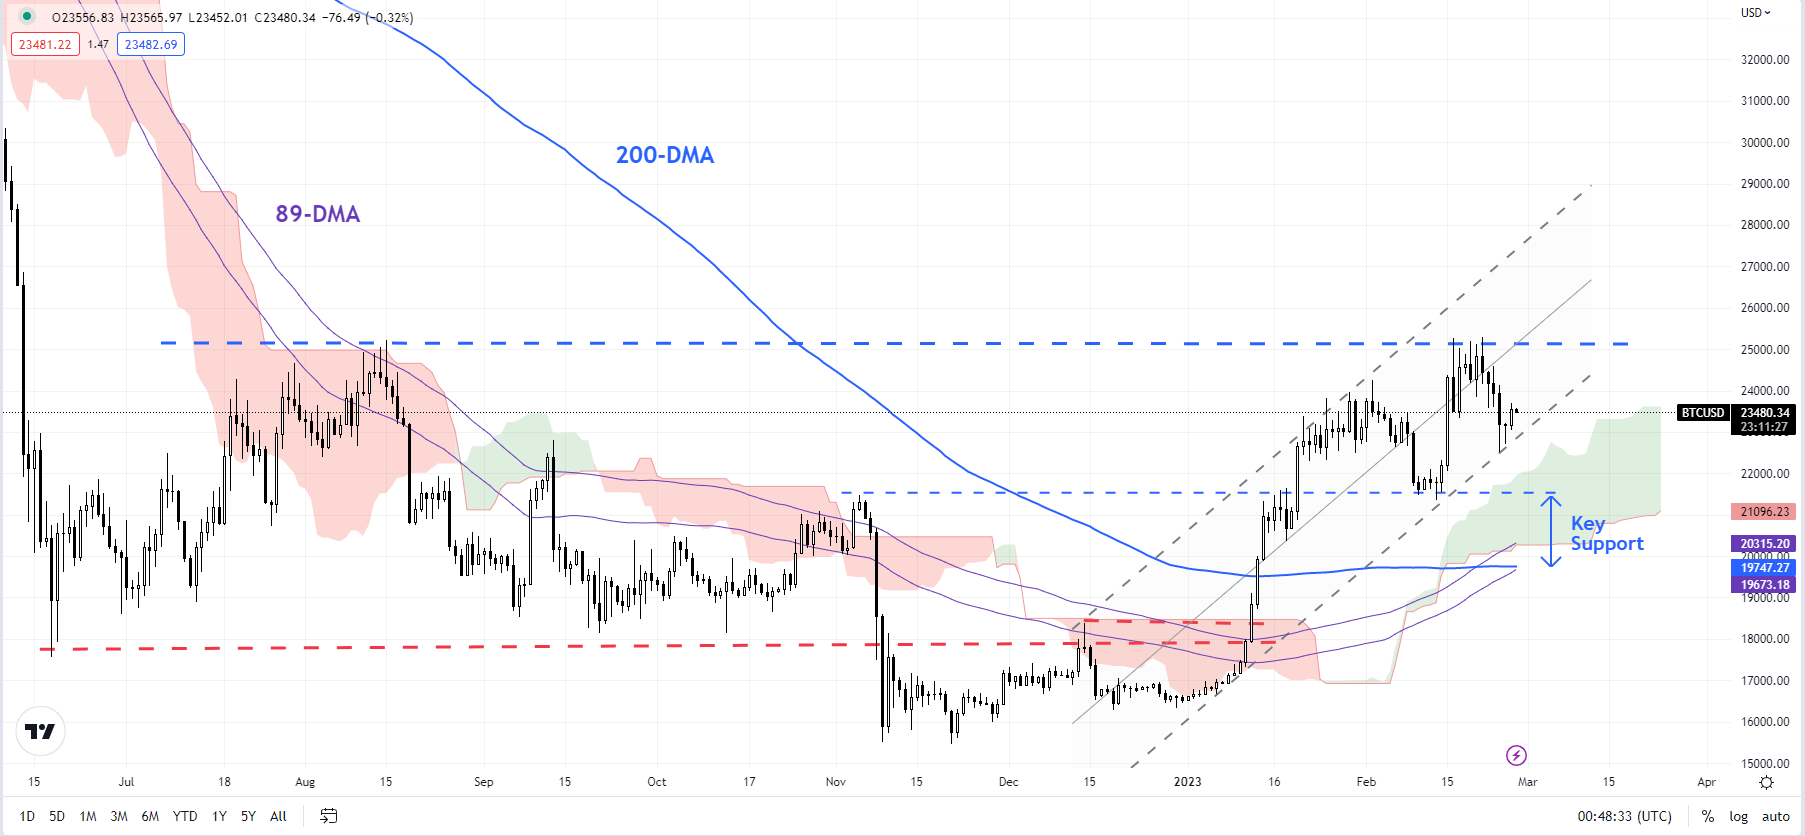
image1.png

Chart Created Using TradingView

Momentum on the daily charts has saturated given the pace and the extent of the rise since the start of the year, and the fall last week below immediate support on a horizontal trendline from late January at about 23800, confirms that the upward pressure has eased a bit. Overall, last week’s price action is further evidence that the mid-February jump was part of a broader consolidation that started earlier this month.

BTC/USD Daily Chart
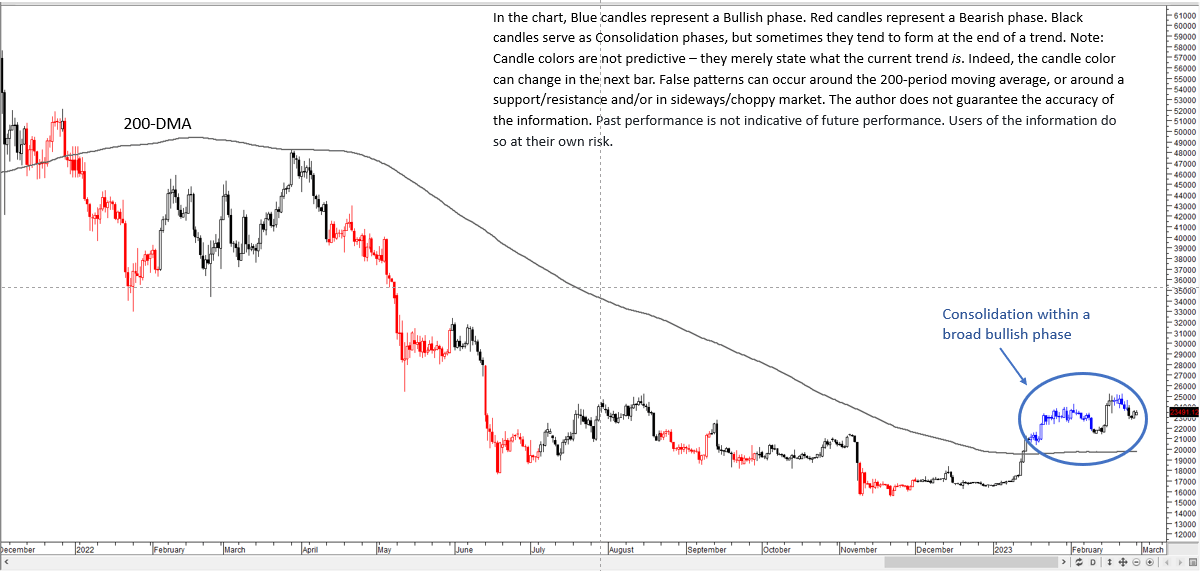
image2.png

The color-coded candlestick charts, based on trending/momentum indicators, suggest that the current softness is a consolidation phase within the overall bullish phase. If this is indeed the case, then BTC/USD needs to hold above immediate converged cushion at 19500-21400 (see the daily chart).

BTC/USD 240-minute Chart
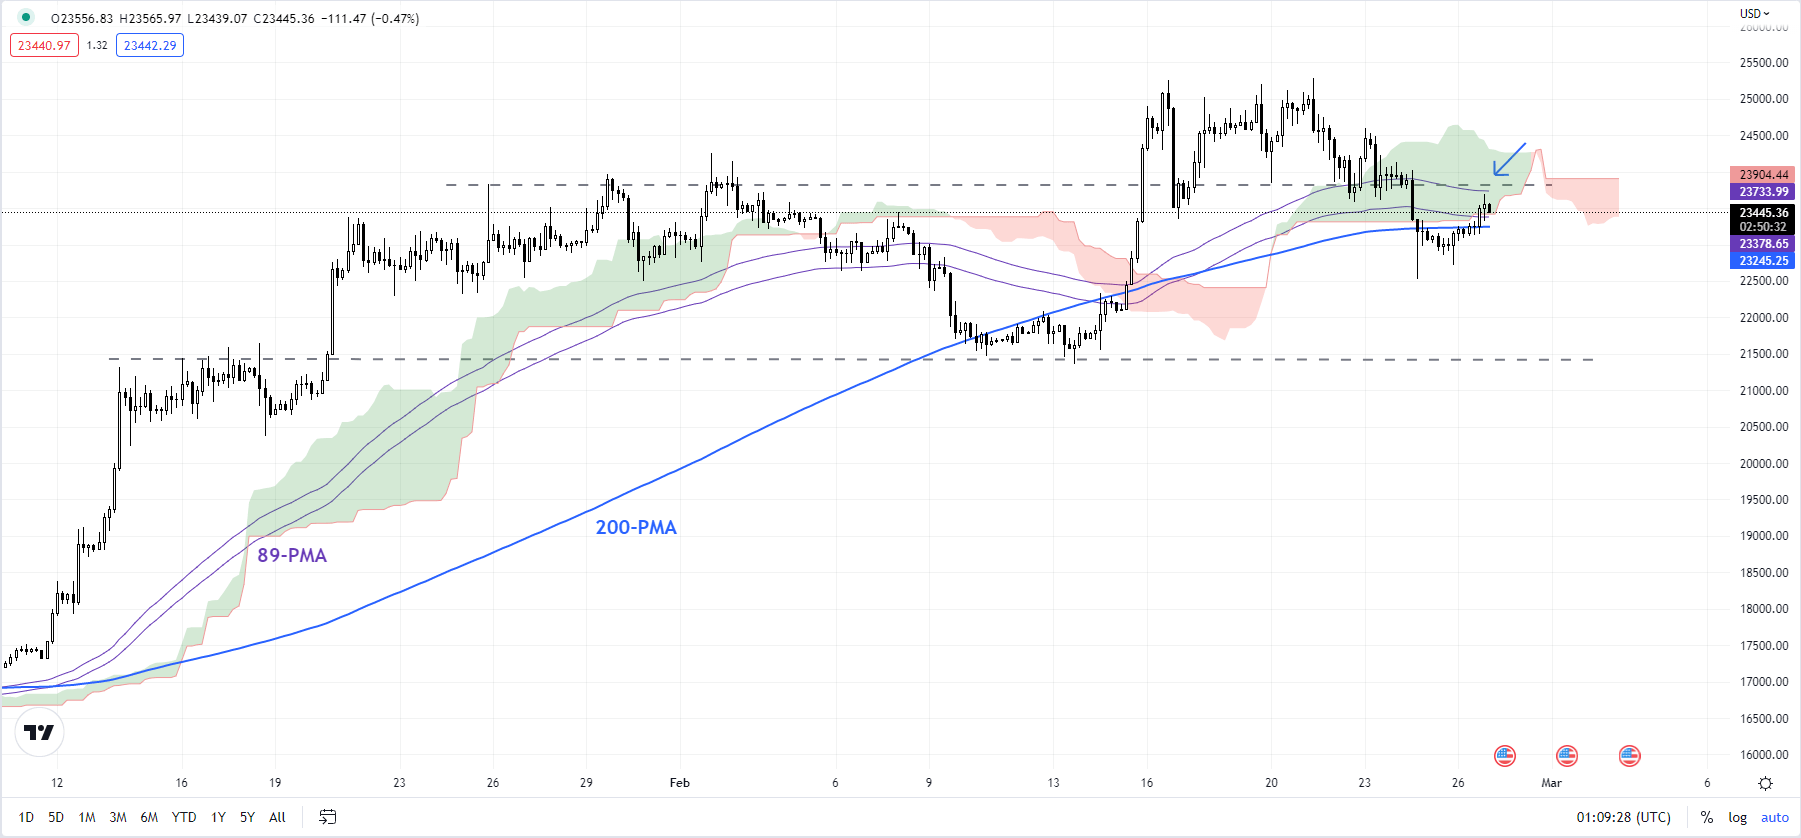
image3.png

Any break below the converged support would confirm that the two-month-long uptrend had reversed. Such a break would be part of the broader base-building pattern in cryptocurrencies since mid-2022 (See the mid-November update). In this regard, the Average True Range-based indicator on the weekly chart is showing tentative signs that the downtrend could be starting to reverse.

BTC/USD Weekly Chart
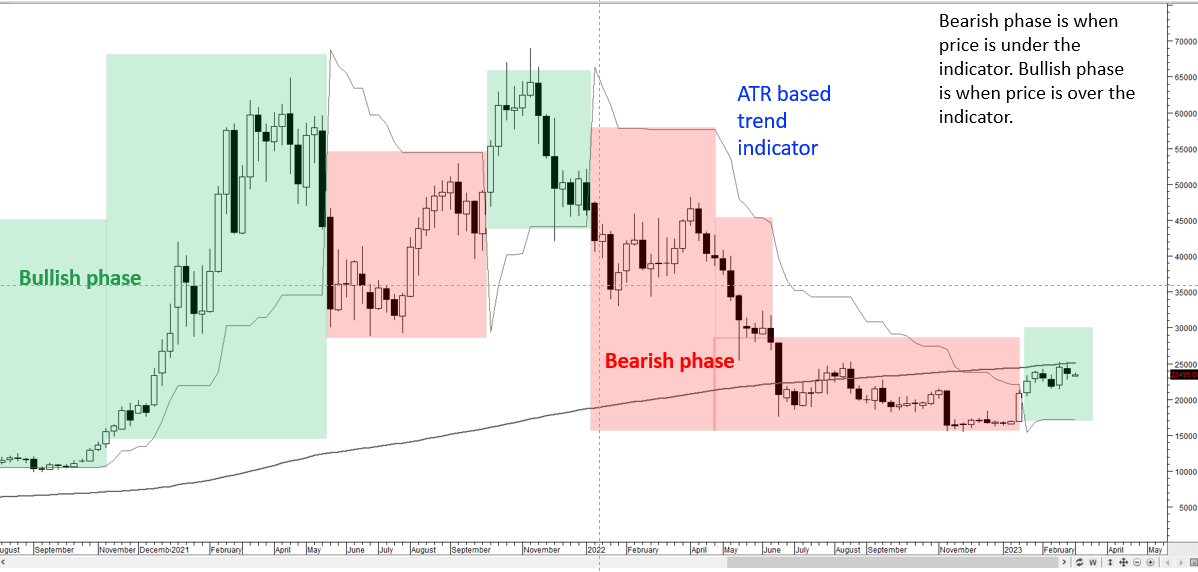
image4.png

US Dollar Holds the High Ground as Inflation Haunts Markets. Where to for USD?

US Dollar Holds the High Ground as Inflation Haunts Markets. Where to for USD?

The US Dollar has held onto the gains seen going into the close last week after a red-hot core US PCE print on Friday and Fed officials re-iterating their hawkishness.

To recap, the core US PCE index came in at 4.7% year-on-year to the end of January on Friday against 4.3% anticipated and 4.6% previously. This is regarded by the markets as the Fed’s preferred measure of inflation.

Risk assets are generally under pressure to start the week as the market contemplates the Fed funds rate path. 25 basis point hikes are now priced in for their next 3 meetings and the peak in this rate cycle is now 5.4%, rather than the 4.9% anticipated last month.

Fed board members Loretta Mester, James Bullard and Susan Collins all crossed the wires with hawkish comments over the weekend.

Treasury yields have held the higher levels seen on Friday with the 2-year note surging above 4.8% again, the highest level in 15-years.

APAC equities are mostly in the red to varying degrees today to reflect the negative US equity performance on Friday. Futures are pointing to a steady start for the Wall Street cash session later.

Currency markets have mostly had a quiet day so far with the Aussie and Kiwi Dollars dipping to reflect the risk aversion sentiment.

The G-20 meeting has wrapped up with no consensus on the wording of the communique. Russia and China objected to terminology and language around the Ukraine war.

Ignazio Visco, European Central Bank (ECB) Governing Council member and Bank of Italy Governor, made comments that rates will be as restrictive as necessary to deal with the inflation problem.

The firming of crude oil prices on Friday has been maintained today with the WTI futures contract near US$ 76 bbl and the Brent contract nudging toward US$ 83 bbl. Gold appears vulnerable as it trades down toward US$ 1,800 an ounce.

Incoming Bank of Japan Governor Ueda appeared in Japan’s parliament today and said that the current monetary policy stance is appropriate for now.

DXY (USD) INDEX TECHNICAL ANALYSIS

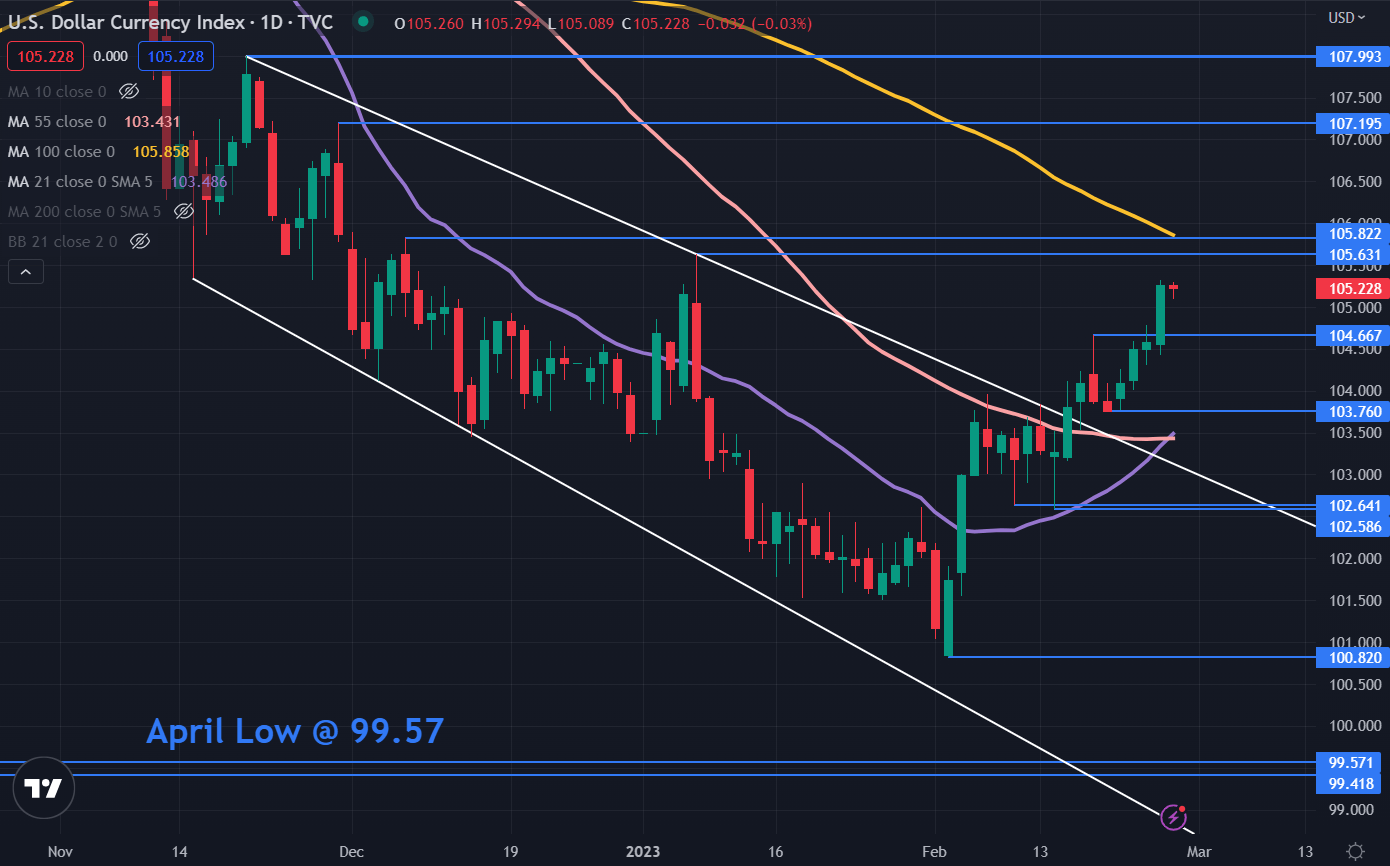
The DXY index has continued to surge higher after breaking out of a descending trend channel

The 21-day y simple moving average (SMA) has crossed above the 55-day SMA to generate a Golden Cross that may indicate that bullish momentum could evolve.

Resistance might be at the previous peaks of 105.63 and 105.82. The latter is also near the 100-day SMA which may lend resistance.

On the downside, support could be at the breakpoint of 104.67 ahead the prior lows of 103.76, 102.58 and 100.82.

image1.png


Australian dollar Price Setups: AUD/USD, AUD/JPY, EUR/AUD, AUD/SGD

Australian dollar Price Setups: AUD/USD, AUD/JPY, EUR/AUD, AUD/SGD

The Australian dollar is looking vulnerable against some of its peers as risk appetite takes a back seat amid the growing view that US interest rates could stay higher for longer.

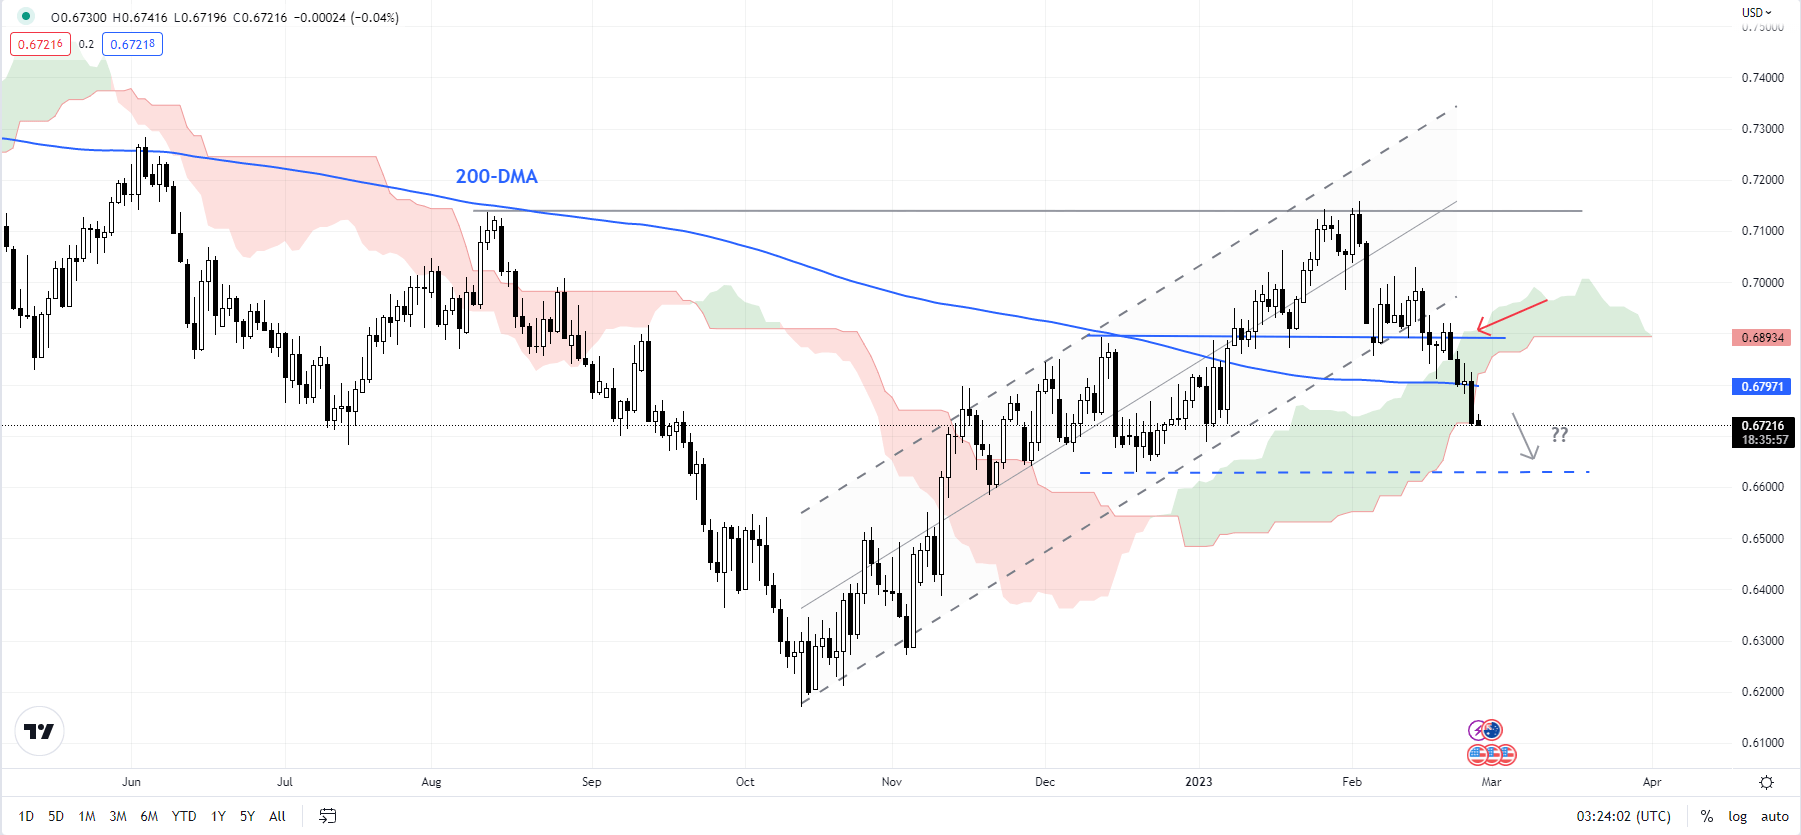
AUD/USD – Minor head & shoulders triggered

AUD/USD’s fall below significant support on a horizontal trendline from mid-January has at 0.6870 triggered a minor head & shoulders pattern (the left shoulder is the January 18 high, the head is the February 2 high, and the right shoulder is the February 14 high) with a price objective of 0.6580. Importantly, the drop below cushions on the 200-day moving average (DMA) and the 89-DMA confirms that the multi-week upward pressure has faded. Still, there is fairly strong support at the late-November low of 0.6585. AUD/USD needs to hold above the support for the four-month-long uptrend to remain intact.

AUD/USD Daily Chart

image1.png

Chart Created Using TradingView

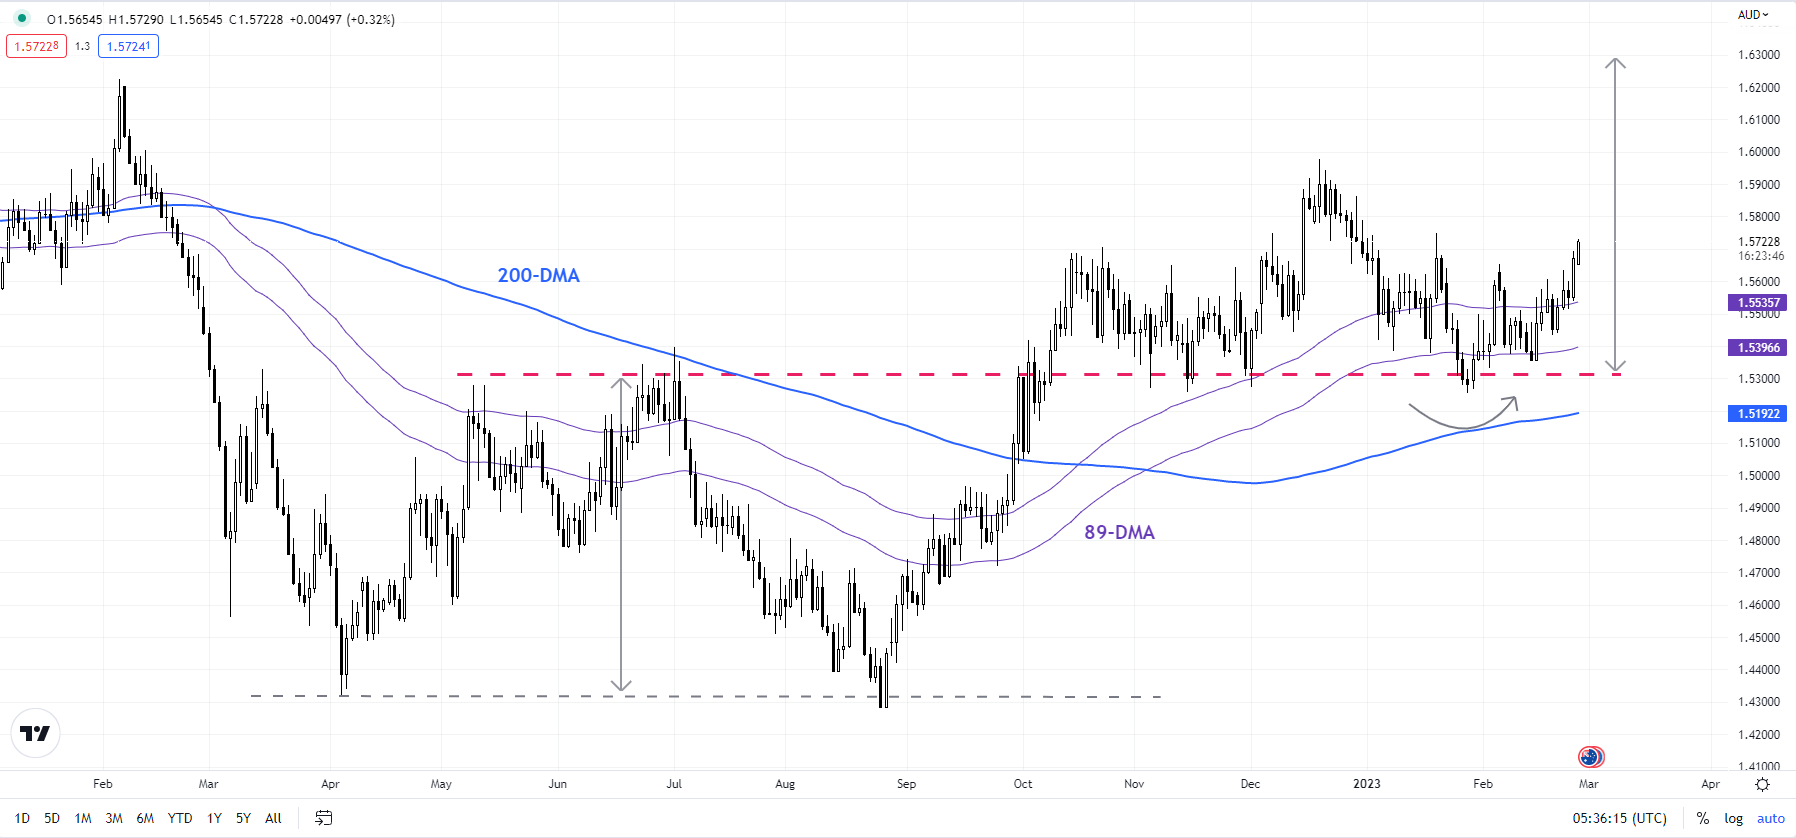
EUR/AUD: Double bottom points to more upside

EUR/AUD’s repeated hold above crucial support on a horizontal trendline from May at about 1.5315 confirms that the five-month-long uptrend remains intact. Any break above the immediate hurdle at the late-January high of 1.5750 could initially open the way toward the December high of 1.5980, followed by the February 2022 high of 1.6225. The break in October above key resistance at the July high of 1.5400 triggered a double bottom pattern (the April 2022 and the August 2022 lows) with a potential price objective of 1.6450.

EUR/AUD Daily Chart

image2.png

Chart Created Using TradingView

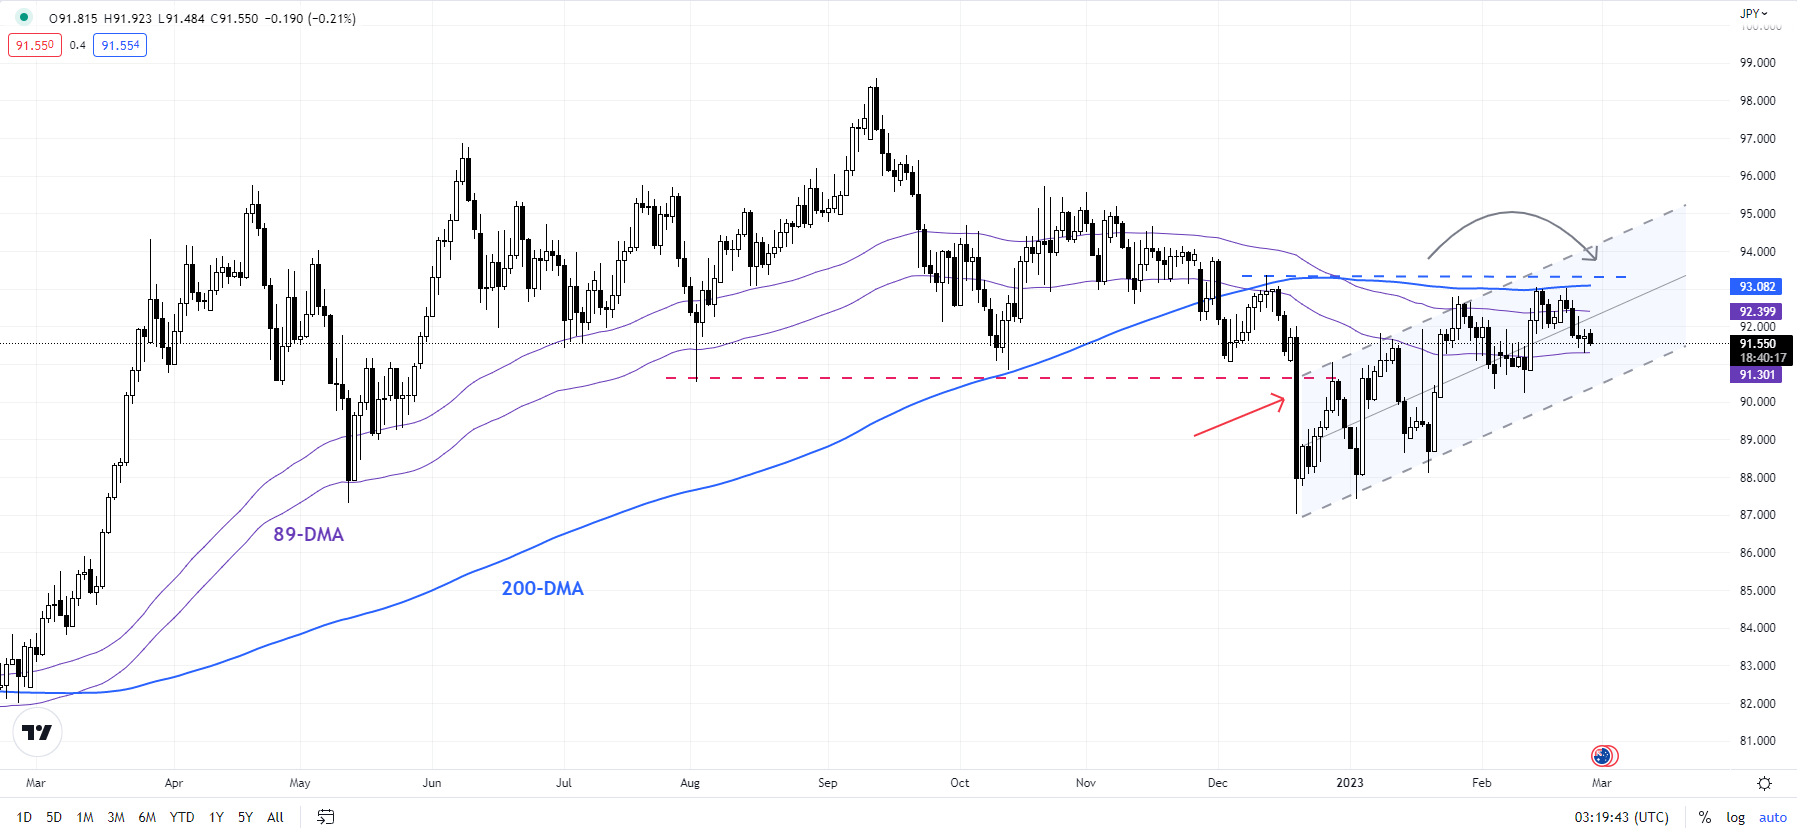
AUD/JPY – A potential double top

AUD/JPY’s choppy nature of the rebound since December suggests the rally is corrective after the cross failed to decisively break below the vital floor at the May low of 87.45. Failed attempts in recent weeks to break past the tough hurdle at the 200-DMA, coinciding with the mid-December high of 93.35 indicates that the rebound is running out of steam. Any break below the immediate cushion at the early-February low of 90.20 would trigger a minor double top (the January and the February highs), opening the way toward the December low of 87.10.

AUD/JPY Daily Chart

image3.png

Chart Created Using TradingView

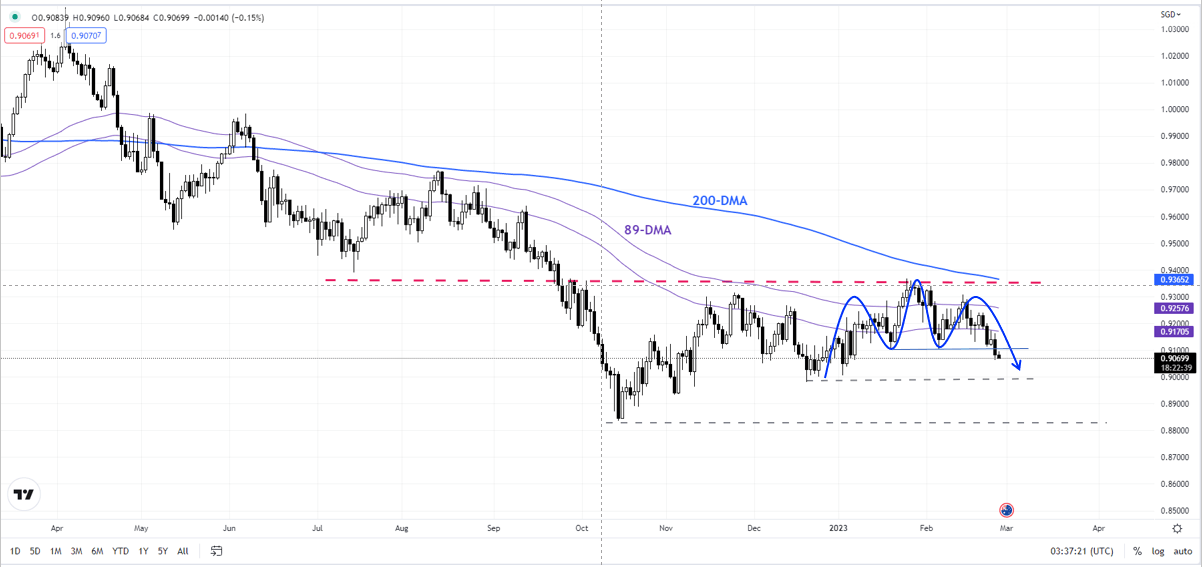
AUD/SGD: Minor head & shoulders pattern triggers

The rally since the end of 2022 looks corrective, rather than a reversal of the broader downtrend. Despite the rebound, AUD/SGD hasn’t been able to break past a solid barrier between the 89-DMA and the 200-DMA. Friday’s fall below the immediate cushion on a horizontal trendline from January at about 0.9100 has triggered a minor head & shoulders pattern (the left shoulder is the January 18 high, the head is the January 25 high, and the right shoulder is the mid-February high), potentially opening the way toward 0.8835. Importantly, any break below the December low of 0.8975 would trigger a double top (the end-2022 and the January highs), exposing downside risks toward the October low of 0.8820.


AUD/SGD Daily Chart


image4.png


One year of war in Europe: How the US dollar, energy and food prices swirled

One year of war in Europe: How the US dollar, energy and food prices swirled

LONDON : Russia’s invasion of Ukraine has disrupted economies and markets around the world, from energy and food prices to European banks, emerging market stocks and the Russian currency.

Below are five charts that show how Europe’s biggest conflict since World War Two has shaped global financial markets in the last 12 months.

1/THE SAFEST OF SAFE HAVENS

There are many reasons why king dollar reigned supreme in the past year and one is its status as the ultimate safe haven at times of uncertainty. The economic fallout of the war, which hit currencies such as the euro hard, also lifted the dollar.

The greenback is down from September’s two-decade highs, but it’s still up 8 per cent against a basket of currencies since the conflict began.

The impact on other safe havens such as governments bonds is complicated, however. Yes, U.S. and European bond prices rose in the days following Russia’s invasion as investors sought safety in top quality assets.

But they soon fell and yields soared as the war triggered an energy shock and inflation surged, while central banks responded with aggressive rate hikes. Germany’s 10-year Bund yield has risen to 2.4 per cent from just 0.2 per cent on Feb. 23, 2022.

Graphic: No knocking the dollar’s safe-haven crown https://www.reuters.com/graphics/UKRAINE-ANNIVERSARY/xmvjknkdqpr/chart.png

2/THE STING IN THE PIPELINE

The war in Ukraine brought with it an energy crisis like no other. Post-COVID-19 reopening had already sent prices for anything from oil to coal to natural gas higher. But when Russian tanks rolled into Ukraine in late February, European natural gas prices rocketed by almost 400 per cent in two weeks. By August, they were 700 per cent higher than a year earlier.

Pre-war, Russia supplied over 30 per cent of Europe’s gas, most of it through a network of pipelines, thousands of kilometres long. Once Western sanctions hit, the flows of gas dried up. Energy prices soared, bringing the threat of blackouts, recession and a worrying switch back to dirtier sources of fuel.

Thankfully, winter has proven mild and Europe has found other suppliers, bringing the gas price back to around 50 MWh, its lowest since August 2021. But, there’s a lag of around 6-9 months between what happens on the wholesale market and what happens to consumers’ bills, meaning last August’s punishing spike to almost 350 MWh – equivalent to an oil price of over $200 a barrel – hasn’t even begun to bite.

US dollar steady on higher-for-longer rates outlook; yen volatile

US dollar steady on higher-for-longer rates outlook; yen volatile

LONDON : The dollar index rose to seven-week highs on Friday, as investors prepared for U.S. interest rates to stay higher for longer after a set of strong U.S. economic data.

The yen fell after a volatile Asian trading session, with incoming Bank of Japan Governor Kazuo Ueda saying it was appropriate to keep ultra-loose monetary policy.

Strong U.S. jobs data and rhetoric from Federal Reserve officials this month about openness to higher rates if needed in the fight against inflation have resulted in the dollar erasing its year-to-date losses.

The dollar index – which measures the U.S. currency against six others – was 0.2 per cent higher at 104.80, its highest since Jan. 6. It was set for a fourth-straight weekly gain, having risen 2.5 per cent this month.

“The dollar notching its fourth-consecutive week of gains highlights just how far the U-turn in the market narrative has gone as data this week continues to highlight strength in the U.S. economy and its underlying inflation drivers,” Simon Harvey, head of FX Analysis at Monex, said.

This will likely be displayed yet again with January’s personal consumption expenditures price index – the Fed’s preferred inflation measure – due at 1330 GMT. But markets will likely wait for more Fed comments and February data for further rate hikes repricing, Harvey added.

Investors expect U.S. rates to peak in July at 5.35 per cent and remain above 5 per cent until the end of the year, having walked back expectations of a deep rate cut this year.

“We’re in a bit of a wait-and-see pattern in markets, with the dollar holding up firm and momentum largely driving minor moves in major currency pairs,” Harvey said.

The euro edged 0.1 per cent lower against the greenback at $1.0583, and sterling slipped 0.27 per cent against the dollar to $1.1985.

UEDA, JAPAN INFLATION

Incoming BOJ chief Ueda, who was nominated earlier this month in a surprise move, warned uncertainties regarding Japan’s economic recovery remained “very high”, which would warrant the BOJ maintaining its ultra-loose monetary policy.

The yen was volatile, weakening 0.45 per cent to 135.29 per dollar, after touching its highest since Monday in Asian trading hours.

“His neutral comments, coming against market’s hawkish expectations and together with the rising global yields, suggest the yen could embark on a weakening trend again once we are past this volatility,” said Charu Chanana, market strategist at Saxo Markets in Singapore.

Japan’s core consumer inflation hit a fresh 41-year high in January, putting renewed pressure on the central bank to phase out its massive stimulus programme.

Euro Price Forecast: German GDP Dampens Strong EZ Data This Week, US Core PCE in Focus

Euro Price Forecast: German GDP Dampens Strong EZ Data This Week, US Core PCE in Focus

EURO FUNDAMENTAL BACKDROP

The euro began the European trading session on the backfoot after worse than expected German GDP data (see economic calendar below) and GfK consumer confidence for March. The GDP numbers showed that the German economy contracted (-0.4%) in Q4 2022 and has brought back to the table “recessionary” talks.

EUR/USD ECONOMIC CALENDAR

image1.png

This week we have seen mixed data from the eurozone including strong PMI flash and economic sentiment statistics while core inflation for January proved sticker than anticipated driving hawkish bets for the upcoming European Central Bank (ECB) interest rate decisions. The probability for two consecutive 50bps rate hikes in March and May are slowly growing – see table below and could lead to upcoming support for the euro. Unfortunately for the euro, these strong fundamentals have not really translated through to the euro itself primarily due to heightening geopolitical tension around Russia/Ukraine and US/China playing into the safe haven component of the greenback.

From a USD perspective, the Fed’s preferred measure of inflation via the PCE price index will be in focus later today and is projected to come in marginally lower than the prior print. Anything in line or higher could result in some added support for the dollar which may be added to through subsequent Fed officials and Michigan consumer sentiment data.


image2.png

TECHNICAL ANALYSIS

EUR/USD DAILY CHART

image3.png

Chart prepared by Warren Venketas, IG

Daily EUR/USD price action shows the recent deceleration in USD strength which is now represented by a falling wedge pattern (black). Naturally, I will be looking for an upside breakout above wedge resistance considering this is associated with a bullish turnaround which would therefore exposed the 1.0700 handle and beyond.

From a bearish standpoint, a candle close below wedge support would likely invalidate the falling wedge and expose the 1.0500 psychological support level which could coincide with an oversold Relative Strength Index (RSI). Bulls will likely defend this zone should the euro fall to this level. Fundamentally, the eurozone seems to be far more resilient than initially thought leaving more room for euro strength than USD strength particularly if geopolitics play its part.

EUR/USD Subdued as US Dollar Retains Upper Hand, Gold Can’t Shake Off the Blues

EUR/USD Subdued as US Dollar Retains Upper Hand, Gold Can’t Shake Off the Blues

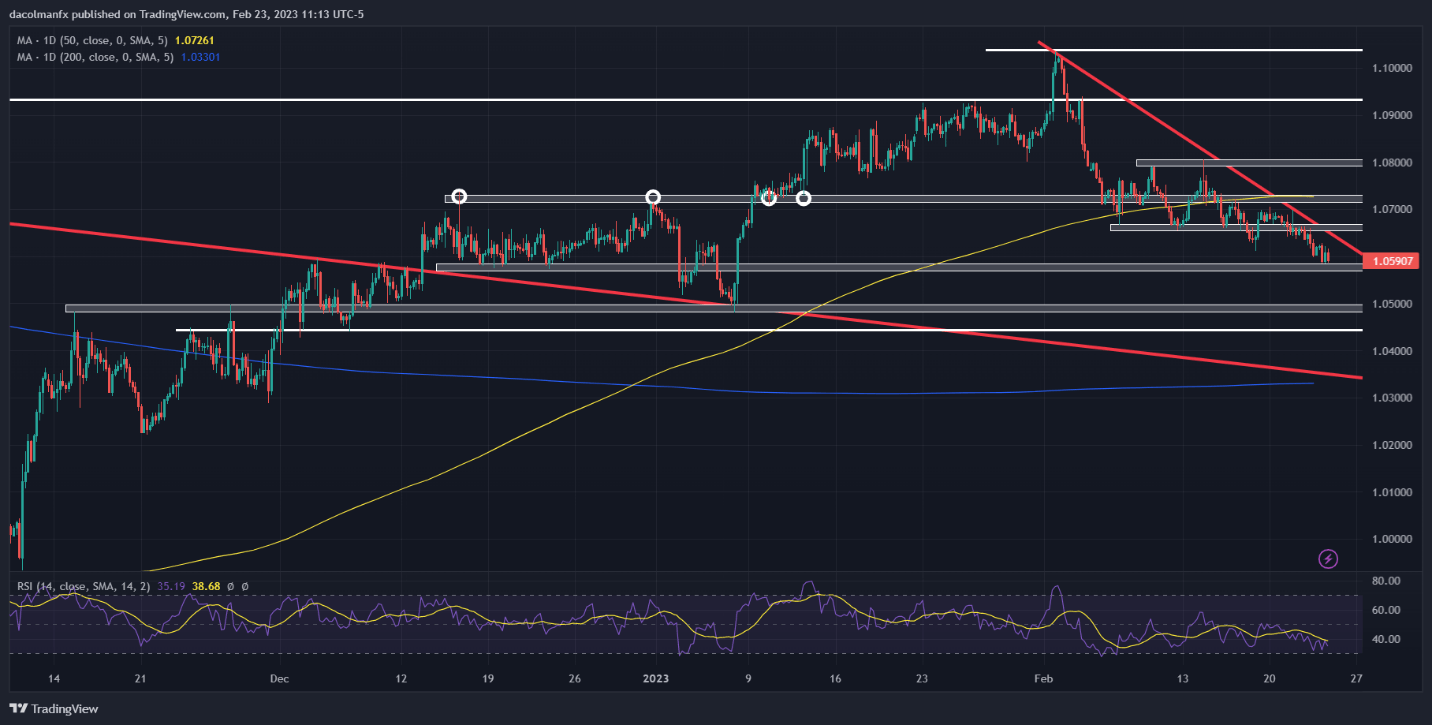
The US dollar, as measured by the DXY index, rose moderately on Thursday, touching seven-week highs near 104.70, as market sentiment remained fragile, depressing appetite for riskier currencies.

Against this backdrop, EUR/USD continued its descent, falling around 0.10% and breaking below the 1.0600 handle for the first time since early January. Gold prices also retreated, extending losses for the third consecutive session, and rapidly approaching the lowest level since December 30.

Looking ahead, there is reason to believe that the U.S. dollar could maintain leadership in the FX space, at least for some time, creating headwinds for both the euro and precious metals. This move is likely to be catalyzed by the continued rise in U.S. Treasury yields in response to the Federal Reserve’s assertive actions in its fight to restore price stability.

Sticky CPI, coupled with strong labor market data, have triggered a hawkish repricing of the FOMC‘s monetary policy outlook, leading Wall Street to discount a terminal rate of 5.37%, up from 4.90% at the beginning of the month. This essentially implies three additional 25 basis point hikes in the coming quarters.

The minutes of the central bank’s last gathering have reinforced current expectations. Based on the readout from Jan 31/Feb 1 meeting, policymakers remain committed to defeating chronically high inflation and anticipate further increases in borrowing costs, even if some officials are beginning to see greater risks of a recession.

All things being equal, the Fed’s hawkish stance should support the U.S. dollar in the short term by keeping nominal and real rates biased to the upside. This means that the euro and gold are standing on weak footing and could therefore extend their recent slump heading into March.

EUR/USD TECHNICAL ANALYSIS

After validating a double top pattern, EUR/USD has deepened its pullback, falling towards a key support slightly above 1.0575. If this area is breached on the downside in the coming days, sellers could launch an attack on the psychological 1.0500 level, followed by 1.0445. On the flip side, if price action reverses higher, trendline resistance appears near 1.0650. On further strength, the focus shifts to 1.0725.

EUR/USD TECHNICAL CHART

Chart  Description automatically generated


Bitcoin Falls as Nasdaq 100 Scores Wild Swings amid Fed Jitters, US PCE Data Ahead

Bitcoin Falls as Nasdaq 100 Scores Wild Swings amid Fed Jitters, US PCE Data Ahead

The Nasdaq 100 rallied at the cash open as solid corporate earnings from chipmaker Nvidia bolstered positive sentiment, but optimism was short-lived as sellers quickly returned to fade the strength in the equity space amid Fed jitters. In late afternoon-trading, the tech index, however, resumed its advance, but wild intraday fluctuations suggest traders are reluctant to maintain heavy exposure ahead of Friday’s U.S. PCE data.

Elevated volatility and unpredictable market swings undermined cryptocurrencies, causing Bitcoin (BTC/USD) to erase its morning advance and to slide into negative territory for the third session in a row, a move that reinforces the argument that stocks and digital assets are becoming increasingly more correlated, providing little diversification benefit.

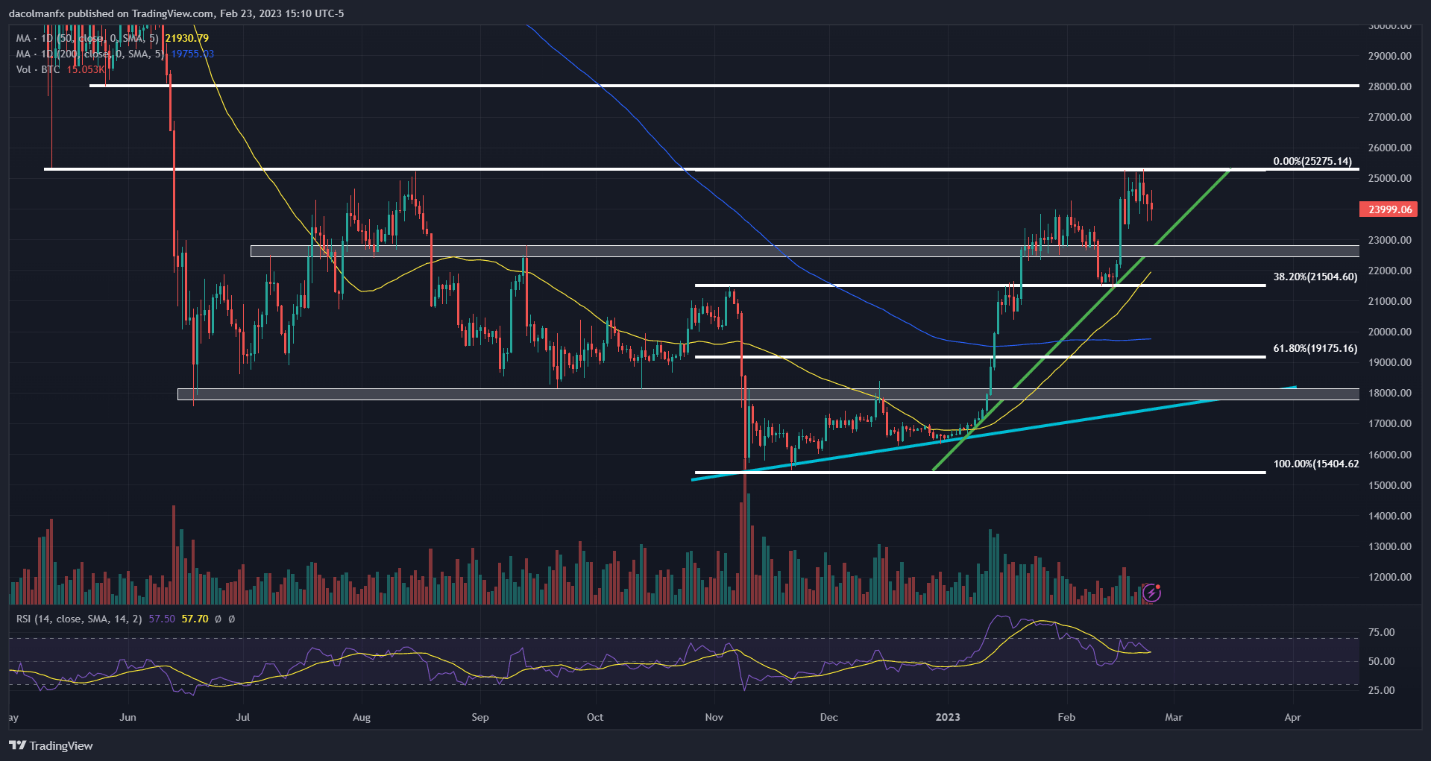
In any case, focusing on Bitcoin, the token has clearly run out of upside momentum following its solid performance in the early stages of 2023. In fact, prices have started to pull back after failing to break above $25,200, an area that has acted as a strong resistance in August last year.

While the recent pullback could be a temporary pause before the next leg higher, more technical evidence is needed to confirm that the worst in the crypto space is over and that Bitcoin could extend its near-term recovery.

BITCOIN TECHNICAL CHART

Chart, histogram  Description automatically generated

One signal that could point to a bullish continuation would be a clean and decisive topside breach of the $25,200 ceiling, especially if the move is accompanied by above-average volume. Such a breakout could attract new buyers to the market, at least in theory, setting the stage for a run towards the psychological $28,000 level.

On the other hand, if BTC/USD deepens its descent, traders should keep a close eye on trendline support crossing $23,000. If this floor is taken out, selling pressure could accelerate, creating the right conditions for a bearish slump towards $21,500, a pivotal support established by the 38.2% Fibonacci retracement of the November 2022/February 2023 rally.

With January Price Consumption Expenditure data on tap on Friday morning, volatility could spike heading into the weekend, causing sharp swings across assets. In terms of expectations, core PCE, the Fed’s favorite inflation indicator, is seen easing to 4.3% y-o-y from 4.4% y-o-y in December, a small but welcome directional improvement.

Recent economic data have shown that inflationary pressures remain sticky amid tight labor markets and resilient demand, so it is likely core PCE could surprise to the upside. This scenario may spark a risk-off move on Wall Street, weighing on stocks as well as cryptocurrencies.