Natural Gas Prices Rally the Most Over 2 Days Since November, Eyes on Resistance

Natural Gas Prices Rally the Most Over 2 Days Since November, Eyes on Resistance

Daily Chart – Best 2-Day Rally Since November

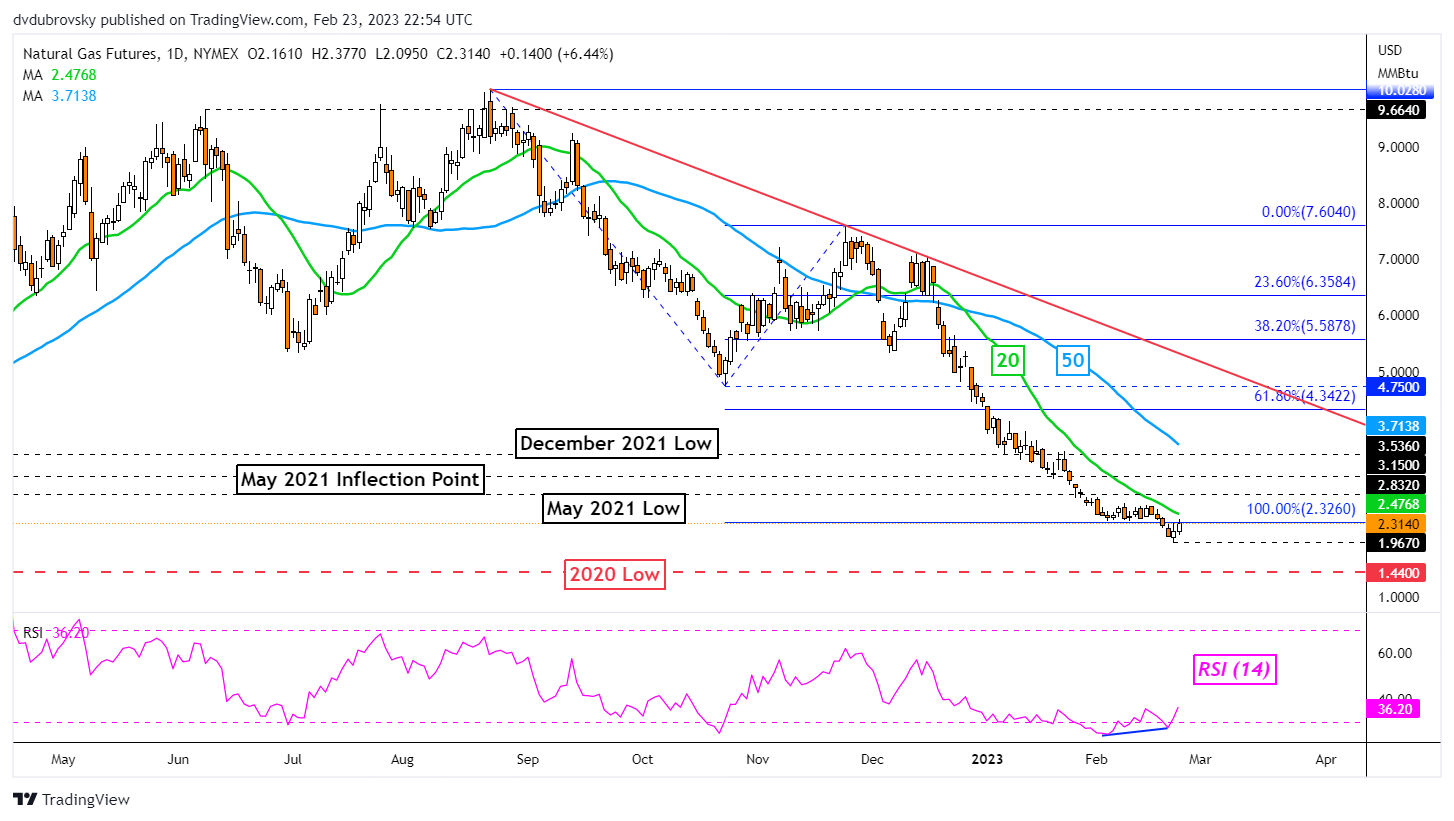
Over the past 2 days, natural gas prices rallied over 11.5 percent, marking the best 48-hour period since early November. This followed the presence of positive RSI divergence, showing that downside momentum was fading. Is the heating commodity reading for a reversal? Or will the broader downtrend prevail?

On the daily chart below, natural gas finds itself revisiting the 100% Fibonacci extension level at 2.326. This was after prices established a new low at 1.967 before turning higher. Broadly speaking, a bearish Head & Shoulders chart formation remains in play, offering a downward technical bias towards the 2020 low at 1.44.


Immediate resistance is at 2.326. Breaking higher exposes the 20-day Simple Moving Average (SMA). The latter is helping maintain the downward focus and could play out as key resistance. Extending higher exposes the May 2021 low at 2.832.

Daily Chart – Best 2-Day Rally Since November

4-Hour Chart – Back in the Rectangle

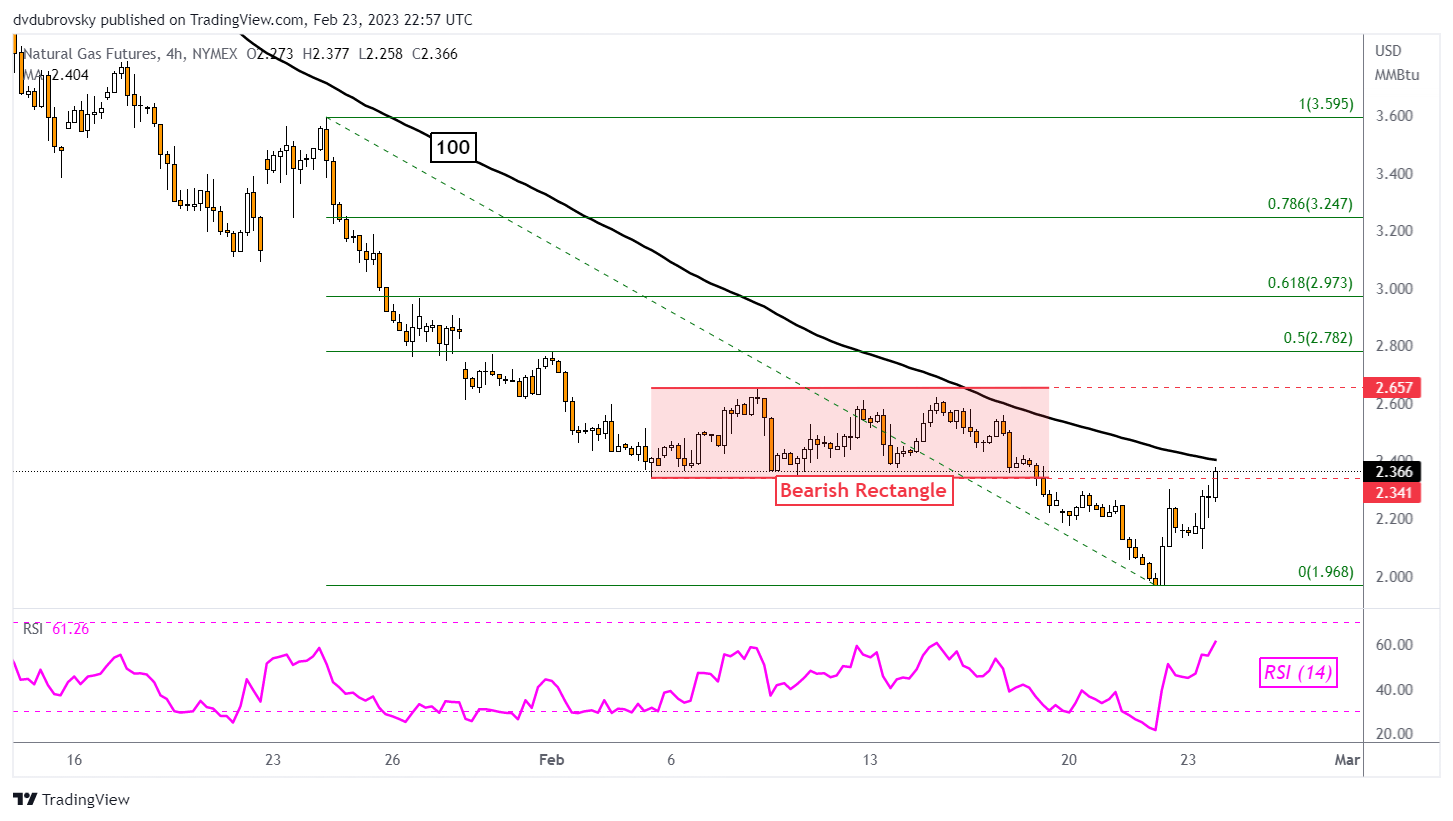
Zooming in on the 4-hour chart will give us a better idea of how the near-term bounce is shaping up. Natural gas closed back into the former bearish Rectangle from early February. The floor was at 2.341. Still, confirmation is lacking at the time of publishing. Meanwhile, prices are about to face the 100-period SMA, which could maintain the downside bias.

A turn lower back under 2.341 places the focus on the current February low at 1.968. Otherwise, clearing the SMA places the focus on the ceiling of the rectangle around 2.657. Confirming a push above the latter could offer an increasingly bullish perspective.

4-Hour Chart – Back in the Rectangle


US Dollar Price Action Setups: AUD/USD, EUR/USD, USD/JPY, GBP/USD

US Dollar Price Action Setups: AUD/USD, EUR/USD, USD/JPY, GBP/USD

AUD/USD Daily Chart – Head & Shoulders Breakout in Play

The US Dollar may be setting the stage to extend gains against the Australian Dollar. AUD/USD has confirmed a breakout under a bearish Head & Shoulders chart formation after taking out the neckline around 0.6893. Immediate support is the 38.2% Fibonacci retracement level at 0.6781. Breaking under this price could open the door to extending losses toward the 61.8% level at 0.6547. Meanwhile, a bearish Death Cross between the 20- and 50-day Simple Moving Averages (SMAs) is likely on the horizon.

AUD/USD Daily Chart – Head & Shoulders Breakout in Play

EUR/USD Daily Chart – Death Cross on the Horizon

The US Dollar may also be reading to continue its rise against the Euro. Looking at EUR/USD, a bearish Death Cross has formed between the 20- and 50-day SMAs. This followed a breakout under a bearish Rising Wedge chart formation that occurred back in January. Key support below appears to be the 38.2% Fibonacci retracement level at 1.0461. Beyond that is the midpoint at 1.0284. In the event of a turn higher, the SMAs could hold as resistance, maintaining the downside focus.

EUR/USD Daily Chart – Death Cross on the Horizon

USD/JPY Daily Chart – Golden Cross in Play

The US Dollar has been pushing higher against the Japanese Yen in recent weeks. Eyeing USD/JPY, a bullish Golden Cross is in play between the 20- and 50-day SMAs. This follows a breakout above a key falling trendline from October, opening the door to a bullish reversal. Key resistance is the 38.2% Fibonacci retracement level at 136.66, followed by the midpoint at 139.58. Meanwhile, immediate support is at the 23.6% level at 133.05 as the 20-day SMA creeps higher. The latter could maintain a near-term upside focus.

USD/JPY Daily Chart – Death Cross in Play

GBP/USD Daily Chart – Eyes on 100-day SMA

The US Dollar remains in a neutral setting against the British Pound. GBP/USD has been consolidating since the end of November as a key zone of resistance was established between 1.2293 and 1.2444. Meanwhile, prices have been consistently bouncing off support around 1.1951, which is the 23.6% Fibonacci retracement level. The 100-day SMA is fast approaching, which could reinstate an upside focus. Otherwise, extending lower would offer a bearish outlook for the pair, placing the focus on the 1.1639 – 1.1738 inflection zone.

GBP/USD Daily Chart – Eyes on 100-day SMA


British Pound Price Setup: GBP/USD Looks Fragile Ahead of US PCE Data

British Pound Price Setup: GBP/USD Looks Fragile Ahead of US PCE Data

The British pound is looking vulnerable as it tests crucial support against the US dollar ahead of the key US personal consumption expenditure price index data later today.

GBP/USD is near a vital converged floor of around 1.1840, including the early-January low, the 200-day moving average, and the lower edge of the Ichimoku cloud support. On the daily charts, the Plus Directional Movement Index (DMI) and Minus DMI remain below 25, pointing to range continued range conditions.

Price Facts, Sentiment, Narrative

image1.png

However, the uptick in downward momentum on intraday charts raises the odds of a break below 1.1840 – see the 240-minute color-coded candlestick chart based on trending/momentum indicators.As highlighted in the previous update, any break below would trigger a minor double top (the December and January highs), potentially opening the way toward 1.1250. More importantly, such a break would disrupt the higher-top-higher-bottom pattern formed since September.

GBP/USD Daily Chart

image2.png

The UK economy narrowly avoided a recession in the fourth quarter of last year, but recent upbeat UK manufacturing, services, and retail sales data indicate the economy could be more resilient than the actual numbers suggest. Money markets are starting to price in a third BOE rate hike to 4.75% by this summer (from the current Bank Rate of 4.00%), compared with two rate hikes before the turnaround higher in UK data from last week.

GBP/USD 240-minute Chart

image3.png

Meanwhile, recent strong US data have prompted markets to price in three more Fed rate hikes, with the terminal rate now seen slightly above 5.30% by July. So far, the BOE hinted rates are near peak, while the Fed stopped short of indicating a pause at the last FOMC meeting (minutes of the meeting published this week also seemed to carry a hawkish tilt).

GBP/USD 240-minute Chart

image4.png

Given that markets are fully pricing in 3 Fed rate hikes compared with 2 BOE rate hikes, the balance appears to be tilting in favour of USD. In this regard, US personal consumption expenditure price index data, Fed’s preferred inflation measure, due later today could provide some cues. US core PCE Index likely dropped to 4.3% on-year in January from 4.4% previously, but likely rose 0.4% on-month from 0.3% previously. A stronger-than-expected print could weigh on GBP/USD.

How to Read a Candlestick Chart

How to Read a Candlestick Chart

Reading candlestick charts – Talking points:

  • Candlestick charts differ greatly from the traditional bar chart
  • Traders generally prefer using candlestick charts for day-trading because they offer an enjoyable visual perception of price
  • It’s important to understand the key components of a candle, and what they indicate, to apply candlestick chart analysis to a trading strategy

What is a candlestick chart?

A candlestick chart is simply a chart composed of individual candles, which traders use to understand price action. Candlestick price action involves pinpointing where the price opened for a period, where the price closed for a period, as well as the price highs and lows for a specific period.

Price action can give traders of all financial markets clues to trend and reversals. For example, groups of candlesticks can form patterns which occur throughout forex charts that could indicate reversals or continuation of trends. Candlesticks can also form individual formations which could indicate buy or sell entries in the market.

The period that each candle depicts depends on the time-frame chosen by the trader. A popular time-frame is the daily time-frame, so the candle will depict the open, close, and high and low for the day. The different components of a candle can help you forecast where the price might go, for instance if a candle closes far below its open it may indicate further price declines.

Boost your chart patterns expertise with our interactive quiz!

Our Forex Trading Patterns Quiz will test your knowledge of some of the most important trading patterns. Take the test today by clicking on the link and raise your technical analysis game!

Interpreting a candle on a candlestick chart

The image below represents the design of a typical candlestick. There are three specific points (open, close, wicks) used in the creation of a price candle. The first points to consider are the candles’ open and close prices. These points identify where the price of an asset begins and concludes for a selected period and will construct the body of a candle. Each candle depicts the price movement for a certain period that you choose when you look at the chart. If you are looking at a daily chart each individual candle will display the open, close, upper and lower wick of that day.
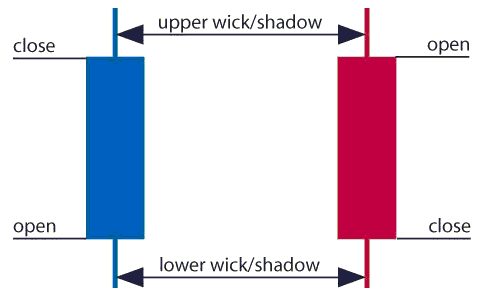
A red and a blue candlestick with open and close wicks

Open price:

The open price depicts the first price traded during the formation of the new candle. If the price starts to trend upwards the candle will turn green/blue (colors vary depending on chart settings). If the price declines the candle will turn red.

High Price:

The top of the upper wick/shadow indicates the highest price traded during the period. If there is no upper wick/shadow it means that the open price or the close price was the highest price traded.

Low Price:

The lowest price traded is the either the price at the bottom of the lower wick/shadow and if there is no lower wick/shadow then the lowest price traded is the same as the close price or open price in a bullish candle.

Close Price:

The close price is the last price traded during the period of the candle formation. If the close price is below the open price the candle will turn red as a default in most charting packages. If the close price is above the open price the candle will be green/blue (also depends on the chart settings).

The Wick:

The next important element of a candlestick is the wick, which is also referred to as a ‘shadow’. These points are vital as they show the extremes in price for a specific charting period. The wicks are quickly identifiable as they are visually thinner than the body of the candlestick. This is where the strength of candlesticks becomes apparent. Candlesticks can help traders keep our eye on market momentum and away from the static of price extremes.

Direction:

The direction of the price is indicated by the color of the candlestick. If the price of the candle is closing above the opening price of the candle, then the price is moving upwards and the candle would be green (the color of the candle depends on the chart settings). If the candle is red, then the price closed below the open.

Range:

The difference between the highest and lowest price of a candle is its range. You can calculate this by taking the price at the top of the upper wick and subtracting it from the price at the bottom of the lower wick. (Range = highest point – lowest point).

Having this knowledge of a candle, and what the points indicate, means traders using a candlestick chart have a clear advantage when it comes to distinguishing trendlines, price patterns and Elliot waves.

Bar Chart vs Candlestick Chart

As you can see from the image below, candlestick charts offer a distinct advantage over bar charts. Bar charts are not as visual as candle charts and nor are the candle formations or price patterns. Also, the bars on the bar chart make it difficult to visualize which direction the price moved.
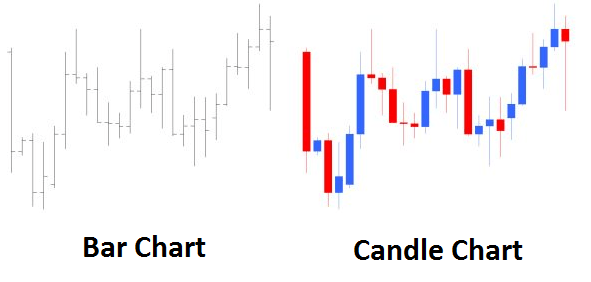
Difference between bar chart and candle chart

How to read a candlestick chart

There are various ways to use and read a candlestick chart. Candlestick chart analysis depends on your preferred trading strategy and time-frame. Some strategies attempt to take advantage of candle formations while others attempt to recognize price patterns.

Interpreting single candle formations

Individual candlesticks can offer a lot of insight into current market sentiment. Candlesticks like the Hammer, shooting star, and hanging man, offer clues as to changing momentum and potentially where the market prices maytrend.

As you can see from the image below the Hammer candlestick formation sometimes indicates a reversal in trend. The hammer candle formation has a long lower wick with a small body. Its closing pricing is above its opening price. The intuition behind the hammer formation is simple, price tried to decline but buyers entered the market pushing the price up. It is a bullish signal to enter the market, tighten stop-losses or close out a short position.

Traders can take advantage of hammer formations by executing a long trade once the hammer candle has closed. Hammer candles are advantageous because traders can implement ‘tight’ stop-losses (stop-losses that risk a small amount of pips). Take-profits should be placed in such a way as to ensure a positive risk-reward ratio. So, the take-profit is larger than the stop-loss.
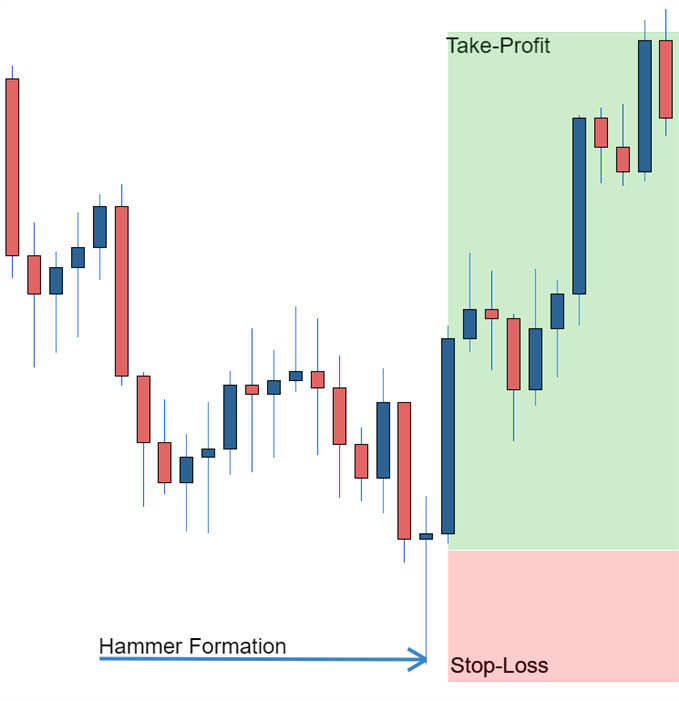
Hammer formation showing stop loss

Recognizing price patterns in multiple candles

Candlestick charts help traders recognize price patterns that occur in the charts. By recognizing these price patterns, like the bullish engulfing pattern or triangle patterns you can take advantage of them by using them as entries into or exit signals out the market.

For example, in the image below we have the bullish engulfing price pattern. The bullish engulfing is a combination of a red candle and a blue candle that ‘engulfs’ the entire red candle. It is an indication that it could be the end of a currency pairs established weakness. A trader would take advantage of this by entering a long position after the blue candle closes. Remember, the price pattern only forms once the second candle closes.

As with the hammer formation, a trader would place a stop loss below the bullish engulfing pattern, ensuring a tight stop loss. The trader would then set a take-profit. For more forex candlestick charts check our forex candlesticks guide where we go in depth into the advantages of candlestick charts as well as the strategies that can be implemented using them.
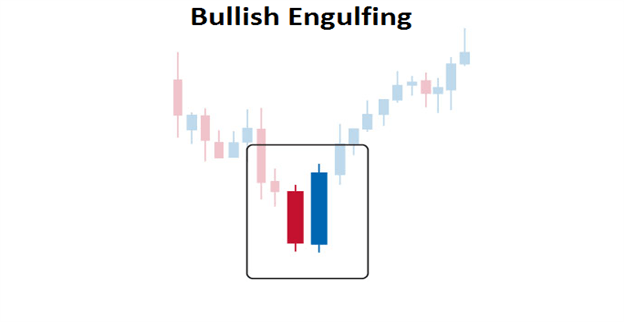
Bullish engulfing pattern

Further tips for reading candlestick charts

 

Gold Price Forecast: Bulls Face a Challenge Ahead US PCE Data

Gold Price Forecast: Bulls Face a Challenge Ahead US PCE Data

Gold (XAU/USD) FUNDAMENTAL BACKDROP

Gold prices declined yesterday printing a fresh low around the $1817 mark in the US session. Overnight buying pushed the precious metal back toward the $1825 handle with the European open facilitating further declines (trading at $1820 at the time of writing).

Gold bulls remain sidelined at present with the dollar keeping any attempted move to the upside in check. The dollar index has surprisingly continued its move higher despite further rate hikes and a higher peak rate from the US Federal Reserve largely priced in by market participants. Gold appears to be in need of a catalyst if we are to see an upside bounce be sustainable at this stage as we have seen repeated attempts at a push higher this week halted by Dollar strength.

Currency Strength Chart: Strongest – GBP, Weakest – AUD

Chart, histogram  Description automatically generated

Later today we have a host of US data releases and a few Fed policymakers speaking. This does not bode well for gold prices as yesterdays revised PCE number and positive jobs data hint at continued strength in the US economy which could be confirmed further by the final Michigan Consumer Sentiment number. The key lies with the PCE data (Fed’s preferred gauge of inflation) with forecasts eyeing a print of 4.3%. Should we get a higher print gold could face a further challenge and retest the weekly low at $1817 and potentially head toward the $1800 Handle.

image2.pngimage3.pngimage4.png

TECHNICAL OUTLOOK

From a technical perspective, Gold is on course for its fourth consecutive day of losses. The RSI is however approaching oversold territory and downside momentum does seem to be on the wane with yesterday doji candle close hinting at potential for reversal.

A daily candle close above yesterday’s high at $1834 is needed if we are to see further upside while immediate intraday resistance rests at $1825 and the $1830 handles respectively. Alternatively, a push lower may find resistance at the weekly low of $1817 and further down the key psychological $1800 mark.

Gold (XAU/USD) Daily Chart – February 24, 2023

Graphical user interface, chart  Description automatically generated


GBP/USD bounces off daily low, flat-lines below mid-1.2000s ahead of US data

GBP/USD bounces off daily low, flat-lines below mid-1.2000s ahead of US data

The GBP/USD pair meets with a fresh supply following an intraday uptick to the 1.2075 region and drops to a fresh daily low during the mid-European session. Spot prices manage to rebound from the vicinity of the 1.2000 psychological mark and now seem to have stabilized in neutral territory, just below the 1.2050 area.

The US Dollar remains pinned near a multi-week high, which, in turn, is seen as a key factor exerting some downward pressure on the GBP/USD pair. The FOMC meeting minutes released on Wednesday reaffirmed market expectations that the US central bank will continue to continue to tighten its monetary policy to tame stubbornly high inflation. Furthermore, the recent upbeat US macro data pointed to an economy that remains resilient despite rising borrowing costs and should allow the Fed to stick to its hawkish stance.

In fact, the markets are now pricing in at least a 25 bps lift-off at the next three FOMC policy meetings. This, in turn, assists the US Treasury bond yields to hold steady near the YTD peak and continues to underpin the Greenback. That said, a modest recovery in the global risk sentiment – as depicted by a generally positive tone around the equity markets – keeps a lid on the safe-haven buck. Apart from this, rising bets for additional interest rate hikes by the Bank of England (BoE) contribute to limiting losses for the GBP/USD pair.

The UK PMIs released on Tuesday indicated that business activity rose more than expected in February and fueled optimism that the country may be able to avoid a steep economic downturn. This, in turn, could persuade the BoE to keep its foot on the accelerator in its race against inflation. Hence, it will be prudent to wait for a sustained break below the 1.2000 mark before confirming that the GBP/USD pair’s recent bounce from a technically significant 200-day Simple Moving Average (SMA) has already run out of steam.

Next on tap is the US economic docket, featuring the release of the Prelim (second estimate) Q4 GDP print and the usual Weekly Initial Jobless Claims. Traders will further take cues from comments by influential FOMC members – Atlanta Fed President Raphael Bostic and San Francisco Fed President Mary Daly. This, along with the US bond yields and the broader risk sentiment, will drive the USD and provide some impetus to the GBP/USD pair.

GBP/USD: Quick drop to major support at 1.1860 on a loss of support in the low-1.19s

GBP/USD: Quick drop to major support at 1.1860 on a loss of support in the low-1.19s

GBP/USD is trading little changed on the session but has lost a cent or so from yesterday’s peak. Economists at Scotiabank expect the pair to suffer a susbtantial drop to 1.1860 on failure to hold the above the low-1.19s.

Technical undertone for GBP/USD is bearish

“The GBP is tracking a little softer on the short-term charts and the technical undertone for GBP/USD is bearish. But the Pound is still trading above recent lows and key (longer term) support defined by the convergence of the 100 and 200-day MA signals at 1.1930/35.”

“Scope for GBP gains is limited (firm resistance at 1.2140/50 now) and loss of support in the low 1.19s will target a quick drop to major support at 1.1860 (Jan low).”

GBP/USD Wilts Toward Key Retracement As Rate Prospects Support USD

GBP/USD Wilts Toward Key Retracement As Rate Prospects Support USD

GBP/USD FUNDAMENTAL BACKDROP

GBP/USD remains under significant pressure in Thursday’s European session, with most of that coming from the ‘USD’ side of the pair.

Wednesday’s release of minutes from the US Federal Reserve’s last interest-rate setting meet on January 1 showed the central bank in perhaps rather more hawkish mood than the markets had expected, and warning again that interest rates might have to remain higher for longer in order to bring inflation to heel.

Policymakers are worried that China’s emergence from its more draconian Covid-lockdown measures, along with Russia’s ongoing war in Ukraine, will increase the upward pressure on global prices. The Fed raises borrowing costs by a quarter of a percentage point last month.

Its outlook had its predictable strengthening effect on the US Dollar, with sterling particularly hard hit.

UK ECONOMY OFFERS FEW SIGNS OF HOPE

The UK of course has its own inflationary problems, but, given the underlying fragility of the economy, the Bank of England is felt to have less room to raise borrowing casts without causing a significant recession. Growth data have shown that the country just scraped some growth at the end of lastly year, but the BoE still worries that contraction will be unavoidable in 2023.

BoE Monetary Policy Committee member Catherine Mann said on Thursday that it was too soon to say whether the risks posed by last year’s inflation surge had peaked and that the central bank should continue to raise rates.

GBP/USD rose to six months peaks at the end of last year, as markets hoped that the end of US rate rises might be within sight. However, it has slid consistently since as the data have forced a rethink of that view.

Market focus for the remainder of Thursday will likely be on official revisions to US Gross Domestic Product data for last year’s final quarter. Growth is expected to be adjusted downward from the 3.2% initially estimated.

GBP/USD TECHNICAL ANALYSIS

image1.png

Chart Compiled by David Cottle Using TradingView

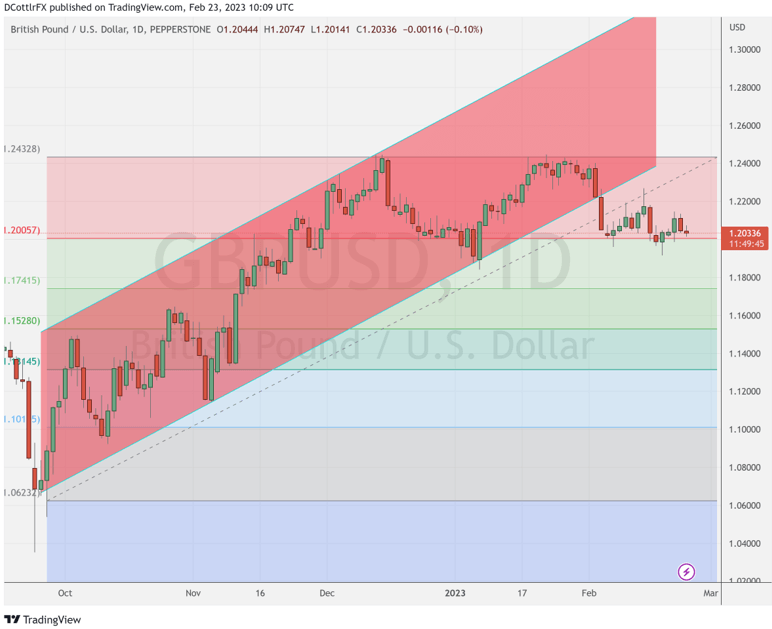
Brave breed that they are, sterling bulls are clearly mounting a dogged defence at the first Fibonacci retracement of GBP/USD’s rise from the lows of last September to those December, six-month peaks.

That comes in at a $1.20057, a level at which the pair has bounced since February 3.

It’s clearly an important point to watch now, and sterling’s ability to stay above it in to this week’s close could be interesting. Should it fail, immediate focus will be on January 6’s intraday low of 1.18456. That point the start of a significant bounce, but should it give way, the second retracement level of 1.17415 will be in the bears’ sights.

They seem to have control at the moment, with GBP/USD showing a clear inability to break its nascent downtrend. IG Sentiment data offers little hope, with fully 65% of traders bearish on Sterling.

US Dollar Slides After FOMC Boost as Hikes Get Baked in. Is There a New Trend for USD?

US Dollar Slides After FOMC Boost as Hikes Get Baked in. Is There a New Trend for USD?

The US Dollar pulled back from overnight gains posted after the Federal Open Market Committee (FOMC) meeting minutes revealed a united board that supported the 25 basis point move at the gathering earlier month

The minutes reinforced the notion that the Fed is determined to get inflation under control and that any rate cuts are a long way off. This is something that they have verbalised on many occasions but perhaps has not been fully comprehended by markets.

The interest rate swap and futures markets now have 25 bp hikes for the next three FOMC meetings in March, May and June. Treasury yields are slightly softer with the hope that the Fed will get inflation under control further down the track.

New York Fed President John Williams was also on the wires yesterday and reiterated his hawkish stance as he emphasised the need to get price pressures under control.

In an interview on Bloomberg television, Band of International Settlements (BIS) Settlements CEO Augustin Carstens said that fiat currencies have won the battle over cryptocurrencies. Bitcoin remains below USD 25,000, trading near USD 24,600 at the time of going to print.

The Bank of Korea (BoK) left rates unchanged at 3.50% despite CPI currently running at 5.2% y/y. BoK Governor Rhee Chang-yong said in the post-decision press conference that more hikes can still happen despite the pause. Nonetheless, USD/KRW dipped under 1300.00.

The Australian Dollar has been the best-performing currency today after private capital expenditure data showed growth of 2.2% q/q over 4Q 2022 rather than the 1.0% forecast. The prior quarter was also revised up to 0.6% from -0.6%

Crude oil steadied after heavy losses yesterday with the WTI futures contract back above US$ 74 bbl and the Brent contract nudging US$ 81 bbl.

APAC equities have had a quiet day with Japan on holiday and futures are indicating a solid start to the Wall Street session later today.

Elsewhere, China instructed state-owned enterprises to stop using the top 4 auditing firms Deloitte, EY, KPMG and PWC.

The directive comes after Beijing agreed to auditors examining the books of Chinese firms listed on US exchanges last year. This action prevented these companies from being kicked out of the US.

Looking ahead, after Euro-wide CPI, US GDP data will be keenly watched by the market.

DXY (USD) INDEX TECHNICAL ANALYSIS

The DXY index broke above a descending trend channel and has consolidated above it, which might suggest that the bearish trend could be pausing or might be over.

Fortifying the break, the price also moved above 10-, 21- and 55-day simple moving averages (SMA). This could suggest that bullish short and medium term is potentially evolving.

The longer-term 100- and 200-day SMAs hang above the price and a move above these may confirm unfolding bullish and that a new is possibly emerging.

Resistance might be at the prior peaks of 104.67, 105.63 and 105.82. On the downside, support could be at the previous lows and breakpoints of 102.58, 101.30 and 100.82.

image1.png

When Can S&P 500 Volatility Break a Stock Diversification Strategy? Analyzing the VIX

When Can S&P 500 Volatility Break a Stock Diversification Strategy? Analyzing the VIX

What is Stock Sector Diversification?

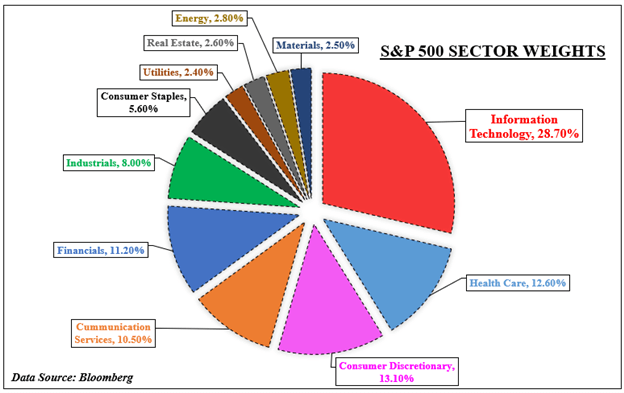
If an investor wants to diversify exposure in the US stock market, there are plenty of sectors to choose from in the S&P 500. On the pie chart below, there are 11 to pick that range from growth-oriented information technology to value-centered industrial firms. To hedge against sector-specific risks, a trader could spread out their portfolio between some combination of these.

In such a case, if the S&P 500 hits a bump, losses in one corner of the market might be offset or be reduced by gains in another. This might work if all the sectors in the market are not falling in unison. However, when almost every corner of the index is declining in a binary move, a stock diversification strategy becomes increasingly unreliable.

This is not a case against a stock diversification strategy. Rather, this is analyzing conditions in the market that impact sectors moving together in the S&P 500. This is performed using the CBOE Volatility Index (VIX), also known as the market’s preferred ‘fear gauge’. With that in mind, what levels of VIX should traders and investors watch that risk undermining a stock diversification strategy?

S&P 500 Sector Breakdown

S&P 500 Sectors

What is the VIX and Why Should Traders Watch it?

The VIX was created in 1990 to use as a benchmark for analyzing volatility projections in the US stock market. It trades in real-time, reflecting expectations of the price movement over the next 30 days. As such, it tends to have a very close inverse relationship with the S&P 500. In other words, as stocks fall, the VIX rises and vice versa. For a deeper dive into the VIX, check out a complete guide here.

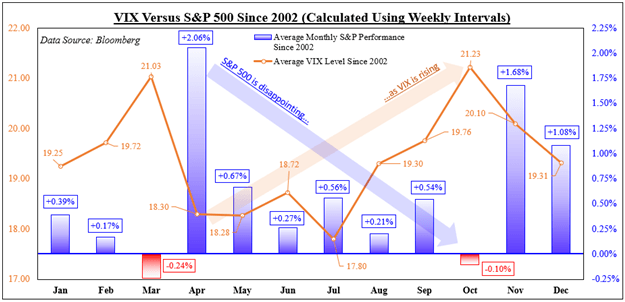
This inverse relationship can be seen in the next chart, which shows the average S&P 500 performance compared to equivalent VIX levels since 2002. For the study, average weekly data is used to calculate monthly outcomes. This is done so that it helps avoid truncating the ‘volatility of volatility’, whereas a monthly reading could run into the data failing to capture the broader trend.

Looking at the data, April tended to see the most optimistic performance for the S&P 500, averaging 2.06%. Afterwards, this performance tapered before bottoming in October, when the benchmark stock index returned about -0.1%. During this period, we saw the VIX climb, starting at 18.30 in April, then rising to 21.23 in October. Knowing this, we can now look at what happens within the S&P 500.

Trading Strategies and Risk Management

Volatility

Why is volatility so much important for traders?

Start Course

VIX Versus the S&P 500

VIX Versus the S&P 500

S&P 500 Cross-Sector Correlations with the VIX

To see when a stock sector diversification strategy can fail, we will need dedicated price indices of the 11 sectors in the S&P 500. The data used for the latter only goes back to 2002. We can then find correlation levels between the VIX and for each sector using a one-month rolling basis. The correlations range between -1 and 1. A -1 reading means perfect inverse movements between two variables, while 1 is perfect unison.

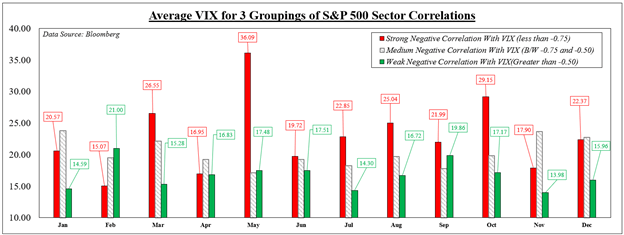
Averaging all 11 outcomes in each period offers a cross-sector correlation reading with the VIX. Next, the correlations are separated into groups ranging from strong (-1 to -0.75), medium (-0.75 and -0.50), and weak (all values greater than -0.5). A strong inverse reading reflects the VIX rising/falling as sectors dropped/climbed together with the most consistency. Weak ones represent sectors moving more freely.

In 7 out of 12 months, higher levels of VIX were associated with stronger cross-sector inverse correlations with the ‘fear gauge’. For example, the average weekly price of the VIX in March was 26.55 when the S&P sectors moved the most in unison. The price dropped to 15.28 when we saw sectors move more freely. Knowing this, what levels of VIX can undermine a cross-sector diversification strategy?

Foundational Trading Knowledge

Understanding the Stock Market

Help boost your stock market knowledge!

Start Course

VIX Price Versus Different Levels of S&P Cross-Sector Inverse Correlations

VIX Price Versus Different Levels of S&P Cross-Sector Inverse Correlations

When Can a Stock Sector Diversification Strategy Fail?

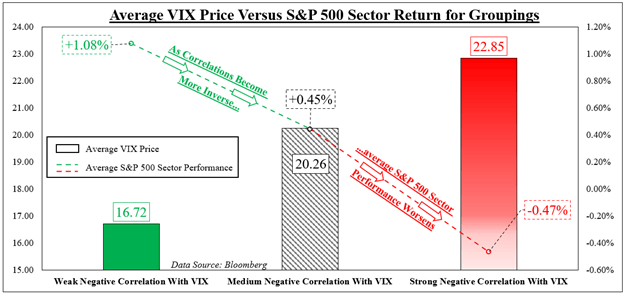
We can now average the prices of the VIX for all months and years since 2002 based on the 3 correlation groupings. Simultaneously, we will average the weekly performance of all the S&P sectors and align them based on the same categories. On the chart below, we can see that the outcome was fairly predictable. Stronger inverse correlations with the VIX aligned with increasingly worse performance between sectors.

When we saw all the sectors move the most opposite to the VIX, the average price of the ‘fear gauge’ was 22.85. When this occurred, the average return of each sector was -0.47%. Conversely, when the sectors moved more freely relative to the VIX, the price of the latter was 16.72. At that price, the average return between each sector was +1.08%.

It should be noted that correlation does not imply causation. Just because the VIX is at some arbitrary price does not mean that it is the sole cause of trading dynamics between sectors. Rather, it is being used here as a frame of reference. What actually causes markets to fall in binary moves is a combination of fundamental factors: monetary policy, fiscal spending, company guidance and more.

What Can Traders Do About Volatility?

Knowing this information, what can traders do when expecting high volatility and strong cross-correlations across market sectors? High bursts of volatility are often short-lived and temporary. During these times, haven-oriented assets tend to outperform. This includes the US Dollar, which often rises during times of global market stress. Short selling stocks is another. Scaling back exposure on current and new undertakings also help. Combining these could help prepare traders for some bumpy roads.

VIX Price Versus Performance of S&P 500 Sectors Based on Correlation Groupings

VIX Price Versus Performance of S&P 500 Sectors Based on Correlation Groupings

— Written by Daniel Dubrovsky, Strategist for DailyFX.com