EUR/USD Rate Susceptible to Strong US NFP Report

EUR/USD Rate Susceptible to Strong US NFP Report

EUR/USD trades back below the 50-Day SMA (0.9873) after failing to test the September high (1.0198), and the exchange rate may struggle to retain the advance from the yearly low (0.9536) as it appears to be tracking the negative slope in the moving average.

At the same time, the NFP report may drag on EUR/USD as the US economy is anticipated to add 200K jobs in October, and signs of a resilient labor market may provide the Federal Open Market Committee (FOMC) with greater scope to pursue a highly restrictive policy as Chairman Jerome Powell emphasizes that “it is very premature” to pause the hiking-cycle.

s a result, the FOMC may maintain its existing approach to achieve price stability as Chairman Powell acknowledges that “we haven’t seen inflation coming down,” and it remains to be seen if Fed officials will project a steeper path for US interest rates as the central bank is slated to release the updated Summary of Economic Projections (SEP) at the next rate decision on December 14.

Until then, EUR/USD may face headwinds as the European Central Bank (ECB) shows little interest in pursuing a restrictive policy, while the tilt in retail sentiment looks poised to persist as traders have been net-long the pair for most of the year.

The IG Client Sentiment (IGCS) report shows 66.90% of traders are currently net-long EUR/USD, with the ratio of traders long to short standing at 2.02 to 1.

The number of traders net-long is 14.20% higher than yesterday and 29.94% higher from last week, while the number of traders net-short is 18.53% lower than yesterday and 26.66% lower from last week. The rise in net-long interest has fueled the crowding behavior 53.29% of traders were net-long EUR/USD last week, while the decline in net-short position comes as the exchange rate trades to a fresh weekly low (0.9730).

With that said, another uptick in US employment may keep EUR/USD under pressure as it fuels speculation for another 75bp Fed rate hike, and the exchange rate may struggle to retain the advance from the yearly low (0.9536) as it appears to be tracking the negative slope in the 50-Day SMA (0.9873).

EUR/USD Rate Daily Chart


XAU/USD Daily Chart

Gold Prices Await Non-Farm Payrolls Data, Will the US Dollar Rally?

Gold prices aimed cautiously lower over the past 24 hours, continuing to digest the aftermath of Wednesday’s Federal Reserve monetary policy announcement. There, Chair Jerome Powell inspired markets to add about a 25-basis point rate hike to the projected path for tightening by the middle of 2023. This helped push up Treasury yields and the US Dollar.

XAU/USD can be quite sensitive to situations when both bond yields and the Greenback move in the same direction, whether it is up or down. That is because the yellow metal bears no inherent yield for an investor who holds the asset. When the rate of return on cash rises, as it has been this year, that tends to bode poorly for gold.

With that in mind, all eyes now turn to Friday’s US non-farm payrolls report. The country is seen adding about 200k positions, down from 263k in September. The unemployment rate is seen ticking higher to 3.6% from 3.5%. Meanwhile, average hourly earnings are set to weaken slightly to 4.7% y/y from 5.0% prior.

The Citi Economic Surprise Index tracking the US remains in an uptrend since the summer. This means that overall, economists have been underestimating the health and vigor of the economy. That may open the door to a rosier outcome for NFPs. If such is the case, bond yields and the US Dollar may rise, placing the yellow metal at risk.

Gold Technical Analysis

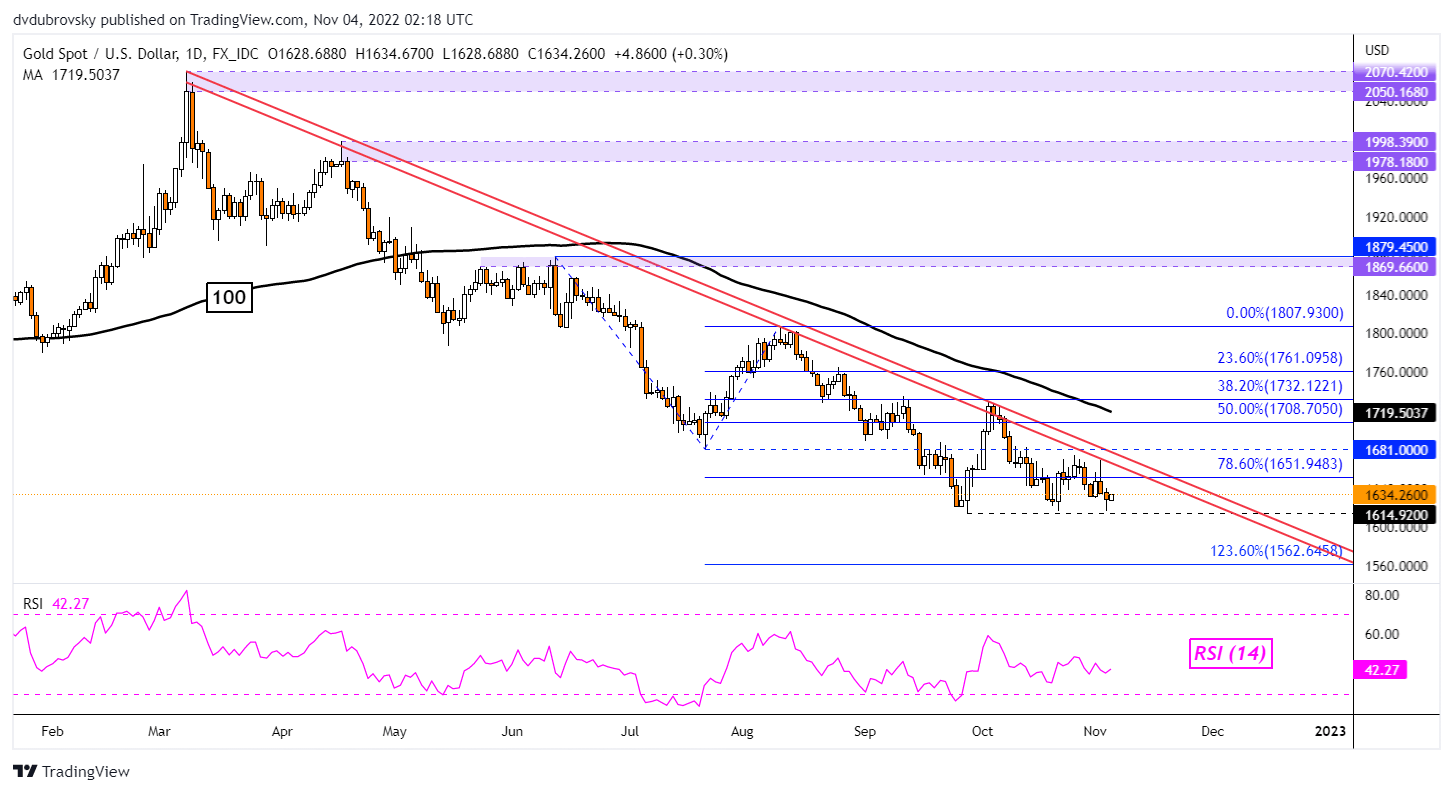
From a technical standpoint, gold is consolidating just above the September low at 1614. Prices are also contained under the long-term falling trendline from March. Breaking lower opens the door to perhaps testing the 123.6% Fibonacci extension at 1562. Otherwise, breaking above the trendline exposes the 100-day Simple Moving Average. The latter may hold as resistance.

XAU/USD Daily Chart

XAU/USD Daily Chart

Gold Sentiment Analysis – Bearish

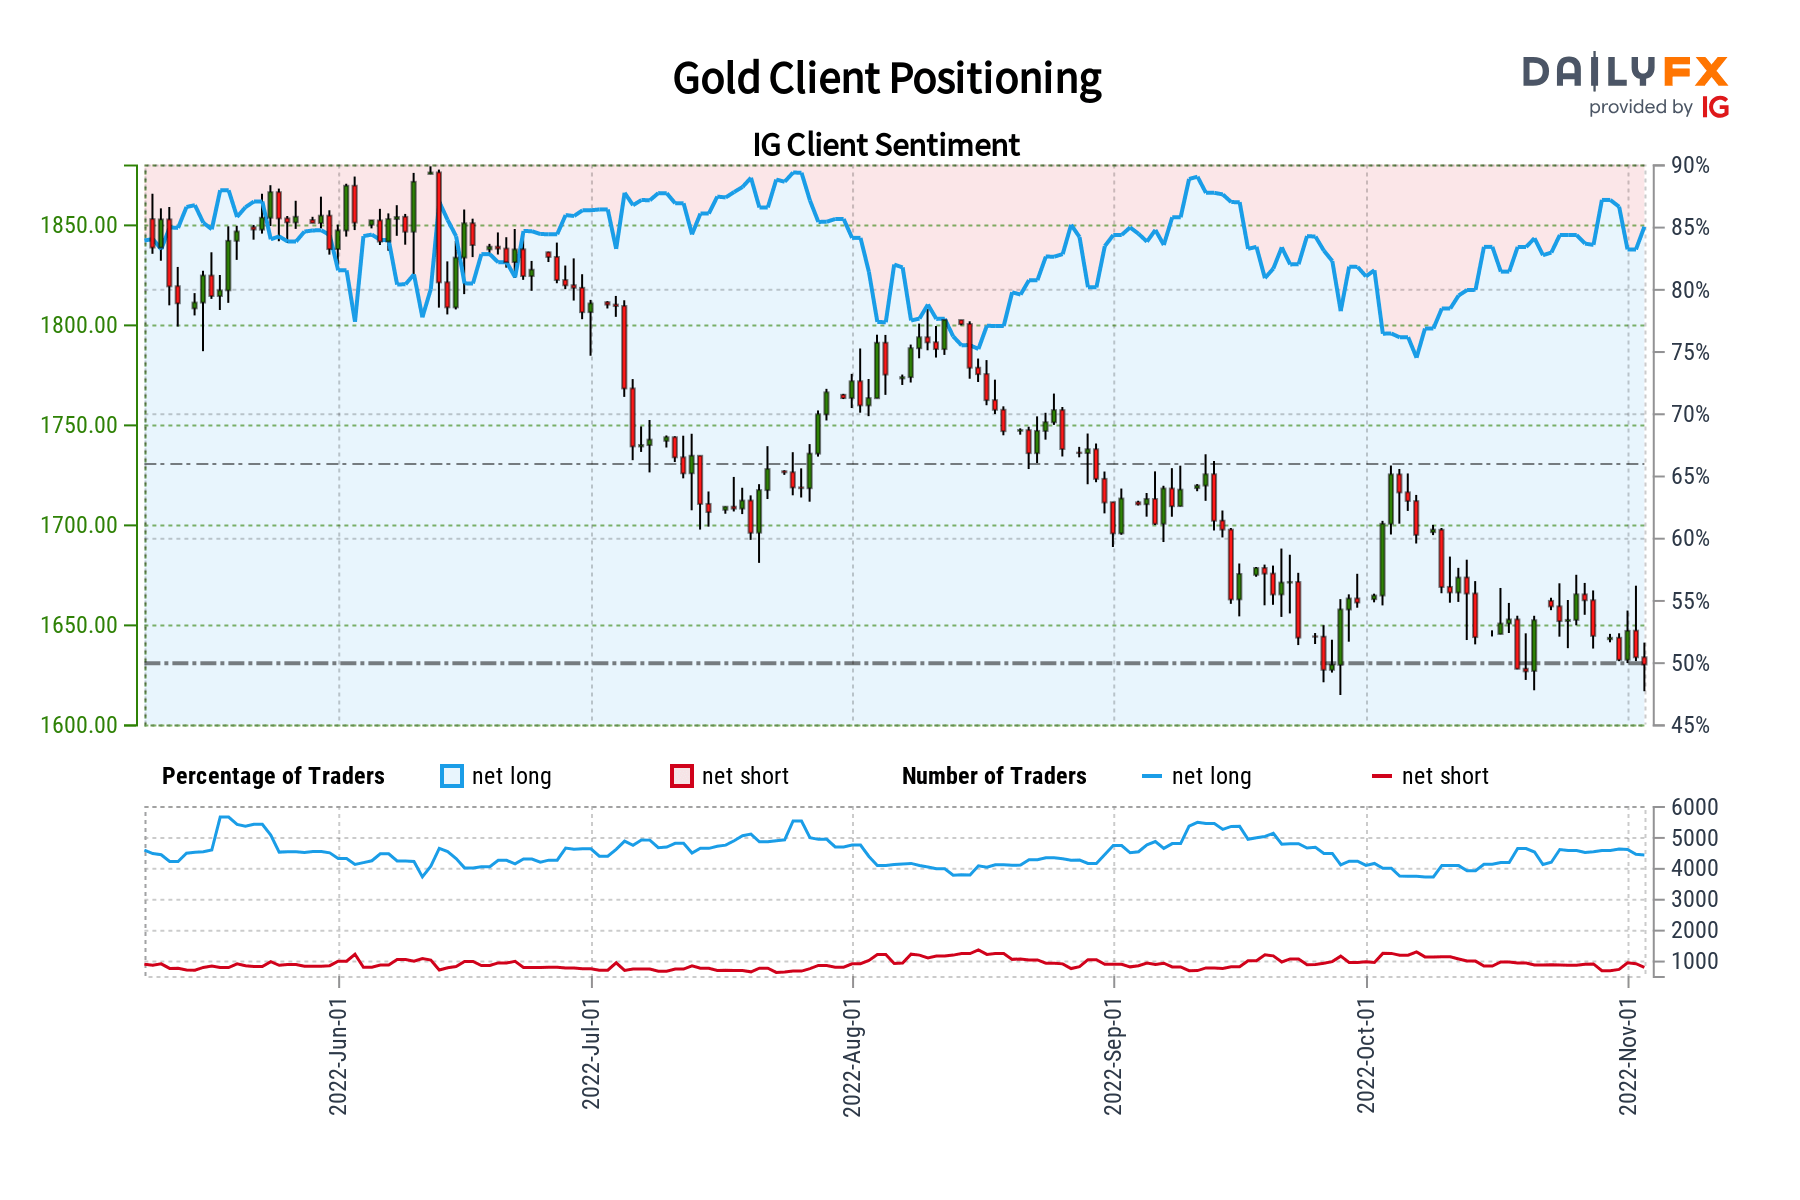
IG Client Sentiment (IGCS) shows that about 86% of retail traders are net-long gold. IGCS tends to behave as a contrarian indicator. Since most traders are biased to the upside, this hints that prices may continue falling. This is as upside exposure increased by 10.37% and 7.45% compared to yesterday and last week, respectively. With that in mind, the combination of current sentiment and recent changes offers a stronger bearish contrarian trading bias.


Gold Sentiment Analysis - Bearish

image1.png

GBP/USD Technical Outlook: Has the British Pound Run its Course?

GBP/USD SHORT-TERM TECHNICAL FORECAST – BULLISH

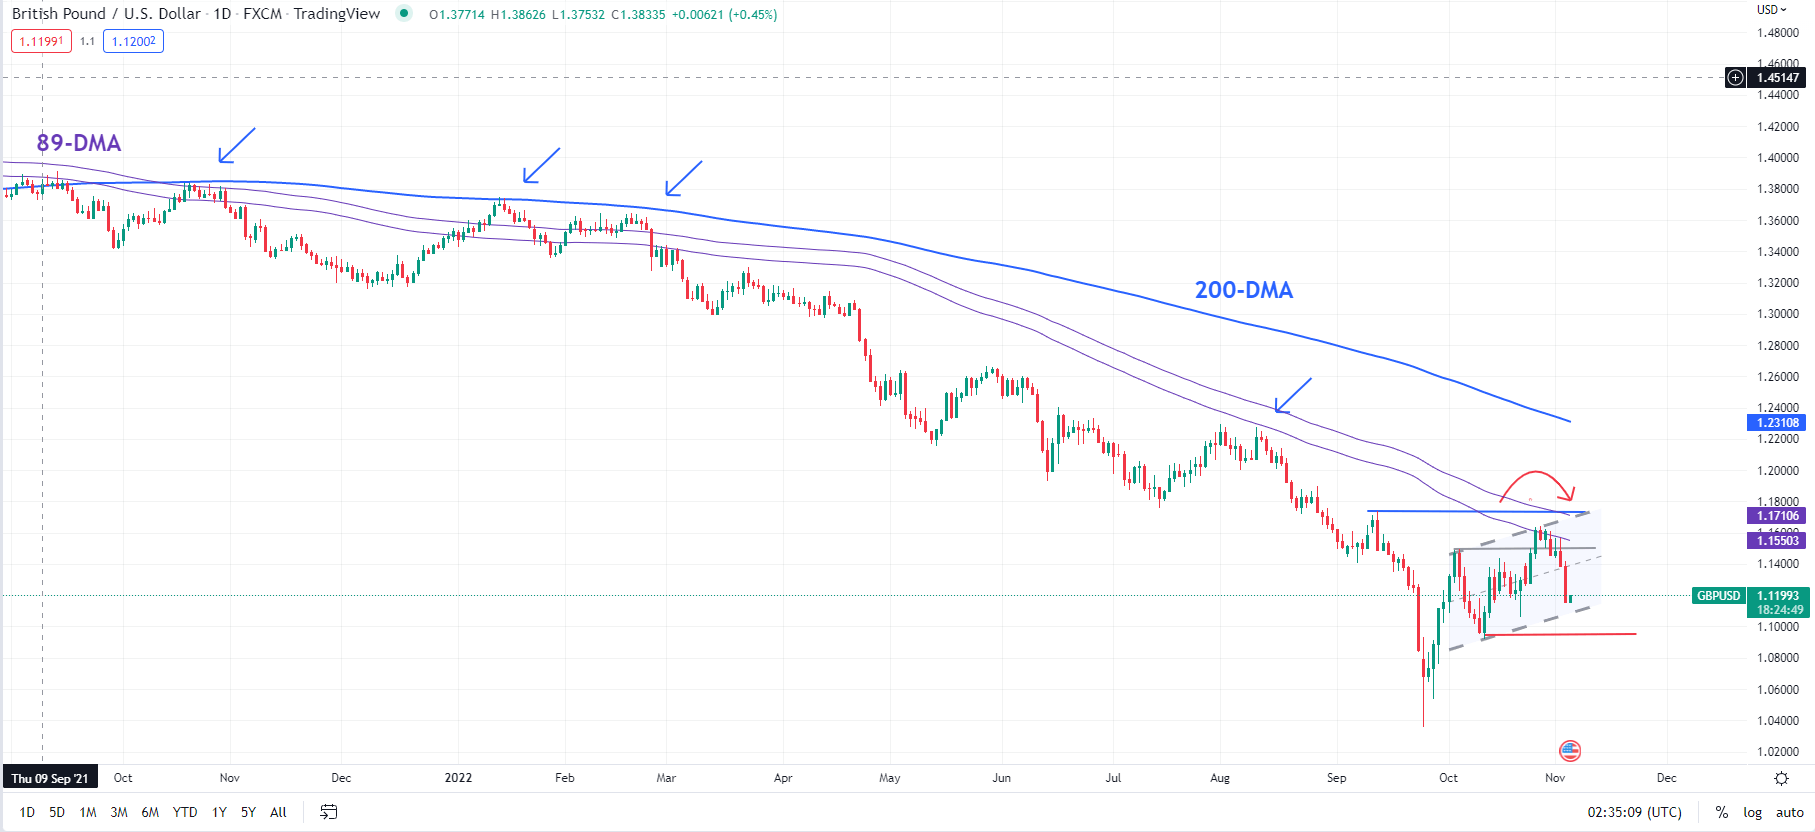
The British pound’s retreat against the US dollar from near-key resistance has taken the sting out of the recent rally. After briefly rising above resistance at the early-October high of 1.1495, GBP/USD succumbed to gains near strong converged resistance at about 1.1700-1.1750 (including the 89-day moving average and the mid-September high of 1.1740. The last time the pair was above the average was in 2021.

GBP/USD Daily Chart

image1.png

The retreat now brings GBP/USD to the lower edge of a minor ascending channel from early October (now at about 1.1000). A break below would confirm that the short-term upward pressure had faded, risking a drop toward a vital cushion at the October low of 1.0925. Cable needs to hold above 1.0925 for the recovery trend to remain intact. That’s because a decisive break below 1.0925 could expose downside risks towards the September low of 1.0385.

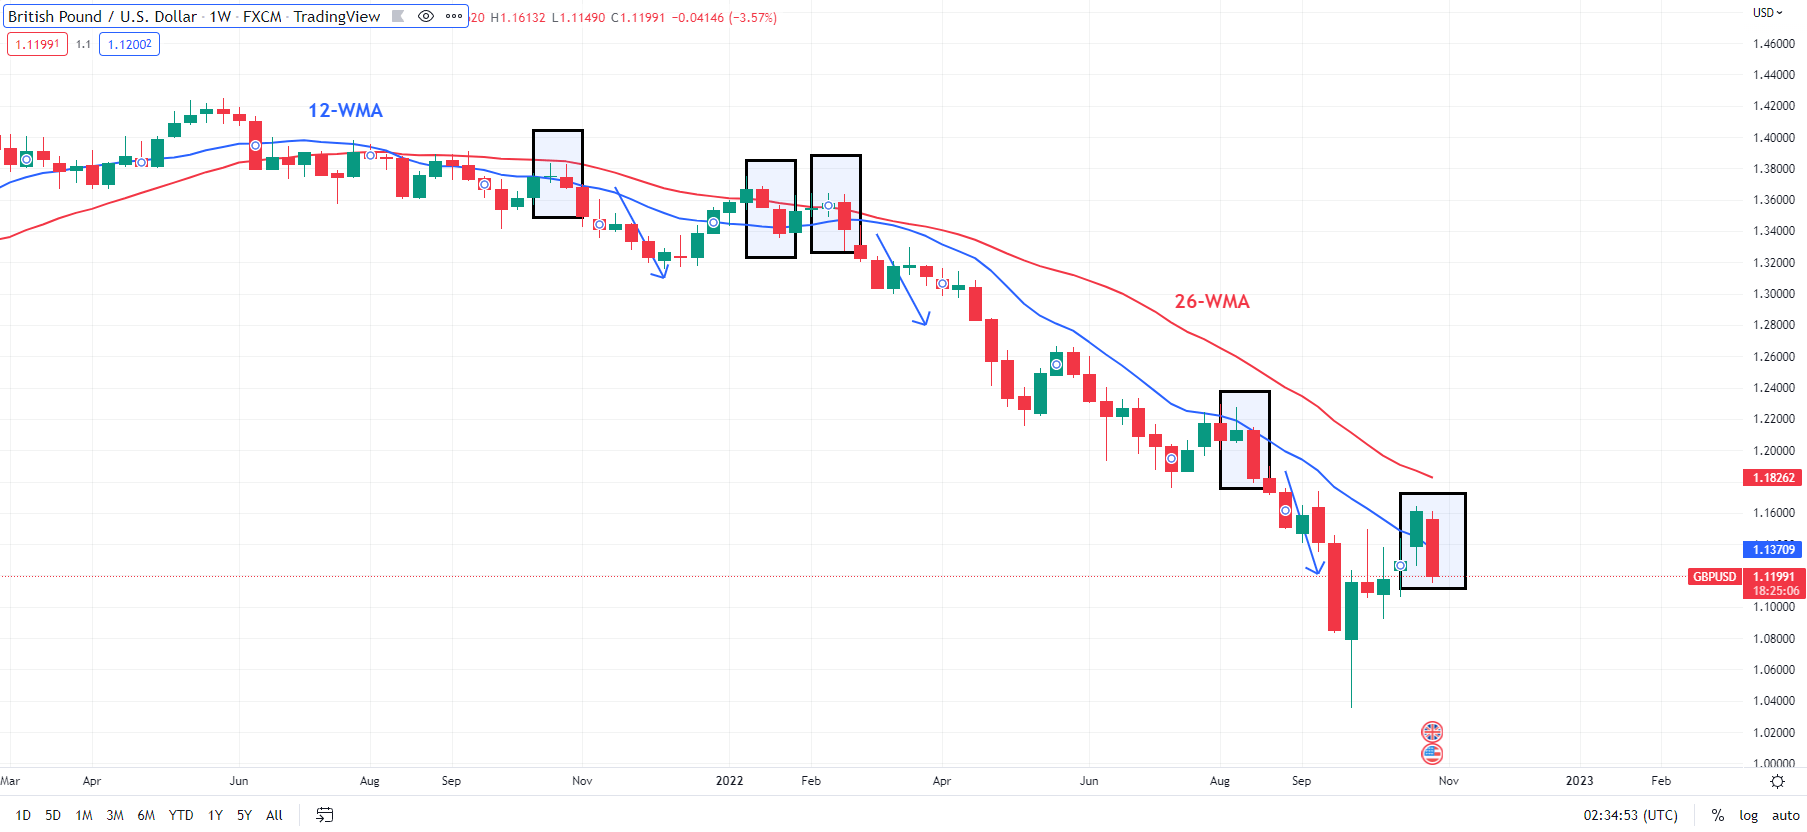
On the weekly charts, the fall this week below last week’s bottom of 1.1255 is a weak indicator. If the pair closes lower next week on the weekly chart (relative to this week), then the chances of a retest of 1.0925 would rise (see chart).

GBP/USD Weekly Chart

image2.png

On the positive side of things, GBP/USD’s rise end of October to a six-week high is an encouraging signal. Despite the choppiness associated with the rebound from September (which in a way is understandable given the heavy damage in recent months), GBP/USD has maintained a higher-high-higher-low formation on the daily charts. So, it would be too soon to conclude that the uptrend has reversed, even though this week’s slide could be a warning message.

Looking beyond the immediate term, GBP/USD appears to have made an interim low (first highlighted in early October). What is unclear, however, is whether / how likely is a retest of the September low of 1.0385 (or below). In this regard, 1.0925 could offer some guidance. For one, a break below the cushion would disrupt the higher-high-higher-low pattern on the daily chart. Secondly, it would imply a lower low on the weekly chart (relative to this week), raising the risk of a retest of 1.0385.

Graphical user interface, text, application  Description automatically generated

GBP Breaking News: Pound Steady as BoE Hike Rates by 75bp

The Bank of England unleashed its biggest interest-rate hike in 33 years as it warned that inflation is likely to peak around 11% in Q4. The vote was unanimous in terms of a hike, however, policymaker Dhingra voted for 50bp while Tenreyro voted for a 25bp hike. The bank predicts the UK economy will contract by 1% in 2024 compared to previous estimates of 0.25%. The forecasts are based on a peak market rate of around 5.25%.

The BOE insist that the peak rate is probably less than markets are currently pricing while warning they will act forcefully on persistent inflation. The central bank says the recession began in the third quarter as GDP dropped 0.5%, with it expected to last until 2023.

Graphical user interface, text, application  Description automatically generated

While markets continue to wait on the new medium-term fiscal plan, pressure on the Bank of England (BoE) has been reduced. The bank did not deliver a 75bp hike in September and since then the pound has strengthened against the greenback. Recent rhetoric from the BoE and some policymakers have hinted at their uneasiness at the amount of hikes markets are pricing. BoE policymaker Mann (a hawk) recently stated that markets are too aggressively priced at this stage. The BoE forecast from August of a recession was based on a peak rate of 3% with markets now pricing around 5%. According to Deputy Governor Broadbent this could result in a near 5% hit to GDP over the coming years.

Focus will now shift to the ‘Autumn Statement/Fiscal plan’ scheduled for November 17 as the government looks to plug the borrowing gap. Markets are a lot calmer with PM Sunak and Chancellor Hunt at the wheel of the fiscal plan, with taxes and the energy price guaranteed to be key points. Given yesterday’s Fed meeting it seems the US will continue hiking rates albeit in smaller increments, which could add further afflictions to the pound.

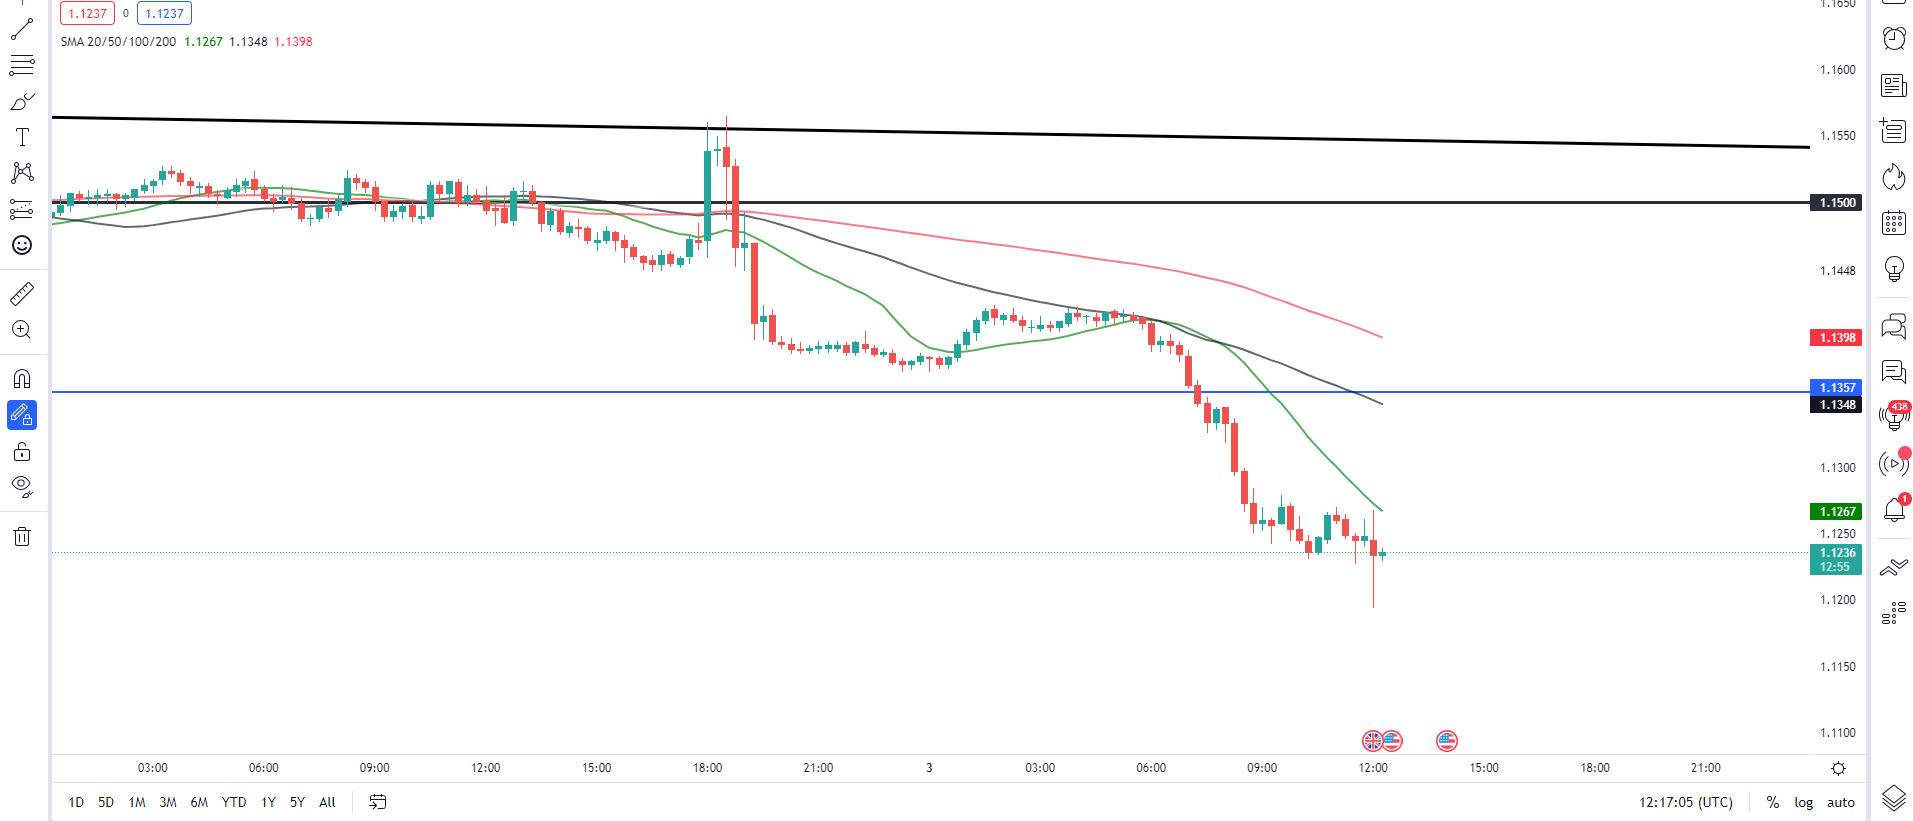
GBPUSD 15M Chart

Chart, line chart, histogram  Description automatically generated

GBPUSD initial reaction saw a spike lower before recovering to trade relatively flat. Downside pressure remains on the pair as the dollar index continues its move higher.

Key Intraday Levels Worth Watching:

Support Areas

  • 1.1175
  • 1.1000
  • 1.0750

Resistance Areas

  • 1.1300
  • 1.1500
  • 1.1750

U.S. International Trade in Goods and Services, September 2022

September exports were $258.0 billion, $2.8 billion less than August exports. September imports were $331.3 billion, $4.8 billion more than August imports.

The September increase in the goods and services deficit reflected an increase in the goods deficit of $6.6 billion to $92.7 billion and a decrease in the services surplus of $1.0 billion to $19.5 billion.

Year-to-date, the goods and services deficit increased $125.6 billion, or 20.2 percent, from the same period in 2021. Exports increased $378.1 billion or 20.2 percent. Imports increased $503.6 billion or 20.2 percent.

Three-Month Moving Averages (exhibit 2)

The average goods and services deficit decreased $2.5 billion to $69.8 billion for the three months ending in September.

  • Average exports decreased $0.3 billion to $259.5 billion in September.
  • Average imports decreased $2.8 billion to $329.3 billion in September.

Year-over-year, the average goods and services deficit decreased $3.2 billion from the three months ending in September 2021.

  • Average exports increased $45.6 billion from September 2021.
  • Average imports increased $42.4 billion from September 2021.

Exports (exhibits 3, 6, and 7)

Exports of goods decreased $3.7 billion to $180.2 billion in September.

Exports of goods on a Census basis decreased $3.4 billion.

  • Industrial supplies and materials decreased $2.3 billion.
    • Crude oil decreased $1.0 billion.
    • Nonmonetary gold decreased $0.8 billion.
  • Foods, feeds, and beverages decreased $2.1 billion.
    • Soybeans decreased $1.7 billion.
  • Capital goods increased $1.2 billion.
    • Telecommunications equipment increased $0.6 billion.
    • Semiconductors increased $0.4 billion.

Net balance of payments adjustments decreased $0.3 billion.

Exports of services increased $0.9 billion to $77.8 billion in September.

  • Travel increased $0.6 billion.
  • Transport increased $0.1 billion.
  • Financial services increased $0.1 billion.

Imports (exhibits 4, 6, and 8)

Imports of goods increased $2.9 billion to $272.9 billion in September.

Imports of goods on a Census basis increased $2.8 billion.

  • Capital goods increased $3.3 billion.
    • Semiconductors increased $1.1 billion.
    • Civilian aircraft increased $0.8 billion.
    • Telecommunications equipment increased $0.7 billion.
  • Consumer goods increased $1.1 billion.
    • Cell phones and other household goods increased $1.4 billion.
    • Pharmaceutical preparations increased $1.4 billion.
  • Industrial supplies and materials decreased $2.0 billion.
    • Fuel oil decreased $0.8 billion.
    • Crude oil decreased $0.5 billion.
    • Other petroleum products decreased $0.5 billion.

Net balance of payments adjustments increased $0.1 billion.

Imports of services increased $1.9 billion to $58.4 billion in September.

  • Travel increased $1.6 billion.
  • Transport increased $0.3 billion.

Real Goods in 2012 Dollars – Census Basis (exhibit 11)

The real goods deficit increased $6.7 billion to $103.8 billion in September.

  • Real exports of goods decreased $1.3 billion to $162.9 billion.
  • Real imports of goods increased $5.4 billion to $266.8 billion.

Revisions

Revisions to August exports

  • Exports of goods were revised up $1.4 billion.
  • Exports of services were revised up $0.5 billion.

Revisions to August imports

  • Imports of goods were revised down $0.1 billion.
  • Imports of services were revised up $0.3 billion.
image1.png

USD Forecast: DXY Pushes Upper Bounds of Key Technical Pattern Post-FOMC

USD FUNDAMENTAL BACKDROP

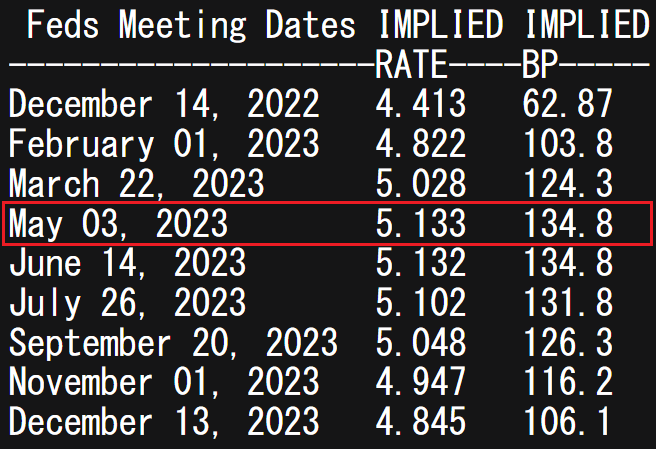
The Dollar Index’s (DXY) rallied after last nights Federal Reserve interest rate decision bringing the Fed funds target rate to 3.75-4% after the 75bps increase. Fed Chair Jerome Powell reinforced the Fed’s intention to stamp out entrenched inflationary pressures while mentioning that the size of future hikes will likely be reduced but at a higher end point. This higher ‘end point’ is what surprised markets somewhat as pre-announcement, money markets had the peak around 5% in May 2023 which has now increased to 5.133% as of this morning – see table below.

 FEDERAL RESERVE INTEREST RATE PROBABILITIES

image1.png

The continued rate hikes (albeit less aggressive) will not bode well for Emerging Market (EM) currencies as their traditional carry trade appeal will be diminished with most of these economies unable to keep up with the pace of rate hikes in the U.S..

Later today, ISM services PMI for October is due which is the primary driver of the U.S. economy. After Monday’s manufacturing print, a services beat would likely add additional upside support for the greenback. Prior to FOMC, ADP employment figures surprised higher heightening the importance of Friday’s NFP release.

ECONOMIC CALENDAR

image2.png

TECHNICAL ANALYSIS

U.S. DOLLAR INDEX DAILY CHART


image3.png

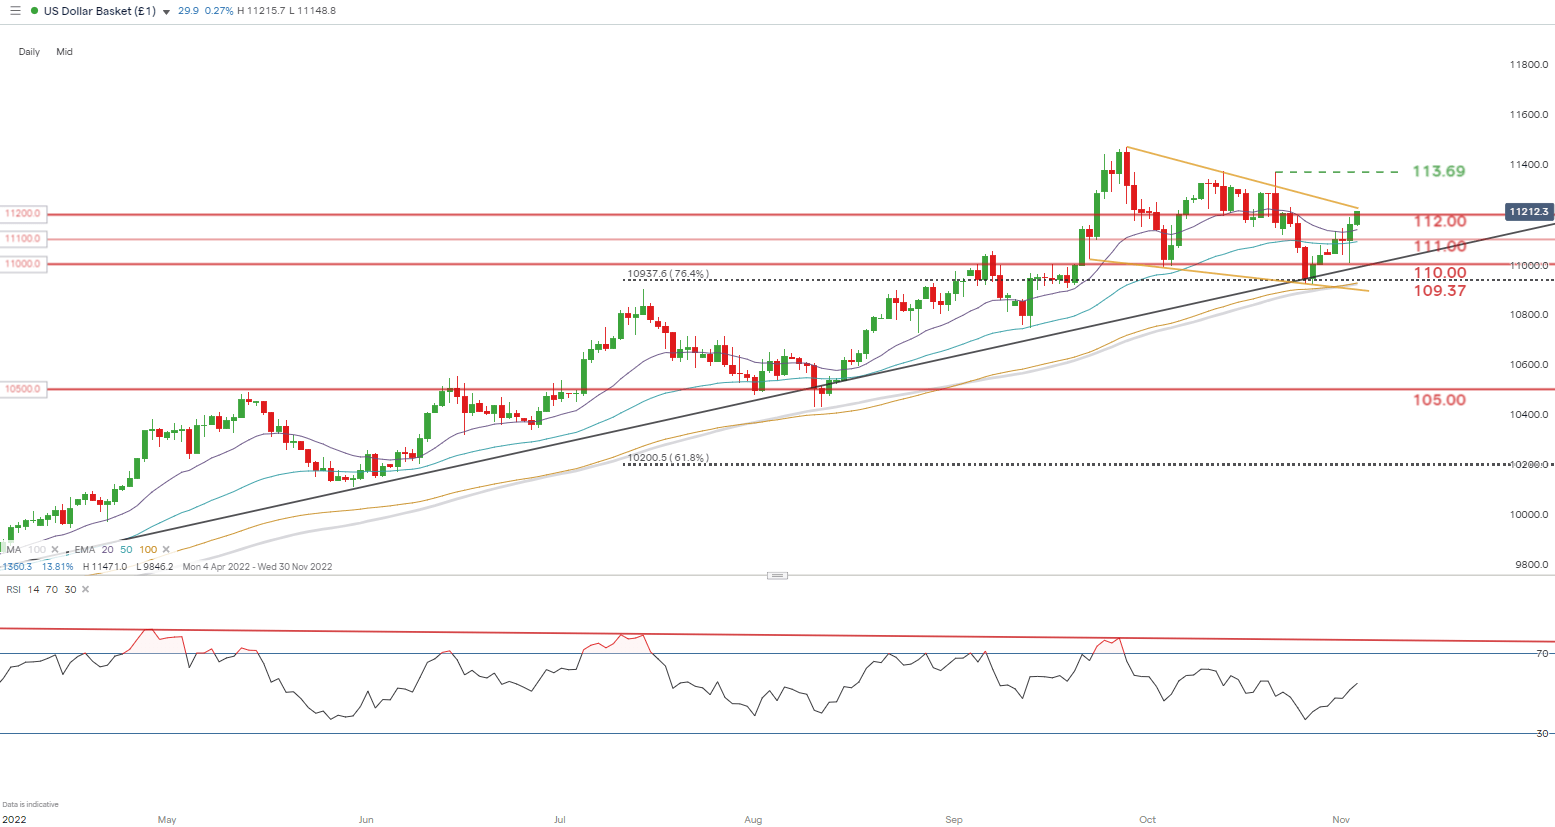
Price action on the daily DXY chart shows bulls testing the developing falling wedge chart pattern (yellow) after surpassing the psychological 112.00 handle. A confirmation daily candle close above wedge resistance could spark a extended run up to subsequent resistance zones – highly dependent on fundamental economic data (NFP on Friday).

shows bears defending the 76.4% Fibonacci (taken from July 2001 high to March 2008 low) level at 109.37. The Relative Strength Index (RSI) shows signs of bearish divergence suggesting an impending reversal. This could fall in line with a hawkish ECB rate decision on Thursday but longer-term it is difficult to see a buck of the enduring upward trend.

Resistance levels:

  • 113.69 – recent swing high
  • Wedge resistance (yellow)

Support levels:

  • 112.00
  • 20-day EMA (purple)
  • 111.00

AUDUSD retreats after latest rebound falters

AUDUSD has been in a steep downtrend since early March, generating a profound structure of lower highs and lower lows. Although the pair managed to find its feet at the 30-month low of 0.6169 and recoup some losses, it quickly moved lower after the 50-day simple moving average (SMA) curbed its upside.

The momentum indicators are endorsing this bearish near-term bias. Specifically, the RSI is declining below its 50-neutral mark, while the stochastic oscillator has dived in the oversold area.

Should selling pressures persist, the pair could initially test the 0.6210 support. A violation of the latter may pave the way for the 30-month low of 0.6169. Dipping beneath that region, the price might descend to form fresh multi-year lows, where the 0.6000 psychological mark could provide downside protection.

On the flipside, bullish actions could propel the pair towards its recent rejection region of 0.6546, which overlaps with the 50-day SMA. Conquering this barricade, the bulls may aim for the 0.6680 support, which could now act as resistance. Failing to halt there, further advances could cease at 0.6915 before the August high of 0.7136 comes under examination.

Overall, AUDUSD appears ready to revisit its lows since its rebound failed to strengthen. For that bearish tone to reverse, the pair needs to profoundly cross above its 50-day SMA.

EUR/USD Heads Lower, ECB Can’t Match Fed Firepower

The Euro continued to struggle against the US Dollar on Thursday, with the greenback bolstered across the board by the United States Federal Reserve’s monetary policy decision in the previous session.

In terms of interest rates, the markets got exactly what they were expecting, with a well-flagged three-quarter point increase duly delivered. However, hopes were quite strong that Fed Chair Jerome Powell would announce a definitive retreat from aggressive monetary tightening. In the event he did no such thing, cautioning markets that borrowing costs may yet have to rise substantially if inflation is to be curbed.

While this may seem to be at least somewhat a statement of the obvious, it gave the Dollar an across-board lift, with the US central bank still clearly out in front when it comes to appetite and ability to tighten its monetary screws.

The European Central Bank Will Likely Raise Rates Further

European Central Bank President Christine Lagarde warned this weak that Eurozone interest rates will have to keep rising too. Well may she do so, with consumer price inflation at record levels in the currency bloc. However, conflicting tolerances for higher rates within the economies of the eurozone look set to make her job an even more tricky balancing act than usual, and the markets know it. The ECB has increased borrowing costs by a total of two percentage points over the past three monetary policy meetings, taking them from minus 0.5% to 1.5%. However these are baby steps compared to the Fed’s more confident strides

.Markets expect more of the same, so the Euro lacks monetary support in the global market. It’s also short of fundamental props, with an inflationary cost-of-living crisis sapping consumer morale across the Eurozone. Germany is of course the currency area’s engine room. It now wrestles with the need to wean itself off reliance on Russian gas as the war in Ukraine grinds on. Partly as result, Eurozone growth slowed sharply in the third quarter of this year.

EUR/USD Technical Analysis

The gloomy fundamental picture for EUR/USD is fully reflected on the technical charts.

The modest uptrend channel seen on the daily charts since late September looks set to be wiped out with its lower bound under obvious pressure. Should that give way, focus will immediately turn to the intraday trading low of September 28, which was 0.95400. That in turn was the lowest point seen for a little over twenty years, and a slide below it will see an extension of the long EUR/USD downtrend which has been in place since December 2020 since when the pair has only managed to end five months higher than it began them.

The lows of 2000 and 2001, which took the pair down to the 0.82 region will come into uncomfortable focus below current levels, with sentiment toward the pair unsurprisingly bearish according to IG data.

image1.png

New Zealand Dollar Technical Outlook: NZD/USD Range View Intact

NZD/USD SHORT-TERM TECHNICAL FORECAST – NEUTRAL

The sharp intraday drop in NZD/USD on Wednesday hasn’t reversed the short-term picture from ‘bullish’ to ‘bearish’ just yet.

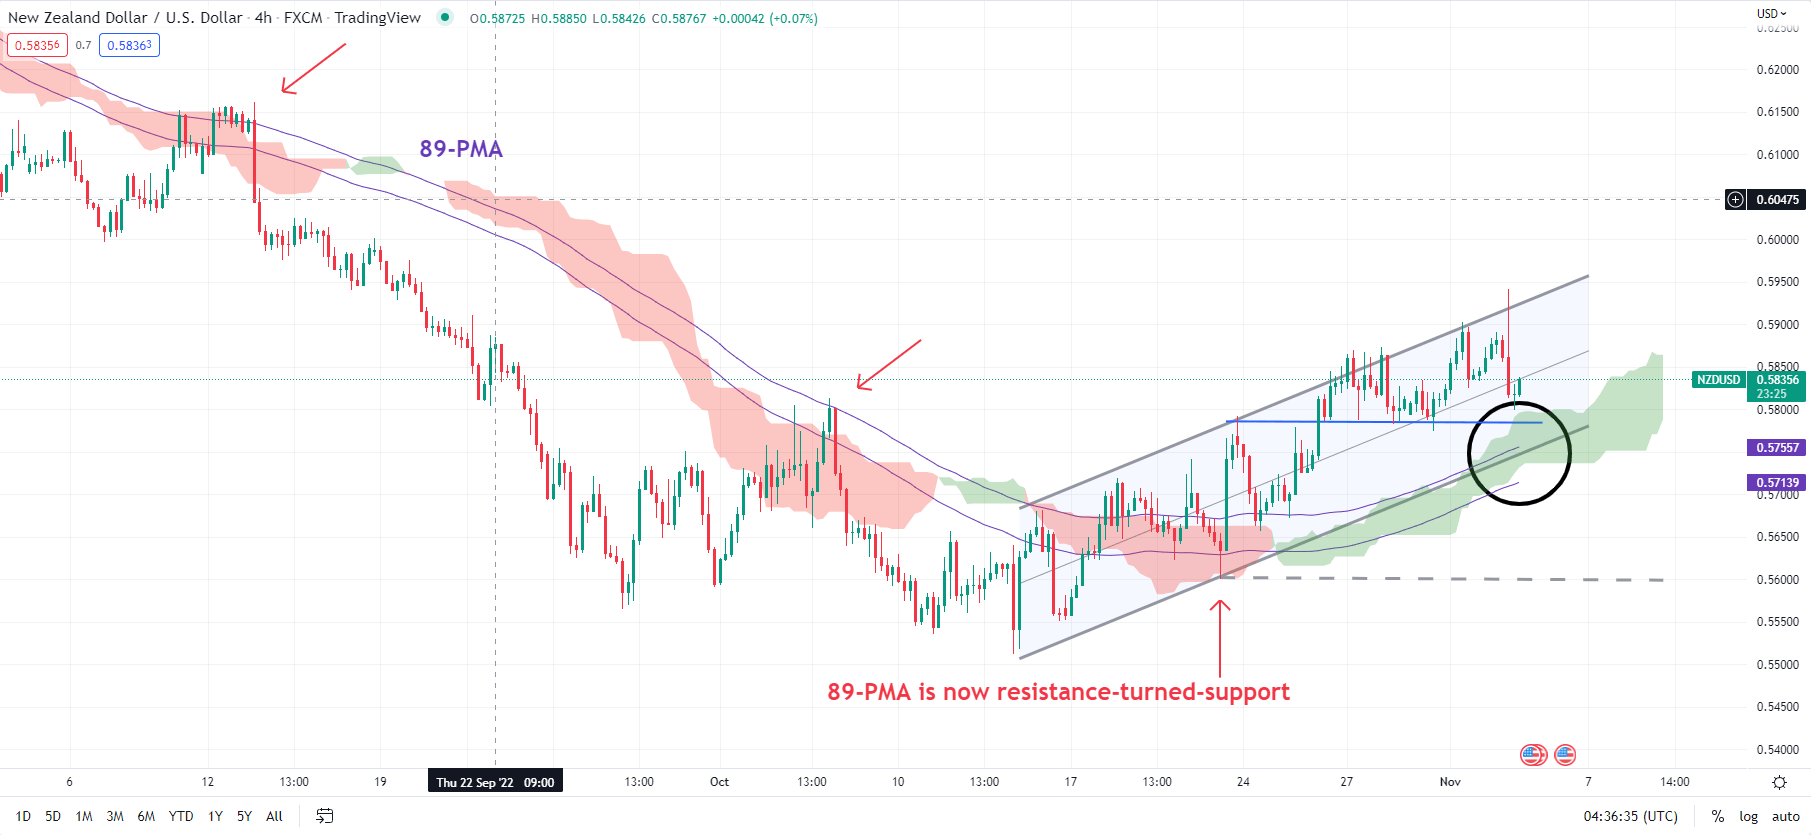
NZD/USD has maintained a choppy uptrend since the middle of October, well-guided within a rising channel. Most recently, the pair has spent more time toward the upper edge of the channel, indicating relative strength, and has made higher highs this week on the 240-minute (4-hour) charts. The sharp retreat may reiterate the short-term ‘neutral’ stance,outlined on Tuesday, rather than an outright bearish one.

NZD/USD 4-Hour Chart

image1.png

For sellers to claim the upper hand, NZD/USD would need to break below the October 21 low of 0.5597. Immediate support is at Monday’s low of 0.5773. This is followed by converged support marked by the 89-period moving average on the 240-minute chart, which roughly coincides with the lower edge of the Ichimoku cloud.

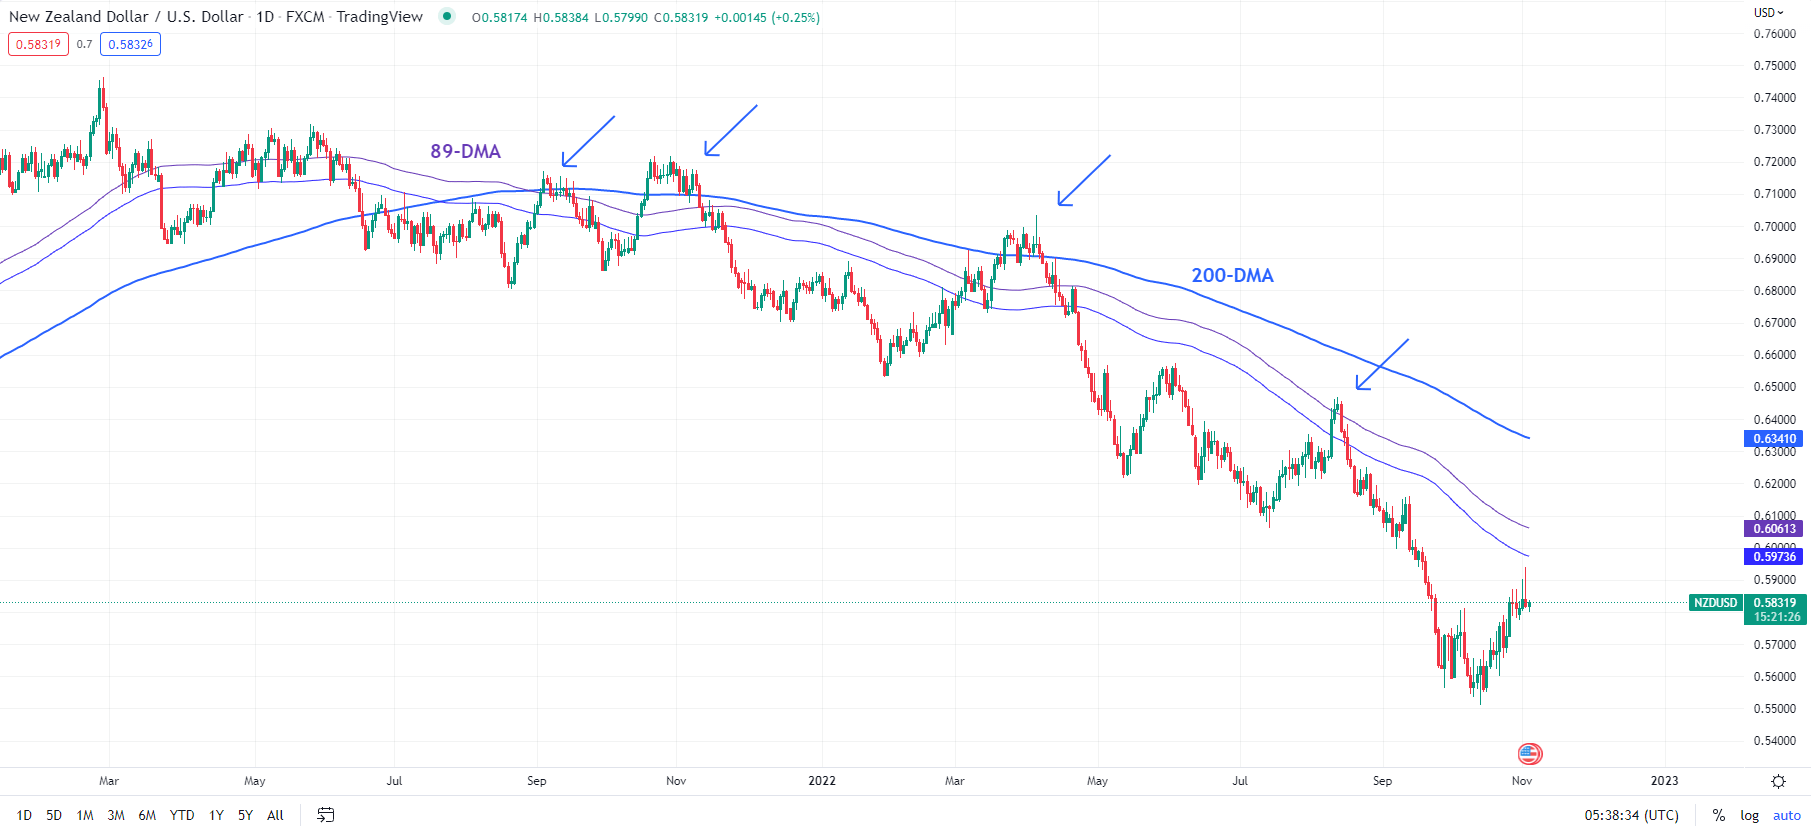
The choppy nature of the rally since October suggests that it is corrective, pointing to a neutral stance from the perspective of a few weeks’ worth of price action, instead of a bullish one. NZD/USD would need to clear the 200-day moving average for the medium-term outlook to turn constructive. Since the downtrend began last year, the 89- and 200-day moving averages have capped corrective rallies (see chart).

NZD/USD Daily Chart

image2.png

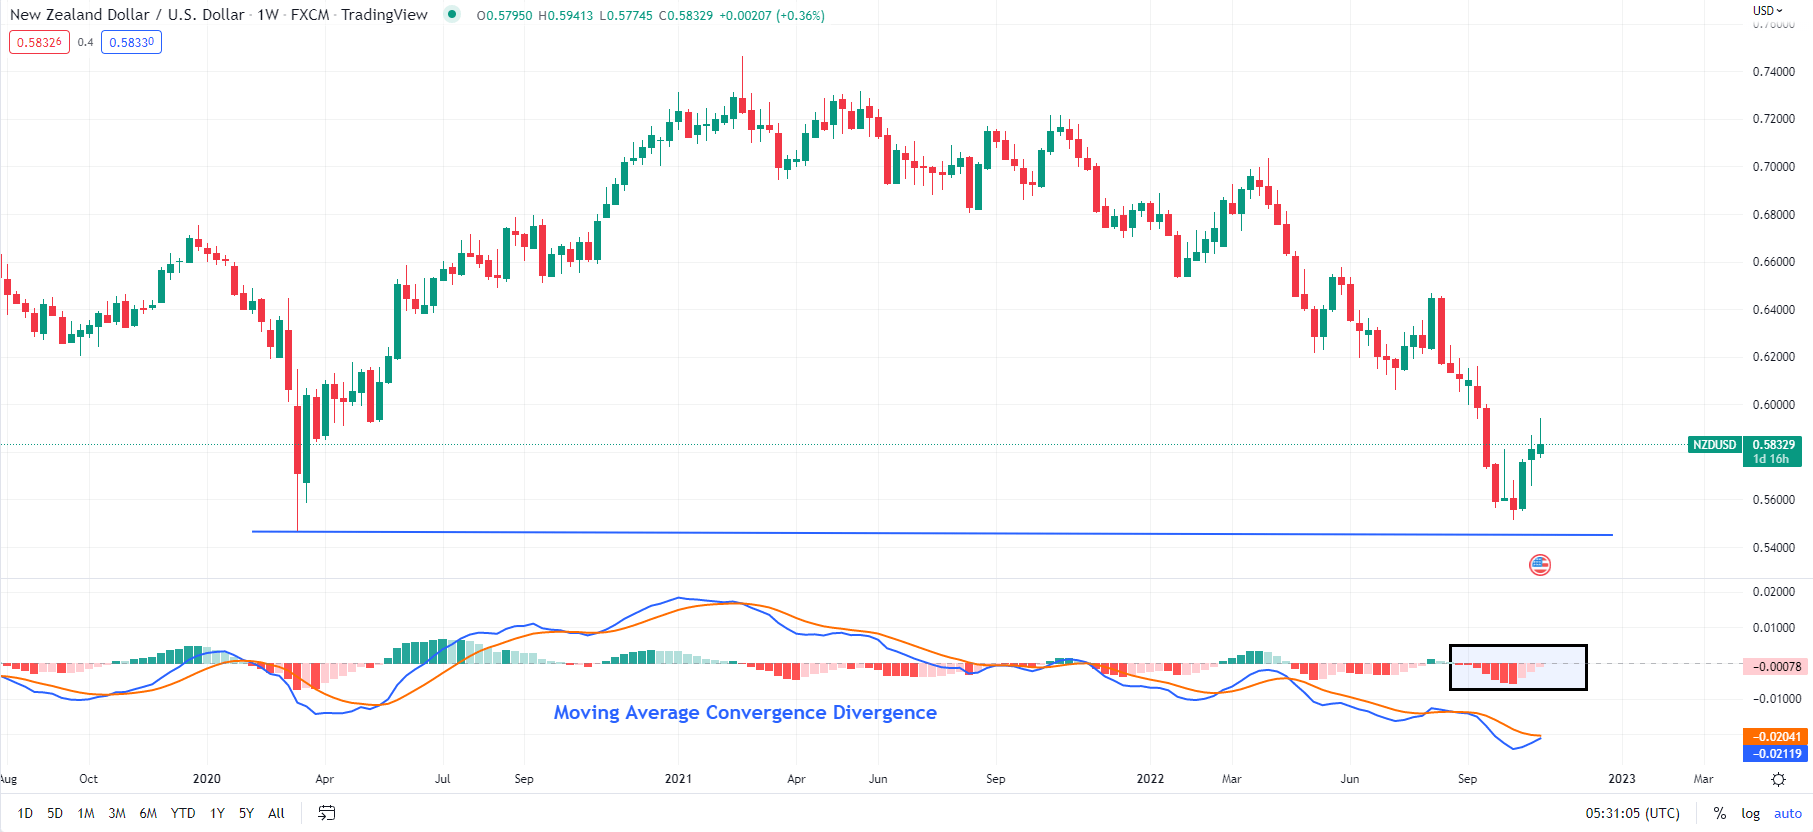
Zooming out, the Moving Average Convergence Divergence (MACD) indicator – a measure of trend and momentum – remains in negative territory on the weekly and monthly charts. This indicates that the broader trend points lower. Granted, medium-term downward momentum has slowed recently (also a reflection of the corrective rebound), but the bearish bias hasn’t reversed (see chart).

NZD/USD Weekly Chart

image3.png