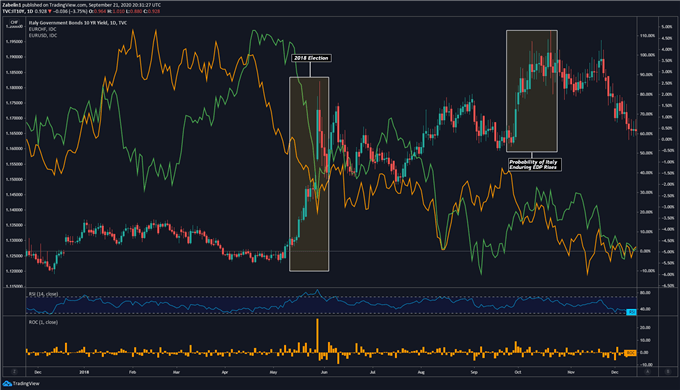
Chart showing EUR/USD, EUR/CHF

How to Trade the Impact of Politics on Global Financial Markets

ANALYZING GEOPOLITICAL RISKS

Against the backdrop of eroding fundamentals, markets become increasingly sensitive to political risks as their capacity for inducing market-wide volatility is amplified. When liberal-oriented ideologies – that is, those favoring free trade and integrated capital markets – are being assaulted on a global scale by nationalist and populist movements, uncertainty-driven volatility is the frequent result.

What makes political risk so dangerous and elusive is the limited ability investors have for pricing it in. Traders may therefore find themselves hot under the collar as the global political landscape continues to develop unpredictably. Furthermore, much like the spread of the coronavirus in 2020, political pathogens can have a similar contagion effect.

Generally speaking, markets do not really care about political categorizations but are more concerned with the economic policies embedded in the agenda of whoever holds the reigns of the sovereign. Policies that stimulate economic growth typically act as a magnet for investors looking to park capital where it will garner the highest yield.

These include the implementation of fiscal stimulus plans, fortifying property rights, allowing for goods and capital to flow freely and dissolving growth-sapping regulations. If these policies create adequate inflationary pressure, the central bank may raise interest rates in response. That boosts the underlying return on local assets, reeling in investors and lifting the currency.

Conversely, a government whose underlying ideological predilections go against the gradient of globalization may cause capital flight. Regimes that seek to rip out the threads that have sown economic and political integration usually create a moat of uncertainty that investors do not want to traverse. Themes of ultra-nationalism, protectionism and populism have been frequently shown to have market-disrupting effects.

If a state undergoes an ideological realignment,traders will assess the situation to see if it radically alters their risk-reward set up. If so, they may then reallocate their capital and re-formulate their trading strategies to tilt the balance of risk to reward in their favor. Volatility is stoked in doing so however as reformulated trading strategies are reflected in the market-wide redistribution of capital across various assets.

EUROPE: EUROSCEPTIC POPULISM IN ITALY

In Italy, the 2018 election roiled regional markets and eventually rippled through virtually the entire financial system. The ascendancy of the anti-establishment right-wing Lega Nord and ideologically-ambivalent 5 Star Movement was founded on a campaign of populism with a built-in rejection of the status quo. The uncertainty accompanying this new regime was then promptly priced in and resulted in significantly volatility.

The risk premium for holding Italy’s assets rose and was reflected in an over-100 percent spike in Italian 10-year bond yields. That showed investors demanding a higher return for tolerating what they perceived to be a higher level of risk. This was also reflected in the dramatic widening of the spread on credit default swaps on Italian sovereign debt amid increased fears that Italy could be the epicenter of another EU debt crisis.

EUR/USD, EUR/CHF Plummeted as Mediterranean Sovereign Bond Yields Spiked Amid Fears of Another Eurozone Debt Crisis
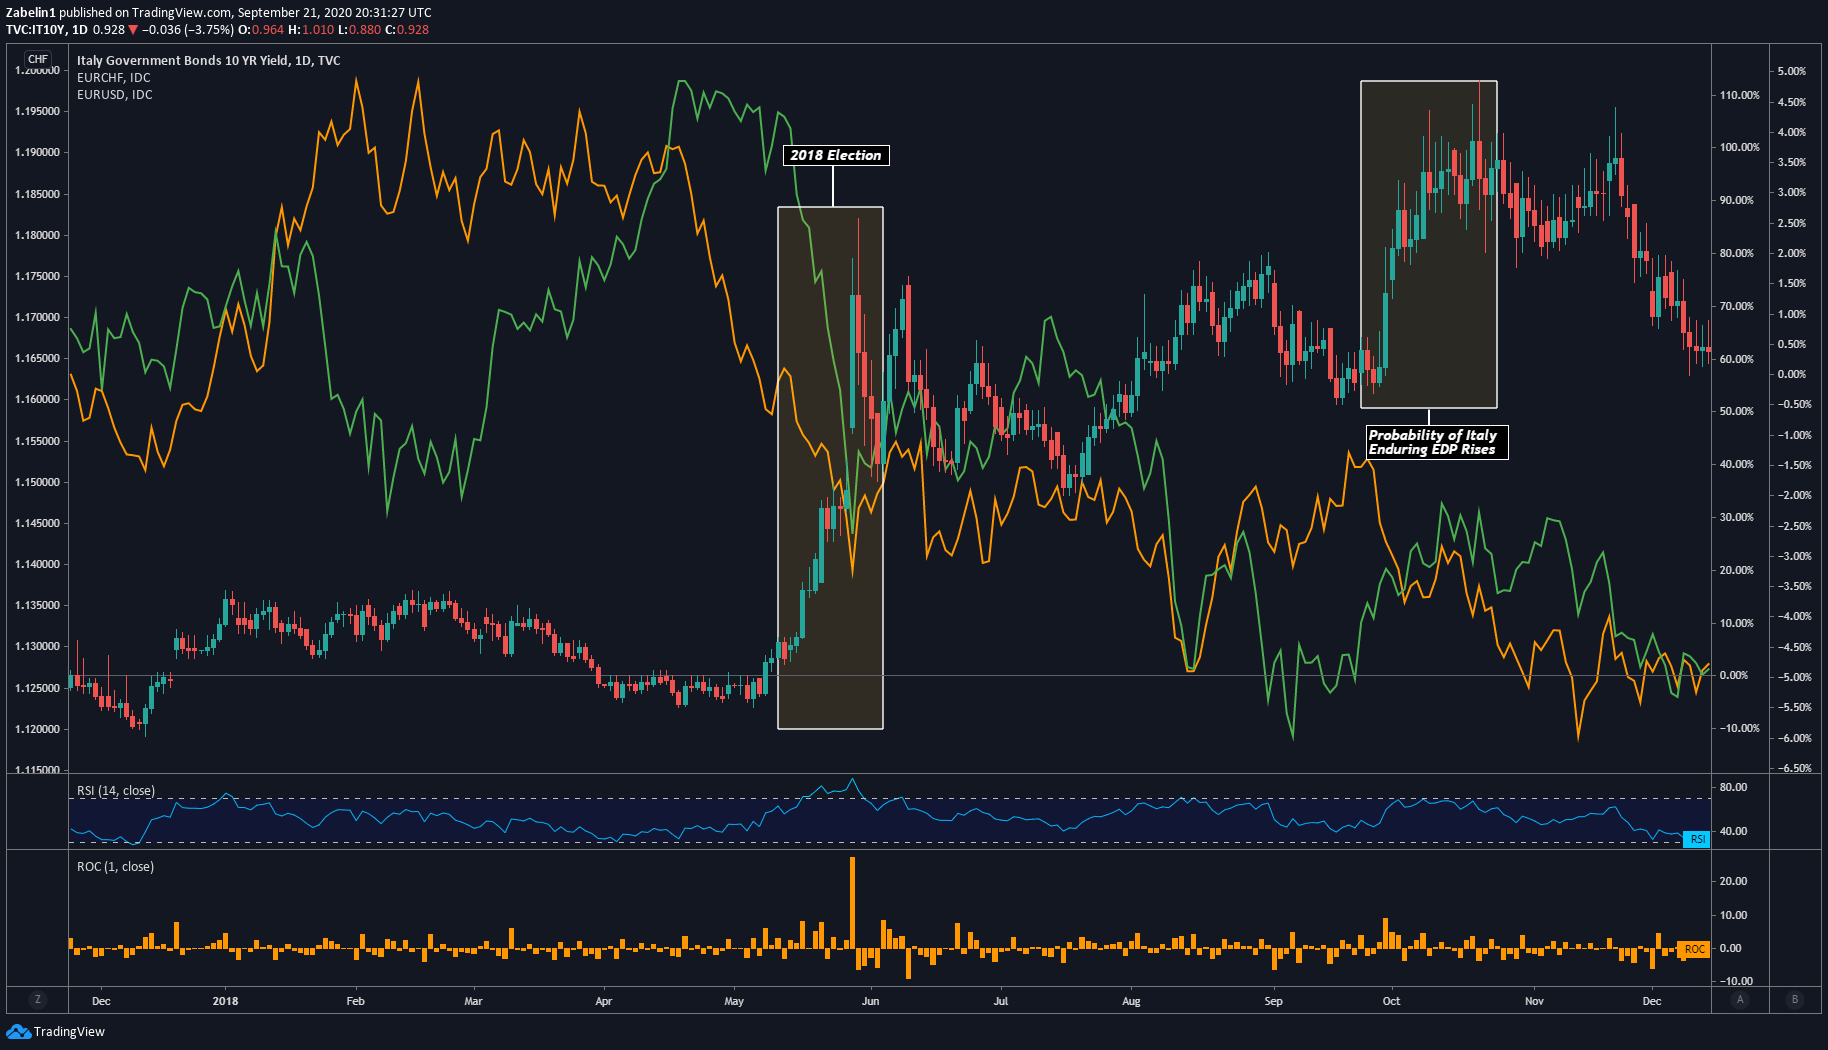
Chart showing EUR/USD, EUR/CHF

The US Dollar, Japanese Yen and Swiss Franc all gained at the expense of the Euro as investors redirected their capital to anti-risk assets. The Euro’s suffering was prolonged by a dispute between Rome and Brussels over the former’s budgetary ambitions. The government’s fiscal exceptionalism was a feature of their anti-establishment nature that in turn introduced greater uncertainty and was then reflected in a weaker Euro.

LATIN AMERICA: Nationalist-Populism in Brazil

While President Jair Bolsonaro is generally characterized as a fire-brand nationalist with populist underpinnings, the market reaction to his ascendency was met with open arms by investors. His appointment of Paulo Guedes – a University of Chicago-trained economist with a penchant for privatization and regulatory restructuring – boosted sentiment and investors’ confidence in Brazilian assets.
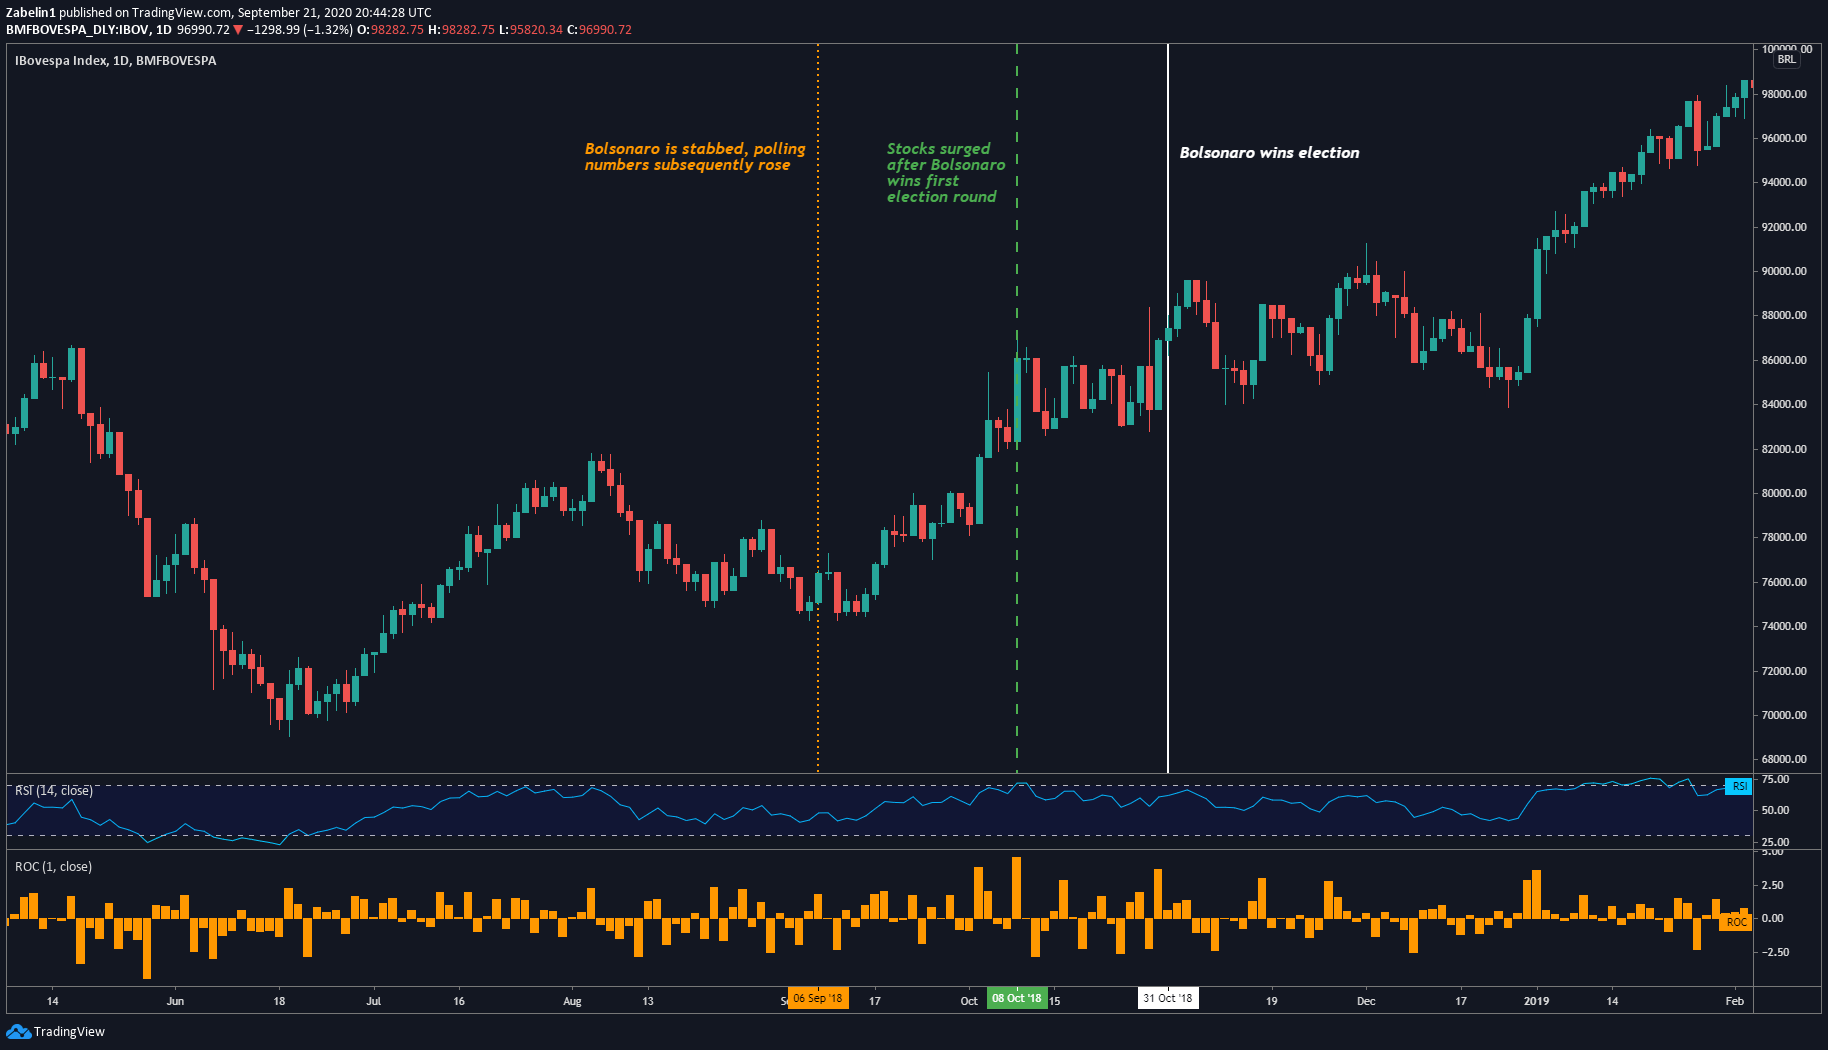
Chart showing Ibovespa Index

From June 2018 to the Covid-19 global markets rout in early 2020, the benchmark Ibovespa equity index rose over 58 percent compared with a little over 17 percent in the S&P 500 over the same time period. During the election in October, the Brazilian index rose over 12 percent in just one month as polls revealed that Bolsonaro was going to triumph over his left-wing opponent Fernando Haddad.

Since Bolsonaro’s ascent to the presidency, the ups and downs in Brazilian markets have reflected the level of progress on his market-disrupting pension reforms. Investors speculated that these structural adjustments will be strong enough to pull Brazil’s economy away from the precipice of a recession and toward a strong growth trajectory, unburdened by unsustainable public spending.

ASIA: Hindu Nationalism in India

The re-election of Prime Minister Narendra Modi was broadly welcome by markets, though lingering concerns were raised about the effect of Hindu nationalism on regional stability. However, Modi has a reputation for being a business-friendly politician. His election lured investors into allocating a significant amount of capital to Indian assets.

However, investors’ optimistic outlook is periodically undermined by periodic clashes between India and its neighbors over territorial disputes. In the first breaths of 2019, India-Pakistan relations soured drastically amid a skirmish over the disputed Kashmir region. Since the 1947 partition, the hostility between the two nuclear powers has been an ever-present regional risk.

India Nifty 50 Index, S&P 500 Futures, AUD/JPY Fall After News Broke of India-Pakistan Skirmish
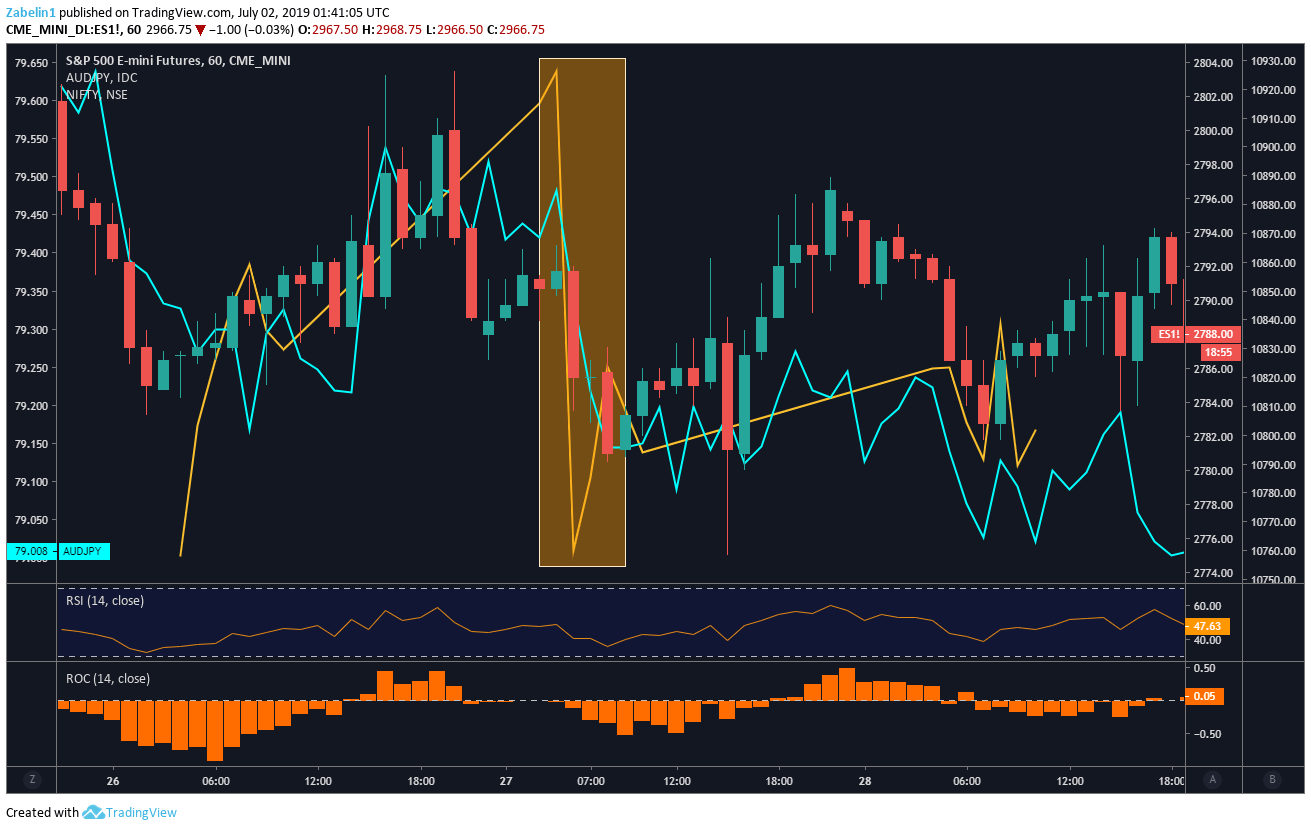
Chart showing S&P 500 Futures, AUD/JPY

Tension between India and China, particularly over the disputed border known as the Line of Actual Control (LAC) in the Himalayan Mountains also rattled Asian financial markets. In June 2020, news of a skirmish between Chinese and Indian troops resulting in over 20 deaths raised concerns about what further escalation could mean for regional security and financial stability. Read the full report here.

India Nifty 50 Index, S&P 500 Futures, US 10-Year Treasury Yield, USD/INR After News Broke of India-China Skirmish
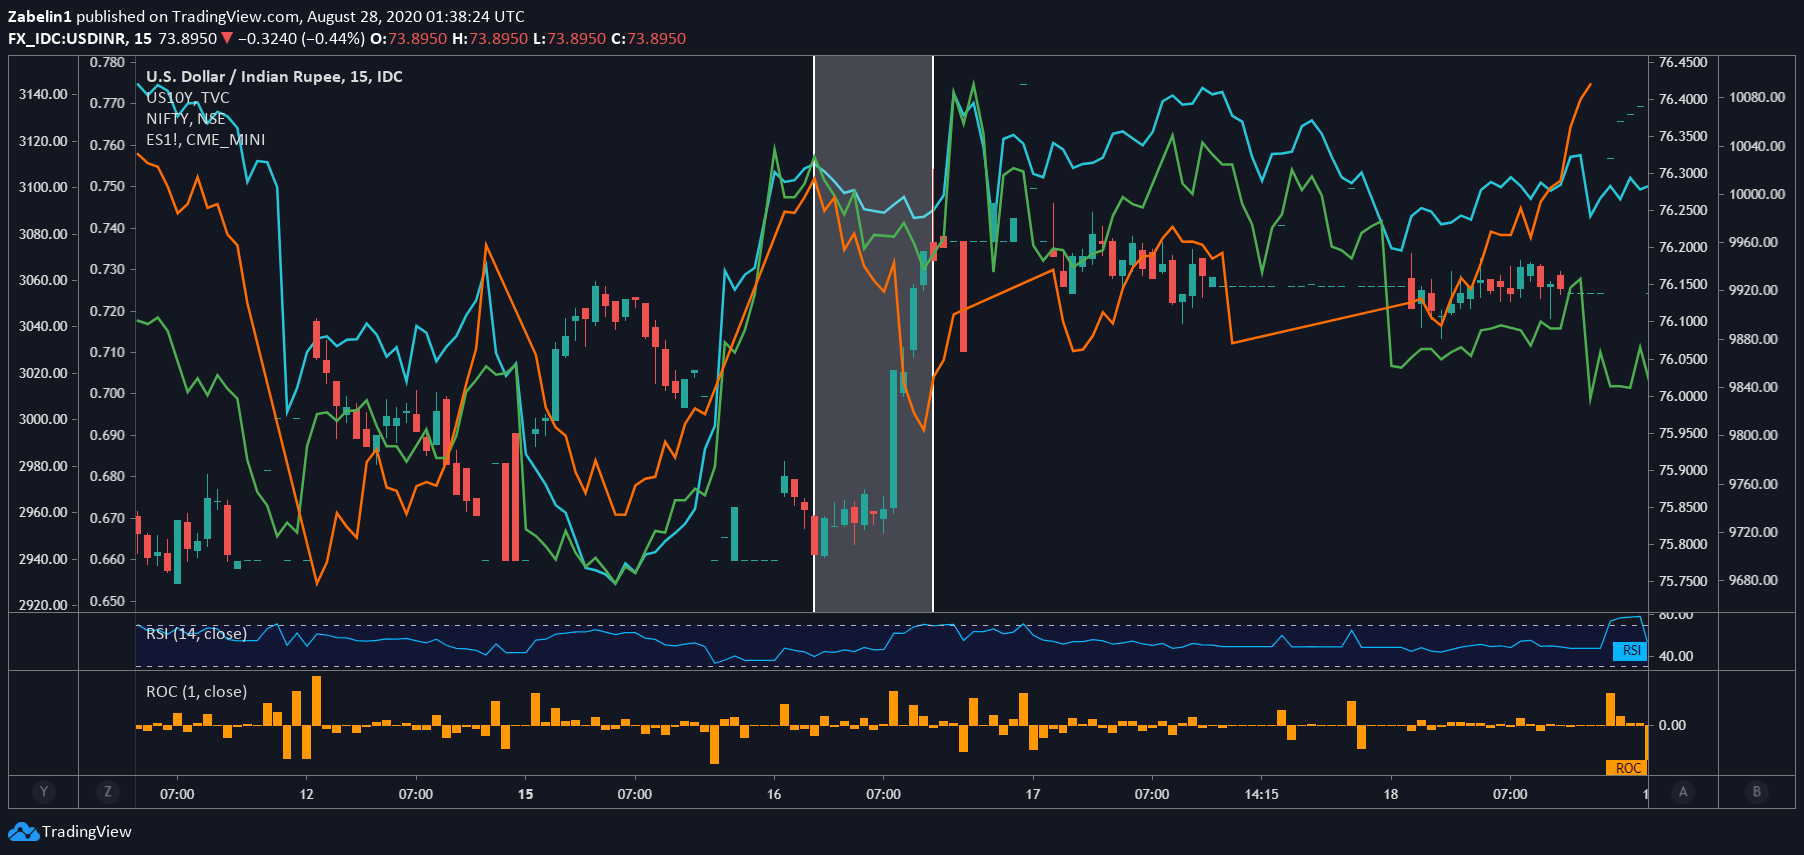
Chart showing S&P 500 futures, USD/INR

ationalist campaigns and governments are embedded with political risk because the very nature of such a regime relies on displaying strength and frequently equates compromise with capitulation. In times of political volatility and economic fragility, the financial impact of a diplomatic breakdown is amplified by the fact that a resolution to a dispute will likely be prolonged due to the inherently stubborn nature of nationalist regimes.

US President Donald Trump and Modi employed a similar brand of strong rhetoric both on the campaign trail and within their respective administrations. In a rather ironic way, their ideological similarity may in fact be a force that causes a rift in diplomatic relations. Tensions between the two have escalated in 2019, with markets worrying that Washington may start another trade war in Asia, opening a second front in India having already engaged China.

HOW FX REACTS AS GOVERNMENTS, CENTRAL BANKS RESPOND TO GEOPOLITICAL & ECONOMIC STRESS

For economies with a high degree of capital mobility, there are essentially four different sets of policy-mix alternatives that can provoke a reaction in FX markets following an economic or geopolitical shock:

  • Scenario 1: Fiscal policy is already expansionary + monetary policy becomes more restrictive (“tightening”) = Bullish for the local currency
  • Scenario 2: Fiscal policy is already restrictive + monetary policy becomes more expansionary (“loosening”) = Bearish for the local currency
  • Scenario 3: Monetary policy already expansionary (“loosening”) + fiscal policy becomes more restrictive = Bearish for the local currency
  • Scenario 4: Monetary policy is already restrictive (“tightening”) + fiscal policy becomes more expansionary = Bullish for the local currency

It is important to note that for an economy like the United States and a currency like the US Dollar, whenever fiscal policy and monetary policy start trending in the same direction, there is often an ambiguous impact on the currency. Below we will examine how various fiscal and monetary policy remedies for geopolitical and economic shocks impact currency markets.

Scenario 1 – FISCAL POLICY LOOSE; MONETARY POLICY BECOMES TIGHTER

On May 2, 2019 – following the FOMC decision to hold rates in the 2.25-2.50 percent range – Fed Chair Jerome Powell said that relatively soft inflationary pressure noted at the time was “transitory”. The implication here was that while price growth was below what central bank officials were hoping for, it would soon accelerate. The US-China trade war played a role in slowing economic activity and muting inflation.

The implicit message was then a reduced probability of a rate cut in the near term, given that the fundamental outlook was judged to be solid and the overall trajectory of US economic activity seen to be on a healthy path. The neutral tone struck by the Fed was comparatively less dovish than what markets had anticipated. This might then explain why the priced-in probability of a Fed rate cut by the end of the year (as seen in overnight index swaps) fell from 67.2 percent to 50.9 percent after Powell’s comments.

Meanwhile, the Congressional Budget Office (CBO) forecasted an increase in the fiscal deficit over a three-year time horizon, overlapping the central bank’s would-be tightening cycle. What’s more, this came against the backdrop of speculation about a bipartisan fiscal stimulus plan. In late April, key policymakers announced plans for a US$2 trillion infrastructure building program.

The combination of expansionary fiscal policy and monetary tightening made the case for a bullish US Dollaroutlook. The fiscal package was expected to create jobs and boost inflation, thereby nudging the Fed to raise rates. As it happened, the Greenback added 6.2 percent against an average of its major currency counterparts over the subsequent four months.

Scenario 1: DXY, 10-Year Bond Yields Rise, S&P500 Futures Fall
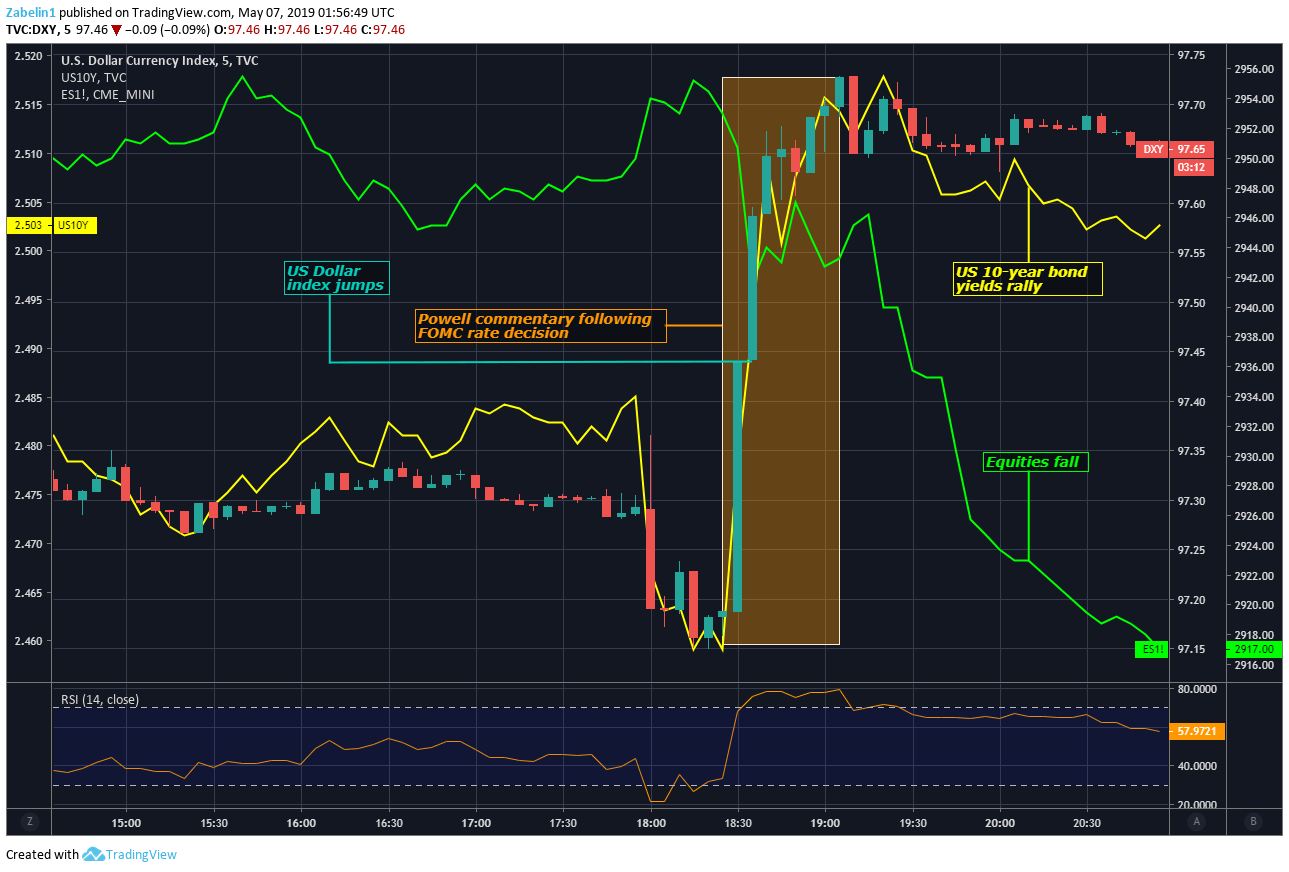
Chart showing DXY, S&P 500 Futures

Scenario 2 – FISCAL POLICY TIGHT; MONETARY POLICY BECOMES LOOSER

Theglobal financial crisis in 2008 and the Great Recession that followed rippled out worldwide and destabilized Mediterranean economies. This stoked worries about a region-wide sovereign debt crisis as bond yields in Italy, Spain and Greece climbed to alarming levels. Mandated austerity measures were imposed in some cases which helped create the basis for Eurosceptic populism that hence haunted the region.

Investors began to lose confidence in the ability of these governments to service their debt and demanded a higher yield for incurring what appeared to be a rising risk of default. The Euro was in pain amid the chaos as doubtsemerged about its very existence in the event that the crisis forced the unprecedented departure of a member state from the Eurozone.

In what is considered to be one of the most famous moments in financial history, European Central Bank (ECB) President Mario Draghi delivered a speech in London on July 26, 2012 which many would come to see as a pivotal moment that saved the single currency. He said that the ECB is “ready to do whatever it takes to preserve the Euro. And believe me,” he added,“it will be enough.” This speech calmed European bond markets and helped bring yields back down.

The ECB alsocreated a bond-buying program called OMT (for “Outright Monetary Transactions”). It was aimed at reducing stress in sovereign debt markets, offering relief to distressed Eurozone governments. While OMT was never used, its mere availability helped becalm jittery investors.At the same time, many of the troubled Euro area states adopted austerity measures to stabilize government finances.

While the Euro initially rose as worries about its collapse receded, the currency would depreciate substantially against the US Dollar over the course of the following three years. By March 2015, it had lost over 13 percent of its value. When examining the monetary and fiscal set up, it becomes quite clear why.

Scenario 2: Euro Sighs Relief – Sovereign Bond Yields Fall as Insolvency Fears are Quelled
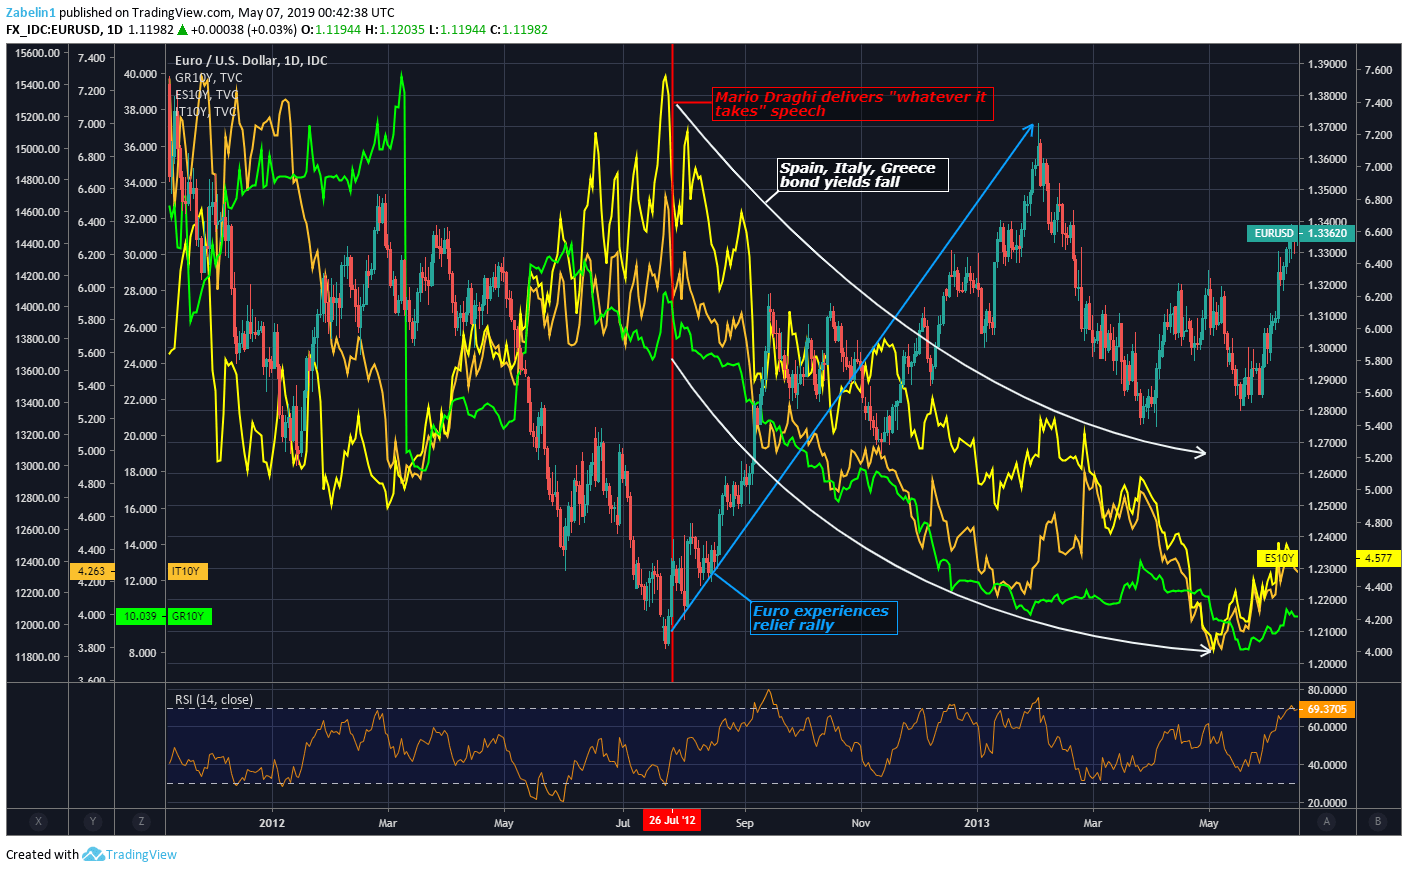
Chart showing EUR/USD, European sovereign bond yields

Austerity measures in many Eurozone countries limited their governments’ ability to provide fiscal stimulus that might have helped create jobs and boost inflation. At the same time, the central bank was easing policy as a way to alleviate the crisis. Consequently, this combination pressured the Euro lower against most of its major counterparts.

Scenario 2: Euro, Sovereign Bond Yields Fall
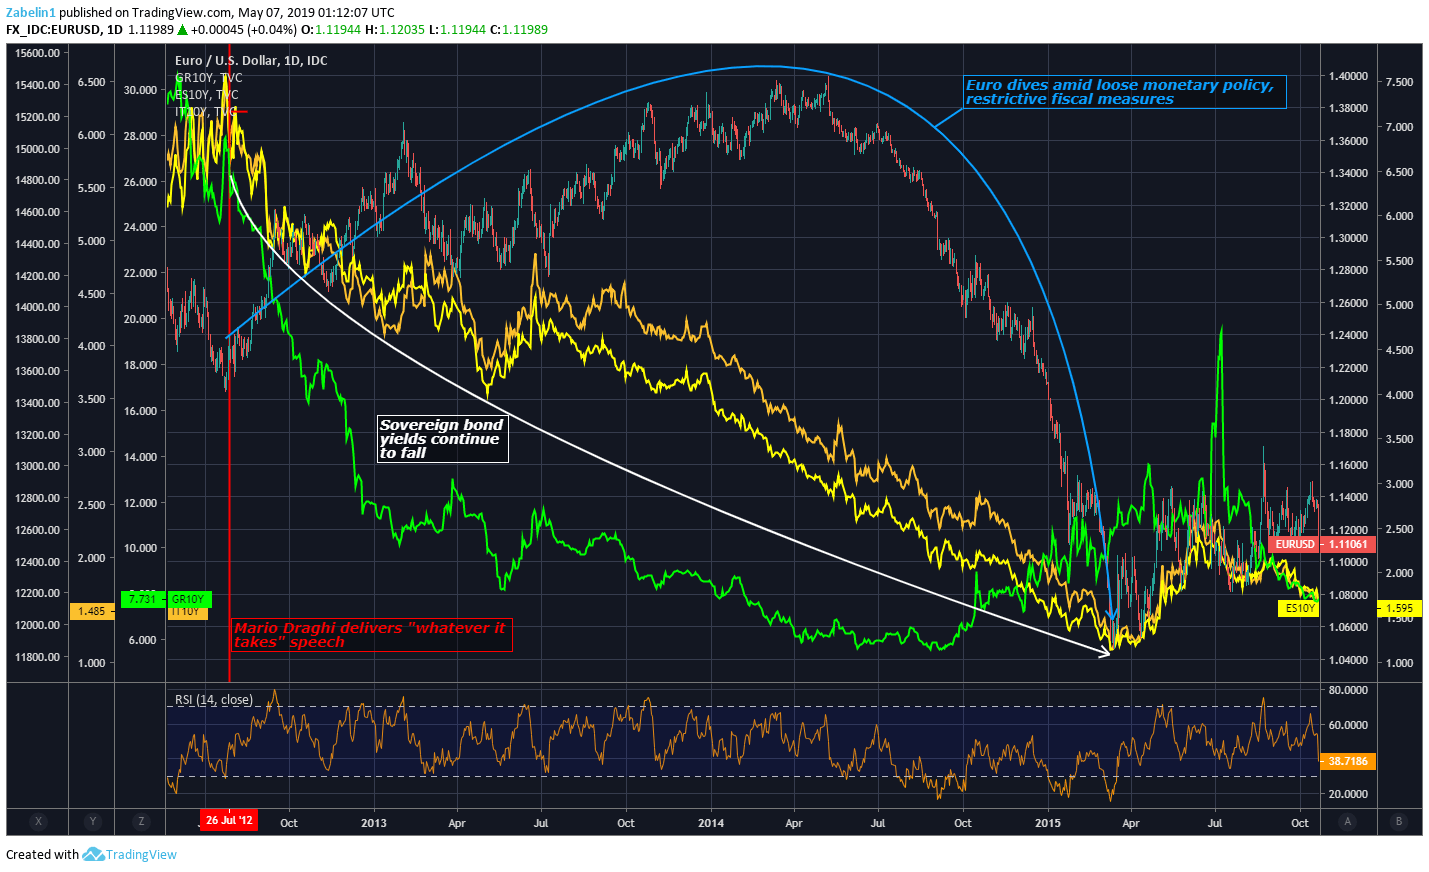
Chart showing EUR/USD, European sovereign bond yields

Scenario 3 – MONETARY POLICY LOOSE; FISCAL POLICY BECOMES TIGHTER

At the early stages of the Great Recession, the Bank of Canada (BOC) cut its benchmark interest rate from 1.50 to 0.25 percent as a way to ease credit conditions, restore confidence and revive economic growth. Counterintuitively, the yield on 10-year Canadian government bonds began to rise. This rally came right around the same time as Canada’s benchmark TSX stock index established a bottom.

Scenario 3: USD/CAD, TSX, Canadian 2-Year Bond Yields
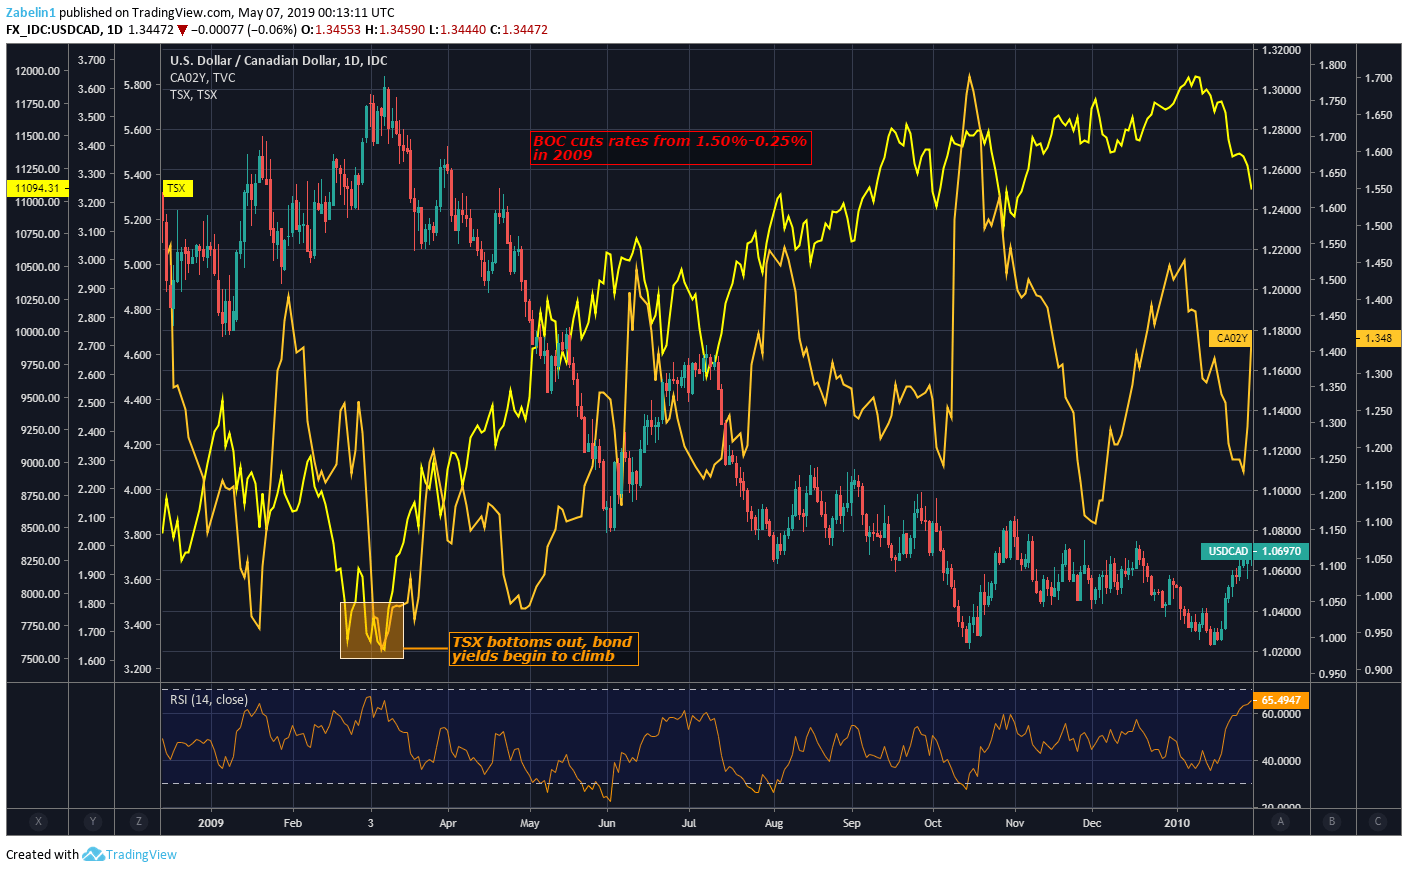
Chart showing USD/CAD, TSX

The subsequent restoration of confidence and recovery in share prices was reflected ininvestors’ shifting preference for riskier, higher-returning investments (like stocks)in lieu of comparatively safer alternatives (like bonds). This reallocation of capital sent yields higher despite the central bank’s monetary easing. The BOC then began to raise its policy interest rate anew and brought it up to 1percent, where it remained for the subsequent five years.

During this time, Prime Minister Stephen Harper implemented austerity measures to stabilize the government’s finances amid the global financial crisis. The central bank then reversed course and cut rates back to 0.50 percent by July 2015.

Both CAD and local bond yields suffered as monetary policy was loosened while the capacity for fiscal policy support was constrained. As it happens, cutting back government spending at this difficult time ended up costing Mr Harper his job. Justin Trudeau replaced him as Prime Minister following a victory in the 2015 general election.

Scenario 3: USD/CAD, Canada 2-Year Bond Yields
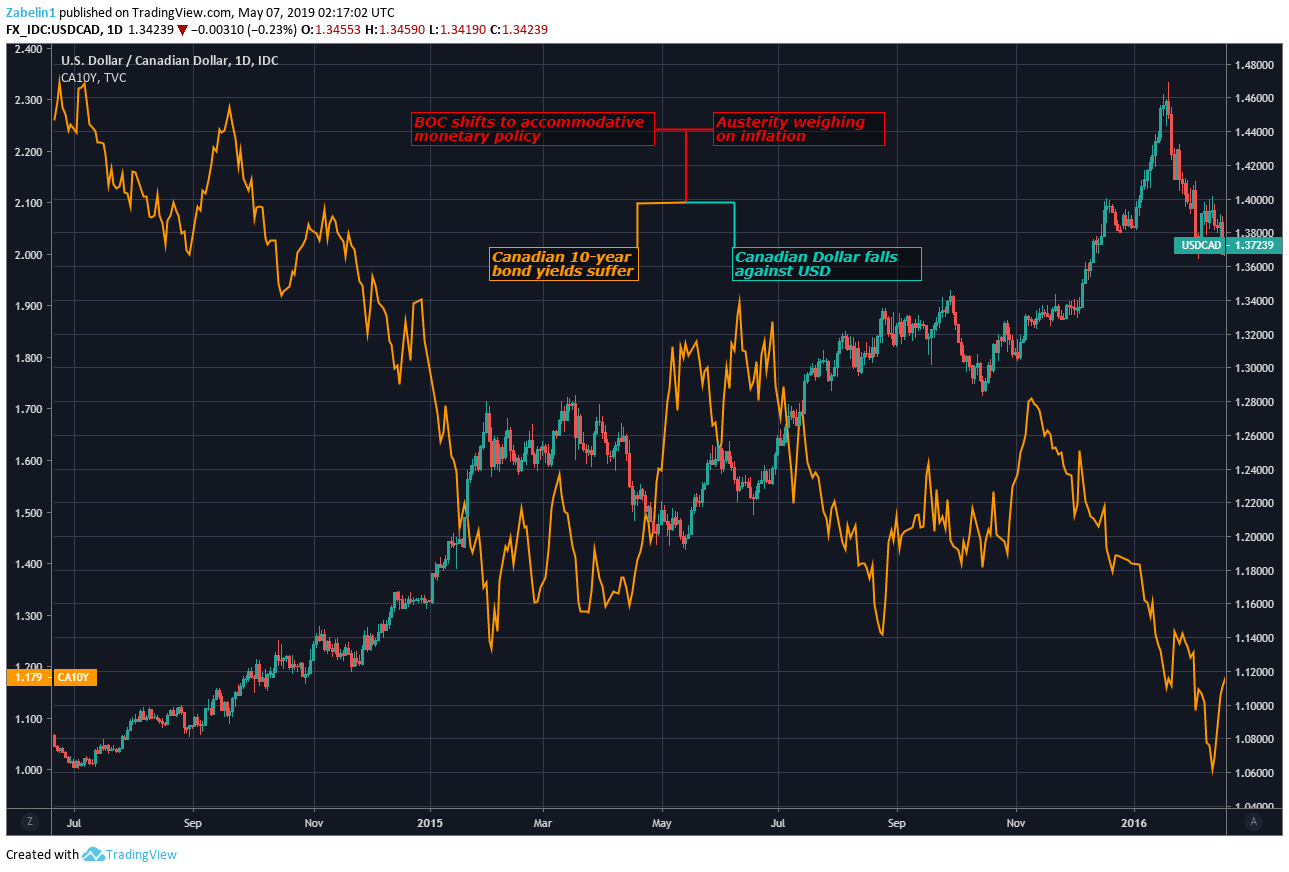
Chart showing USD/CAD

Scenario 4 – MONETARY POLICY TIGHT; FISCAL POLICY BECOMES LOOSER

After Donald Trump was proclaimed the victor in the 2016 USpresidential election, the political landscape and economic backdrop favored a bullish outlook for the US Dollar. With the the Oval Office and both houses of Congress thus controlled by the Republican Party, the markets appeared to conclude that scope for political volatility had been reduced.

This made the market-friendly fiscal measures proposed by candidate Trump during the electionappear more likely to be implemented. These included tax cuts, deregulation and infrastructure building. Investors appeared to overlook threats to launch trade wars against top trading partners such as China and the Eurozone, at least for the time. On the monetary side, central bank officials raised rates at the tail end of 2016 and were looking to hike again by at least 75 basis points through 2017.

With scope for fiscal expansion and monetary tightening in sight, the US Dollar rallied alongside local bond yields and equities. This came as corporate earnings expectations strengthened alongside the outlook for broader economic performance. This stoked bets on firmer inflation and thereby on a hawkish response from the central bank.

Scenario 4) US Dollar Index (DXY), S&P 500 Futures, 10-Year Bond Yields (Chart 7)
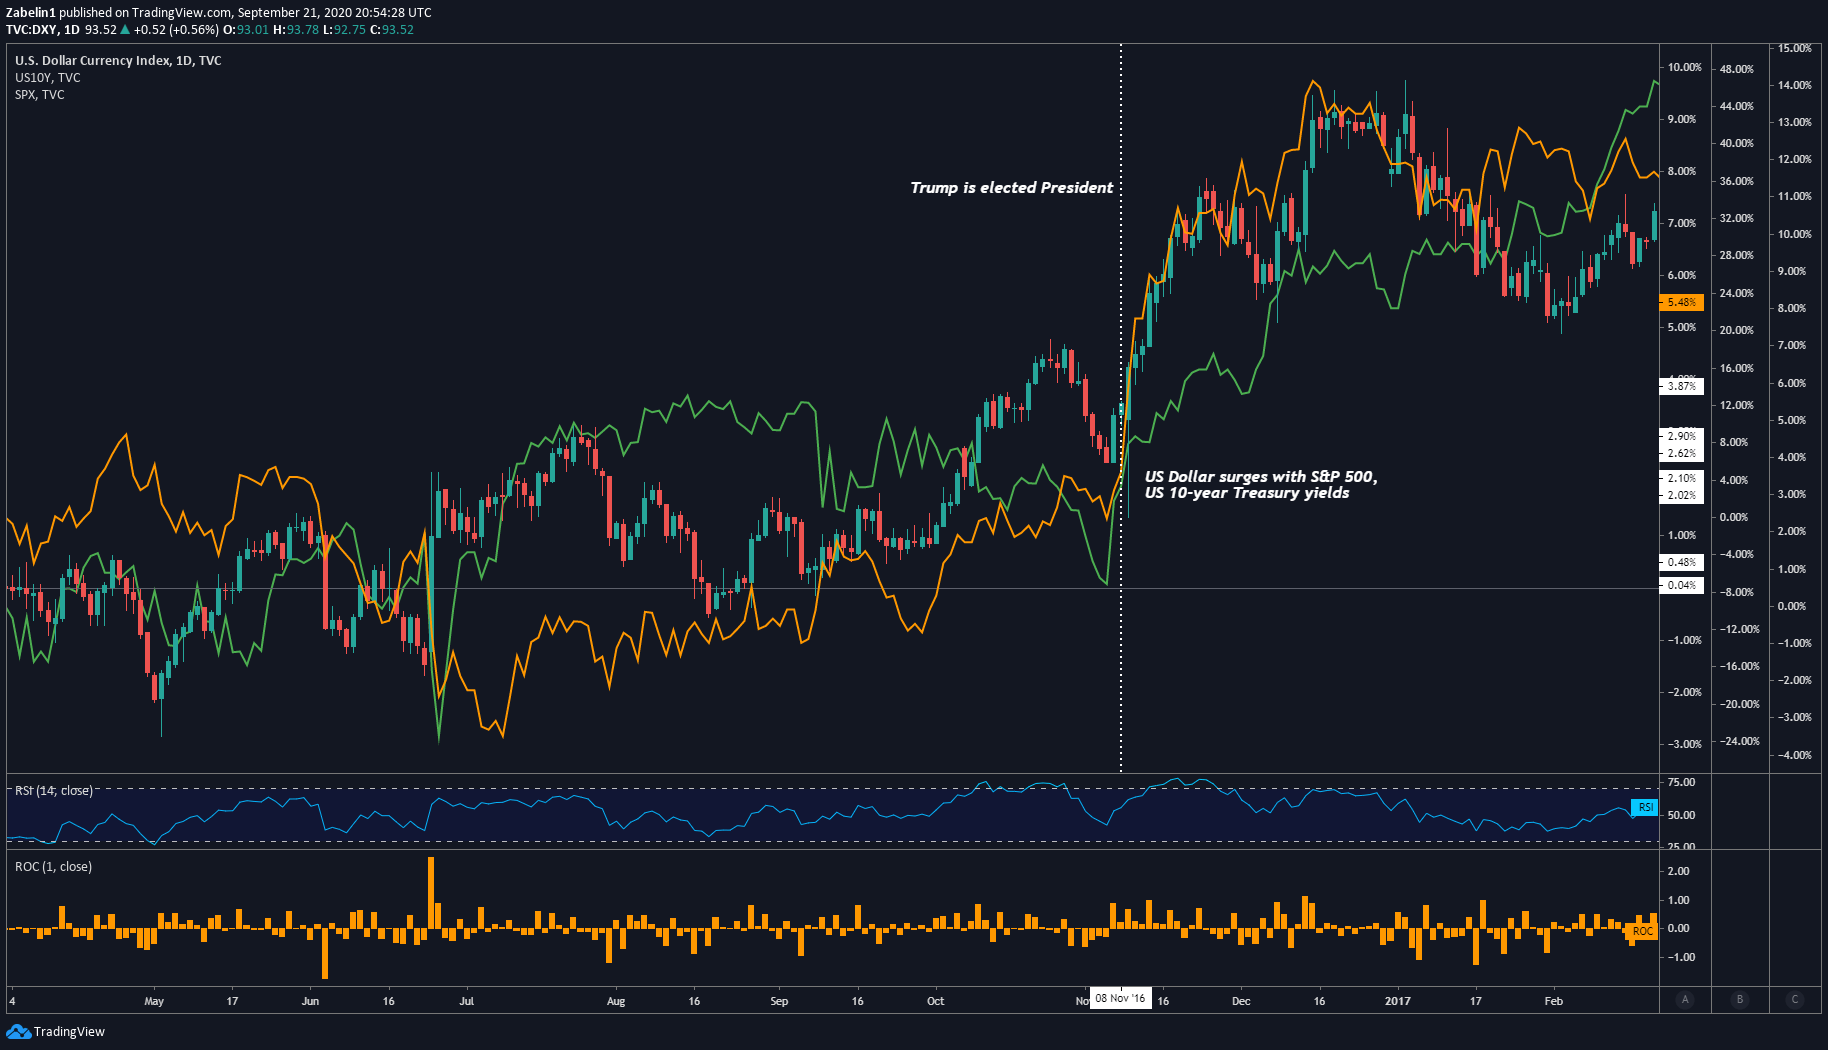
Chart showing US Dollar, S&P 500 Futures

WHY POLITICAL RISKS MATTER FOR TRADING

Countless studies have shown that a significant decline in living standards from war or a severe recession increase the propensity for voters to take up radical positions on the political spectrum. As such, people are more likely to deviate from market-friendly policies – such as capital integration and trade liberalization – and instead focus on measures that turn away from globalization and are deleteriously inward-facing.

The modern globalized economy is interconnected both politically and economically and therefore any systemic shock has a high probability of echoing out into the world. During times of significant political volatility amid inter-continental ideological changes, it is crucial to monitor these developments because within them are opportunities to set up short, medium and long-term trading strategies.

Fed Policymakers Recommit to Strong Ethics in Wake of Two Lapses

Federal Reserve Chair Jerome Powell said 19 policymakers this week recommitted to following the highest ethical standards in the wake of two recent lapses.

“The public’s trust is really the Fed’s — and any central bank’s — most important asset,” Powell told reporters Wednesday in Washington following the end of a two-day Federal Open Market Committee meeting where policymakers decided to raise rates by 75 basis points.

“And any time one of us — one of the policymakers — violates or falls short of those rules, we do risk undermining that trust. And we take that very seriously.”

The central bank has faced renewed criticism over its ethics standards following two recent incidents that have brought additional scrutiny. Atlanta Fed President Raphael Bostic on Oct. 14 revealed he violated central bank policy on financial transactions, leading Powell to ask the Fed’s inspector general to review his financial disclosures.

In a separate incident, St. Louis Fed President James Bullard last month attended a Citigroup Inc.-hosted meeting in Washington to which media were not invited and at which he discussed monetary policy. The St. Louis Fed has since said it would think differently about accepting such invitations in the future.

‘Good System’

“We had a committee discussion of the full committee on the importance of holding ourselves individually and collectively accountable for knowing and following the high standard that’s set out in our existing rules with respect to both personal investment activities and external communications,” Powell said.

Powell said that the Bostic error was discovered as part of a review by the board’s new process to scrutinize financial disclosures.

“So it’s a really good system,” he said. “We recommitted to each other and to this institution to hold ourselves to the highest standards and avoid these problems.”

Following the Bostic disclosure, Senator Elizabeth Warren, a Massachusetts Democrat, said the revelations show “an alarming failure by President Bostic and further evidence of the depth of the ethics problem at the Fed.”

Some economists said the Bullard speech appeared to violate the FOMC’s internal guidelines stating that participants “will strive to ensure that their contacts with members of the public do not provide any profit-making person or organization with a prestige advantage over its competitors.”

The Fed overhauled its ethics rules in 2021 after revelations about unusual trading activity during 2020 by several senior officials as the central bank slashed interest rates to nearly zero and unleashed emergency lending programs to protect the economy as the pandemic spread.

Then-Dallas Fed President Robert Kaplan and his Boston colleague Eric Rosengren both announced their early retirement following the revelations, with Rosengren citing ill health.

Powell said he didn’t have an update on the IG probe of Rosengren and Kaplan’s trading.

gold cot chart

Gold Price Forecast: US Jobs Report in Focus as Traders Digest FOMC

Gold prices are moderating after falling nearly 1% on Wednesday in response to the FOMC decision. The US central bank hiked its benchmark rate by 75 basis points in a widely expected move. Fed Chair Jerome Powell pushed back on the narrative that the Fed would pause rate hikes, stating: “It’s very premature, in my view, to think about or to be talking about pausing our rate hikes.” Mr. Powell went on to say that rates will most likely have to go higher than previously forecasted. Fed funds futures moved to price a 5% terminal rate at the May 2023 meeting.

Gold prices fell on those comments. Treasury yields and the US Dollar rose, reducing the yellow metal’s investment appeal. The US Dollar DXY Index and mid- to long-term Treasury rates remain below their recent highs despite a modest increase in Fed rate hike bets. Assuming the US Dollar and rates across much of the curve remain off their highs, bullion prices should hold above recent lows around 1,615 to 1,617.

Still, downside risks remain, and because the Fed’s outlook relies on economic data, gold prices are largely driven by how the market thinks the Fed will interpret and act on that data. A resilient US labor market has complicated central bank efforts to lower inflation. While interest rates take longer to affect the jobs market, data such as job openings and initial jobless claims have not yet signaled a turn. According to the Job Openings and Labor Turnover Survey (JOLTS) for September, job openings accelerated to 10.72 million, beating the +10 million estimate and up from an upwardly revised 10.28 million in August.

That said, the US non-farm payrolls report (NFP) on Friday offers gold’s next directional cue. According to a Bloomberg survey, analysts expect the US to add 200k jobs for October. That would be the weakest growth since December 2020, likely cooling Fed rate hike bets and dragging the USD and yields lower, a positive outcome for gold. The downside risk would be a stronger-than-expected number.

Gold – Speculator Positioning

Gold speculator trimmed their bullish bets on the metal, according to the latest Commitments of Traders report (COT) from the CFTC. For the week ending October 25, non-commercial shorts rose by 9,990, while longs held virtually unchanged. Those trades brought gold’s net long position to 59,342, the lowest since September, which was the weakest long position since April 2019.

Gold Versus Non-Commercial Long/Short Positions

gold cot chart

XAU/USD Technical Outlook

Gold is trading around 0.3% higher in Asia-Pacific trading, which trims the weekly loss to about 0.25%. A potential Double Bottom reversal is in play, which may mark the reversal point of a long-term downtrend. Prices need to break above resistance—the peak between the September and October troughs at 1,729.46—before a breakout is likely.

First, prices would need to clear the descending trendline and the 50-day Simple Moving Average (SMA). The measured move (distance between troughs and peak) puts the breakout target at 1,840.75. If prices fall below the troughs, it would invalidate the pattern. A positive divergence in the Relative Strength Index (RSI) lends support to a bullish outlook.

XAU/USD Daily Chart

Chart, line chart  Description automatically generated


Why Fed rate rises are a self-harming process

Federal Reserve interest rate hikes are painful for the economy. But they are also painful for the Federal Reserve itself. There are two elements here: 1. The return on the Fed’s bond holdings, and 2: Interest rate payments that the Fed itself needs to pay.

Both of these are off the charts and implicate the Fed in a self-harming process that’s far from complete. Let’s take these one at a time.

First to the Fed’s bond holdings. These have rocketed through various iterations of emergency bond buying (the Great Financial Crisis and the pandemic), and have left the Fed with a large bond portfolio on its hands. Total returns on bonds for 2022 are the worst on record for modern times, with Fed hikes a key driver. US Treasuries are running on returns of some -14% year-to-date. Applying this to the Fed’s holdings shows a remarkably large negative total return of approaching USD 1trn so far in 2022 (annualised) when the Treasury and Mortgage-Backed Security holdings are aggregated.

US Treasuries are down 14% so far in 2022

At first sight, this looks quite severe. However, for now, this is no more than a paper return and accounting treatment would determine whether the numbers are impactful or not. And they should not be, to the extent that bonds eventually roll off at par, and are held on an amortised cost basis. Another measure of pain in the book might be to look at the average price, which is currently at around 93 on the dollar, a 7% price discount. The longer-dated holdings are at a much deeper discount, but as long as coupons are paid and redemption is met by the US Treasury, there is no material issue.

The Federal Reserve’s net income for 2021 showed a figure of USD 108bn, up some USD 19bn from 2020, and the bulk of this increase was from interest income – effectively coupon payments – on its bond holdings. Even if bond prices fall, they will still pay coupon payments. And to that extent, the bond portfolio continues to make a net positive interest rate contribution. Consequently, it’s worth noting the valuations, but it should not prove to be destabilising and in many ways, it’s a reversal of the positive returns seen in previous years, as you can see in the chart below.

Estimated rolling total returns from the Fed’s holding of bonds

USD bn, annualised

Source: ING estimates, The Federal Reserve, Macrobond
Secondly, there are the payments the Fed makes to eligible counterparties that park cash with them. There are two main routes here. First is the rate paid on excess reserves. Before the Great Financial Crisis, only regulatory reserves were compensated. But that changed as the Fed used the rate on excess reserves as a means to control front-end market rates, helping to ensure that the effective funds rate continued to trade within the ceiling and floor funds rates. The cost of doing so was minimal, as rates were on the floor and the Fed started by paying 25bp on excess reserves.

Fast forward to today though and the rate paid on excess reserves is 3.15%. Moreover, it will be 75bp higher post the 2nd November FOMC meeting, and the market discounts that it gets will be quite close to 5%. On top of that, the volume of excess reserves is now massive, at around USD 3trn. On an annualised basis, the remuneration cost to the Fed at this window is approaching USD 100bn. At the beginning of the year, it was below USD 10bn.

The Fed is now paying $170bn on cash parked with it, up from below $10bn

Reserves are off their highs though, down from a peak in the USD 4trn area. But this has been facilitated by a rocketing in cash going back to the Fed on the reverse repo facility. That’s gone from practically zero at the beginning of the year to over USD 2trn currently. It gets renumerated at a rate of 3.05%, and again that continues to rise in line with official rates. Based on where we are now, the annualised remuneration in this window amounts to around USD 75bn. In total, the Fed is paying some USD 170bn on these windows combined, as we illustrate below.

USD bn, annualised

Source: ING estimates, The Federal Reserve, Macrobond
ING estimates, The Federal Reserve, Macrobond

On the other side of the balance sheet, the Fed can offset some of that through interest rate receipts on other facilities. In fact, the bond portfolio is the largest contributor. If we take a simple back-of-the-envelope average coupon of 2% on a combined USD 7.5trn bond portfolio, that would provide an interest rate receipt of some USD 150bn. That almost covers it. But note that if key rates head towards 5%, that will add an additional interest rate cost of some USD 100bn, which is approximately the size of the Fed’s total net income for 2021.

At the end of 2021, the Fed’s interest rate cost on the reserves and reverse repo windows was less than USD 10bn, and the Fed had a net income of USD 108bn for 2021. The simple running yield coming from coupon payments was in the region of USD 150bn. For 2022, that running coupon income is broadly similar, and actually a tad lower as USD 95bn per month of bonds is rolling off the front end. But the remuneration the Fed will pay out on the reserves and reverse repo windows rockets to an average of a little over USD 100bn for 2022 as a whole, moving the Fed into the red.

The Fed’s running payout on cash parked with it approaches $250bn by December

Moreover, it ends the year running at around USD 250bn, painting an even heavier picture for 2023. That’s an additional USD 150bn running cost to be paid versus now. Under Fed accounting rules they would build an equal and opposite offsetting deferred asset, which would be paid down once the Fed returns to a net income position. But it still flips the Fed from being in a comfortable black position to being deep in the red.

Does all of this matter? Well, the annualised journey over the next few months in terms of net income won’t be pretty. Putting some round numbers on it, the swing factor likely sums to an annualised running USD 100-150bn hole at the Fed. At least until the Fed cuts rates in 2023. We think they will, and that will help. The Fed’s ongoing roll-off of bonds from its balance sheet will also help, as it will reduce excess liquidity in the system, likely prompting less parking of cash at the Fed’s reverse repo window.


French new factory orders slump at fastest rate since May 2020 as uncertainty and inflation take their toll

French manufacturing sector business conditions
deteriorated at a faster pace at the start of the fourth
quarter, latest PMI
® data from S&P Global showed, as new
orders slumped to an extent rarely seen since data were
first collected in 1998. As a result, production volumes fell
sharply and businesses remained pessimistic towards the
year ahead. October survey data also highlighted a survey-
record accumulation of finished goods stocks as companies
struggled to ship their products.
Meanwhile, French manufacturers remained stuck with
elevated cost pressures. High energy prices were frequently
mentioned by survey respondents. Output price inflation also
remained historically high, despite slowing to a 14-month
low.
The seasonally adjusted S&P Global France Manufacturing
Purchasing Managers’ Index ® (PMI ®
) posted below the 50.0
no-change mark for a second month in a row, indicating
back-to-back deteriorations in the health of France’s goods-
producing sector. At 47.2 in October, the headline measure
fell from 47.7 in September to its lowest level in almost two-
and-a-half years.
French manufacturing output volumes declined in October,
extending the current downturn that began in June. The
rate of contraction was of a similar strength to that seen
in September, which was the sharpest since May 2020.
Companies that cut their output levels commented on weak
demand and persistent supply issues.
October survey data pointed to a rapid deterioration in
new factory orders across France. The decrease was
among the fastest seen since data were first collected in
1998, with panel comments attributing the sales slump to
subdued underlying demand conditions, high inflation and
overstocked clients. Weak economic conditions abroad also
drove a sharp decline in new export orders at the start of the
fourth quarter.

Shop Prices Grow At Fastest Monthly Rate

It has been a difficult month for consumers who not only faced an increase in their energy bills, but also a more expensive shopping basket. Prices were pushed up because of the significant input cost pressures faced by retailers due to rising commodity and energy prices and a tight labour market. Even the price of basic items went up, with the price of the humble cuppa rising, as tea bags, milk and sugar all saw significant rises. While some supply chain costs are beginning to fall, this is more than offset by the cost of energy, meaning a difficult time ahead for retailers and households alike. With Christmas fast

AUD/USD and NZD/USD Fundamental Daily Forecast – NZ Jobless Rate Stays Near Record Low, Wages Rise

The New Zealand and Australian Dollars are inching higher early Wednesday as investors adjust positions ahead of today’s major U.S. Federal Reserve monetary policy and interest rate decisions.  The announcements will be made at 18:00 GMT.

The Fed is widely expected to raise interest rates by 75-basis points and then signal that it could reduce the size of its rate hikes starting as soon as December. The key word is “could”. This means traders are going to have to interpret the tone of the Fed, which could be the source of volatility later in the session.

Trading Derivatives carries a high level of risk to your capital and you should only trade with money you can afford to lose. Trading Derivatives may not be suitable for all investors, so please ensure that you fully understand the risks involved, and seek independent advice if necessary. A Product Disclosure Statement (PDS) can be obtained either from this website or on request from our offices and should be considered before entering into a transaction with us. Raw Spread accounts offer spreads from 0.0 pips with a commission charge of USD $3.50 per 100k traded. Standard account offer spreads from 1 pips with no additional commission charges. Spreads on CFD indices start at 0.4 points. The information on this site is not directed at residents in any country or jurisdiction where such distribution or use would be contrary to local law or regulation.

At 02:51 GMT, the NZD/USD is trading .5862, up 0.0023 or +0.39% and the AUD/USD is at .6410, up 0.0017 or +0.27%. On Tuesday, the Invesco CurrencyShares Australian Dollar Trust ETF (FXA) settled at $63.33, up $0.04 or +0.06.

New Zealand also released key employment data earlier in the day. The reports showed New Zealand’s job market remained tight in the third quarter, with the unemployment rate remaining near record lows and wages soaring.

New Zealand’s Job Market Remains Tight in Third Quarter

According to Stats NZ in a report released early Wednesday, New Zealand’s jobless rate stood at 3.3% in the third quarter, unchanged from the second quarter, while labor underutilization eased slightly.

The underutilization rate, a broader measure of spare labor capacity, dipped slightly to 9.0%, from 9.2% last quarter.

The labor force participation rate rose to 71.7% and the employment rate rose to 69.3%. Both are the highest rates recorded since the job market survey began in 1986, Stats NZ added.

Finally, over the year to the third quarter, the labor cost index increased 3.7%, compared with 3.4% in the prior quarter.

Daily Forecast

All eyes will be on the Fed at 18:00 GMT. We expect the Fed to follow-through with market expectations and announce a 75-basis point rate hike.

We also think Fed Chair Powell, in his post-meeting press conference, will say that policymakers discussed slowing the pace of rate hikes but did not commit to it. Furthermore, he may suggest that the decision to reduce the size of the December rate hike to 50-basis points will be data dependent.

This means traders will be flip-flopping between 75-basis points and 50-basis points in reaction to Friday’s Non-Farm Payrolls report and next week’s consumer inflation report. The Fed will also be monitoring growth data such as PMI and GDP reports.

We’re probably going to enter a period of heightened volatility because if the Fed can’t commit to a 50-basis point rate hike in December then investors are not likely to commit either until they see how the upcoming reports on labor and inflation play out.

image1.png

Crude Oil Forecast: Brent Bid on Possible Reduction in China’s COVID Policies, API & FOMC

BRENT CRUDE OIL FUNDAMENTAL BACKDROP

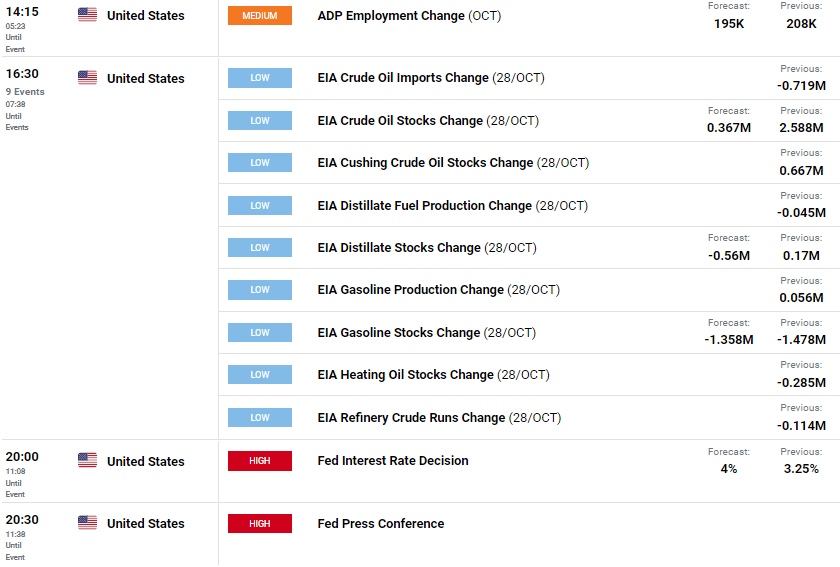
Brent crude oil received a significant lift as we enter November after a surprise miss on the API crude oil weekly stock report yesterday (see economic calendar below). The data showed a decline in inventories by 6.53m barrels per day against a projected increase of 0.267m barrels per day. The EIA release later this evening shows a similar increase estimate with another disappointing print likely extending brent price appreciation.

image1.png

Source: DailyFX economic calendar

Brent prices gained further traction this morning on the back of unconfirmed news that China may look to ease their ‘zero tolerance’ COVID-19 rules that have plagued the economy as well as contributing to demand destruction limiting upside on global commodities including brent crude.

image2.png

From a dollar perspective, and the focus for today is the Fed’s interest rate decision. Money market are pricing in a 75bps incremental hike with a high degree of probability (98.4%) but markets will shift their attention to the post-announcement press conference. Forward guidance will likely be delivered from this platform and with much talk around a Fed ‘pivot’, any dovish slant to the speech could see the dollar decline giving brent some support.

FEDERAL RESERVE INTEREST RATE PROBABILITIES

image3.png

TECHNICAL ANALYSIS

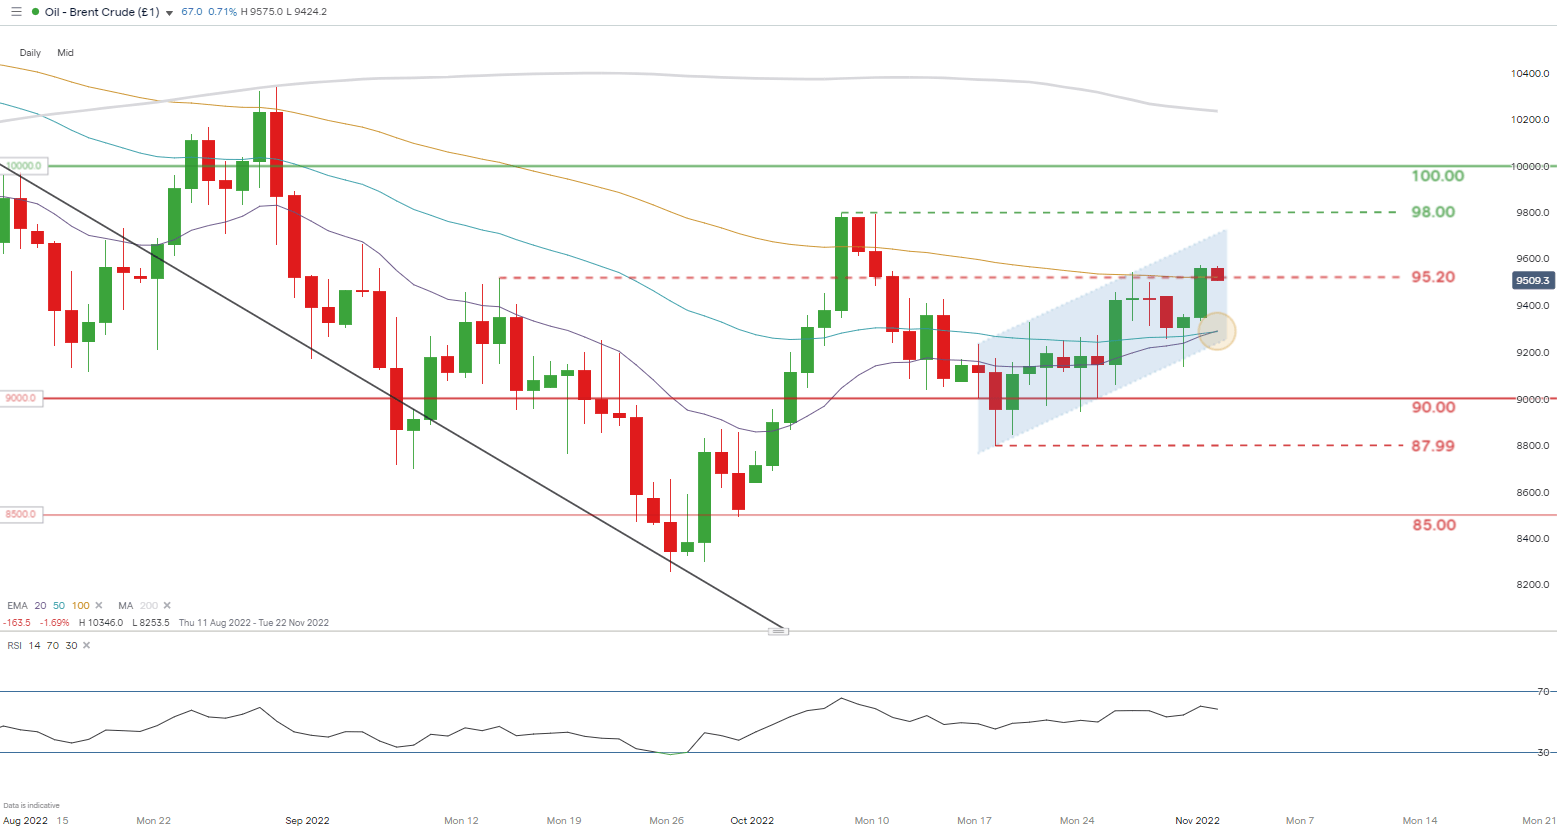
BRENT CRUDE (LCOc1) DAILY CHART -UNDATED

image4.png

image1.png

USD/JPY Technical Outlook: Growing Chance Uptrend May Pause

USD/JPY SHORT-TERM TECHNICAL FORECAST – NEUTRAL

Tuesday’s retreat from key intraday resistance has raised the odds of a minor setback in USD/JPY.

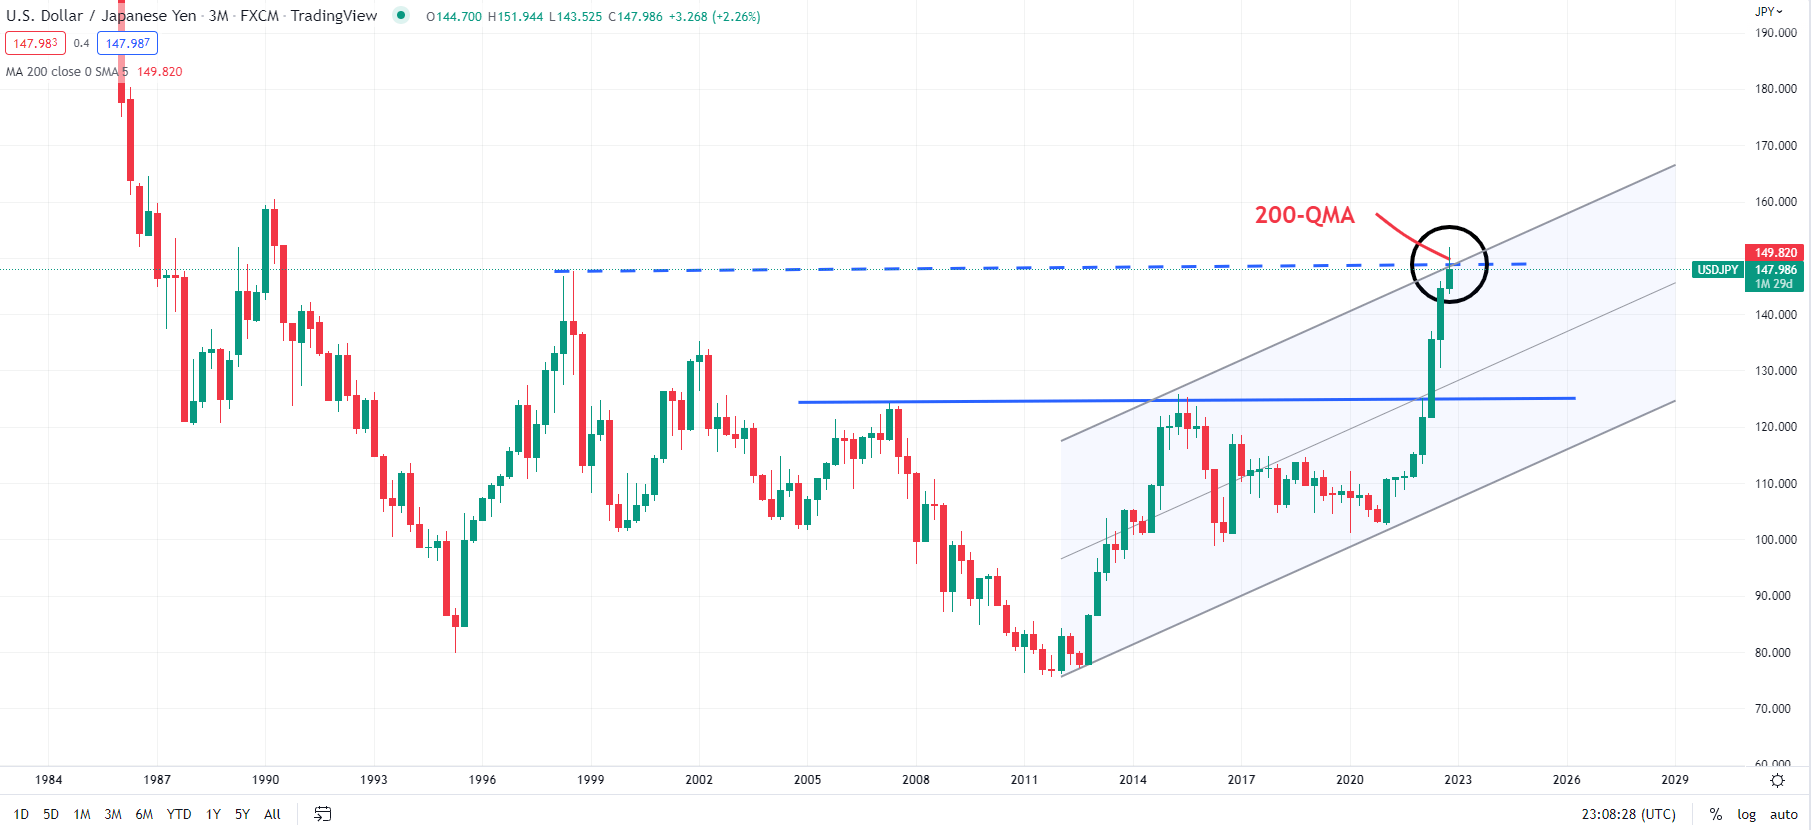
Notwithstanding the recovery in the New York session, USD/JPY continues to hold below key resistance at the October 25 high of around 149.00. This follows a solid bearish reversal on October 21, which came about from a major resistance area: the 1998 high of 147.65, coinciding with the 200-quarter moving average and the upper edge of a rising channel from 2012 (see chart).

USD/JPY Quarterly Chart

image1.png

Furthermore, back-to-back long-legged candles on the weekly charts at the October highs reflect indecision at major resistance, especially given the context of the sharp gains in recent months. Greater conviction – that is, big candles with small wicks or none at all – tends to increase the probability of a resistance break. However, small candle bodies with long wicks telegraph reduced chances of an imminent break of resistance, as they tend to reflect a lack of confidence. This is further reinforced by negative divergence on the daily and weekly charts (rising price associated with stalling or declining momentum). That may speak to rally fatigue.

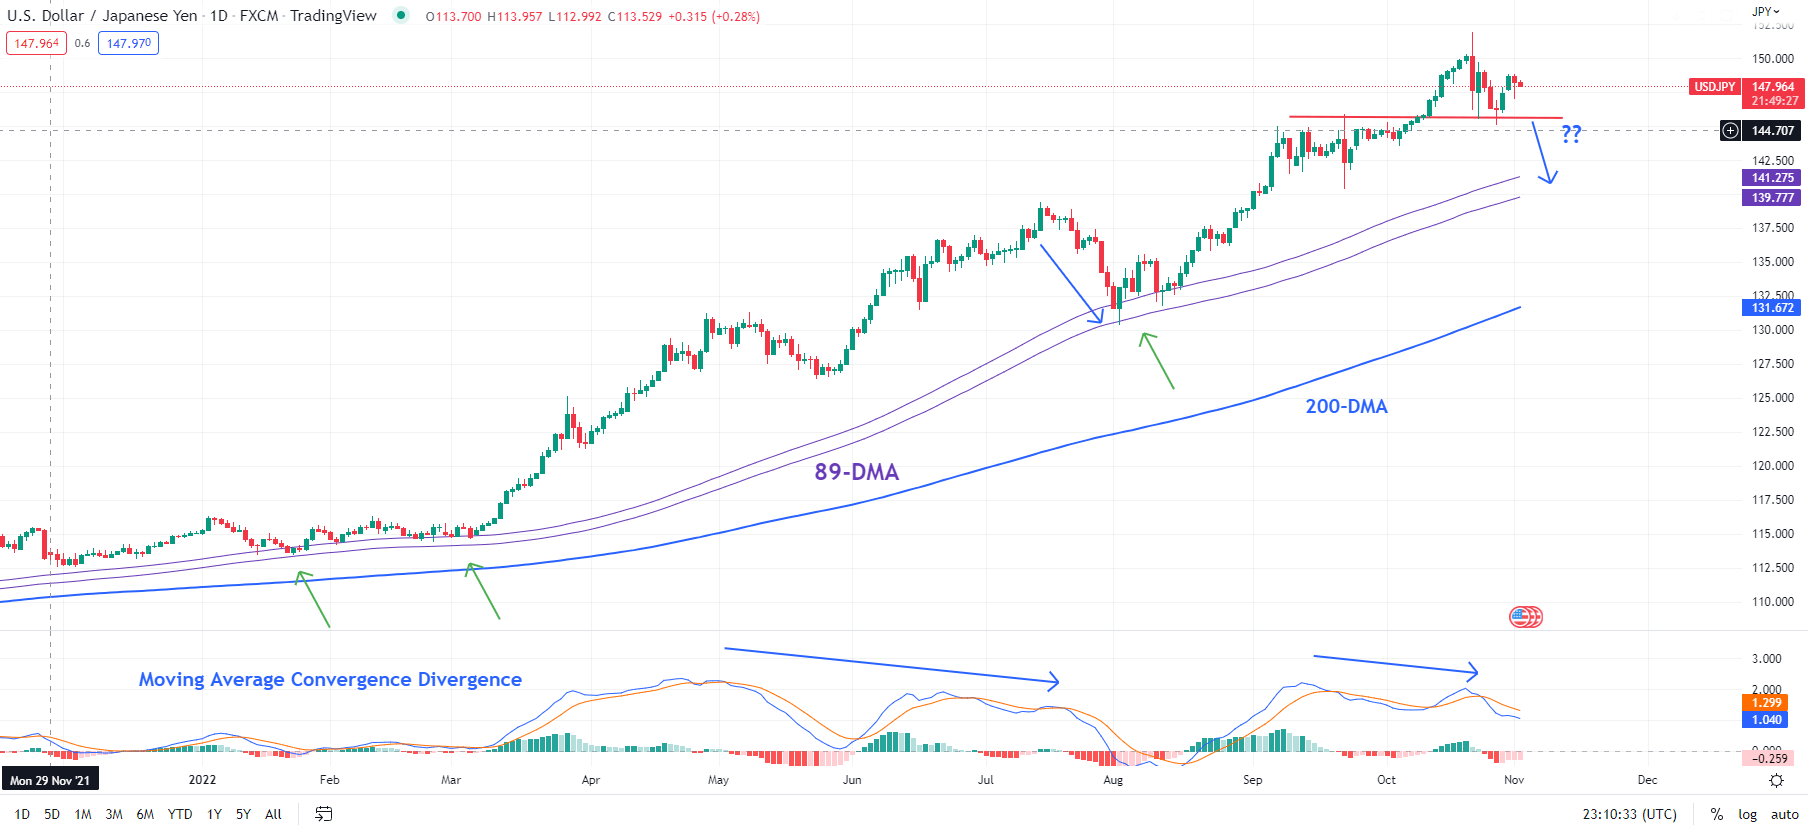
The focus is now on immediate support at the September highs of 145-146. A decisive break below this barrier would confirm that the short-term upward pressure had faded, raising the prospect of some consolidation or a minor retreat. Any further downward pressure could open the way toward the September intervention low of 140.35 near the 89-day moving average (DMA) and the July high. As the chart below shows, the last time USD/JPY was decisively below the average was in early 2021 before the surge began.

USD/JPY Daily Chart

image2.png

Zooming out, any potential setback could be viewed as a correction within an overall uptrend. The upward momentum on longer-term charts, including monthly and quarterly, remains strong, and any retreat could be short-lived. In this regard, a key signpost would be the 89-DMA – USD/JPY would need to break below this threshold for an extended drop toward the 200-day moving average (now at 131.50).