USD/SGD Daily Chart

US Dollar Appears Increasingly Vulnerable: USD/SGD, USD/THB, USD/IDR, USD/PHP

Singapore Dollar Technical Outlook – Slightly Bullish

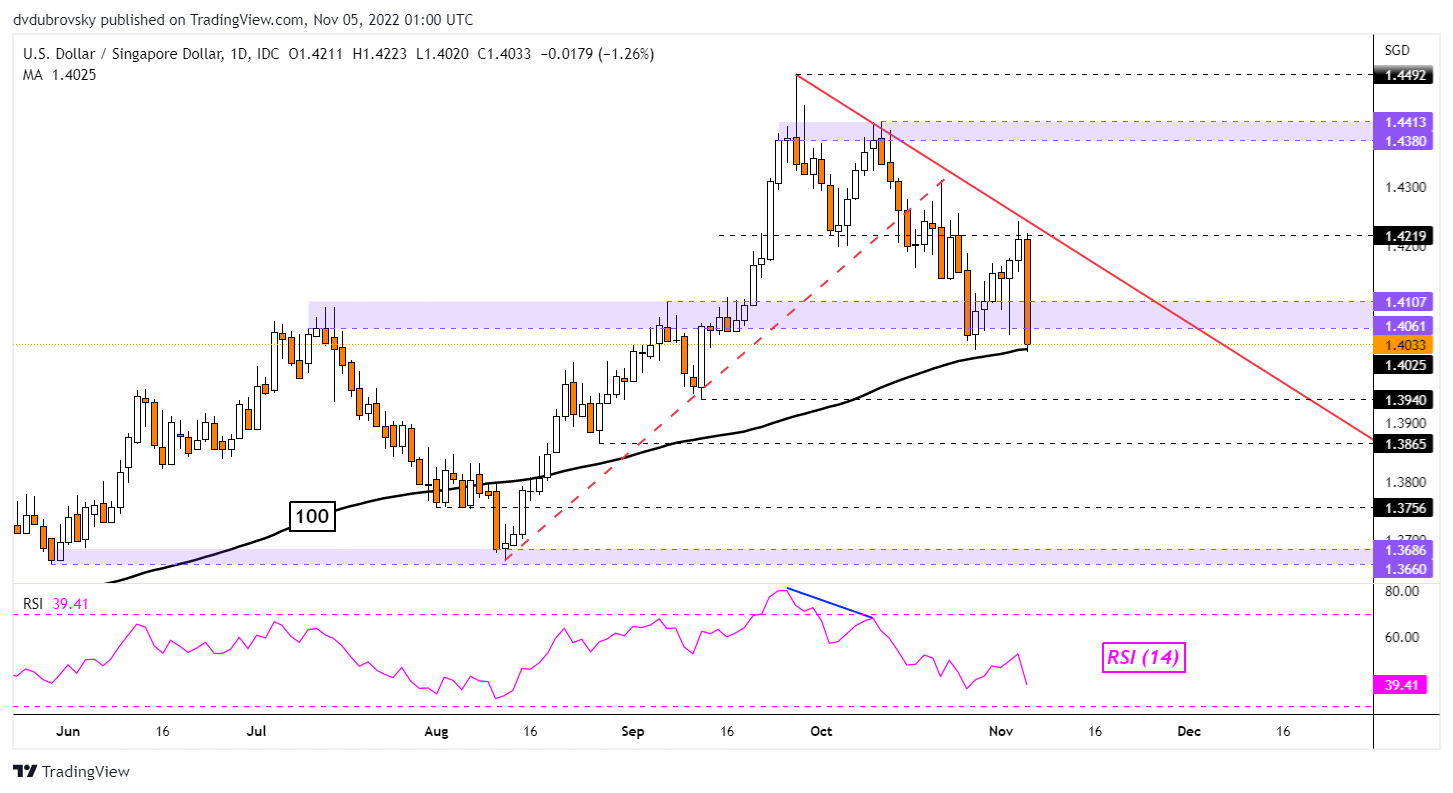
The Singapore Dollar gained 1.26% against the US Dollar last Friday, the best single-day performance since June 2016. That has left USD/SGD once again trying to break under the 1.4107 – 1.4061 former resistance zone. Prices are testing the 100-day Simple Moving Average (SMA). It remains in play as key support. Confirming a breakout opens the door to downtrend extension and an increasingly bullish perspective for the Singapore Dollar.

USD/SGD Daily Chart

USD/SGD Daily Chart

Thai Baht Technical Outlook – Slightly Bullish

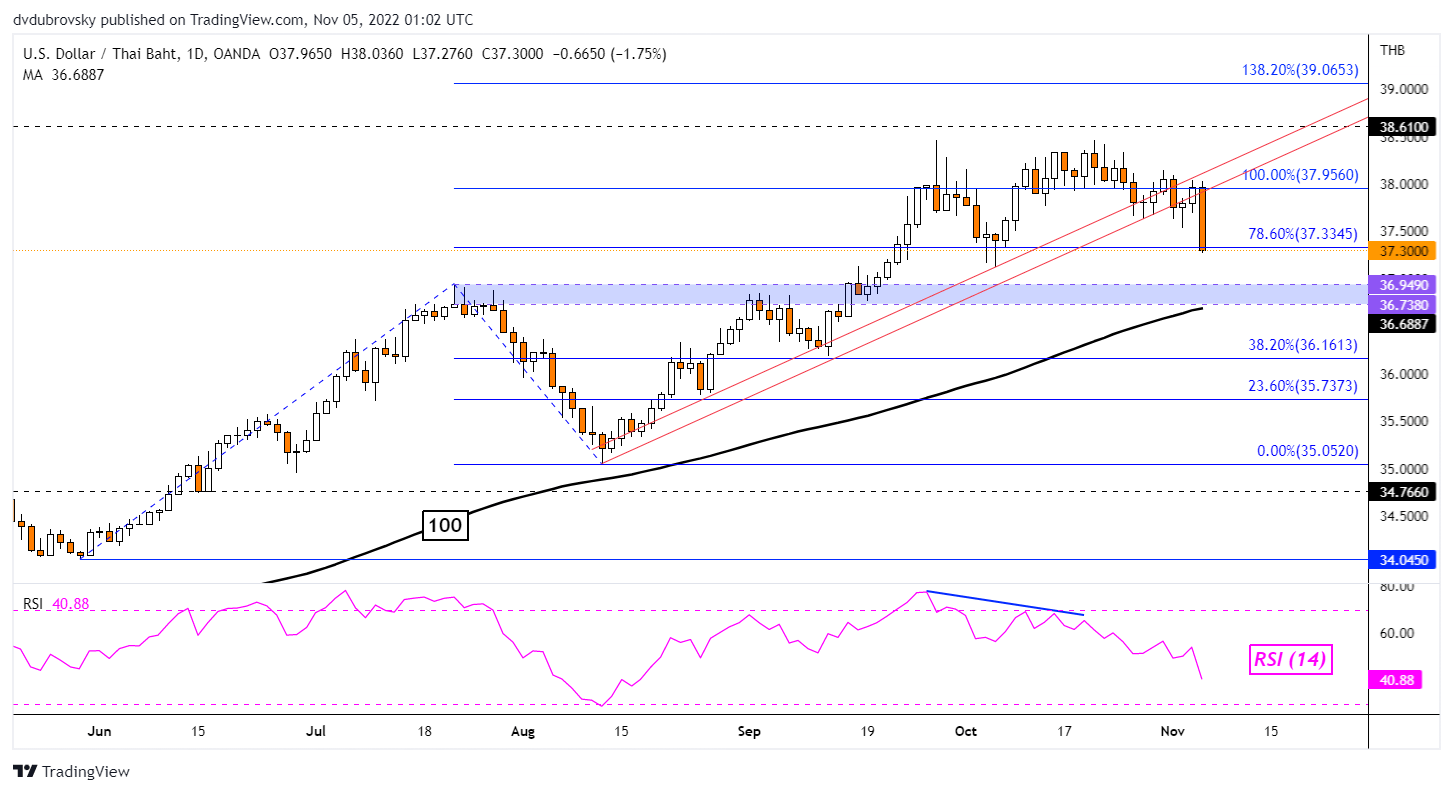
The Thai Baht gained an impressive 1.71% against the US Dollar last Friday. That was the best day for the currency since August 2007! Moreover, USD/THB has broken under the near-term rising trendline from August, offering an increasingly bullish outlook. Key support is the 36.949 – 36.738 former resistance zone, as well as the 100-day SMA. These could hold, pivoting prices higher. In the event of a turn higher, the August trendline could hold as new resistance.

USD/THB Daily Chart

Thai Baht Technical Outlook – Slightly Bullish

Indonesian Rupiah Technical Outlook – Bearish

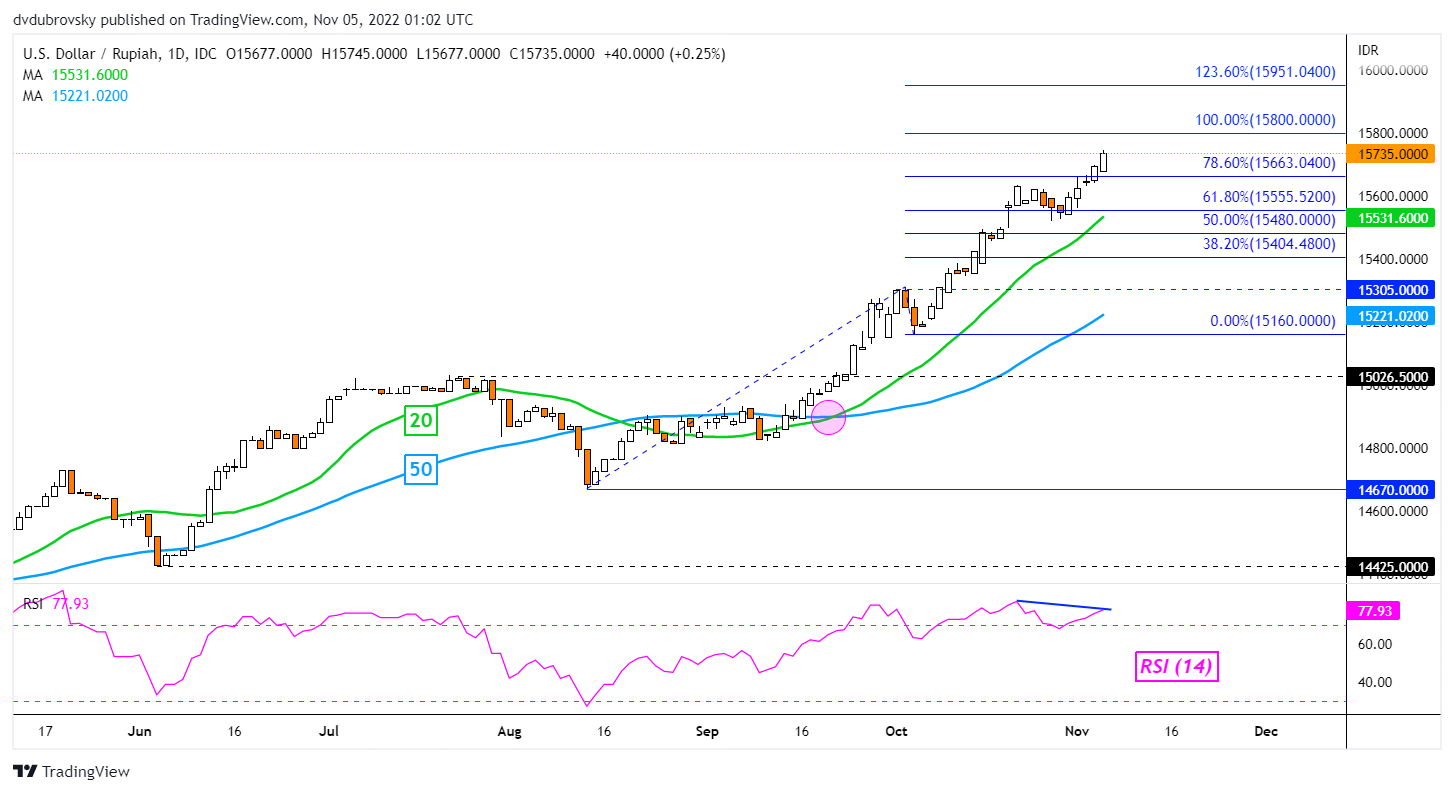
Meanwhile, the US Dollar continued to make progress against the Indonesian Rupiah. USD/IDR confirmed a breakout above the 78.6% Fibonacci extension at 15663, exposing the 100% level at 15800. Keep a close eye on RSI. Negative divergence is present. This could hint at a reversal. A turn lower would place the focus on the 20-day SMA, which may reinstate the broader upside bias. Otherwise, below that is the 50-day SMA.

USD/IDR Daily Chart

Indonesian Rupiah Technical Outlook – Bearish

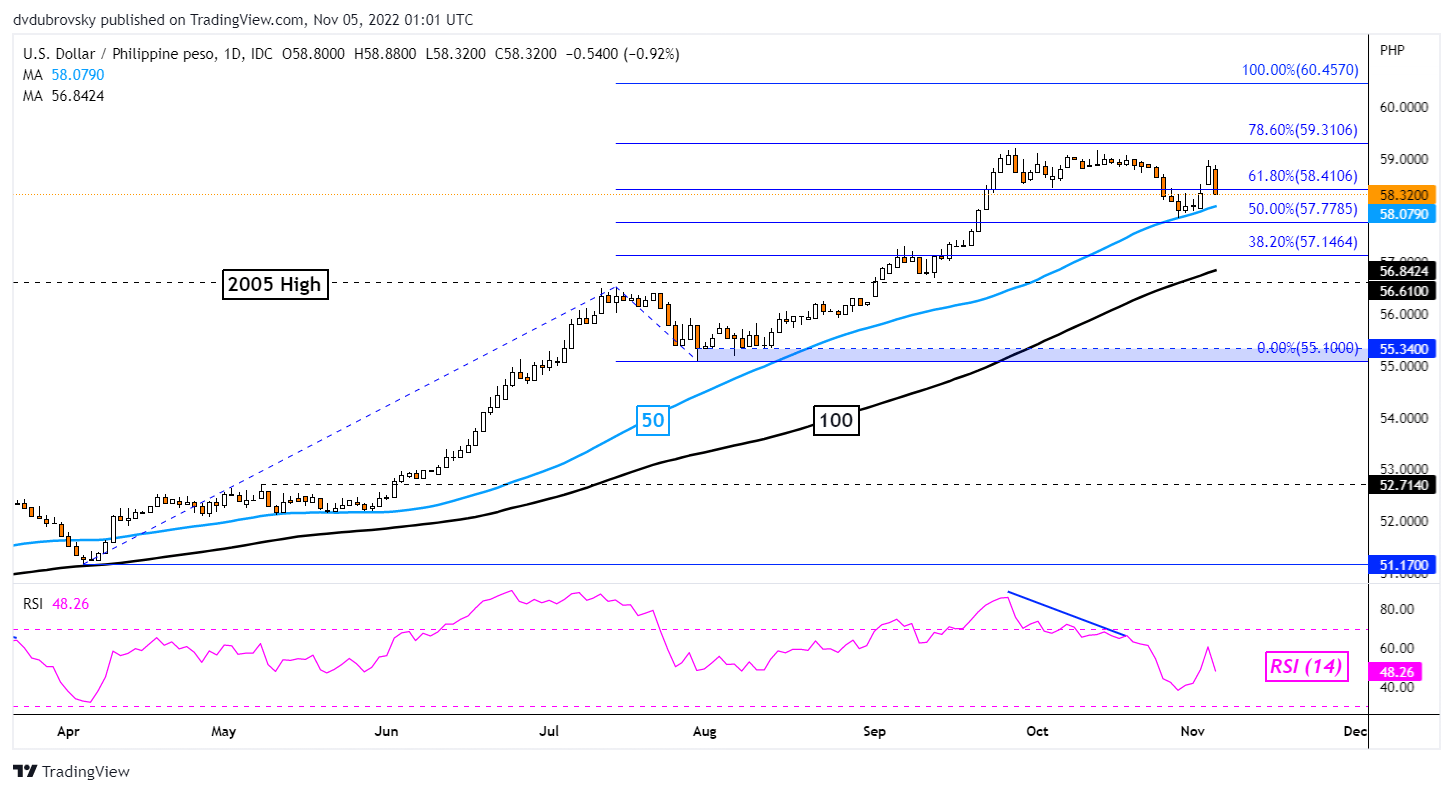
The Philippine Peso was mostly flat against the US Dollar this past week. Prices remain in a consolidative state since USD/PHP upside momentum faded in late September. Still, the pair is trading above both the 50- and 100-day SMAs. These are maintaining the broader upside focus despite recent consolidation. If these hold and pivot USD/PHP higher, the 78.6% Fibonacci extension level at 59.310 would come into focus before the 100% point at 60.457.

USD/PHP Daily Chart

Philippine Peso Technical Outlook – Neutral

image1.png

Crude Oil Eases as Markets Ponder a Possible Chinese Reopening. Will WTI Rally?

Crude oil slipped through Asian trade after a 5% gain on Friday. The run higher was based on rumours that China might ease their Covid-19-related restrictions, but this was dismissed by Chinese health authorities on Saturday.

Several assets have reflected this sway in hopes of a reopening of China but there has been somewhat of a divergence to start the week through Asian trade.

Commodity and currency markets are mostly reflecting the swing from a “risk-on” to a “risk-off” type of trading environment around the news on Monday.

Equity markets, on the other hand, appear to have held onto the hope of higher growth from the world’s second-largest economy. The positive perspective could reflect an article in the People’s Daily online edition that alludes to a managed reopening.

China’s trade balance was released today, and the surplus came in at US$ 85 billion, lower than the US$ 96 billion anticipated, but that didn’t sour the mood.

APAC equities were led higher by Hong Kong’s Hang Seng Index (HSI), which has added over 9% in the last two trading days. Wall Street had a green day on Friday, but futures are pointing toward a soft start to their cash session ahead.

The growth- and commodity-linked Australian and New Zealand Dollars have been the underperformers today while the US Dollar has been the beneficiary in currency land.

The WTI futures contract is near US$ 91.50 bbl while the Brent contract is a touch below US$ 98 bbl. Gold has also eased in Asia today, trading near US$ 1,673 an ounce.

Elsewhere, Apple cut the output forecasts for their new iPhone on the back of lockdowns and lower-than-anticipated demand.

Former Treasury Secretary Larry Summers made comments over the weekend that he thought the terminal rate for the Federal Reserve could be above 6%.

The terminal rate is the Fed Funds level at which the current hiking cycle will peak. The markets now price this in at 5%, to be reached mid-2023. It is understandably eye-catching then that 6% is 100 basis points (bps) higher and some 200 bps above the current policy setting.

Looking ahead, European Central Bank President Christine Lagarde will be speaking, and markets will be watching for any more commentary from her regarding quantitative tightening.

There will also be a sprinkling of Fed speakers crossing the wires.

The full economic calendar can be viewed here.

WTI CRUDE OIL TECHNICAL ANALYSIS

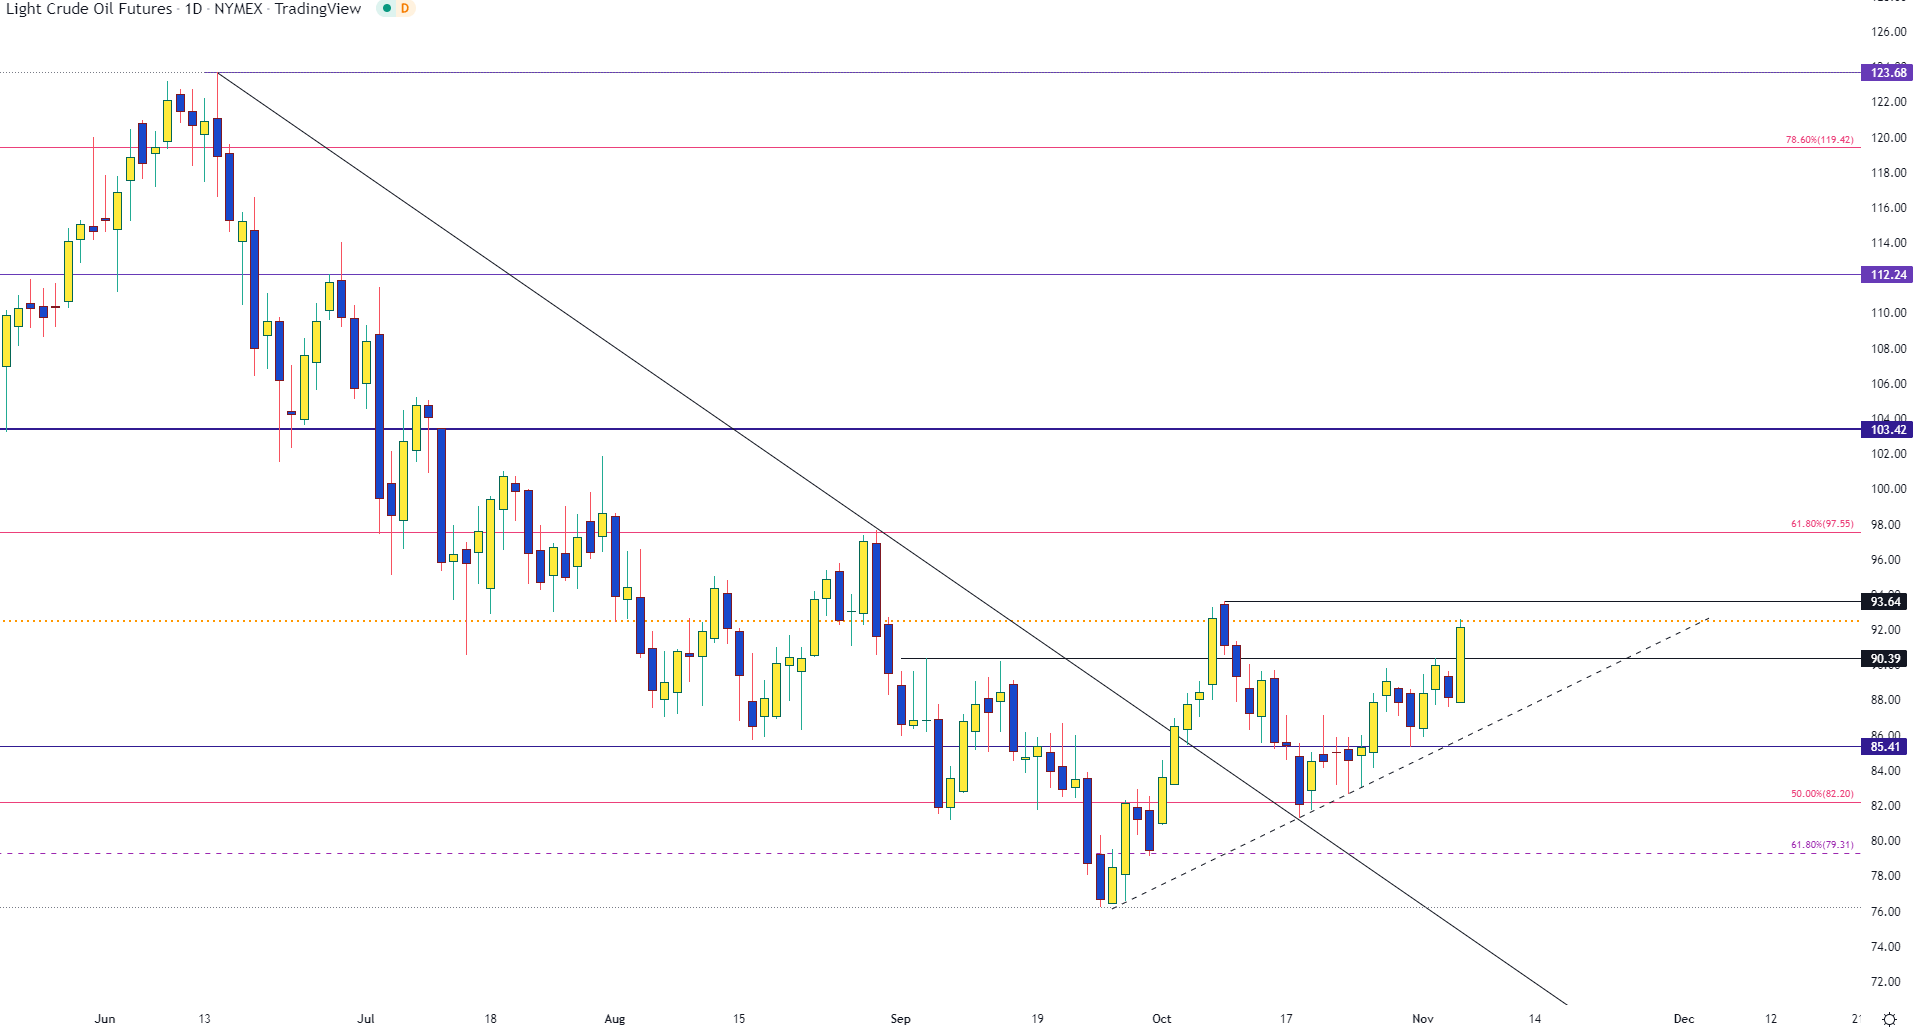
The WTI price has developed a potential Symmetrical Triangle that might indicate a possible bullish breakout unfolding.

Resistance could be at the previous peaks of 93.64, 97.66, 101.88 and 105.24.

On the downside, support may lie at the recent low of 81.30, which is just above a breakpoint at 81.20. The September low of 76.25 could also provide support.

image1.png


Graphical user interface, chart, histogram  Description automatically generated

Crude Oil Prices Surge as Bullish Breakout Drives WTI Back Above $90 Crude Oil Prices Surge as Bullish Breakout Drives WTI Back Above $90

China’s Potential Reopening Refuel Bullish Momentum as Oil Prices Rise

Crude oil prices are grinding higher after speculation of easing China lockdowns fueled a rally in commodities. As the news of a potential reopening of the world’s largest economy raised demand expectations, both WTI and Brent soared, driving oil futures higher.

With the fundamental backdrop providing a catalyst for bullish momentum, US Crude (WTI) futures rose on Friday, settling above $92.00.

Recommended by Tammy Da Costa
Futures for Beginners
Get My Guide

From the daily chart below, the recent full-bodied candle indicates an aggressive move from buyers that allowed them to push through $90.00. With trendline support from the September low firming at around $88.00, an increase in bullish momentum could see prices rising back towards the $95.00 psychological handle.

Crude Oil (CL1!) Daily Chart

Graphical user interface, chart, histogram  Description automatically generated

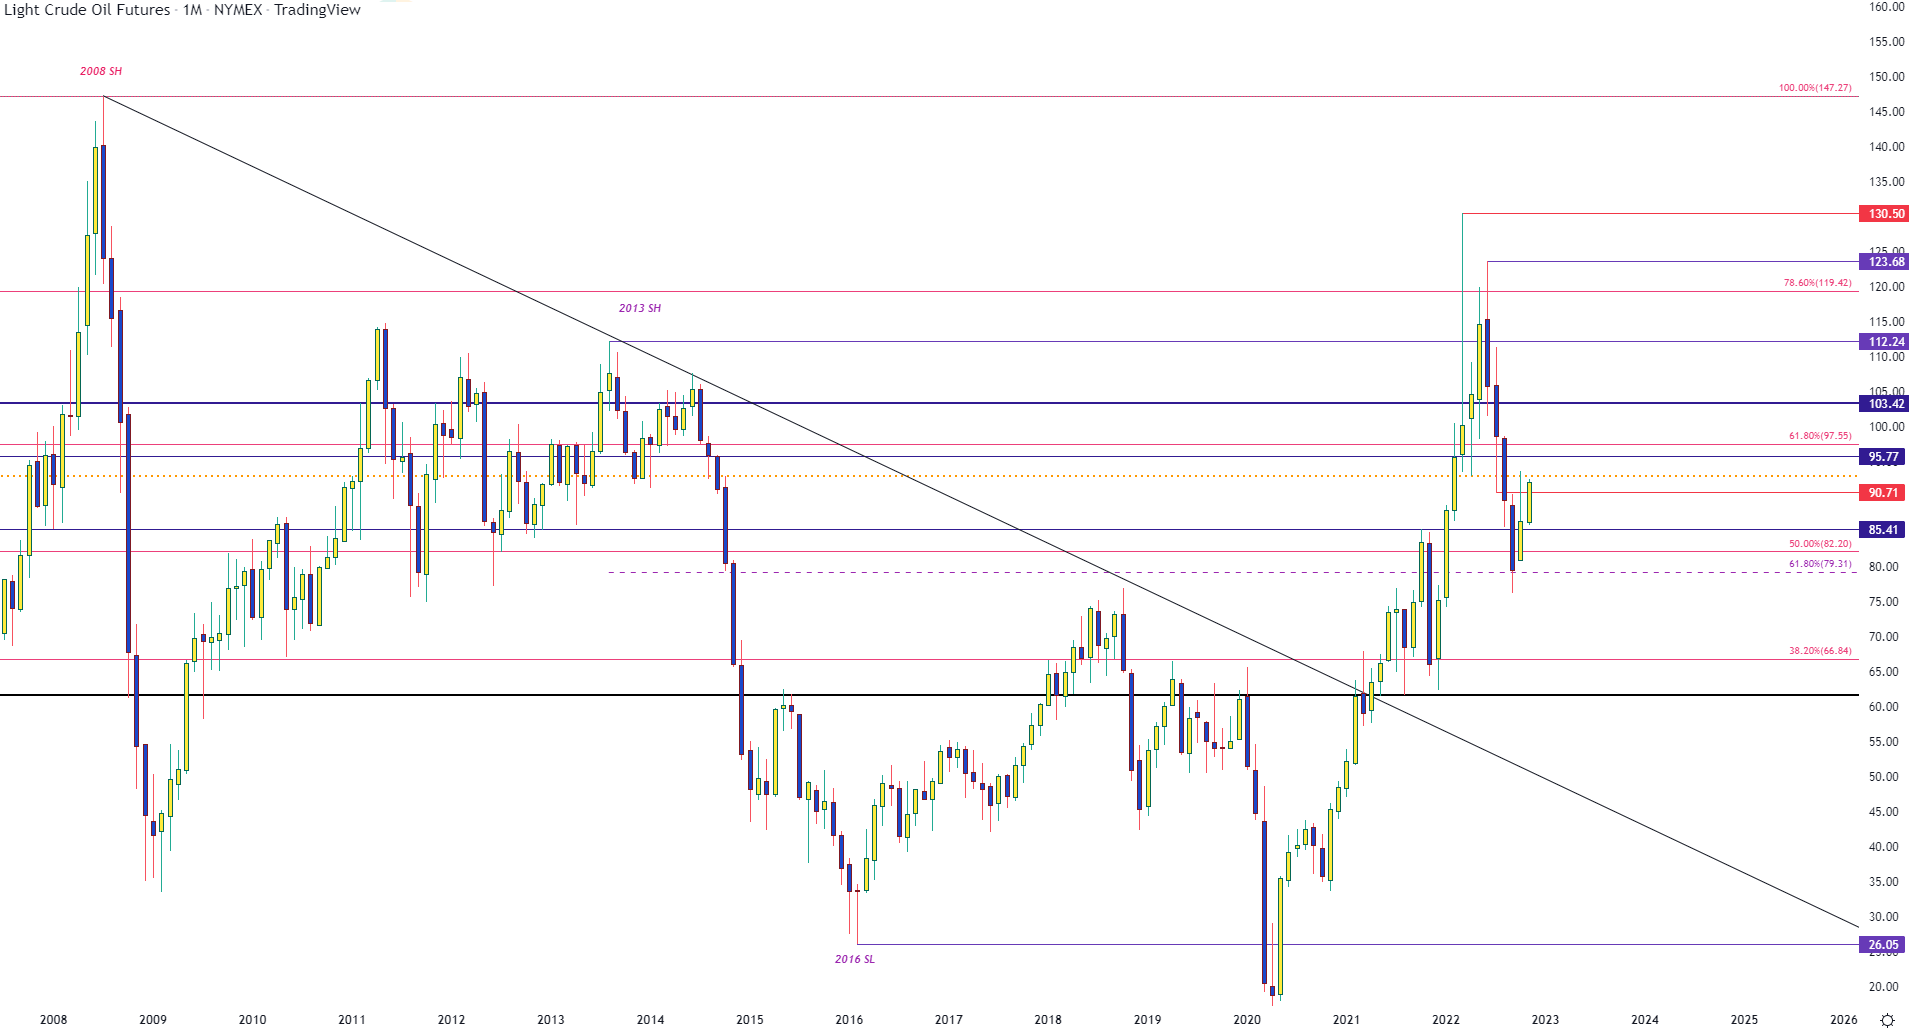
After falling from the June high of 123.68, a four-month sell-off drove WTI to a September low of $76.5 before rising back above $80.00. As a strong rebound drove price action higher, the same technical levels that provided support for WTI in 2013 & 2014 are now assisting in limiting the upside move at $92.50.

With the October high of $93.64 and the $95.00 providing additional resistance, a move higher and a retest of $97.55 (the 61.8% Fibonacci of the 2001 – 2008 move) could drive WTI back to the big $100 mark.

Crude Oil (CL1!) Monthly Chart

Chart, histogram  Description automatically generated

image1.png

US Dollar’s Suffers Biggest Drop 7 Years, Is That the Start of Something?

The Federal Reserve managed to extend the market’s anxiety rather than offer the relief many were expecting after various peers throttled back on their inflation fight. While Chairman Powell and other Fed members speaking soon after the fourth 75 basis point (bp) rate hike was announced were making the effort to throttle back expectations for further ‘front loading’ of monetary policy – big rate hike in other words – the warning that a longer regime of tightening would take its place was quick to follow. Whether or not that is an improvement in course or not for risk trends remains to be seen, but the seasonality may be a market force that shores up the bias for bullish drift. Notably, this past week, the S&P 500 (my preferred, imperfect measure of convenient ‘risk’ update) ended with a Friday rally following four days’ slide. That said, the overall week rendered a slide that reversed from the midpoint of the August to October bear leg. I don’t see enough here to suggest conviction is solidifying among the speculative rank.

Chart of S&P 500 with 20 and 100-Day SMAs, Volume and 1-Day Rate of Change (Daily)
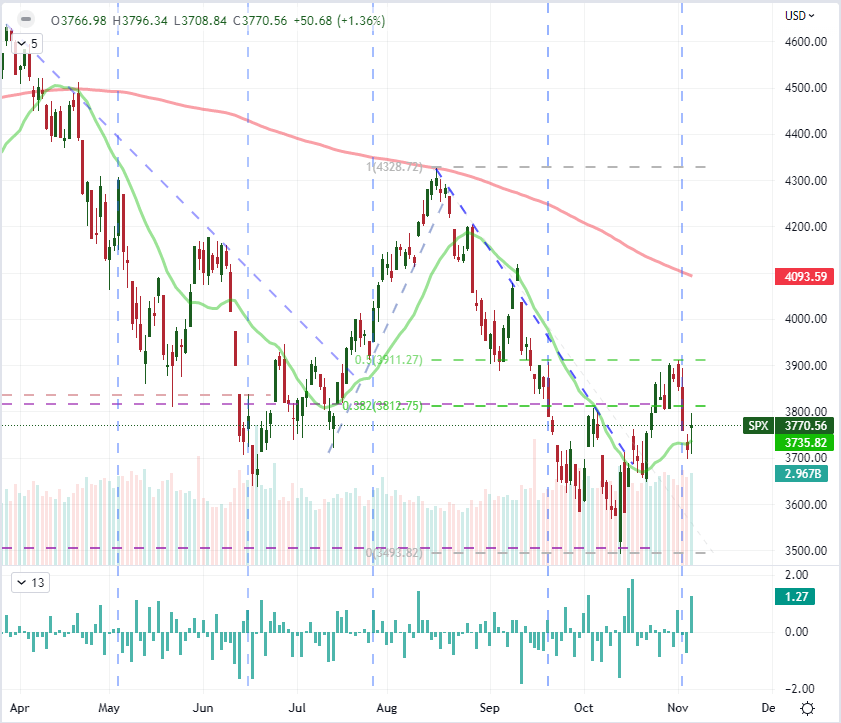
image1.png

While the benchmark S&P 500 is essentially chopping in a range established over the past weeks between the broader bear trend of 2022 and the ever-persistent pressure of speculative hope, the internal dynamics of risk appetite continue to erode. I believe it is important to look at sentiment through both breadth and depth. Looking for sentiment through a wider picture; global indices seemed to firm up relative to the S&P 500 through Friday while emerging market, junk bonds and even carry trade firmed. That is a very tentative jog higher and it comes notably with very limited fundamental backdrop for the larger market participants to draw from, but the anticipation will be building with the additional seasonal expectations around the 45th week of the year and November overall. Meanwhile, I continue to monitor the falling out of favor of the benchmarks treated as the torchbearers for ‘risk trends’. Beyond the S&P 500 (and its many derivatives), the demand for top market cap stocks (which happen to be the tech giants in the FAANG grouping) has stood as a proxy for risk on and risk off. That is a problem considering the Nasdaq 100 / Dow ratio continued its collapse this past week.

Chart of the Nasdaq 100 – Dow Ratio with 100-Day SMA and 1-Weeky Rate of Change (Weekly)

Another point of concern of mine is the seeming utter lack of effort among market participants to hedge against systemic threats like recession risks, financial crises or simply a strong reaction to the next major event (eg the US CPI on Thursday). In fact, with this past week’s underlying market volatility around the FOMC rate decision, the VIX volatility index continued its slide to account for a more than 20 percent retreat in the span of the last 20 trading days, equivalent to one trading month. We have yet to see anything that could be reasonably be construed as capitulation – something I would consider akin to a surge for or above the 50 threshold. Thus far, it has all been remarkably orderly despite the lows in the underlying. This situation alone I could perhaps suppress any serious concern around, if not for the extraordinary readings from the volatility of volatility index (VVIX) pushing a three-and-a-half year low while the SKEW tail risk measure stands at record lows.

Chart of the VIX, VVIX and SKEW Volatility Indices (Weekly)
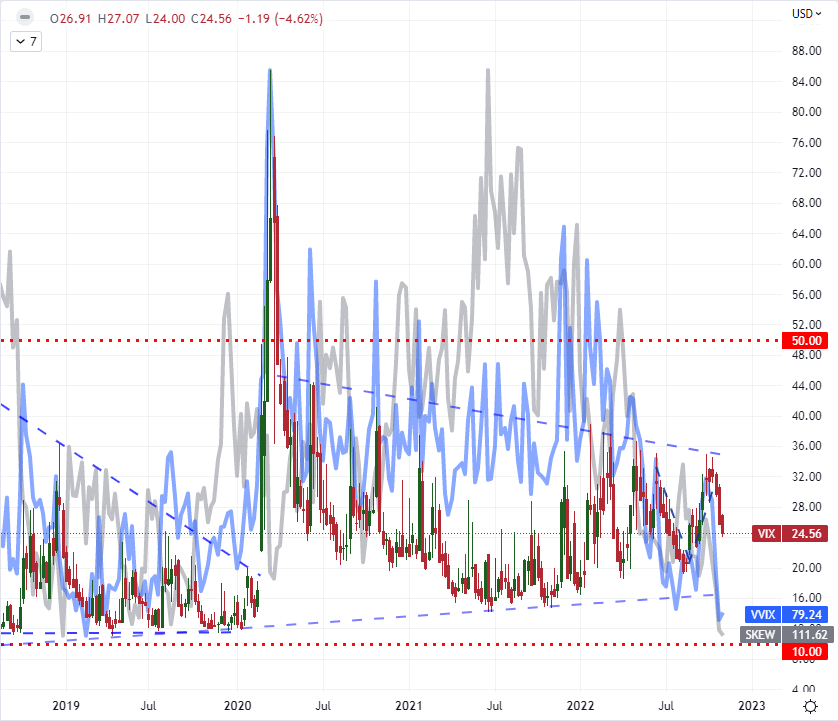
image3.png

The Extraordinary Slip from the US Dollar

This past Friday’s volatility was extraordinary for a number of different reasons and markets. One such surprise came from the US Dollar. On the final day of the trading week, the DXY Dollar Index registered a -1.9 percent tumble – the worst single-day loss since December 3rd, 2015 and before that March 18th, 2009. Seven years ago, the spark for the index was the smaller than expected easing update from the ECB, leveraging the Dollar’s largest counterpart higher temporarily. With the March 2009 slump, the catalyst was an explicit 75 basis point rate cut from the Fed. I wouldn’t say anything of that same magnitude was on the radar through the end of the past week. NFPs was better than expected and thereby supports the fight against inflation, but Fed speak did remind that the policy path was moving away from large, front-loaded hikes and towards a longer path to a higher terminal rate. When it comes to the US Dollar, I consider three major factors to be a boon to the currency: its relative safe haven status, a top rate forecast through the medium term and a relatively steadfast economic forecast compared to the likes of the Eurozone or UK. That said, the run will eventually come to an end given enough time and circumstance.
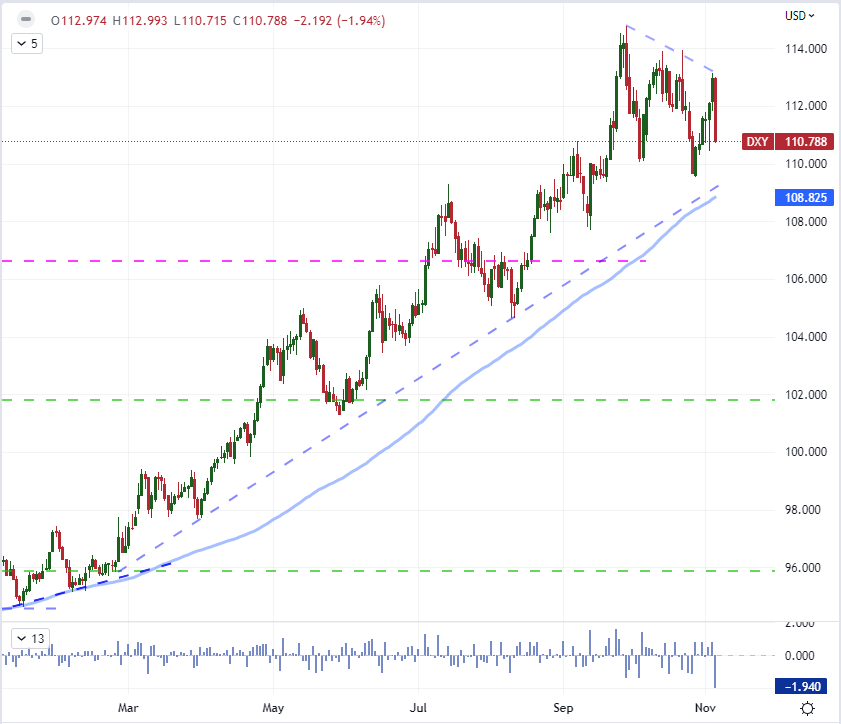
image4.png

For now, the DXY has been running 362 trading days above its 100-day SMA to support the bearish designation, the longest such run in its half century record. There is still some ways to go before the spot market makes a serious run on its higher trending moving average support. That said, any more dramatic struggles similar to what we have witnessed this past week could push us beyond the threshold fairly quickly. That said, further technical escalation behind a reversal is best served with a tangible fundamental motivation. Should one of the aforementioned levers for the currency break, then I could entertain the probability of such a reversal. Otherwise such expectations will be fighting against well-established themes.

Chart of DXY Dollar Index with 100-Day SMA and Consecutive Days Above and Below 100SMA
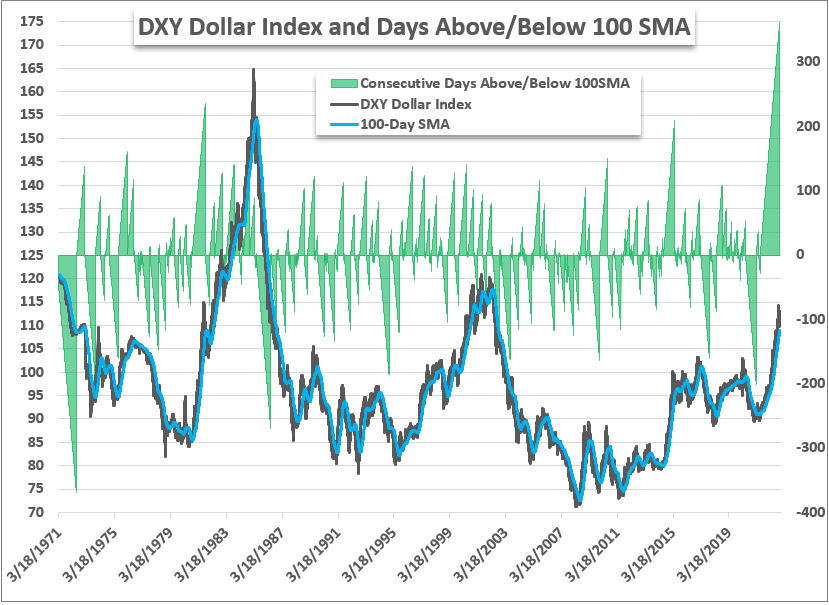
image5.png

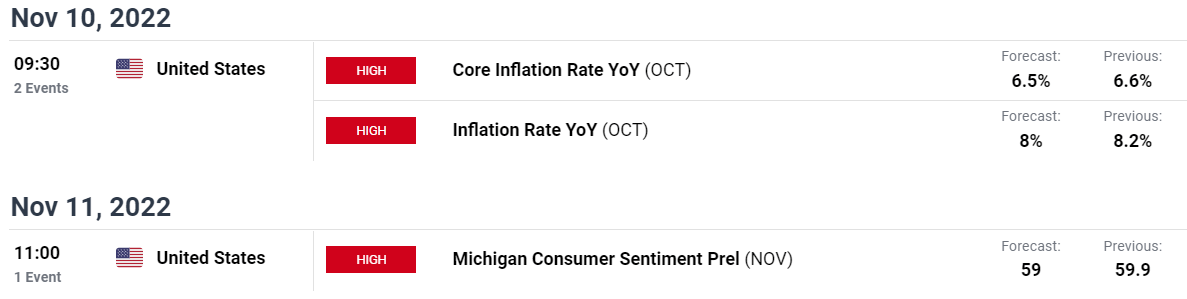
For event risk that has a chance of upending the willful markets, I consider the US CPI on Thursday and University of Michigan consumer sentiment survey on Friday top listings for the US markets and currency. There is a gauge of Fed commitment and a barometer of recession proximity in this combo that should be monitored. Yet, as important as those two measures may be, the evenly distributed Fed rhetoric through the week may prove more productive for market activity. Outside of the Dollar and US, monetary policy interest has a few more sparks in inflation data from the UK, China and Australia. I will be more interested in the foreign exchange reserves report from Japan and China on Monday given the intervention efforts the countries’ respective monetary policy authorities have raised recently. Meanwhile, for global economic health checks, the UofM takes a back seat to the pointedness of the Japanese Eco Watchers survey, UK 3Q GDP and EU Commissions growth forecast. The question is whether there is further surprise in these figures and whether the market will extrapolate as broadly from their individual performance relative to the globe.

Critical Macro Event Risk on Global Economic Calendar for Next Week
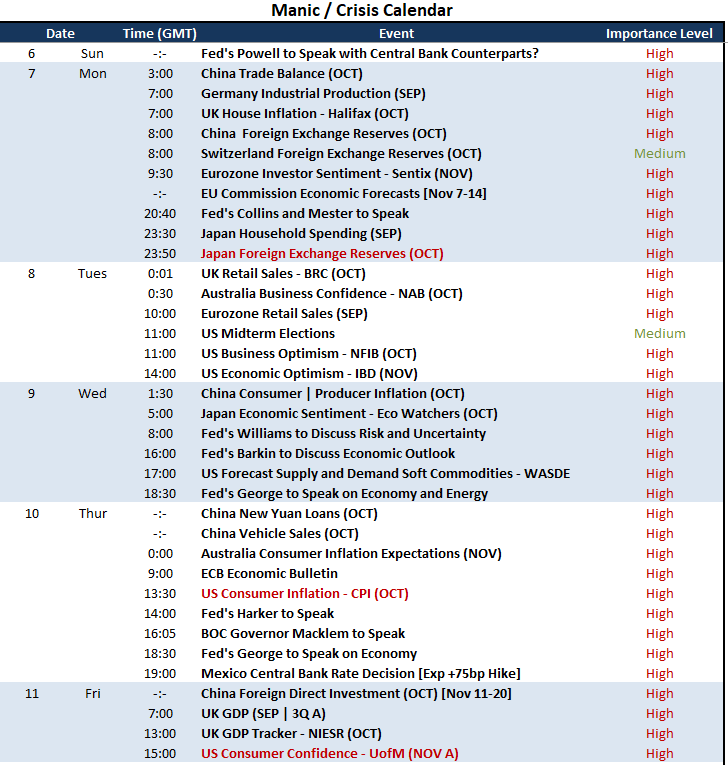
image6.png

image1.png

Gold and Silver Technical Outlook: Modest Gains in the Cards?

GOLD SHORT-TERM TECHNICAL OUTLOOK – NEUTRAL

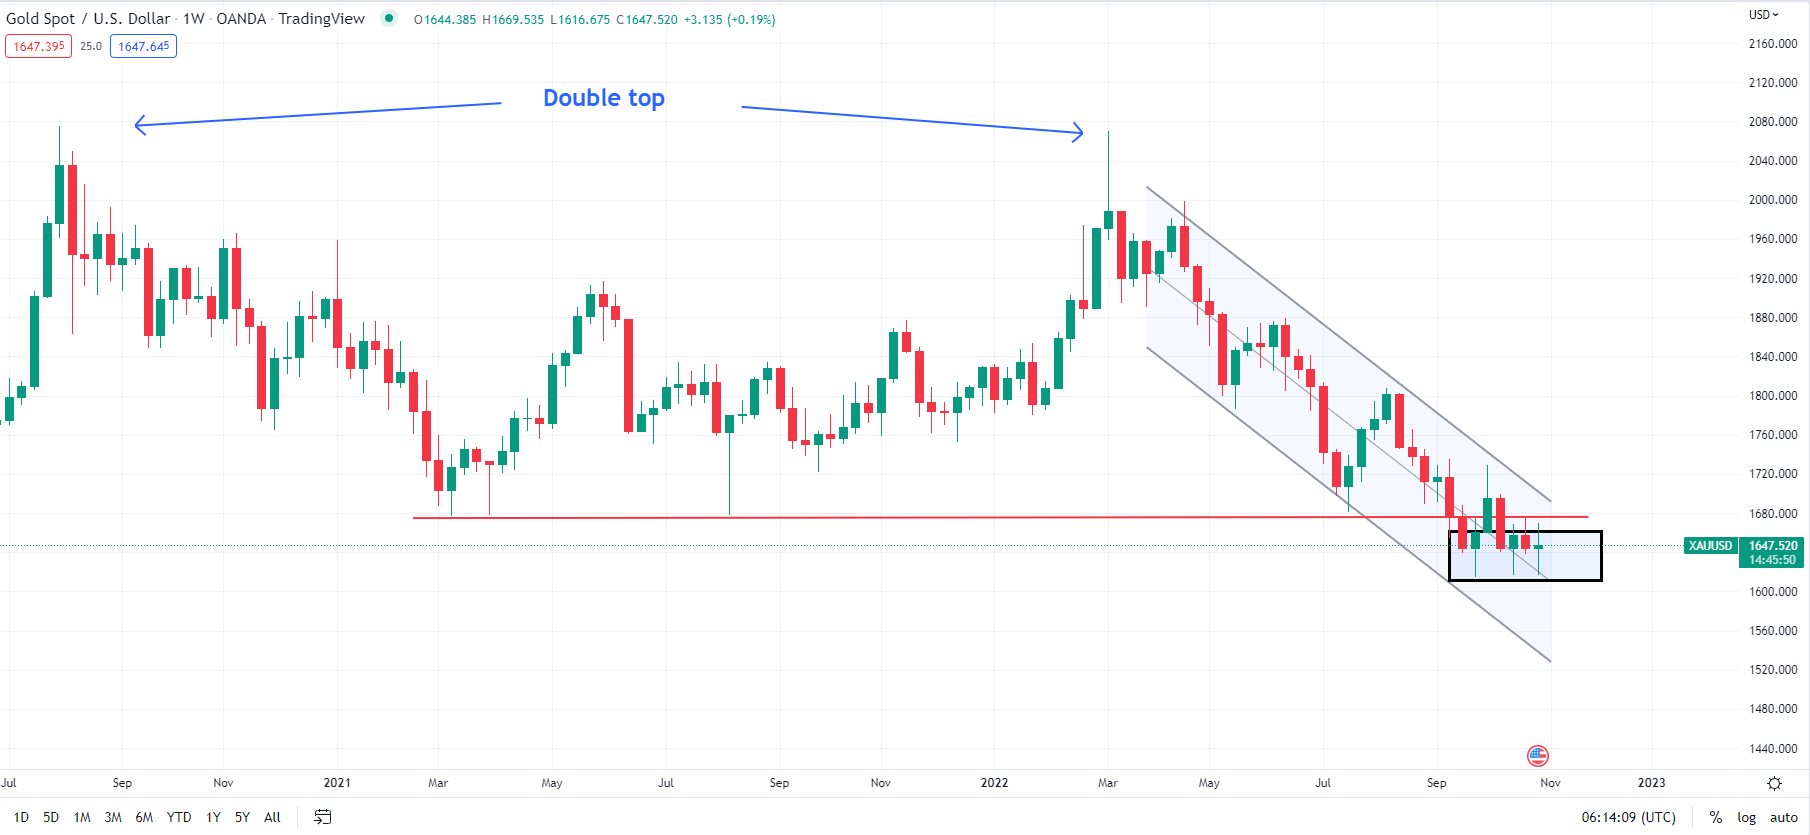
There is a growing chance that gold may be forming a short-term floor and could rise toward the upper end of the recently established range.

In recent weeks, XAU/USD has struggled to break below the horizontal trendline from 2021 at about 1675-1680, roughly coinciding with the 200-week moving average. If the yellow metal closes this week around the current level, it would be the third back-to-back long-legged candle on the weekly charts, implying support at lower levels not too far from 1675-1680 (see chart).

XAU/USD Weekly Chart

image1.png

Chart Created Using TradingView

However, XAU/USD needs to break above immediate resistance at the end-October high of 1675 at minimum for immediate downward pressure to fade. That’s because the stalling of the down trend recently could also be interpreted as a digestive pause before gold embarks on its next leg lower.

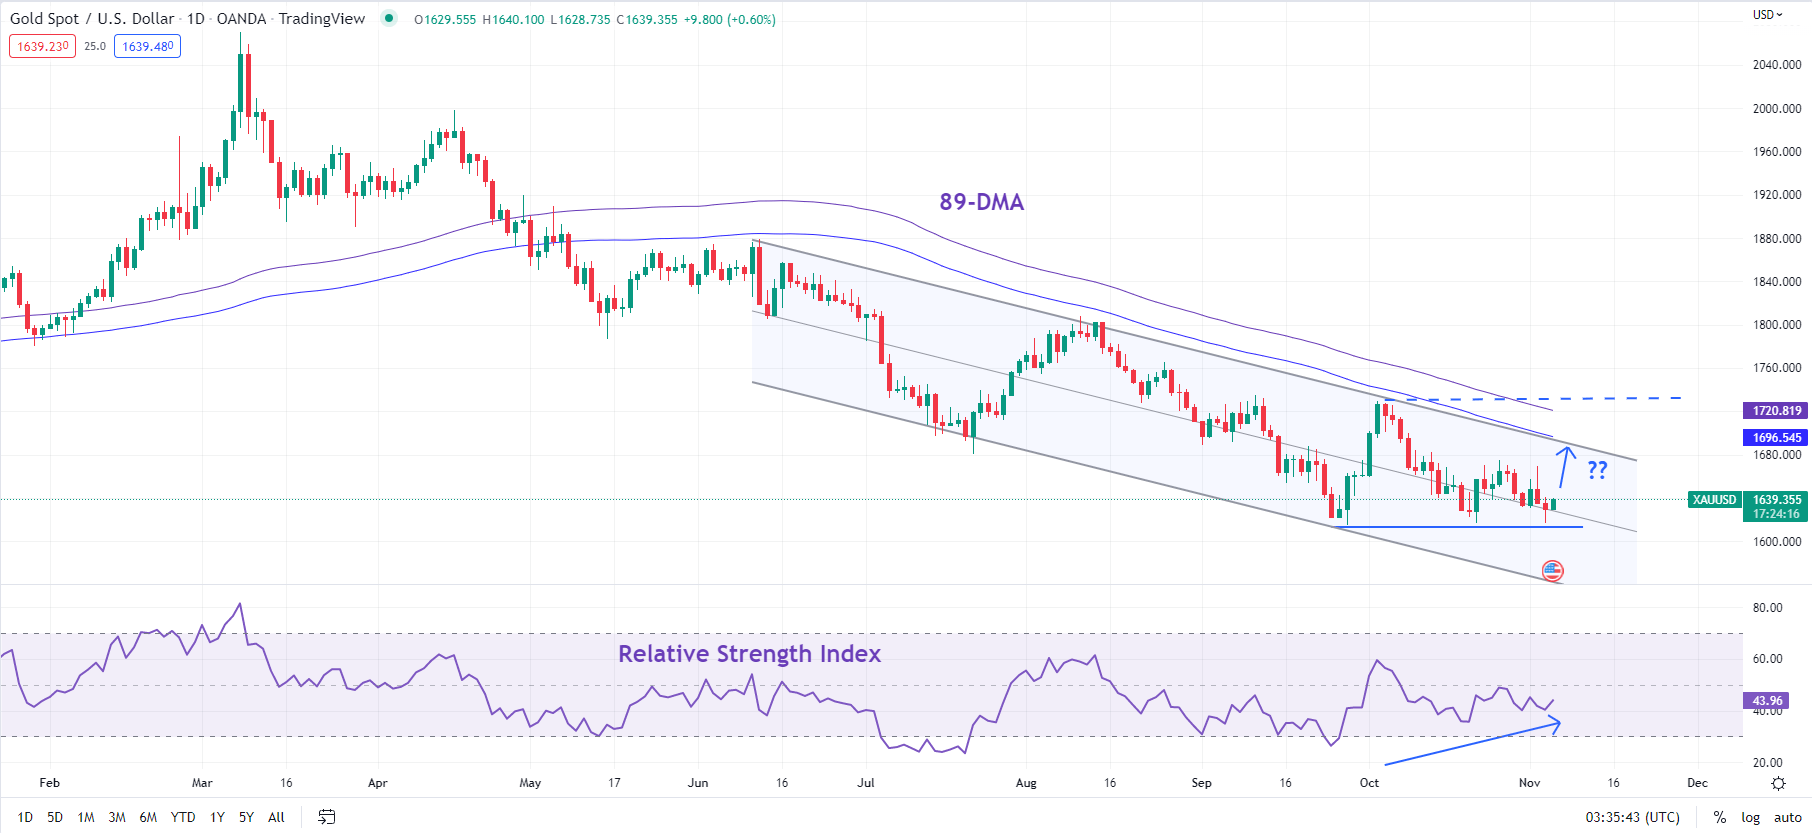
Any break above 1675 could push the metal towards a stiff barrier on the upper edge of a falling channel from June, roughly coinciding with the 89-day moving average. This combined resistance has capped rallies in recent months (see chart). There is a stronger hurdle at the early-October high of 1729, which could be tough to crack as the trend on longer-term charts remains bearish.

XAU/USD Daily Chart

image2.png

Chart Created Using TradingView

How to Trade Gold

How to Trade Gold
Recommended by Manish Jaradi
How to Trade Gold
Get My Guide

SILVER SHORT-TERM TECHNICAL OUTLOOK – NEUTRAL

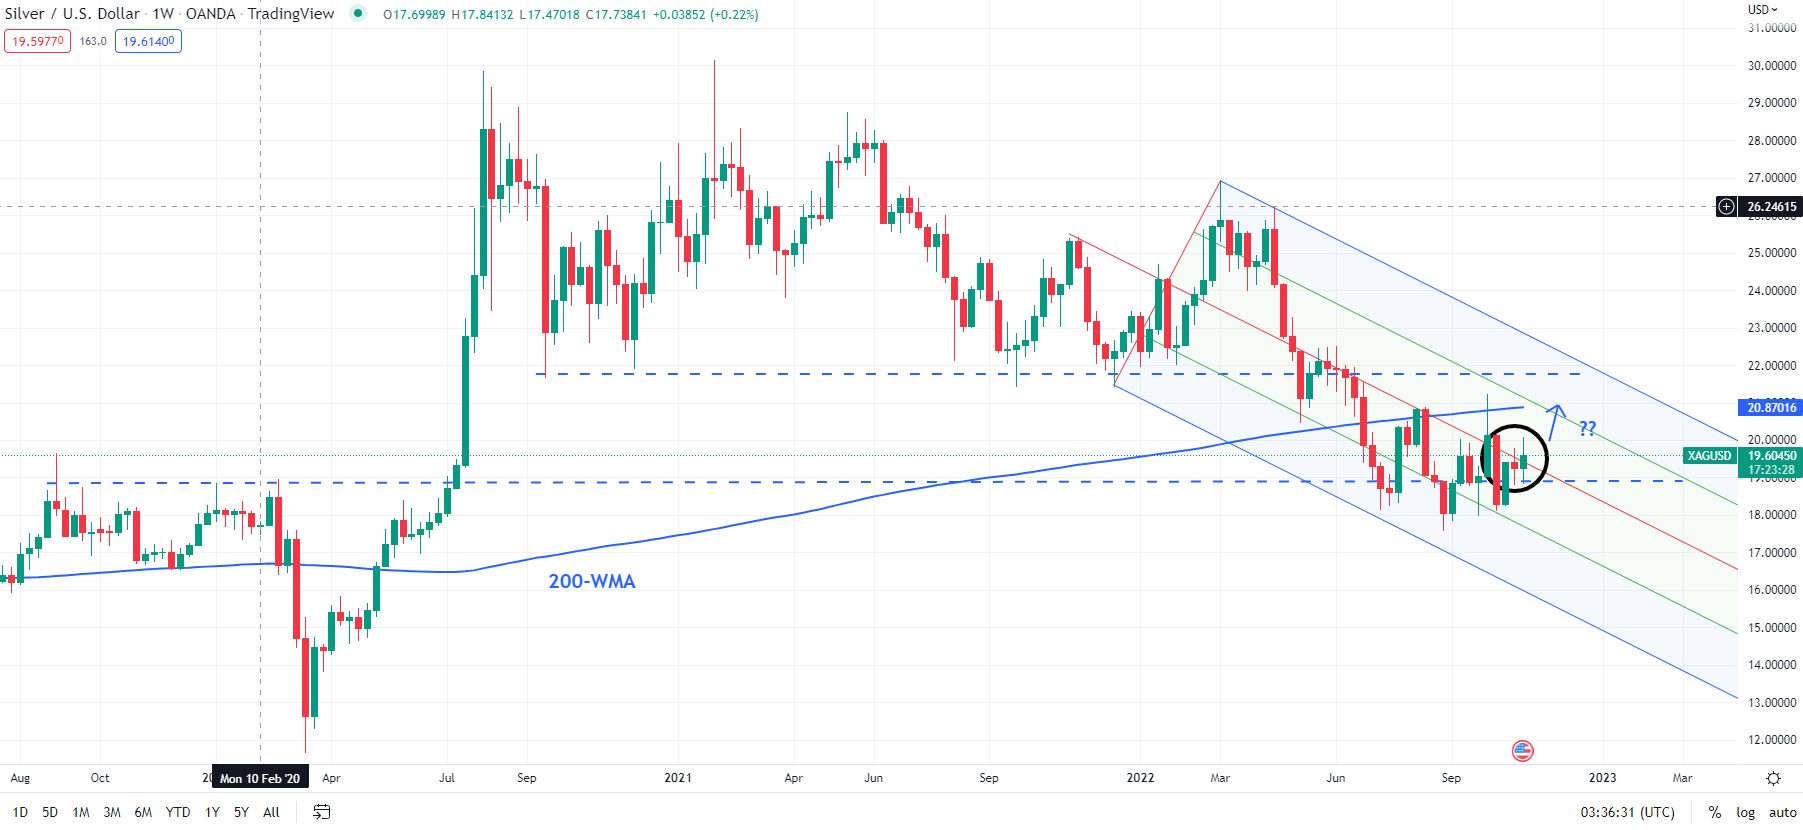
The setup on the weekly charts for silver appears to be like gold, albeit of longer duration than the yellow metal. Since July, XAG/USD has been hovering in a 17.50-21.25 range, holding above horizontal trendline support from 2019-2020 highs, and with the 200-week moving average capping the upside.

XAG/USD Weekly Chart


image3.png

Chart Created Using TradingView

Like gold, XAG/USD could be gearing up for a modest rise toward the top edge of the range in the near term. In recent days, it has repeatedly tested and failed to break above the immediate barrier at last week’s high of 19.80. A decisive breach above that resistance could push XAG/USD toward 21.25, close to the 200-day moving average (now at about 21.50).

Beyond the short term however, the balance of risks is tilted towards the downside. There is tough resistance at 21.25-21.50 (including the 200-day moving average), and silver would need to break above this resistance for the medium-term downward pressure to fade.

image1.png

Bitcoin and Ethereum Forecast for the Week Ahead

Bitcoin and Ethereum Outlook: Bullish

Bitcoin and Ethereum both posted monster sessions on Friday as risk rallied on the back of the US nonfarm payrolls (NFP) report. The labor report broadly appears to be a “mixed bag,” as both bulls and bears can point to aspects of the print to support their arguments for higher/lower prices. Despite that, market participants were forcibly pushing risk higher during Friday’s session. US Treasury yields came in while the US Dollar posted a dismal session. Part of this was fueled by NFPs, while continued developments out of China also fueled a rebound in risk.

So where does crypto play into all of this? At the moment, its role as an “uncorrelated risk asset” roughly means that market participants are stuck following the broader macro environment. The data is ultimately driving sentiment and positioning, as it weighs heavily on market pricing of the Fed’s terminal rate. Next week sees October CPI data cross the wires on Thursday, which could bring about significant shifts in rates pricing for the December FOMC meeting.

Upcoming US Economic Calendar

image1.png

Courtesy of the DailyFX Economic Calendar

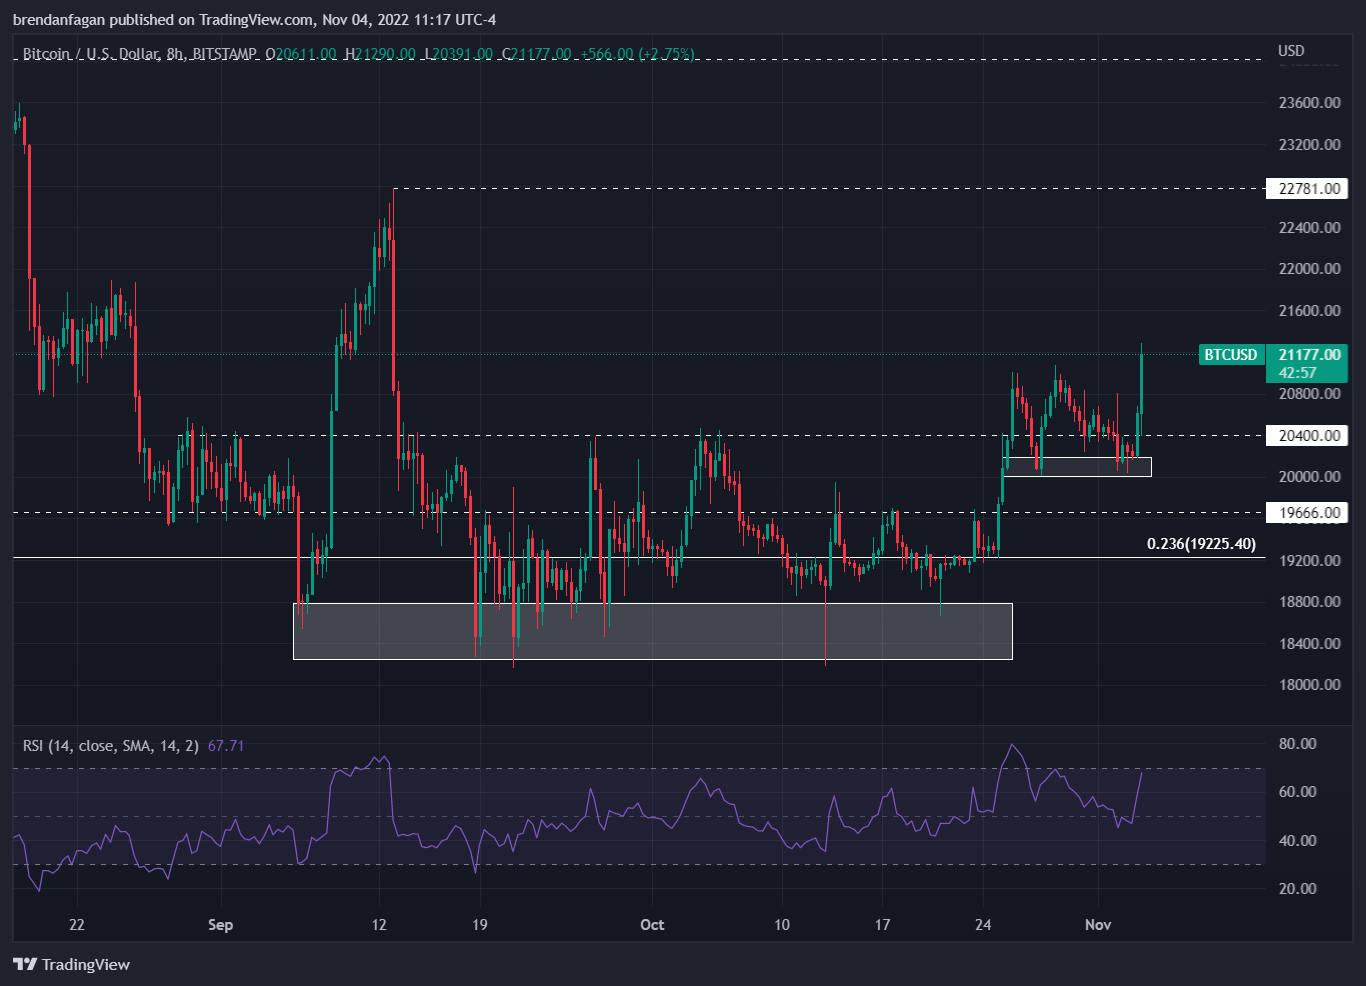
Bitcoin continues to push higher despite volatile swings lately, following a long base that was built around the $18400 – $19000 zone. I wrote about this in previous pieces on Bitcoin, where I noted that the cryptocurrency was holding up well as other risk assets struggled immensely. That relative outperformance during a period of heightened stress in financial markets certainly caught my eye, and made me wonder why Bitcoin had diverged from traditional correlations.

After largely holding the support zone between $18400 and $18800 for most of September and all of October, Bitcoin finally made the break higher into month-end. The October 25th session finally saw a daily close above resistance at $19666, which was the 2017 swing-high. BTCUSD hasn’t looked back since making this bullish break, as price has punched firmly though the psychological barriers at $20000 and $21000 respectively. If risk continues to rally on a shift in fundamental news, BTCUSD may look to target the September high at $22781. Softness after such a strong rally on Friday may bring the support zone above $20000 back into play in the near-term. Overall, I remain bullish BTC.

Bitcoin 8 Hour Chart

image2.png

Chart created with TradingView

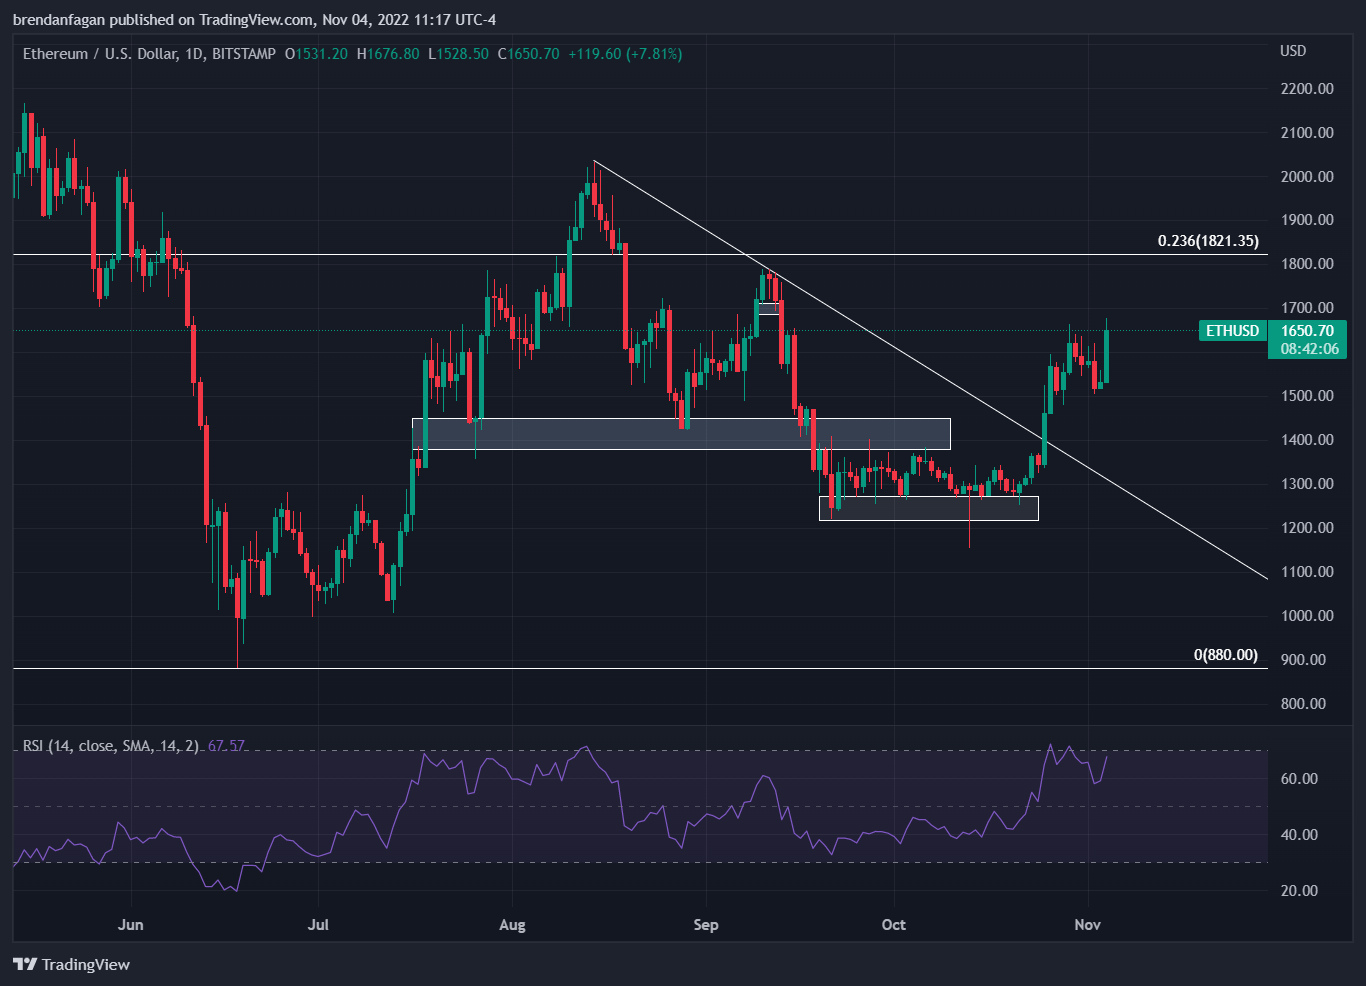
Just like Bitcoin, Ethereum has put in a monster rally after holding a major support zone for much of September. ETHUSD held the key zone just above $1200 following a strong sell-off to start September. This attempt to carve out a bottom ultimately proved to be crucial, as ETHUSD has now rallied to just short of $1700. Similar to BTCUSD, the ability for Ethereum to hold key support while traditional equity baskets slid hard during the latter half of September was eye-catching.

Ethereum has since broken above descending trendline resistance that rejected ETHUSD firmly in September. The daily close above this key trendline on October 25th has seen bullish continuation materialize, as we now trade just shy of $1700. With risk appetite improving following this week’s slate of risk events, ETHUSD may be targeting the 23.6% retracement of the 12-month range at $1821. Given the inability for Ethereum to trade back down to the lows at $880 despite the bearish environment for risk, the case for a revisit of that area remains difficult to make absent of any potential developments on crypto regulation.

Ethereum was trading just shy of $5000 this time 12 months ago, which shows just how much can change in a short amount of time.

Ethereum Daily Chart


image3.png

Chart created with TradingView

image1.png

Australian Dollar Outlook: Wings Clipped by the RBA

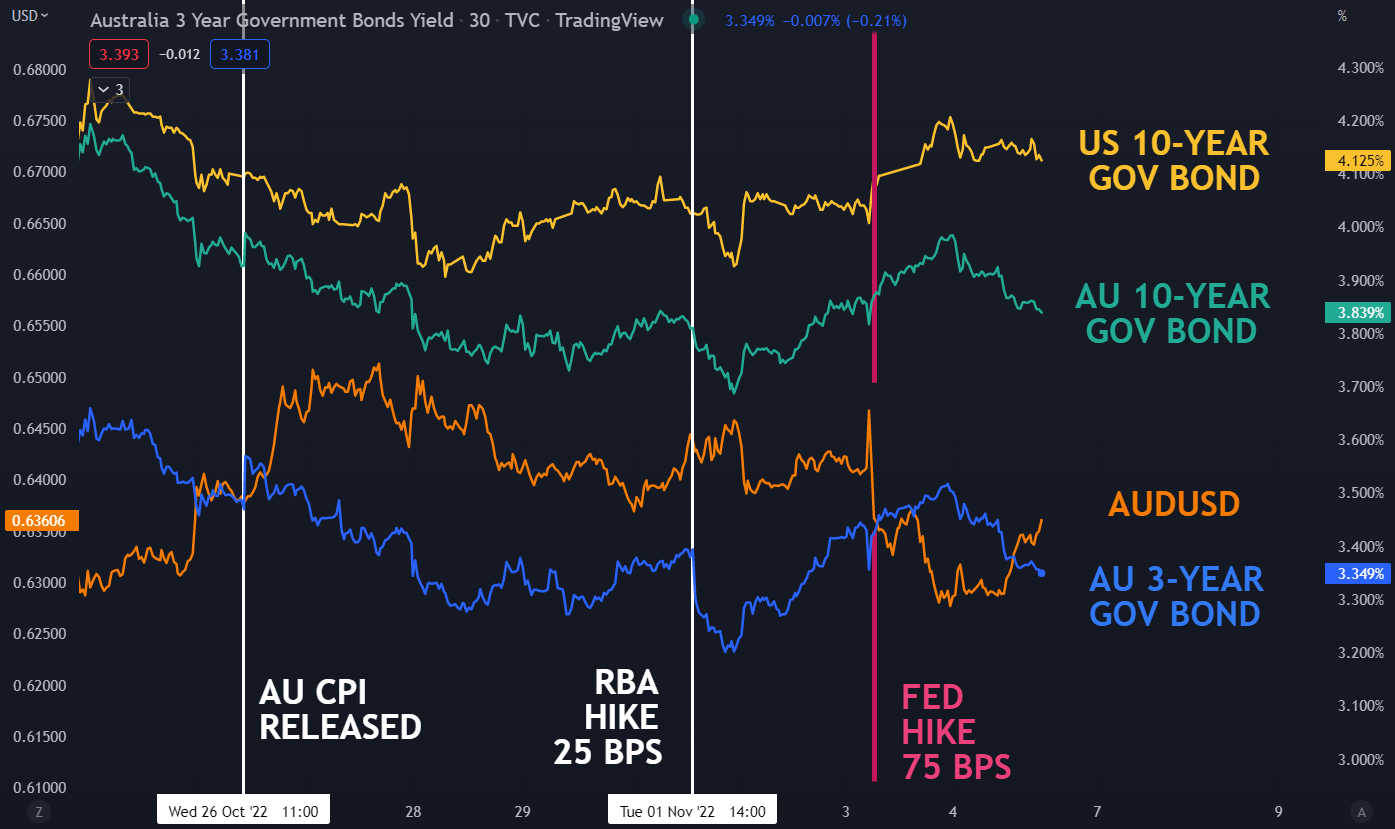
The Australian Dollar slid lower after the Reserve Bank of Australia (RBA) raised the cash rate target last Tuesday by 25 basis points (bp) as anticipated to 2.85% from 2.60%.

There had been hopes of a 50 bp lift by some economists. The retreat from an aggressive monetary policy tightening stance has led to a widening of the interest rate disparity in favour of the US Dollar, among others.

On Wednesday, the Federal Reserve hoisted their Fed funds rate target by 75 bp, as did the Bank of England with their policy adjustment on Thursday.

The Fed rate change caused some volatility in AUD/USD, with the ‘big dollar’ side of the equation whipping around. The 75 bp lift was widely anticipated and there had been hopes for a toning down of ultra-hawkish rhetoric.

This saw the US Dollar weaken immediately after the hike and before Fed Chair Jerome Powell took to the microphone. He once again made it very clear that the market should not be anticipating any easing of the assertive hawkishness seen thus far, and this saw the USD make some gains.

 The RBA released its quarterly Statement on Monetary policy on Friday to confirm most things that we already knew from the post-meeting media release. That is, they expect inflation to hit 8% this year, adjusted up from 7.75% (currently 7.3%), before easing next year.

This puts their forecast of the cash rate to 3.5% in mid-2024 before going lower. Of course, they maintained the usual caveats around incoming data.

A potential problem for the RBA is the possibility of price pressures remaining stickier than they anticipate. This may create a situation where they might have to push the cash rate further into tightening territory or keep it higher for longer.

Australia’s unemployment rate remains near historically low levels and growth is still robust, although we will not get an update on the latter until next month.

Other central banks are continuing to front-load their rate rises while the RBA has taken their foot off the gas. In their statement, they noted that they believe the increases in interest rates have been fully felt by mortgage holders.

Going into the end of the week there had been a developing perception of an anaemic global growth outlook. A significant component of this had been based on the Covid-19-related lockdowns in China hampering the world’s second-largest economy.

Then, late on Friday, a rumour emerged – attributed to Twitter chatter – that China is considering easing these restrictions. All China-related assets went berserk on the notion, with Hong Kong’s Hang Seng Index (HSI) up over 8% on the day at one stage.

Looking ahead, there’s not a lot of Australian data due out. Building permits might get some attention as well a speech by RBA Deputy Governor Michele Bullock on Wednesday.

There could be some action emanating from out of the US with their mid-terms on Tuesday and then inflation data on Friday.

A full transcript of the RBA’s Statement on Monetary Policy can be read here.

image1.png

image1.png

Crude Oil Forecast: Brent Surges on Weaker USD as NFP Takes Centre Stage

BRENT CRUDE OIL FUNDAMENTAL BACKDROP

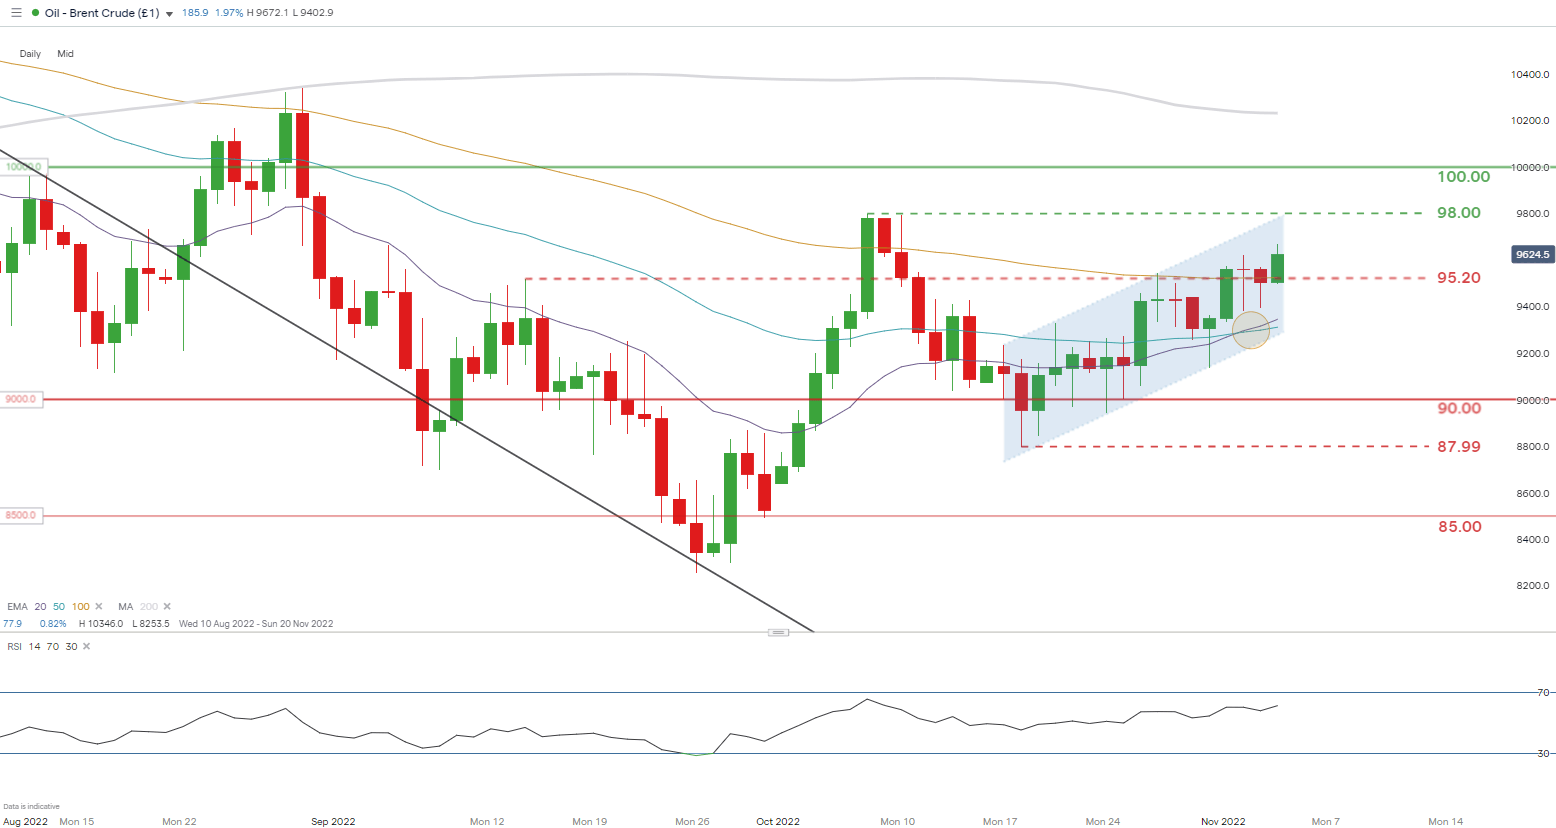
Brent crude oil is trading higher this morning after a tough few sessions post-FOMC as advancing U.S. Treasury yields have given the dollar upside support. Despite the ballooning USD, brent crude has held up relatively due to favorable inventory data including both API and EIA weekly stock releases.

The focus for today is the Non-Farm Payroll (NFP) data print which is expected at 200K. Although the correlation between ADP employment change and initial jobless claims are hardly anything to go by, a print higher than 200K could see brent crude trading lower by the end of the trading day. To close off Friday’s session, Baker Hughes rig count numbers which have been on the decline, may provide some backing for crude oil prices should this trend continue.

image1.png

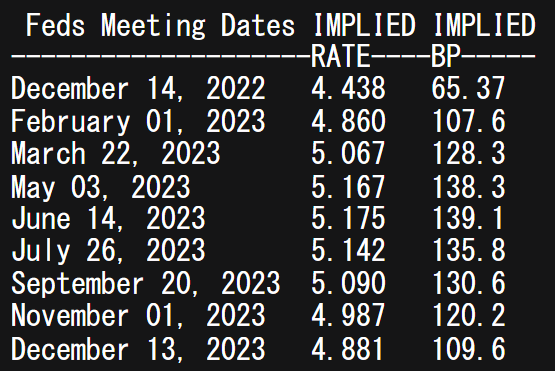
Looking at money market pricing on Fed interest rate probabilities in the table below, the terminal rate has risen to 5.175% in June after a peak of 5% in May just earlier this week. The consequent effect of this should this hold medium-term should limit crude oil gains. It will be interesting to see how OPEC+ reacts to these additional headwinds come the December meet and whether they may look at further output cuts.

FEDERAL RESERVE INTEREST RATE PROBABILITIES

image2.png

TECHNICAL ANALYSIS

BRENT CRUDE (LCOc1) DAILY CHART -UNDATED

image3.png


aud-usd technical chart

AUD/USD Aims Lower on Rising Recession Bets as US Dollar, Yields Rise

A move lower may be in store for Asia-Pacific markets after sentiment deteriorated overnight during US trading hours. A surprise drop in the number of initial jobless claims for the week ending October 29 intensified bond selling as FOMC rate hike bets hardened. Fed funds futures are pricing a +5% terminal Fed funds rate by March. The policy-sensitive 2-year US rate rose by nine basis points, while the US Dollar DXY Index.

The British Pound fell 2% against the USD despite a 75 basis point rate hike from the Bank of England (BoE). BoE Governor Andrew Baily warned that economic activity would be flat or negative for “some time.” The United Kingdom faces some of the sharpest price pressures among developed economies ahead of a potentially dire energy crunch this winter.

On Thursday, European natural gas prices eased lower to trade at 125.45 euros per megawatt hour (MWh). US Henry Hub prices shed nearly 6% as traders digested an unexpectedly strong 107 billion cubic feet (Bcf) inventory build for the week ending October 28. Crude oil prices fell around 2%. That weighed on oil-linked currencies; against the USD, the Canadian Dollar and Norwegian Krone fell 0.3% and 1.04%, respectively. Canadian oil is trading at its largest discount since December 2013 against US oil, according to the Western Canadian Select (WCS) price at -30.3 per barrel. The record flows out of the US SPR have made the heavy crude oil less attractive to refiners.

The Reserve Bank of Australia’s monetary policy statement is due at 00:30 UTC. The RBA raised its cash rate by 25 basis points earlier this week, disappointing a slim chance that the bank would return to larger hikes after last week’s inflation report. Australia posted a better-than-expected trade balance yesterday, fueled by export strength from natural gas and metal ores. However, China’s Caixin services PMI dampened forward-looking sentiment after revealing a deeper contraction occurred in October (48.4).

Asia-Pacific equity indexes may trade lower today as traders take a cautious stance ahead of the US jobs report, but prices should remain in positive territory for the week. China’s CSI-300 is up 3% since last Friday, and iron ore prices are slightly higher in early trading. China’s third-quarter account balance and an inflation rate update for the Philippines are on today’s calendar. India’s October trade balance will wrap up this week’s economic docket for the APAC region.

Australian Dollar Technical Outlook

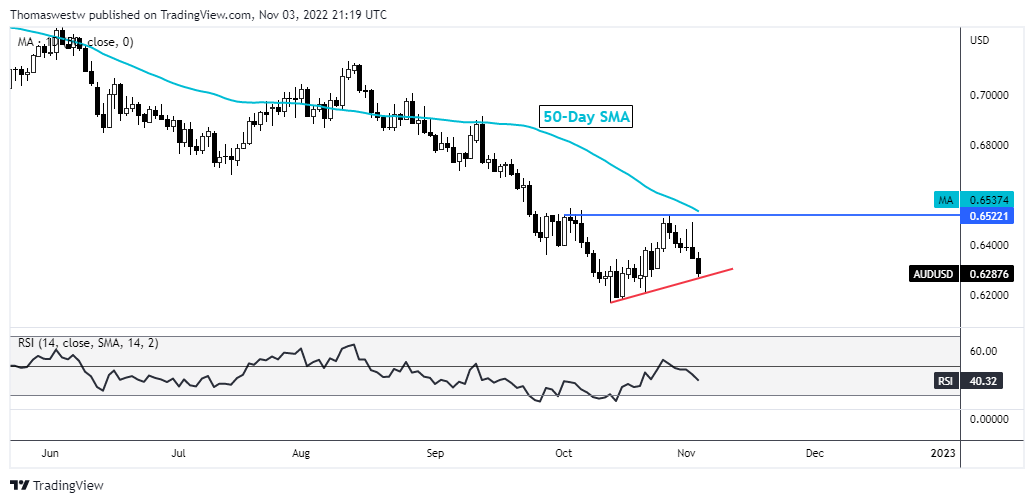
AUD/USD turned lower last week after prices failed to clear resistance from the early October levels. The downward move accelerated overnight, and prices may break a short-term trendline. That would threaten the October swing low. Alternatively, a potential rebound faces the falling 50-day Simple Moving Average (SMA).

aud-usd technical chart