Asian Markets Mostly Lower Amid Worries Over Policy Tightening

Asian Markets Mostly Lower Amid Worries Over Policy Tightening

U.S. markets were closed Monday for the Presidents Day holiday.

European stocks traded mixed in closing trade after earlier gains as U.S. markets were closed for a public holiday. The Stoxx Europe 600 and the FTSE 100 rose 0.1%, the DAX traded flat and the CAC 40 fell 0.16%. “Earlier gains for European indexes have been chipped away this afternoon, as concerns about interest rates and the ongoing Ukraine conflict sapped risk appetite,” IG analyst Chris Beauchamp wrote. Previously, markets were cautiously optimistic that central banks could be nearing the end of their interest-rate rise cycles but stronger data has reversed that view, he said.

 ASIAN STOCKS

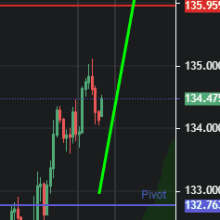
Japanese stocks were lower, dragged by falls in electronics stocks, as uncertainty persisted over policy tightening by central banks and its implications for the global economy. Investors were focusing on the yen, bond yields and any-policy related developments. USD/JPY was at 134.33, compared with 134.09 as of Monday’s Tokyo stock market close. The Nikkei Stock Average was down 0.2% at 27472.59.

South Korea’s benchmark Kospi fell 0.3% to 2447.78 in morning trade as electronics and internet stocks retreated. Preliminary trade data for the first 20 days of February show that the country is set to post another monthly trade deficit on sluggish exports of semiconductors and smartphones. Foreign and institutional investors were net sellers.

Hong Kong’s benchmark Hang Seng Index opened 0.1% lower, ahead of another busy stretch of U.S. economic data releases, which could give investors signals on the Fed’s next move. Property stocks extended Monday’s gains, leading advances on the HSI.

Chinese stocks were mixed, extending the market’s rangebound pattern in recent weeks. The benchmark Shanghai Composite Index rose 0.3% to 3301.30 and the Shenzhen Composite Index was up 0.4% at 2169.88. The ChiNext Price Index edged down 0.1% to 2478.98. Huaxi Securities analysts said the market is likely to continue consolidating and trading sideways in the near term, as investors slow buying activities after aggressively adding positions at the beginning of the year. But in the longer run, the trend of China’s macroeconomic improvement and equity-valuation rebound likely remains on track, Huaxi said. The recent downward correction could present buying opportunities, Huaxi added.

FOREX

Asian currencies consolidated against the USD in the Asian morning session, but may weaken on continued concerns over Fed tightening. These worries haven’t gone away, said Philip Wee, senior FX strategist at DBS Group Research, in an email. After the strong U.S. nonfarm payrolls and CPI readings recently, markets are bracing for another surprise in this Friday’s U.S. PCE data, Wee said. The PCE Price Index is the Fed’s preferred measure of inflation. USD/KRW was little changed at 1,296.25 while USD/SGD edged 0.1% higher to 1.3370 and AUD/USD was down 0.1% at 0.6901.

METALS

Gold edged higher in early Asian trade with focus on the FOMC minutes due later this week. The market is now pricing in a 25 basis point rate hike at each of the next three FOMC meetings, DailyFX’s senior strategist Nick Cawley said in a note. “If the FOMC minutes show that there was support for a 50bp hike at the last meeting, these market expectations may move higher still, boosting bond yields and the US dollar and weighing on the price of gold,” he added. Spot gold was 0.1% higher at $1,842.40/oz.

OIL SUMMARY

Oil prices were mixed in early Asian trade, as traders continue to weigh worries over geopolitical tensions against hopes of a reopening-driven recovery from China supporting demand. “The geopolitical backdrop is adding uncertainty,” ANZ analysts said in a note, adding that Israel’s prime minister has blamed Iran for an attack on an oil tanker in the Persian Gulf. “The U.S. is also planning new export controls and a fresh round of sanctions on Russia, targeting the defense and energy sectors,” they added. Relations between Washington and Beijing have also been increasingly tense lately after the U.S. shot down a Chinese balloon in its territory earlier this month. Front-month WTI rose 0.7% to $77.07/bbl; front-month Brent fell 0.6% to $83.26/bbl.

Australian Dollar Steadies as Trends Get Tested. Where to for AUD/USD?

Australian Dollar Steadies as Trends Get Tested. Where to for AUD/USD?

The Australian Dollar has started this week consolidating with firming PMI data and RBA meeting minutes being released today.

The Jibun Bank composite PMI came in at 49.2 for February against 48.2 prior and although it shows an improvement, it remains on the contractionary side of 50.

The RBA meeting minutes revealed most things that were already known by the market. They said, “Based on a technical assumption that the cash rate rises to 3¾ per cent over time, headline inflation was expected to decline to 4¾ per cent by the end of 2023.”

The futures market is pricing in a cash rate peak of 4.20% later this year.

There are many sunny aspects to the outlook for the Australian economy, but a potential problem could lie in the fact that CPI is outstripping both PPI and wage-price inflation.

Year-on-year CPI to the end of 2023 was 7.8% and PPI for the same period was 5.8%. Tomorrow will see the Australian Bureau of Statistics (ABS) release the Wage Price Index. A Bloomberg survey of economists is forecasting an increase of 3.5% over the year to the end of December.

While the sharpest part of the monetary policy axe is in housing mortgages, businesses also face higher funding costs when policy is being tightened.

Looking at the aforementioned inflation gauges, it could suggest that businesses are currently able to pass on increasing input costs at a faster rate than they are experiencing.

This might be a concern for the RBA when entrenched/embedded inflation expectations have been highlighted as an issue.

If consumers can bear the brunt of higher input costs and expanding profit margins for companies, it may suggest that consumer price pressures are still building.

If the first quarter CPI comes in hot, again, the RBA might have to re-assess its outlook for rates and this may have consequences for AUD/USD.

AUD/USD TECHNICAL ANALYSIS

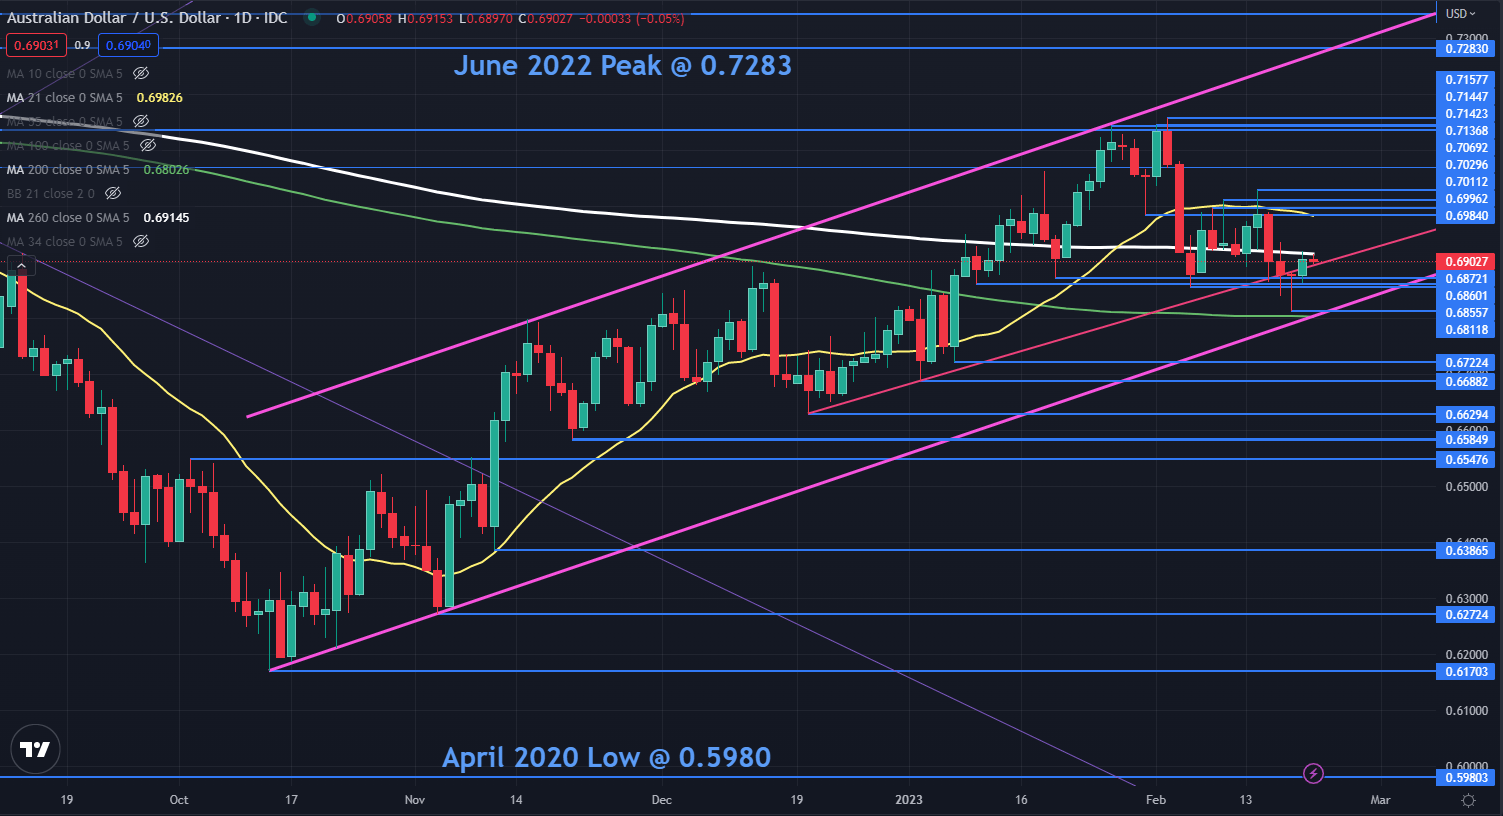
The Australian Dollar has steadied this week and it remains within an ascending trend channel.

AUD/USD had a look lower last Friday as it briefly dipped below a short-term ascending trend line It found support before a longer-term ascending trend line that forms the lower band of the ascending trend channel.

The 200-day simple moving average (SMA) currently lies near that trend line and may continue to provide support around 0.6800. The low seen last week at 0.6812 might also lend support.

A series of breakpoints and prior lows in the 0.6855 – 0.6877 area could also be a support zone.

The rally this week has struggled to overcome the 260-day SMA currently at 0.6915. A clean break above the 260-day SMA or below the 200-day SMA, might see momentum evolve in that direction.

On the topside, resistance could be offered at the breakpoints and previous peaks of 0.6984, 0.6996, 0.7011 and 0.7030. The 21-day SMA is currently near 0.6984 and may offer resistance.

The RBA meeting minutes can be read here.

AUD/USD DAILY CHART

image1.png


Japanese Yen Price Action Setups: USD/JPY, EUR/JPY, AUD/JPY, GBP/JPY

Japanese Yen Price Action Setups: USD/JPY, EUR/JPY, AUD/JPY, GBP/JPY

Short-term downward momentum in the Japanese yen remains intact ahead of Friday’s US core PCE price index data. Recent strong US data have triggered a dramatic repricing higher in Fed rate expectations and the market will be watching for cues on the US Federal Reserve’s preferred inflation gauge. Still, technical charts suggest it may be too soon to conclude if the Japanese currency has embarked on a depreciation trajectory beyond intraday timeframes, at least against the US dollar.

USD/JPY – Plenty of resistance

USD/JPY is hovering around the vital resistance area at 135.00-138.00, including the early-January high, the 200-day moving average, coinciding with the upper edge of the Ichimoku cloud on the daily charts, not too far from the December high of 138.20.As highlighted in last week’s update, the trend on intraday charts is still up and there is no sign of reversal just yet. However, the trend on the daily chart (relevant for swing/positional traders) is down and the most recent rebound is a consolidation within the broader weakness. USD/JPY would need to clear the above resistance area for the multi-week downward pressure to fade.

USD/JPY Daily Chart

image1.png

EUR/JPY – Flirting with the 200-DMA

EUR/JPY has been flirting with the 200-day moving average recently and is now at the top end of the past two months’ range. The cross faces stiff resistance at the end-December high of 143.00, the mid-2022 highs of 144.25 followed by the December high of 146.75. While the price action since mid-2022 has been quite choppy, zooming out to higher timeframes (beyond the daily timeframe), the broader trend for EUR/JPY has been up. However, given the tough barrier the cross currently faces, it is unclear if EUR/JPY is ripe to resume the broader bullish bias or continue within the range for a prolonged period.

EUR/JPY Daily Chart

image2.png

AUD/JPY – At a major intersection

AUD/JPY’s drop in December below a slightly upward-sloping trendline from August triggered a break from a bearish topping pattern. However, the cross failed to extend losses subsequently, finding support at the May low of 87.45. The price action since then has been choppy with a slight upward bias. AUD/JPY now faces a strong ceiling on the 200-day moving average, the mid-December high of 93.35, roughly coinciding with the upper edge of a rising channel from December. The cross would need to break above the converged cap to resume the uptrend from 2020.

AUD/JPY Daily Chart

image3.png

GBP/JPY – At the lower end of the well-established range

GBP/JPY has been around the lower end of the range since early 2022. In recent weeks, GBP/JPY has struggled to break past a stiff converged barrier, including the January high of 161.80, coinciding with the upper edge of the Ichimoku cloud on the daily charts, the 200-day moving average, near the November low of 163.10. The November low coincides roughly with a 50% retracement of the bearish candle created on Dec. 20, which can offer major resistance. The cross needs to clear the converged resistance of 161.50-163.50 for the multi-month range to continue.

GBP/JPY Daily Chart

image4.png

Swedish Krona Holds the High Ground as US Return from Holidays. Lower EUR/SEK?

Swedish Krona Holds the High Ground as US Return from Holidays. Lower EUR/SEK?

The Swedish Krona eased slightly today after having a blistering rally yesterday with EUR/SEK hitting a 2-month low.

The Riksbank monetary policy meeting minutes revealed a very hawkish tone and core CPI data was higher than anticipated for January, coming in at 0.4% m/m rather than -0.2% anticipated.

The central bank raised rates by 50 basis points at the last meeting and many economists are now taking aim at the next meeting on April 26th to be another 50 bp lift. The overnight index swap (OIS) is somewhat undecided, with around 35 bp priced in.

The move in SEK dragged the Norwegian Krone higher although to a lesser extent, with crude oil slipping before steadying in Asian trade. The WTI futures contract is near US$ 76.50 bbl while the Brent contract is a touch above US$ 83 bbl.

The US Dollar is firmer through the day so far in fairly lacklustre trade in the aftermath of the US holiday. Gold has had a small range and is sitting near US$ 1,840 an ounce.

RBA meeting minutes revealed that the board considered a 50 bp hike. Futures markets are pricing in around an 80% chance of a further 25 bp lift at the March and April meetings. AUSD/USD is slightly lower on the day, near 69 cents against the US Dollar.

APAC equities were mostly flat with Hong Kong’s Hang Seng Index (HSI) the notable exception, sliding over 1% at one stage. Futures are pointing toward a soft start for Wall Street later.

Looking ahead, European and US PMIs will be the focus alongside Canadian CPI.

Later in the week, FOMC meeting minutes will be released on Wednesday and the Fed’s preferred inflation gauge of Core PCE will be out on Thursday as well as some 4Q US GDP figures.

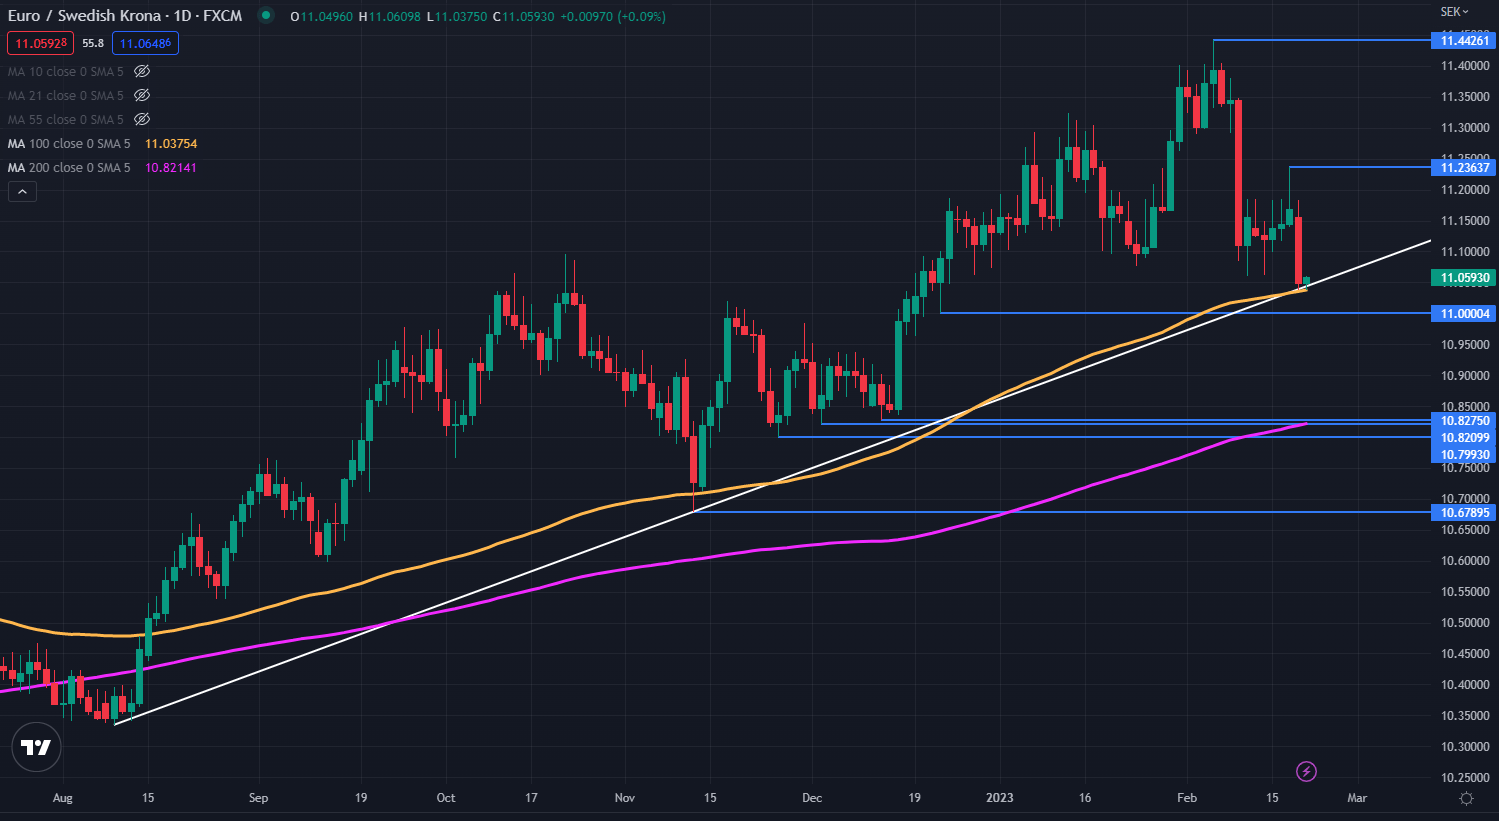
EURSEK TECHNICAL ANALYSIS

EUR/SEK is currently sitting on an ascending trend line and the 100-day simple moving average (SMA).

While they appear to be lending support at the moment, a clean break below them could see bearish momentum unfold.

Support might be at the prior lows of 11.0000, 108275, 10.8210 and 10.6790. On the topside, the 13-year high of 11.4426 might offer resistance.

image1.png


China central bank asks banks to slow lending in February – sources

China central bank asks banks to slow lending in February – sources

BEIJING: China’s central bank has told some banks to slow the pace of lending to contain risks after new bank loans jumped to a record in January, three bankers with knowledge of the matter said.

The People’s Bank of China (PBOC) sent the informal instructions, or the so-called window guidance, earlier this month to some lenders that asked them to issue loans “under an appropriate growth rate”, the bankers said.

The banks were told to control the scale of new loans in February to avoid issuing new loans at a too-rapid pace, the sources said.

Chinese banks are under pressure to accelerate credit support to prop up a slowing economy after harsh COVID-19 measures and a crisis in the property sector dragged China’s 2022 GDP growth down to one of its worst rates in nearly half a century.

New bank loans in China jumped more than expected to a record 4.9 trillion yuan (US$713.51 billion) in January.

However, the loan growth was mainly underpinned by state-backed infrastructure projects, while actual business demand remained weak.

“If banks are blindly pursuing the increase in the scale of loans, that may not be sustainable,” one of the bankers said.

In addition, the pressure on banks to extend more loans to boost consumption has led to the misuse of such funds. Some homebuyers, for instance, borrowed cheaper consumer loans to repay their mortgages, a practice that is banned by regulators.

China’s banking regulator on Friday imposed fines on five financial institutions over irregularities, including illegal property loans and misuse of consumer loans.

The PBOC did not immediately respond to requests for comment.

The central bank also issued guidance to headquarters of some major state-owned banks in January asking them to book some of their loans made that month to later months for accounting purposes, a fourth banker with knowledge of the matter said.

The move aimed to avoid an abrupt surge in bank lending figures, the source said.

GBP Price Forecast: Pound Flat Against Peers, Dovish Pressure on BoE Mounting

GBP Price Forecast: Pound Flat Against Peers, Dovish Pressure on BoE Mounting

GBPUSD FUNDAMENTAL BACKDROP

The British pound is marginally in the green against the euro and USD this Monday morning with no real overnight news leading the way. Overall, GBP remains under pressure against the two major currencies largely influenced by an aggressive ECB and Federal Reserve relative to the Bank of England (BoE). A strong US economy and an ECB that began their interest rate hiking cycle later than the rest has left the BoE in a more cautious position. Some worrying UK economic data has muted additional rate hikes post-March (see table below) and money markets now seem to favor a pause for the May meeting. That being said, core inflation remains sticky due to wage pressures so more emphasis will be placed on the services sector moving forward. While it is common knowledge that a tight monetary policy takes time to reflect in an economy, many BoE officials believe there is more after effects to come particularly in the housing market, as most UK mortgages are under fixed-term contracts.

BANK OF ENGLAND INTEREST RATE PROBABILITIES


image1.png

The economic calendar for today is fairly light with just EZ consumer confidence on the docket while tomorrow will provide more substance to markets. PMI data for the eurozone. US and UK will be in focus while the ZEW economic sentiment index may provide some sustenance for the EUR should actual data fall in line or beat the previous print which was positive for the first time since February 2022.

ECONOMIC CALENDAR

image2.png

image3.png

On the political front, the UK Prime Minister Rishi Sunak has traveled over to Northern Ireland to make revision to the NI Protocol that could improve relations and trade with the EU giving the pound some provision.

TECHNICAL ANALYSIS

GBP/USD DAILY CHART

image4.png

Daily GBP/USD price action has managed to hold its head above the 1.2000 psychological support handle but another breakdown could be on the cards depending on upcoming fundamental data. Wednesday’s FOMC minutes could bring a flurry of support for the greenback should if there is a hawkish slant to the report. Technically, a push below the 200-day SMA (blue) may well result in a significant pound sell-off pushing the Relative Strength Index (RSI) level into oversold territory.

Key resistance levels:

  • 1.2407
  • 1.2270
  • 1.2154/50-day SMA
  • 1.2100

Key support levels:

  • 1.2000
  • 200-day SMA
  • 1.1900

BULLISH IG CLIENT SENTIMENT

IG Client Sentiment Data (IGCS) shows retail traders are currently LONG on GBP/USD, with 56% of traders currently holding long positions (as of this writing). At DailyFX we typically take a contrarian view to crowd sentiment but due to recent changes in long and short positioning, we arrive at a short-term upside bias.

EUR/GBP DAILY CHART

image5.png

EUR/GBP shows a similar short-term trend with the pound depreciating against the euro. The ascending channel has been closely following the 50-day SMA (yellow) as support now looking to breach the 0.8900 resistance level once more. Fundamentally, the ECB is likely to exhibit more aggressive measures in their monetary policy and that could keep the channel in play over the short/medium-term.

3 Types of Forex Analysis

3 Types of Forex Analysis

There are several different ways to analyze the FX market in anticipation of trading. Although categories of analysis may be plentiful, traders should keep the analysis simple enough to identify good trading opportunities.

This article explores the three most common forex analysis techniques: Fundamental, technical and sentiment analysis, and how they help to shape a trading strategy. Thereafter, it is up to the individual trader to try find out what type of analysis suits there trading style.

3 types of forex analysis techniques

The 3 Most Common Types of Forex Market Analysis:

1) Fundamental

Forex fundamentals center mostly around the currency’s interest rate. This is due to the fact that interest rates have a sizeable effect on the forex market. Other fundamental factors are included such as gross domestic product, inflation, manufacturing, economic growth activity. However, whether those other fundamental releases are good or bad is of less importance than how those releases affect that country’s interest rate.

Traders reviewing the fundamental releases should keep in mind how they might affect the future movement of interest rates. When investors are in a risk-seeking mode, money follows yield (currencies that offer a higher interest rate), and higher rates could mean more investment. When investors are in a risk adverse mentality, then money leaves yield for safe-haven currencies.

The DailyFX website offers a lot of assistance on identifying how a fundamental release could affect the value of the currency. Check out the economic calendar for events coming up this week.

2) Technical

Forex technical analysis involves looking at patterns in price history to determine the higher probability time and place to enter a trade and exit a trade. As a result, technical analysis in forex is one of the most widely used types of analysis.

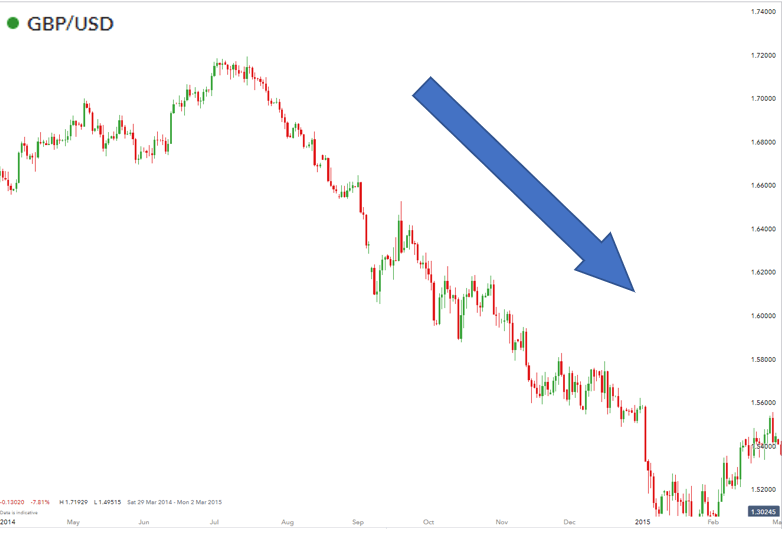
Since FX is one of the largest and most liquid markets, the movements on a chart from the price action generally gives clues about hidden levels of supply and demand. Other patterned behavior such as which currencies are trending the strongest can be obtained by reviewing the price chart. An example of this can be seen below in the GBP/USD chart where the US dollar is strengthening against the Pound Sterling.

GBPUSD chart in forex analysis techniques

Other technical studies can be conducted through the use of indicators. Many traders prefer using indicators because the signals are easy to read, and it makes forex trading simpler.

Technical versus fundamental analysis in forex is a widely debated topic. There is no right answer to the question of which type of analysis is better and traders tend to adopt one, or a combination of the two, in their analysis.

3) Sentiment

Forex sentiment is another widely popular form of analysis. When you see sentiment overwhelmingly positioned to one direction, this means the vast majority of traders are already committed to that position.

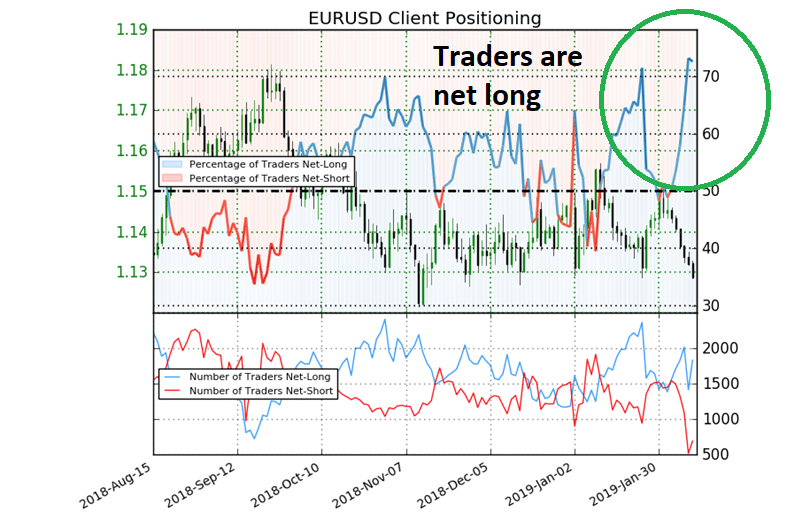
Perhaps this can be better explained with an example. Let’s assume that an overwhelming number of traders and investors are bullish the Euro. They think the Euro is going higher. Since people vote with their trades, we can assess through DailyFX (which uses IG Client Sentiment) that the EUR/USD sentiment shows a majority of traders are buyers in the currency pair.

sentiment forex analysis techniques

Since we know there is a large pool of traders who have already BOUGHT, then these buyers become a future supply of sellers. We know that because eventually, they are going to want to close out the trade. That makes the EUR to USD vulnerable to a sharp pull back if these buyers turn around and sell to close out there trades.

More astute traders will analyze retail sentiment alongside sentiment at the institutional level. Senior Analyst at DailyFX, Tyler Yell explains how traders can analyze the Commitment of Traders (CoT) report for clues on how the institutional market is positioned and how to implement this analysis into their trading analysis.

Learn more about sentiment trading through DailyFX to provide trading opportunities based on IGCS.

How to apply forex techniques to your trades

Traders can utilize a mix of all three types of forex market analysis. This can be done by:

  • Identifying long term trends with the use of fundamental analysis
  • Pin-pointing ideal entry points using technical analysis and accompanying indicators
  • Making use of client sentiment as the last check box before entering the trade.

Keep reading for in-depth examples of how to analyse forex market trends with the three analysis techniques:

1) Use fundamentals to assist in identifying a long-term trend:

Analyzing a country’s GDP, interest rate and inflation rate provides insight on the strength of that country’s economy and by extension, their currency. For example, if the US begins an interest rate hiking cycle, the US dollar will look attractive. If enough investors/traders buy US dollars this will prop up the value of the USD.

2) Apply sound technical analysis to spot entries into the market:

Using multiple time frame analysis and an indicator like the MACD or Relative Strength Index, traders can spot ideal entries into the market.

3) Consider client sentiment:

Traders can analyze client sentiment either by observing the net number of traders long or short, or by trading the difference in net short/long movements. The main takeaway however, is that retail clients tend to trade against prevailing trends therefore, making client sentiment a contrarian indicator.

Further reading to take your forex trading to the next level

  • If you are just starting out on your forex trading journey you can learn the basics with our free New to Forex guide.
  • We also offer a range of trading guides to supplement your forex knowledge and strategy development.
  • Our research team analyzed over 30 million live trades to uncover the Traits of Successful Traders. Incorporate these traits to give yourself an edge in the markets.
USDJPY Potential for bullish continuation towards previous swing high

USDJPY Potential for bullish continuation towards previous swing high

USDJPY Potential for bullish continuation towards previous swing high. Type: Bullish Bounce. Preference: Looking at the H4 chart, my overall bias for USDJPY is bullish due to the current price being above the Ichimoku cloud, indicating a bullish market. Looking for price to rise from this pivot which is the overlap support towards the resistance which is the previous swing high. It’s worth noting that there is an intermediate resistance here where price might struggle to break through.

Euro Area Braces for Era of Central-Bank Losses After QE Binge

Euro Area Braces for Era of Central-Bank Losses After QE Binge

(Bloomberg) — The euro area’s central banks will disclose their first significant losses from a decade of money printing in the coming weeks, heralding a new era of scrutiny and the prospect of taxpayer bailouts.

When the European Central Bank reveals annual results on Thursday, officials are expected to warn of big shortfalls this year and next across the region as higher interest rates make the cost of servicing deposits built up through quantitative easing soar.

The ECB release will foreshadow a series of awkward national reports, with Germany’s Bundesbank potentially facing the biggest hit of all.

“Results will turn negative for many banks already in 2022, because of the mismatch of interest rates on assets and liabilities,” Bank of Portugal Governor Mario Centeno said in an interview. “We finance ourselves now at higher interest rates, which do not match the return of bonds and all sorts of debt in the central bank’s balance sheet.”

Euro-area losses would add to a list of examples globally, with the neighboring Swiss National Bank standing out for its record shortfall last month. The prospect has left some officials nervous at the light they risk shining on the region’s financial plumbing, and possible fiscal implications.

The Bank for International Settlements insisted this month that such outcomes don’t matter, that central banks can operate with negative equity and that they can’t go bankrupt. Above all, officials claim losses have no bearing on monetary policy.

Even so, the ECB has criticized monetary shortfalls elsewhere in the European Union, and its own rules can require governments to fork out money for national central banks. It’s even feasible that the Frankfurt-based institution itself could need aid.

The Bundesbank will probably post small losses for 2022, rising to €26 billion ($28 billion) in 2023 if ECB rates stay at current levels, according to Daniel Gros, a board member of the Centre for European Policy Studies in Brussels.

That would wipe out the €20 billion of provisions for losses on asset purchase programs as well as its €5 billion of capital and reserves. For a normal company, that could mean insolvency.

A Bundesbank spokesperson declined to immediately comment when contacted by Bloomberg.

Gros expects a warning in the annual financial statements, and for the Bundesbank to “try to negotiate quietly a capital infusion from Berlin” later this year.

However, in the last episode of repeated losses in the 1970s, officials rolled over the shortfall into subsequent years, raising the prospect that they might just do that again.

Other counterparts also face big losses in 2023, but not enough to wipe out capital. Gros expects those to total €17 billion in France, €9 billion in Italy and €5 billion in the Netherlands. If rates remain high in 2024, the Dutch and French central banks would be at risk of negative equity too.

In September, Dutch central bank chief Klaas Knot warned his government of “cumulative losses that will be considerable” in coming years. “In an extreme case, a capital contribution” from taxpayers “may be necessary,” he said.

Jerome Haegeli, chief economist at Swiss Re and a former SNB official, said losses are likely to subject central banks and their money-printing programs to closer political and public scrutiny.

The combination of high inflation — blamed by some partly on QE — and any taxpayer transfers needed to reverse negative capital positions can be seen as “a super tax on economies,” he said.

“Together with central banks not providing windfall gains anymore means the public deficit increases,” he said. In the worst case, filling financial holes at central banks could mean governments “needing even higher taxes.”

The double impact puts central banks’ “most important asset at risk, which is their de facto independence,” Haegeli said.

The losses arise because the ECB created liquidity by buying €5 trillion in predominantly government bonds to stoke inflation and stabilize financial markets through the pandemic. A big part of those funds returned as deposits.

National central banks pay interest on them at the ECB rate, now 2.5%. The matching assets are fixed-coupon bonds paying just 0.5% on average, according to Gros.

Although monetary decisions are taken by the ECB, operations are run nationally. The Bundesbank is worst affected because German government bonds were seen as a safe harbor, with low or even negative yields. The Bank of Greece, whose purchases were much smaller and of higher-yielding national bonds, is likely to stay profitable.

Euro-area institutions did anticipate shortfalls. Total capital and provisioning buffers against losses in the overall system are €229 billion, according to the ECB. “Central banks did a huge amount of provisions during this short cycle of very good results,” Centeno said.

For years, those profits also helped finance government spending, and the reversal now means public funds may be needed to rebuild balance sheets.

In a nearby example, the UK has already approved an £11 billion ($13.2 billion) transfer to the Bank of England under a pre-agreed indemnity.

Switzerland’s central bank hasn’t needed a capital boost after its biggest ever loss — equivalent to about a fifth of Swiss GDP. But the SNB did skip a yearly payment to authorities for only the second time, and officials have started shrinking the balance sheet, limiting future shortfalls.

A A$36.7 billion ($25.1 billion) loss at the Reserve Bank of Australia has left it with A$12.4 billion negative equity. It said in June it hoped to rebuild reserves by retaining future profits, and hasn’t sought government cash.

According to BIS chief Agustin Carstens, that’s fine. He said this month that central banks “can and have operated effectively” even with negative equity. “The bottom line for central banks is not profit, but the public good.”