Meta is launching ‘Meta Verified’ for Instagram and Facebook profiles for a $12-a-month

Meta is launching ‘Meta Verified’ for Instagram and Facebook profiles for a $12-a-month

Meta is rolling a new paid verification subscription service called Meta Verified, CEO Mark Zuckerberg announced on Sunday.

Coming soon, for $11.99/month on web and $14.99/month on iOs, users on Instagram and Facebook will be able to pay to become verified users, which will entail, among other things, a blue verification badge.

The service will first be introduced in New Zealand and Australia this year, and will be available in other nations ‘soon,’ according to Zuckerberg.

This week we’re starting to roll out Meta Verified – a subscription service that lets you verify your account with a government ID, get a blue badge, get extra impersonation protection against accounts claiming to be you, and get direct access to customer support,’ wrote the Meta boss Zuckerberg on Instagram

‘This new feature is about increasing authenticity and security across our services.’

The company has previously granted verification to notable figures including celebrities, business leaders, journalists, politicians and athletes.

Meta said those with pre-existing verification badges will not see their status or options change in the new era of subscription verification.

The new verification system looks a lot like Elon Musk’s Twitter Blue service, which was rolled out in December after an initially delayed launch.

Twitter’s blue check mark subscription costs users eight dollars per month.

According to the Verge, users who sign up for Meta’s new systems will be given exclusive stickers for Stories and Reels, and will also receive 100 free stars per month, or the digital currency used to tip Facebook creators.

Businesses will not yet be able to apply for a verified badge, and it will also be the case that if an individual wishes to change his or her profile name, username, birthday or profile picture, they will have to go through the verification process all over again.

Meta, unlike Twitter, will require users to submit government IDs in order to receive account verification, and will reportedly offer other safeguards against fake accounts as well.

The service’s higher price point on iOS and Android is likely something the company is doing to offset the commission that both the Apple and Google stores take on in-app purchases.

New Zealand Dollar Price Setup: NZD/USD Looks Vulnerable Ahead of RBNZ Rate Decision

New Zealand Dollar Price Setup: NZD/USD Looks Vulnerable Ahead of RBNZ Rate Decision

NZD/USD SHORT-TERM TECHNICAL FORECAST – NEUTRAL

The New Zealand dollar is looking vulnerable as it tests crucial support as the market scales back expectations of an aggressive rate hike by the Reserve Bank of New Zealand.

Expectations for the RBNZ to hike interest rates at its meeting on Wednesday continue to be scaled back in the aftermath of the cyclone amid a softening economy, signs of peaking inflation, and a cooling housing market. The market is now pricing in less than 50 basis points of a rate hike this week to 4.75%, down from 55 basis points a week ago, and 61 basis points a month ago. In contrast, US Fed rate expectations have been repriced higher in recent weeks, keeping NZD/USD under pressure.

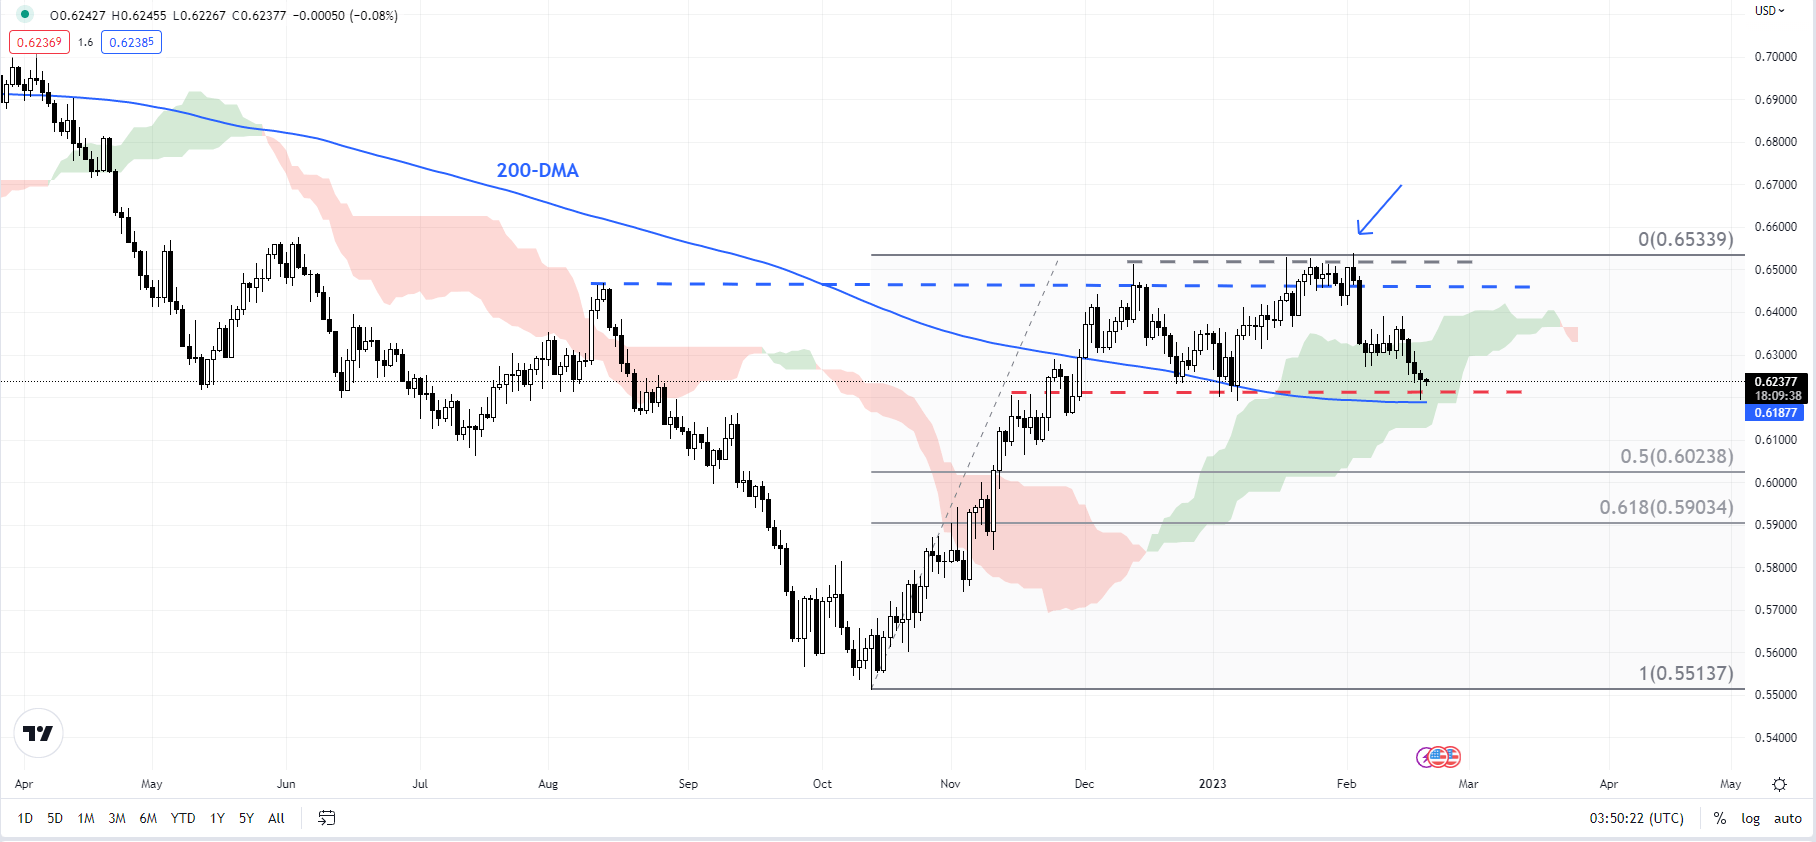
NZD/USD Daily Chart

image1.png

Chart Created Using TradingView

On technical charts, NZD/USD is testing crucial converged support at the January low of 0.6190, coinciding with the 200-day moving average. This follows a failure to break past stiff converged resistance at the December high of around 0.6500, the 89-week moving average, slightly below the 200-week moving average (at about 0.6600).


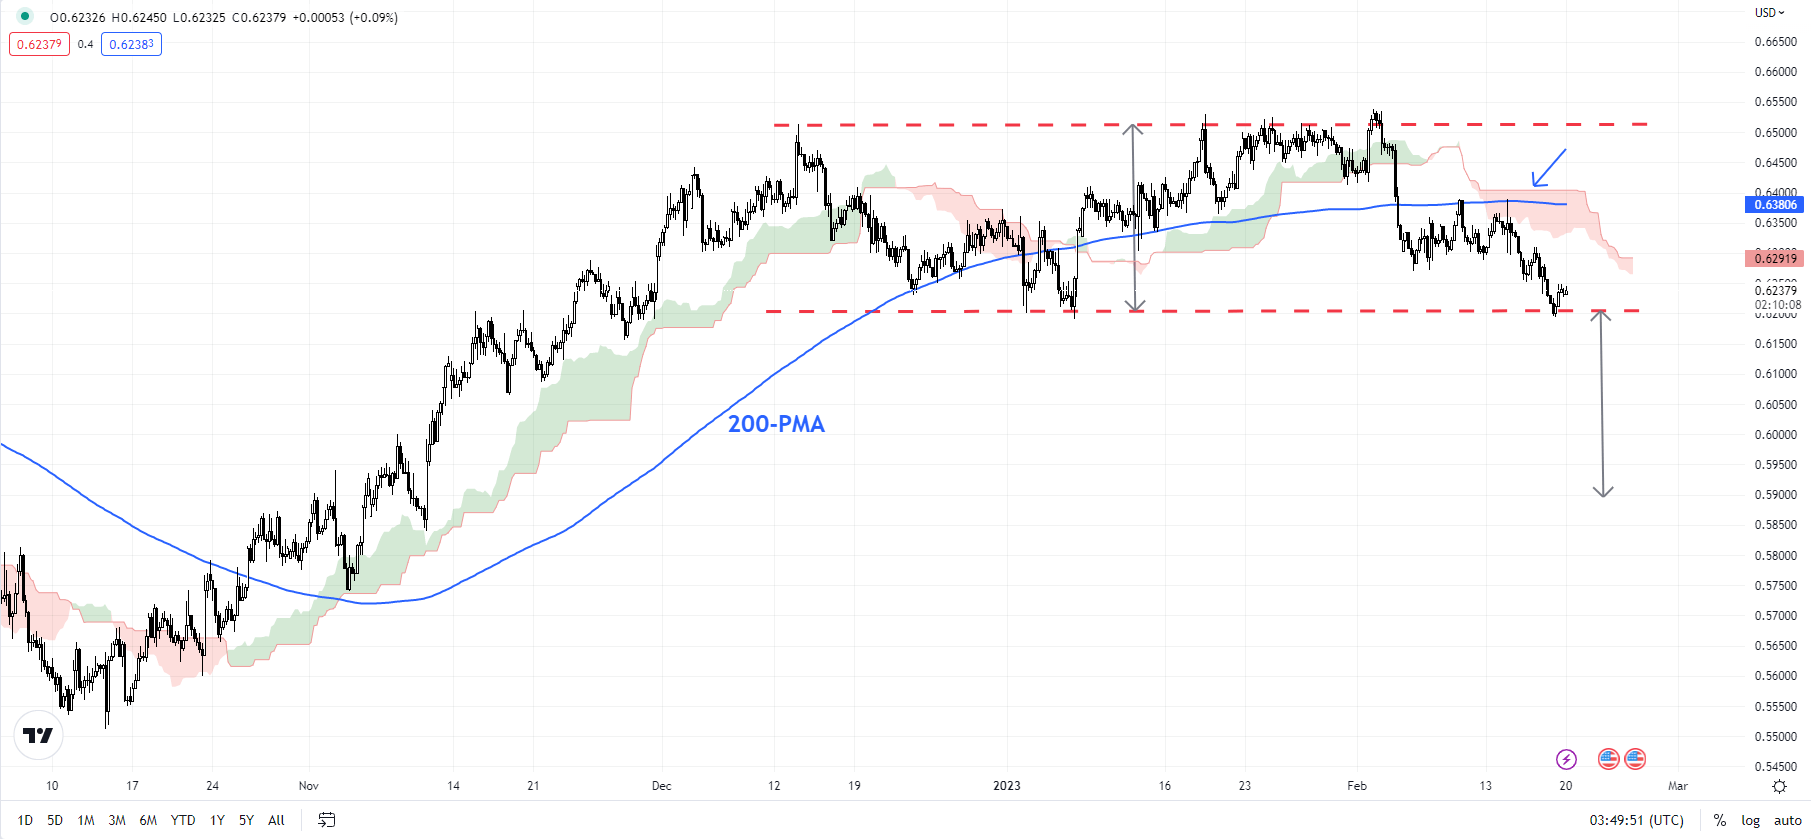
NZD/USD 4-Hour Chart


image2.png

Chart Created Using TradingView

A break below 0.6190 would trigger a minor double top (the end-2022 and the January highs), potentially opening the door toward 0.5850. NZD/USD medium-term outlook has been improving since the fourth quarter of 2022, but the double top pattern, if triggered, would dent those improved prospects somewhat. Below 0.6190, there is support is at 0.6020 (the 50% retracement of the rise from 2022) and 0.5900 (the 61.8% retracement).

Natural Gas Price Weekly Outlook: Bearish Rectangle Breakout Spells Trouble?

Natural Gas Price Weekly Outlook: Bearish Rectangle Breakout Spells Trouble?

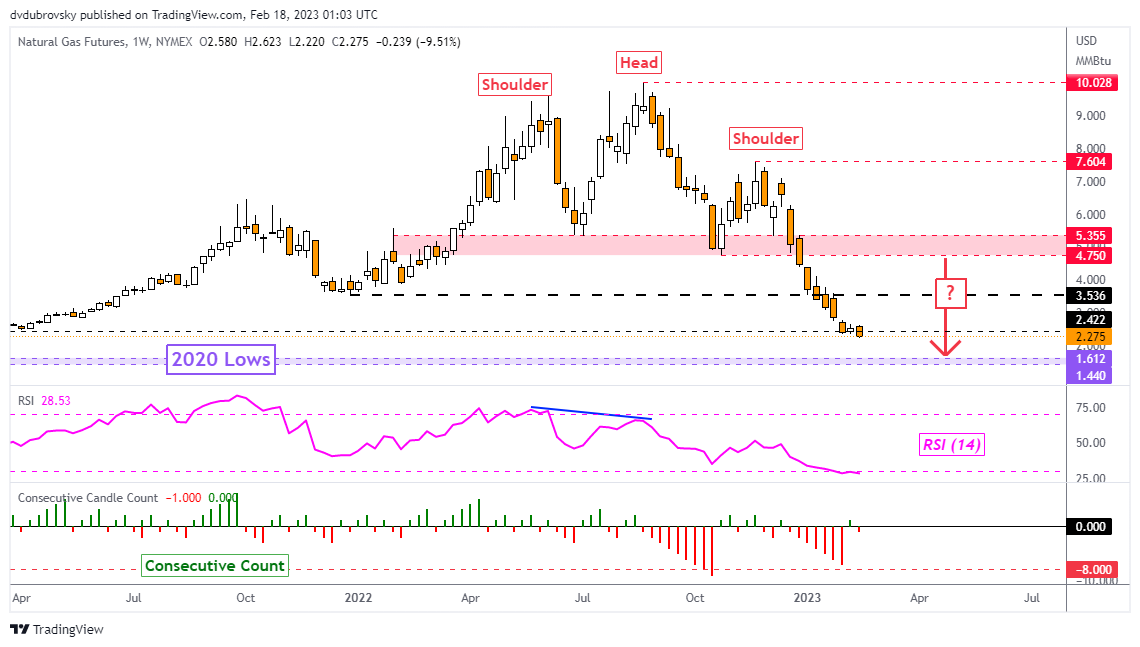
Weekly Chart – Bearish Head & Shoulders Target Closing In

Natural gas prices continued a broader losing streak since the summer of 2022 last week. Following a brief pause on the week of February 6th, the commodity fell 9.5% over the past 5 trading sessions. Prices also confirmed a breakout under the March 2021 low. This meant the lowest close since September 2020. Moreover, it seems prices are continuing to follow the bearish trajectory of a Head & Shoulders chart formation. Is more pain ahead?

Weekly Chart – Bearish Head & Shoulders Target Closing In

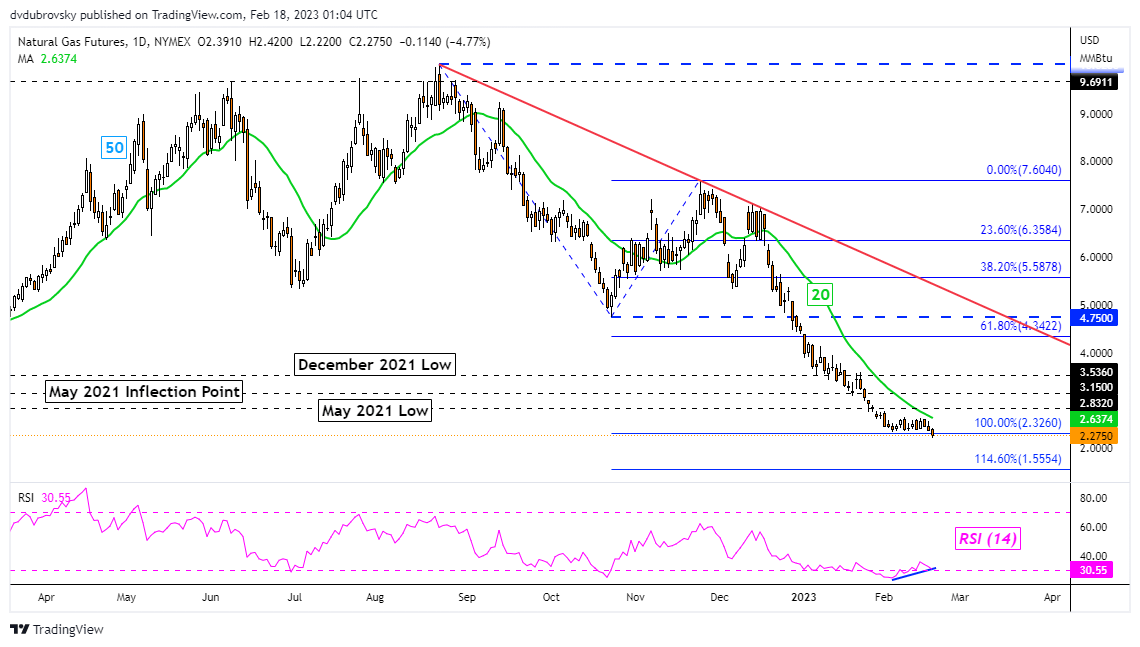
Daily Chart – Downside Momentum Fading

On the daily chart, prices have finally closed under a series of lows established since the end of January. With it, natural gas also took out the 100% Fibonacci extension level at 2.326. That has exposed the 114.6% level at 1.555. But, positive RSI divergence is present. While it does not guarantee that a reversal is at hand, it does show that downside momentum is fading. That can at times precede a turn lower. Still, in the event of a bounce, the 20-day Simple Moving Average (SMA) could hold as resistance, maintaining the downside focus.

Daily Chart – Downside Momentum Fading

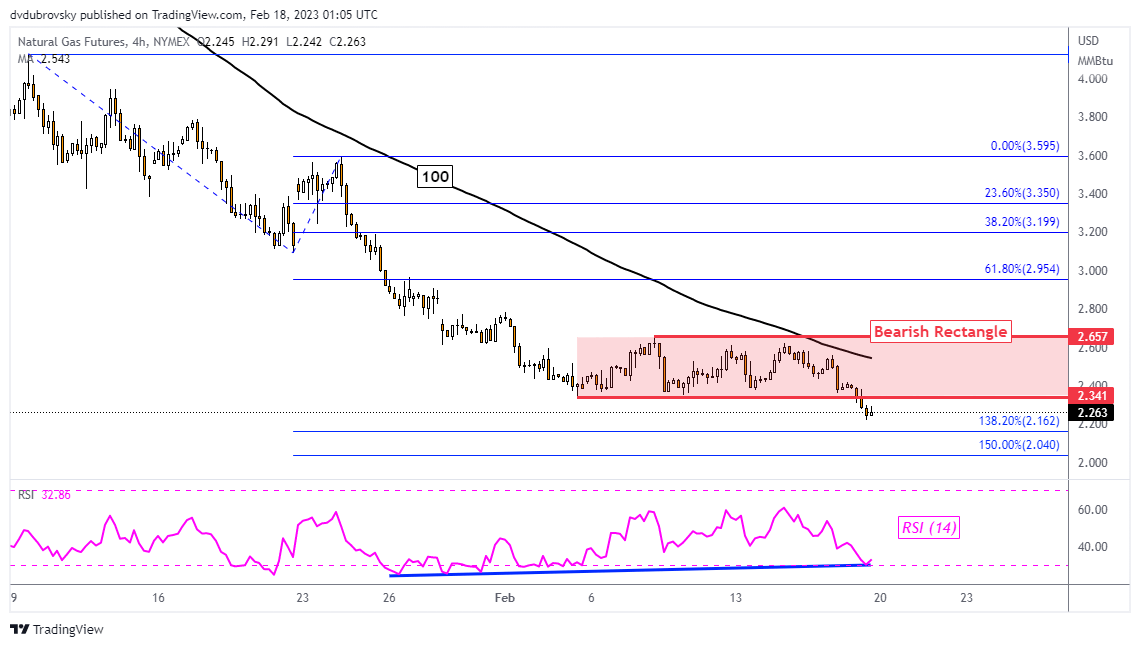
4-Hour Chart – Bearish Rectangle Breakout Eyed

Zooming in further on the 4-hour setting reveals that prices confirmed a breakout under a Bearish Rectangle chart pattern – as expected. That has opened the door to extending losses toward the 138.2% and 150% Fibonacci extension levels at 2.162 and 2.04, respectively. Meanwhile, the 100-period SMA remains tilted lower and may hold as key resistance in the event of a turn higher. A push back into the rectangle may offer an increasingly neutral outlook.

4-Hour Chart – Bearish Rectangle Breakout Eyed

Japanese Yen Dips as Treasury Yields Climb Ahead of Ueda Testimony. Higher USD/JPY?

Japanese Yen Dips as Treasury Yields Climb Ahead of Ueda Testimony. Higher USD/JPY?

The Japanese Yen is slightly weaker to start the week with the US Dollar firming across the board.

The perception that the Federal Reserve might move toward 50 basis point (bp) hikes rather than 25 bp appears to be weighing on markets.

Cleveland Fed President Loretta Mester and St. Louis Fed President James Bullard both indicated that they would consider a 50 bp lift of the Fed funds target rate at the meeting in late March.

Although Treasury yields dipped slightly on Friday, they finished last week notably higher.

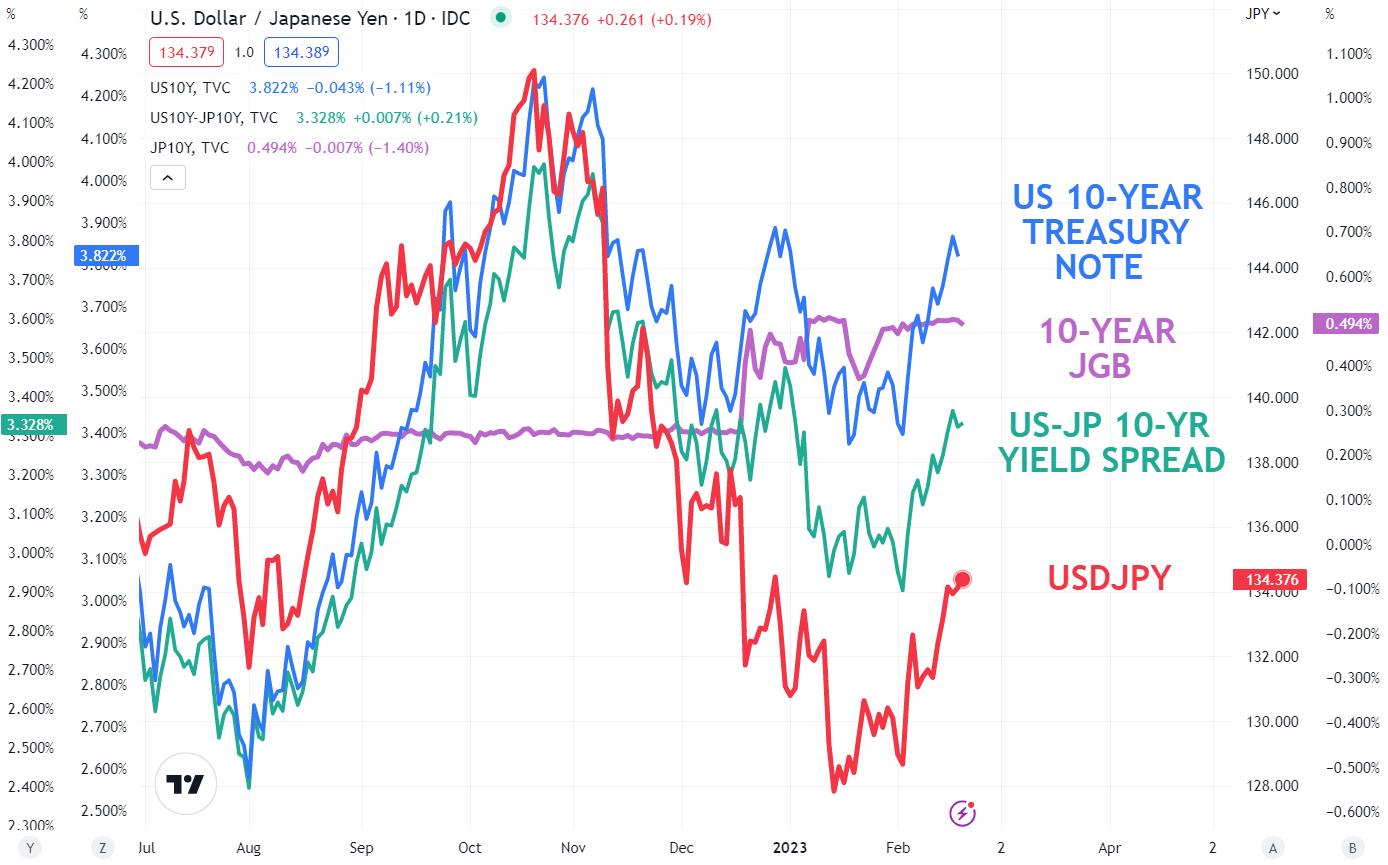
The benchmark 10-year note is trading back above 3.80% at the same time that the 10-year Japanese Government Bond (JGB) remains anchored at 0.50% due to the Bank of Japan (BoJ) exercising Yield Curve Control (YCC).

The question lingers of where the BoJ monetary policy headed after the appointment of Kazuo Ueda to be the new Governor of the Bank of Japan (BoJ). He replaces Haruhiko Kuroda, and he will appear before the Diet (Japanese government lower house) this Friday.

If the policy is overhauled, it might have significant ramifications for USD/JPY with the relationship to yields being apparent in the chart below.

If Japanese yields start heading north, it could have a considerable impact on the exchange rate.

USD/JPY, US-JAPAN 10-YEAR YIELDS

image1.png

USD/JPY TECHNICAL ANALYSIS

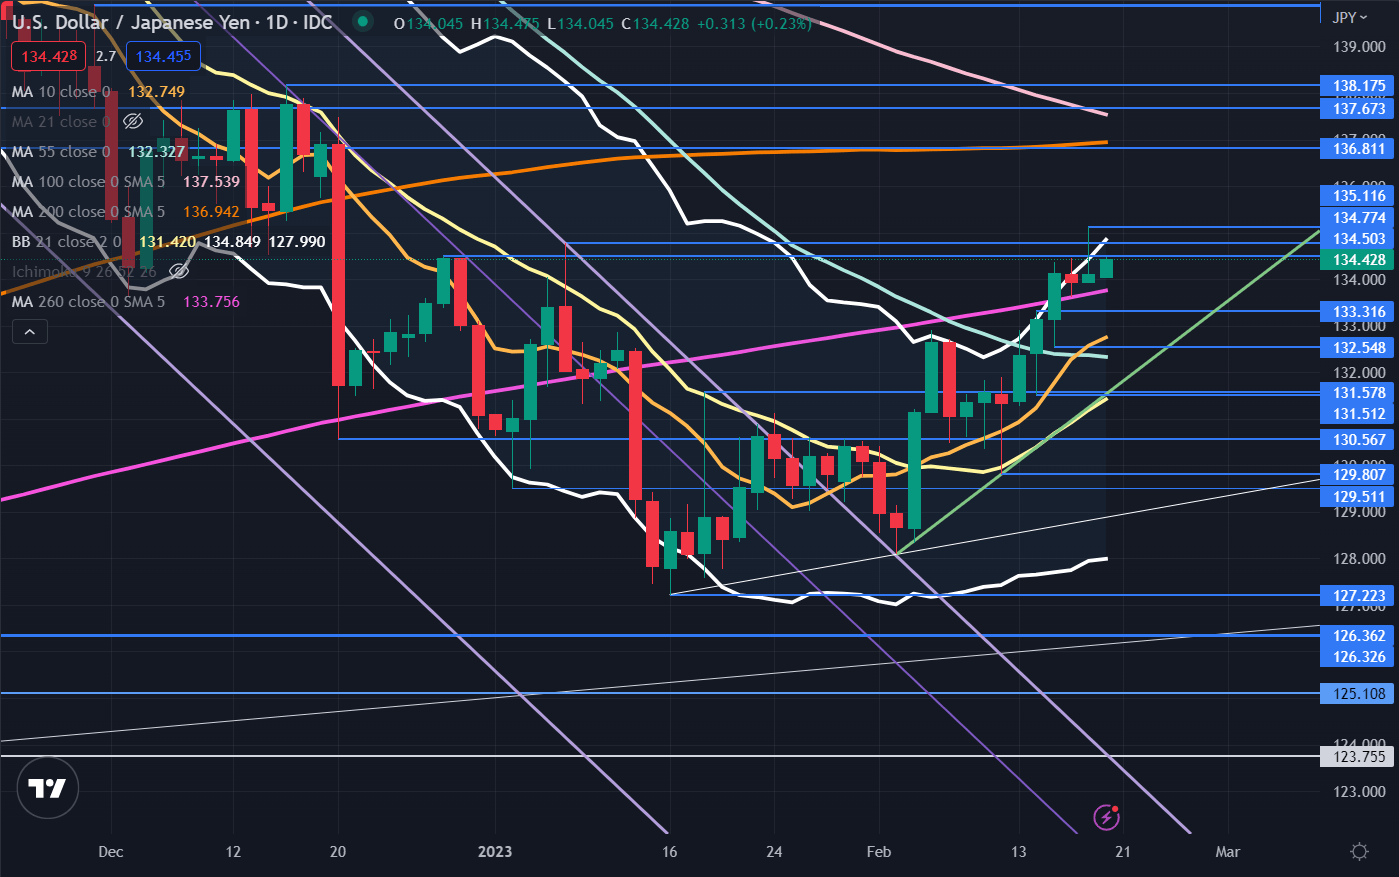
USD/JPY traded above the upper band of the 21-day Simple Moving Average (SMA) based Bollinger Band last week and then closed back inside. This might indicate a pause in the rally or a potential reversal.

The move-up tried to break above two breakpoint resistance levels at 134.50 and 134.77 but was unable to hold the high ground after making a peak of 135.12. These levels may provide resistance.

Further up, resistance could be in the 136.80 – 137.67 area with a breakpoint, prior high and the 100- and 200-day SMAs in this zone.

There appear to be mixed momentum signals for now with the price above the 10-, 21-, 55 and 260-day SMAs but below the 100- and 200-day SMAs. This might signal a range trading environment until there is a clear break above or below all period SMAs.

On the downside, support may lie at the breakpoints and previous lows of 133.31, 132.55, 131.58, 131.51, 130.57 and 129.80.

image2.png


EUR/USD Price Setup: A Bit More Downside Within a Broader Consolidation?

EUR/USD Price Setup: A Bit More Downside Within a Broader Consolidation?

EUR/USD SHORT-TERM TECHNICAL FORECAST – NEUTRAL

The Euro’s drop below key support against the US dollar spells some more troubles for the single currency ahead of key US data this week.

image1.png


EUR/USD’s drop over the past couple of weeks has almost entirely been a US strength story, rather than a Euro area weakness narrative. The US Economic Surprise Index (ESI) has risen sharply during the period, while the Euro area ESI has been largely flat, but still around 20-month highs.

EUR/USD Daily Chart

image2.png

Surprisingly strong US data since the start of the month (from services and jobs data at the beginning of the month to PPI last Thursday) had led to a reassessment of Fed rate expectations. Markets now expect the Fed funds rate to peak around 5.30% from around 4.90% at the beginning of February, while expectations for rate cuts for later this year have been scaled back. The key focus is now on US core PCE data due Friday, which is seen rising 4.3% on-year Vs 4.3% previously.

EUR/USD Daily Chart

image3.png

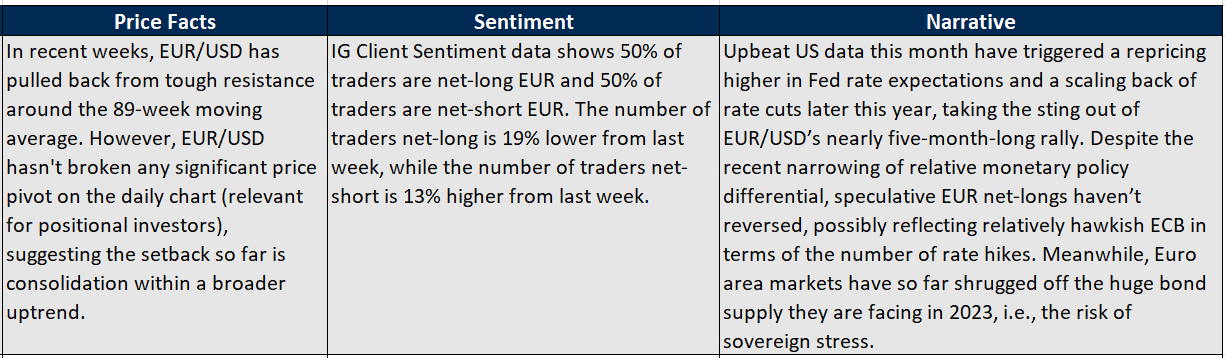
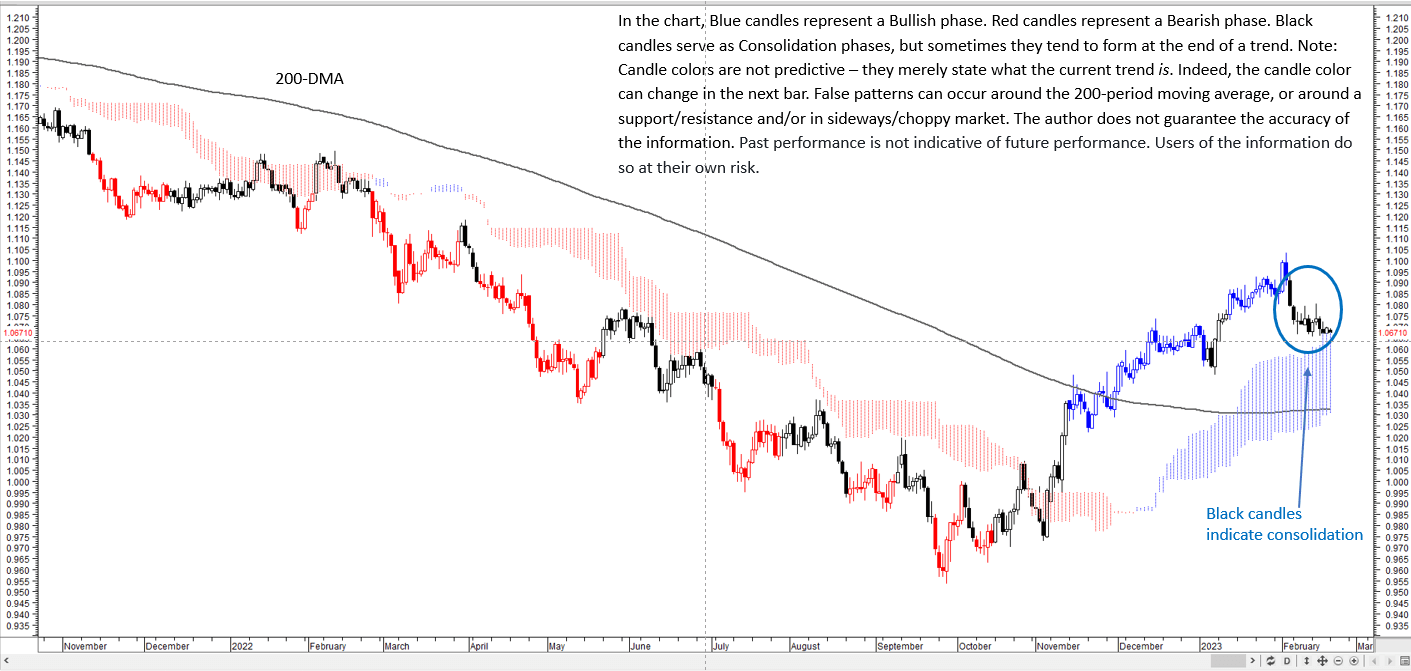
On the daily technical charts, relevant for positional investors, the color-coded candles based on trending/momentum indicators suggest that the consolidation within the broader uptrend continues (see “EUR/USD Technical Outlook: Short-term Setback”, published Feb. 6).

EUR/USD 4-Hour Chart

image4.png

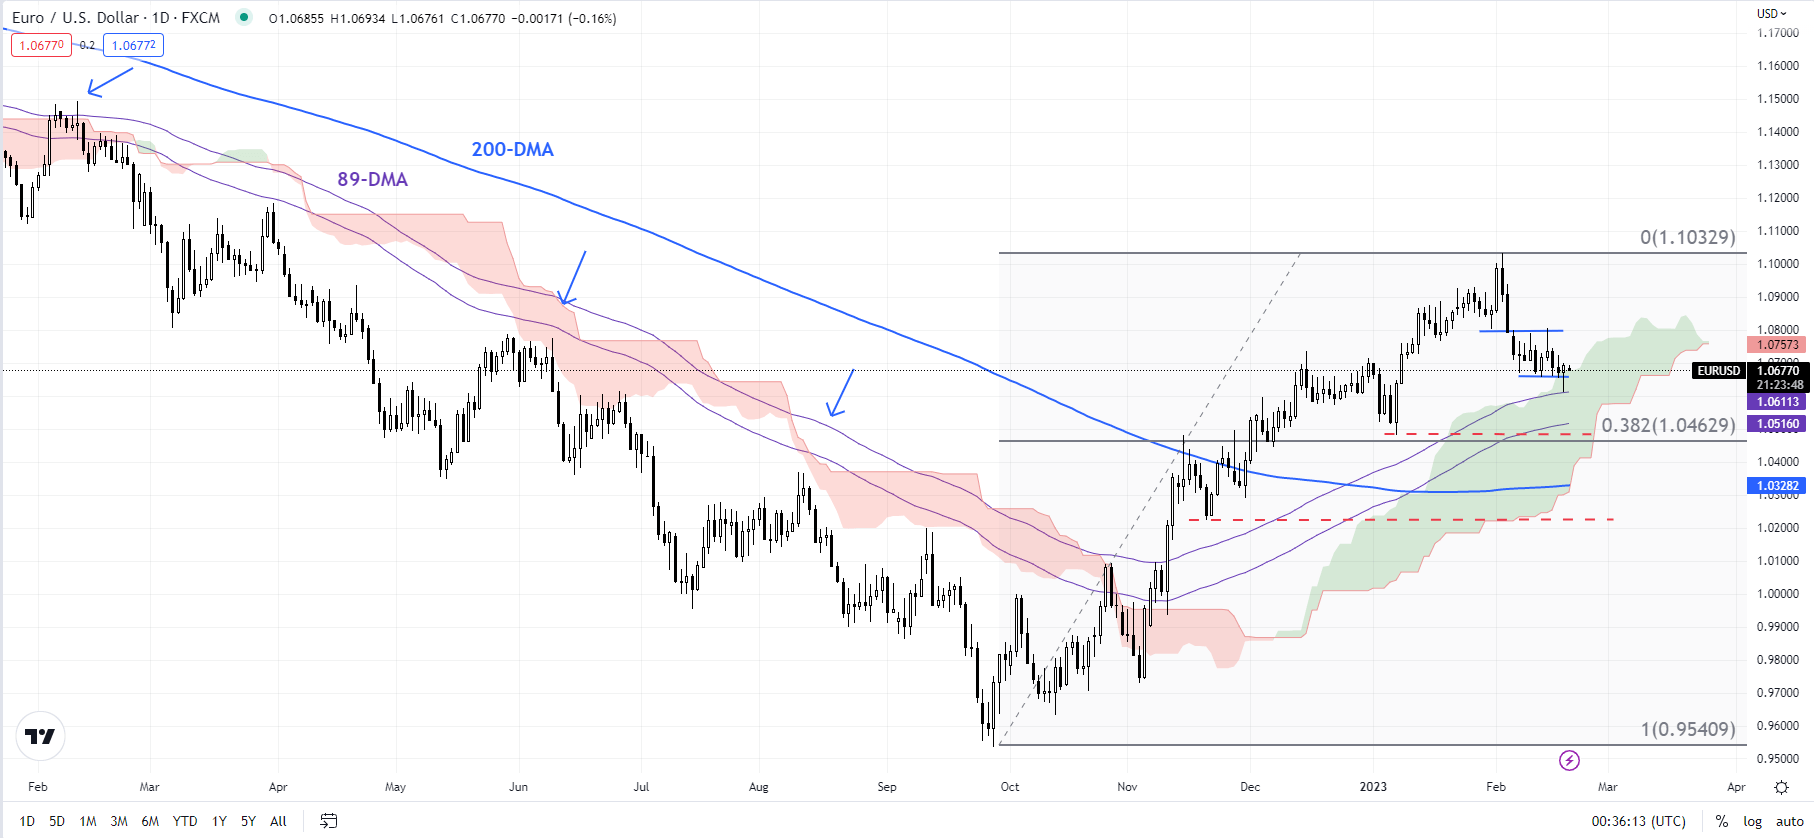
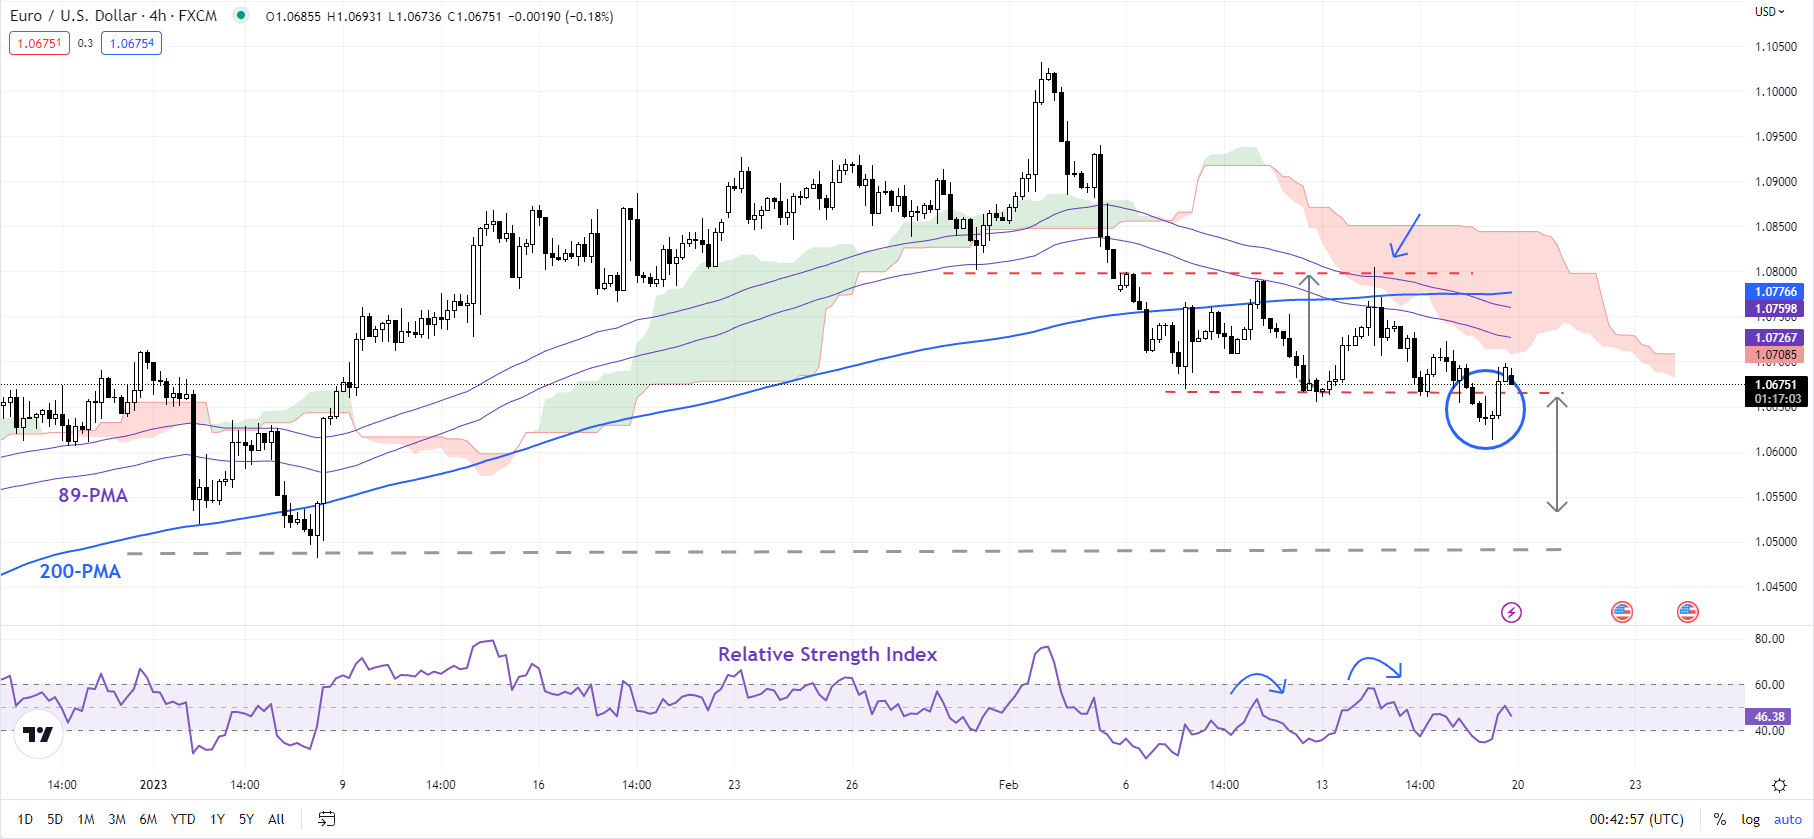
EUR/USD hasn’t yet broken any significant price pivot that would threaten the nearly five-month-long uptrend. In this regard, the January low of 1.0480 is immediate support. A stronger cushion is on the 200-day moving average (now at about 1.0330). The fall below the February 13 low of 1.0650 has triggered a minor double top (the February 9 and February 14 highs), pointing to a setback toward 1.0480.

US Dollar Holds Gains as Markets Weigh Fed Moves. Will Yields Boost USD?

US Dollar Holds Gains as Markets Weigh Fed Moves. Will Yields Boost USD?

The US Dollar has started the week slightly firmer as the markets contemplate a Federal Reserve turning more hawkish at their Federal Open Market Committee (FOMC) meeting in late March.


The possibility got legs after Cleveland Fed President Loretta Mester and St. Louis Fed President James Bullard made hawkish comments last week.

They both indicated that they would consider a 50 bp lift of the Fed funds target rate at the next meeting. While Ms Mester is on the board, she is currently a non-voting member.

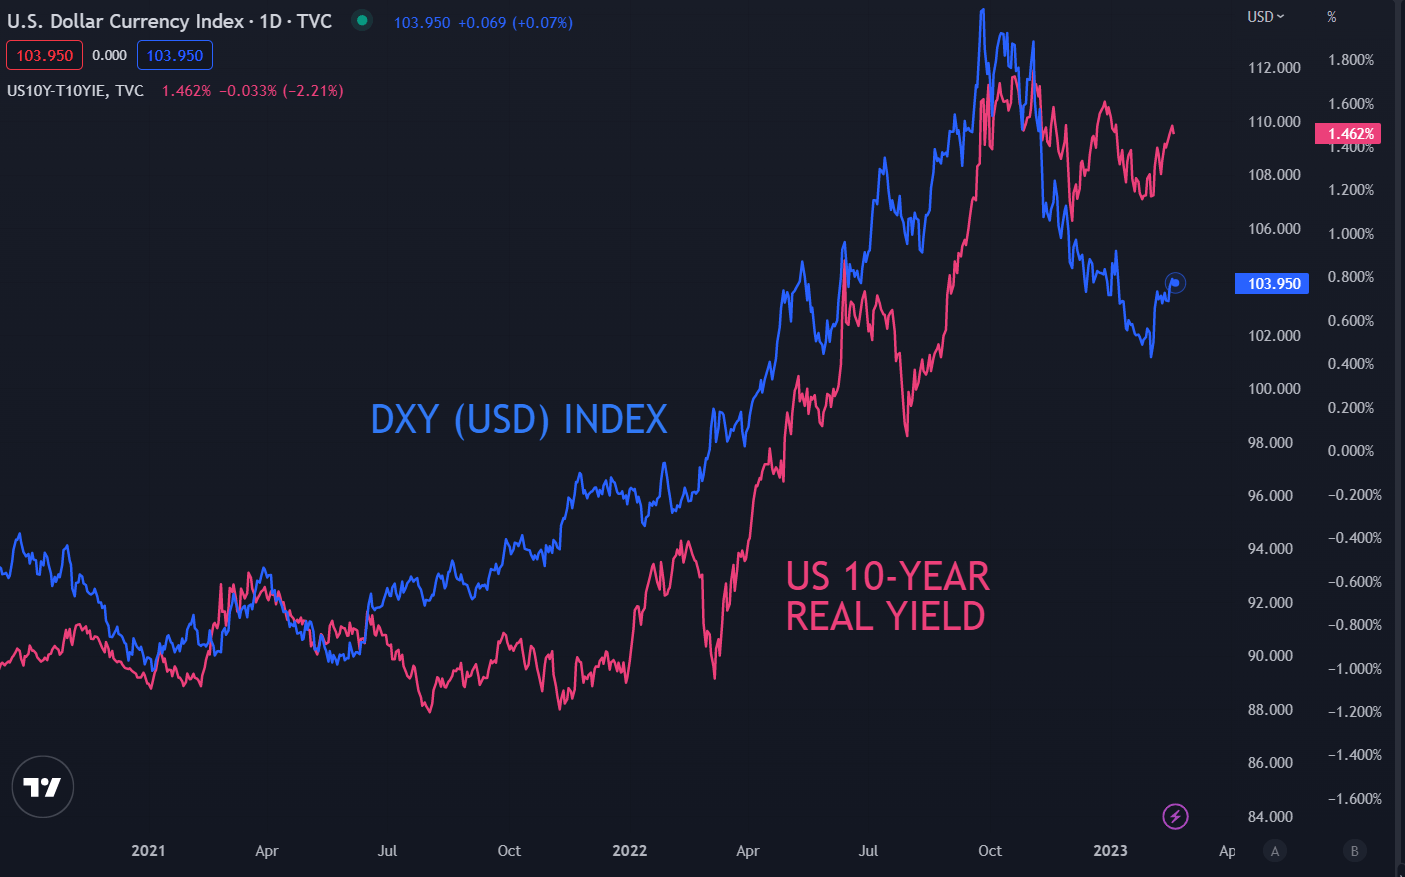
This saw Treasury yields move north into the end of last week and although the US bond market is closed today, the increase in real yields appears to be underpinning the US Dollar.

Real yields are the nominal Treasury yield minus the market-priced inflation rate derived from the Treasury Inflation Protected Security (TIPS) over the same period.

If the Fed decides to go with 50 bp moves, this would be a surprise to markets as the swaps and futures markets are both currently pricing in 25 bp at the next two FOMC gatherings.

The European Central Bank has indicated that they will be moving by 50 bp at their next meeting but their cash rate is more than 200 bp below the Fed.

Geopolitical tensions in the APAC region continue with North Korea firing 2 missiles over the Japan Sea on the weekend. This was followed by the US and South Korea performing combined military exercises today and then 3 more missiles were fired by North Korea on Monday.

This comes on the back of simmering US-China relations after the balloon saga of last week. This has contributed toward a broader concern for risk assets although APAC equities were mixed today.

Australian and Japanese stock indices are fairly flat while China and Hong notched modest gains.

A notable underperformer today has been New Zealand’s S&P/NZX 50 Index which is down over 1%. The cost of cyclone Gabrielle and the prospect of the Reserve Bank of New Zealand (RBNZ) hiking by 50 bp to 4.75% on Wednesday appear to be dragging it lower.

Crude oil prices eked out small gains with the WTI futures contract pressing toward US$ 77 bbl while the Brent contract is having a look above US$ 83.50 bbl. Gold is steady, trading near US$ 1,842 at the time of writing.

Looking ahead, it could be a quiet day with the US on holiday and aside from EU consumer confidence, there is little in the way of data.

Later in the week, FOMC meeting minutes will be released on Wednesday and the Fed’s preferred inflation gauge of Core PCE will be out on Thursday as well as some 4Q US GDP figures.

DXY (USD) INDEX AGAINST US 10-YEAR REAL YIELD

image1.png


China holds lending benchmarks for 6th month, but more easing seen

China holds lending benchmarks for 6th month, but more easing seen

SHANGHAI : China kept its benchmark lending rates unchanged for a sixth straight month in February, as expected, with the world’s second-largest economy showing more signs of recovery from a pandemic-induced slump.

A clutch of better-than-expected data recently suggests economic activity is rebounding as Beijing exited from its stringent zero-COVID strategy in December and shifted to a pro-growth policy stance.

The one-year loan prime rate (LPR) was kept at 3.65 per cent, while the five-year LPR was unchanged at 4.30 per cent.

“We expect the PBOC to stay accommodative in the first half of this year, but only through liquidity-related actions, not rate cuts,” analysts at Barclays said in a note.

“Unlike the U.S. and EU, China remains the outlier on monetary policy, with still benign inflation and recovering but still weak activity creating room for the PBOC to remain accommodative in the first half.”

In a poll of 27 market watchers, 21, or 78 per cent of all participants, predicted no change to either rate.

New bank loans in China jumped more than expected to a record 4.9 trillion yuan in January as the central bank looks to kick-start recovery while new home prices rose for the first time in a year, as Beijing stepped up support for the property sector that accounts for a quarter of the domestic economy.

Market participants also said the LPR decision was within expectations, as the People’s Bank of China (PBOC) ramped up medium-term liquidity injections, rolling over maturing policy loans last week while keeping the interest rate unchanged.

The medium-term lending facility (MLF) rate serves as a guide to the LPR and markets mostly use the medium-term rate as a precursor to any changes to the lending benchmarks.

In spite of recovering momentum, some analysts expect rates will ease after China’s annual parliamentary gathering in March, when the government announces key growth targets for the year.

“We think the PBOC may cut the MLF rate and banks will subsequently reduce the LPRs as early as March following the annual session of the National People’s Congress which is scheduled to begin on March 5,” said Tommy Wu, senior economist at Commerzbank.

“Macro policy stimulus will likely be announced during the annual session, and it will be a good timing for the PBOC to cut rates and signal that it stands ready to support the economic recovery.”

Tommy Xie, head of Greater China research at OCBC Bank, agreed rates would likely be cut in the coming months.

“Easing monetary policy is likely to work hand in hand with the expansionary fiscal policy in the face of weak domestic demand. A lower interest rate will help minimise the cost of the issuance of government bonds,” Xie said, adding that lower mortgage rate could also help defuse systemic risk.

The LPR, which banks normally charge their best clients, is set by 18 designated commercial banks who submit proposed rates to the central bank every month.

Most new and outstanding loans in China are based on the one-year LPR, while the five-year rate influences the pricing of mortgages. China last cut both rates in August to boost the economy.

Hoping For an Early Fed Pivot Does Not Mean We Will Get One

Hoping For an Early Fed Pivot Does Not Mean We Will Get One

Every economic age has its dominant phrase. Think of the ‘irrational exuberance’ which then-Federal Reserve Chair Alan Greenspan fretted about during the 1990’s dot-com bubble. If that’s too far back for you, what about European Central Bank chief Mario Draghi in 2012 promising skeptical markets that he’d do ‘whatever it takes’ to save the Euro?

The buzzword of this inflation-ravaged era is more succinct. In fact, it’s just one word – ‘pivot.’

For our purposes it means the point at which the United States Federal Reserve will feel it can stop raising interest rates and begin to offer the possibility that they could start to go down.
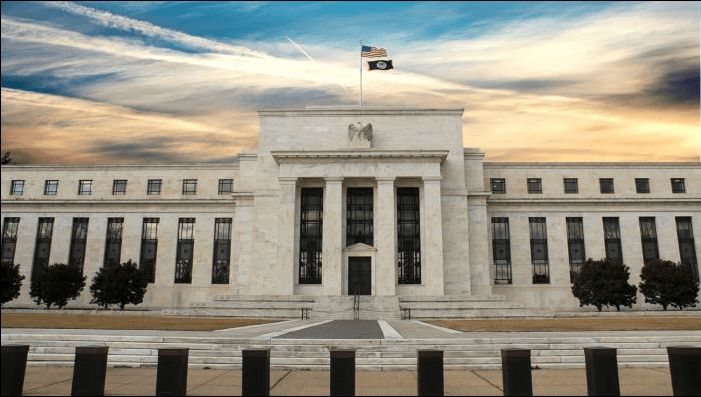
image1.pngIt’s easy to see why that word dominates. 2022 brought, among other dark things, interest rate rises unprecedented in the working lives of many people now engaged with financial markets. The US central bank has hit the monetary brakes no fewer than seven times, pushing the benchmark rate up to a target range of 4.25-4.5%. That’s the highest rate in fifteen years. Moreover, while there are clear rhetorical signs that the Fed is now more cautious about raising rates than it was back in the summer, there are equally clear signals that borrowing costs will go higher yet and that it may not top out below 5%.

Given that the Fed Funds rate spent much of the time between 2009 and 2021 barely above zero, the scale of the turnaround has been astonishing.

And given that so many market participants cut their teeth in a long era of docile inflation, cheap money and ever-flowing credit, it’s no wonder that so many should be keen that the Fed does indeed pivot as soon as possible. The thing about Golden Ages is that people always want them back.

But that doesn’t mean they come back. Of course, the key to whether or not the Fed will, in fact, pivot, will be found in the inflation data. And the picture there is still very unclear.

Boosted by a number of factors, from the war in Ukraine through to Covid’s supply-chain havoc and a general rethink of the previously dominant trend toward ever-more globalization, prices surged in 2022 by measures not seen for fully 40 years. The US was not alone in facing this gale, of course. Other countries did so too, and some had it a lot worse. Inflation has run hotter in Europe thanks among other factors to its energy dependence on Russia.

Even Japan has seen a resurgence of pricing power, where inflation has been thought dead for decades.
 

image2.pngBut the US still runs the table, and it’s the success of the US response which will matter most. And there are some encouraging signs. The Fed’s preferred measure of inflation continued to slacken in November, providing another indicator that price pressures may indeed have peaked earlier in the year.

The Personal Consumption Expenditures price index, or PCE, rose 5.5% on the year, well below the 6.1% rise seen just a month earlier. The core measure, which cuts out the volatile effects of food and energy costs, was up by a more reassuring 4.7% annualized. Both readings were at their lowest since October 2021.

The release chimes with official Consumer Price Index data for the same month, which showed a similar slackening.

Nevertheless, price rises there still stand at 7.1%, which is a very long way indeed from the 2% rate targeted by the Fed. Moreover, the US central bank’s mandate is to promote stable prices and maximum employment. There may not be many active in the markets today who remember the inflationary pressures of the 1970s and early 1980s. However, there will be many in the Fed who do remember them, and how hard-won the victory was. The monetarist students at the US central bank will be only too aware that they can’t afford to end the rate rising process until inflation – and as importantly, inflation expectations – have been actually and obviously seen to be crushed.

Hence, we see things like stocks falling despite robust Gross Domestic Product numbers. Investors are seeing everything through the inflation prism, and any sign that the Fed’s action has yet to clearly cool economic activity just has investors ever-more convinced that the pivot is not here yet.

5.5% inflation may be better than 6.1%, but it’s still outrunning the Fed’s target by a huge amount, and there’s simply no way policymakers are going to stop fighting while that’s the case. Chair Jerome Powell and the rest of the Open Market Committee well know that their success in getting inflation down will define their time.

Many commentators think we might get very close to pivot territory by the late spring of next year, but in truth we’d probably have to see a marked moderation in wage momentum and, probably, employment growth. Both have remained surprisingly strong despite the Fed’s actions.

Inflation also has a nasty tendency to get sticky. Faced with rising prices, employees demand higher wages, which only add to cost pressures at a time when there’s usually little option but to pass these on again to consumers. And so on…

The upshot of all this is that it could yet be a very long time before the Fed actually does ‘pivot,’ and any prognosis that such a thing could happen in the early part of 2023 depends on evidence of a pretty rapid economic slowdown coming soon. If the economic data don’t start to support this thesis unambiguously in the early months of the year, then the waiting for the pivot could prove a much longer game than many in the markets now hope it’ll be.

One year since Russia’s invasion – Europe faces three changes as it settles into new reality

One year since Russia’s invasion – Europe faces three changes as it settles into new reality

A reality check for Europe

When Russia started its invasion of Ukraine in the early hours of Feb 24th last year, the European security order changed overnight. Media outlets showed dark images of burning buildings in Kyiv, providing a very unpleasant reminder for Europeans that a military conflict is not only a thing of the past.

Wars, as distant as they have been to an average European for long, cause massive losses on human capital. Since the start of the war, more than 7,000 Ukrainian civilians have lost their lives and more than 11,000 have been injured. The war has displaced more than 14 million people. The people who are now deceased, injured, displaced or mobilised could have been productive, both for the private sector and for their country. Some of them will of course build a new life and start to work elsewhere but it will take time.

Despite the discomfort a war brings, it is also a healthy reminder. All conflicts cause massive human suffering and economic losses, but the ramifications from conflicts do not respect country borders. According to the IMF, Ukraine is estimated to have lost at least one-third of its GDP last year, while the OECD has estimated total costs from the war at USD 2.8 trillion in lost output for the global economy. That is more than ten times the size of the Ukrainian economy.

Rethinking our economic model

The losses for the global economy mostly come from higher energy and food prices, as well as disrupted supply chains. Europe now grapples with an acute energy crisis that could last for years. Before the war, 25% of the EU’s imported petroleum and 39% of the natural gas originated from Russia. By the third quarter of 2022, these shares had fallen to 14% and 15% respectively. After the EU imports ban on Russian oil entered into force in December 2022, this share has shrunk even further.

For decades, many European countries fostered close economic ties with Russia, and industries in many large European countries relied on cheap, fossil energy from Russia. The war has forced Europe to rethink; it has triggered a race to build more emission-free energy production capacity, not only in Europe but globally. The European Commission now plans an additional investment of EUR 210 billion on energy independence and security by 2027. Cutting Russian fossil fuel imports should save an additional EUR 100bn.

Dollar’s Friday Breakout Potential: EURUSD, GBPUSD, AUDUSD and USDJPY

Dollar’s Friday Breakout Potential: EURUSD, GBPUSD, AUDUSD and USDJPY

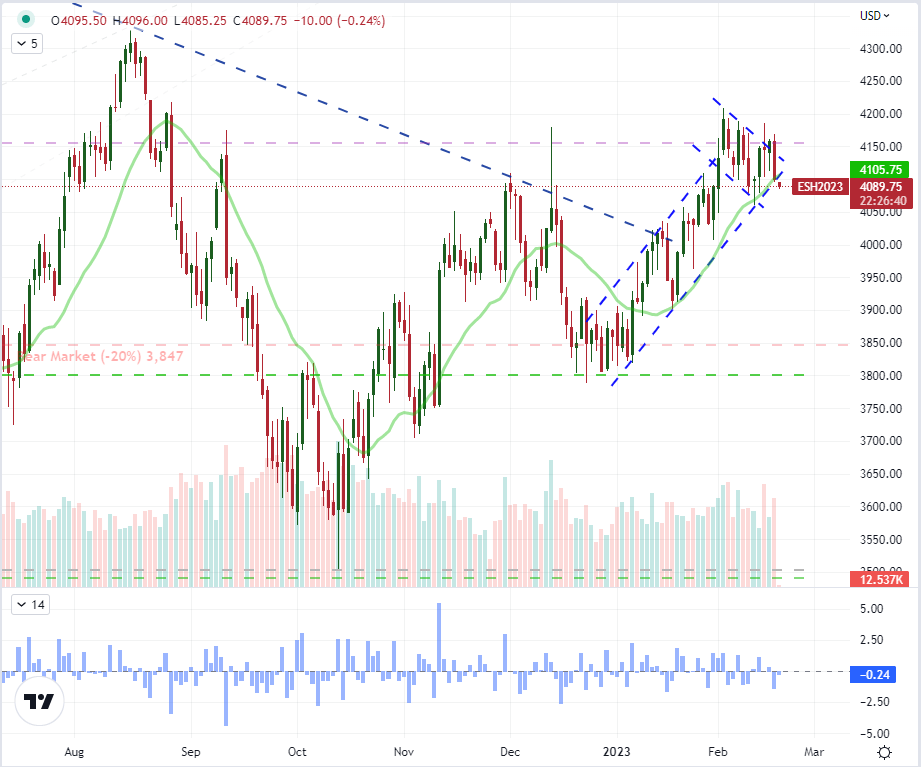
We are approaching the weekend and there is the added anticipation surrounding the extended holiday liquidity drain through Monday in US markets. Normally, this would be an occasion for the markets to simply settle into established ranges and allow any short-term premium in implied volatility gauges to simply bleed off. However, it wasn’t so long ago that we witnessed critical technical developments occur just before weekend drains which left the markets to dwell on speculative intent over entire weekends only to pick the thread back up the next week. What is the probability that we are facing yet another one of these outlier events this go around? Typically, I would say that congestion on measures like the S&P 500 (channel and wedge) or Dow Jones Industrial Average (horizontal range and triangle) are readily observed patterns and the VIX still in the lower 10th percentile of its past year’s range is presents a higher probability of the ‘path of least resistance’ outcome. On the other hand, there is some provocative testing on the charts – such as the S&P 500 emini futures slipping the 20-day simple moving average and channel floor pre-Tokyo trade. What’s more, the difference between scenarios carries potentially dramatically different tempos should a charge of fear show up versus a quiet settling into uncomfortable chop in bulls’ favor to end the week.

of clients are net short.
Change in Longs Shorts OI
Daily 13% -9% -1%
Weekly -8% 6% -1%
What does it mean for price action?
Get My Guide

Chart of S&P 500 Emini Futures with 20-day SMA, Volume and 1-Day Rate of Change (Daily)

image1.png

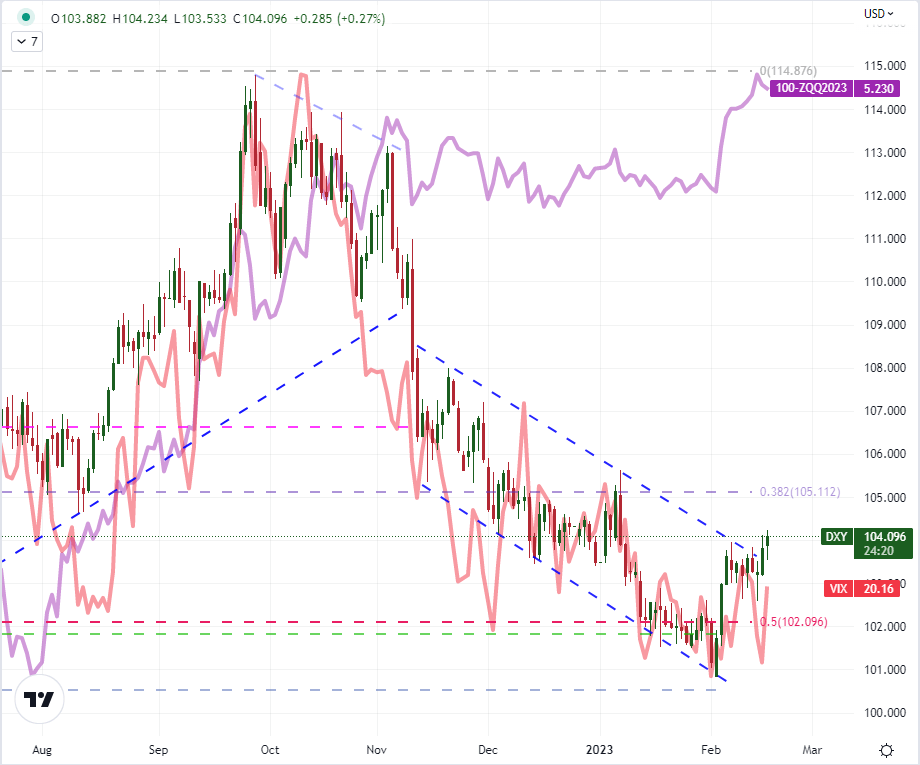
While many traders have their favorite ‘risk asset’ there tends to be far less interest in go-to safe havens. In a world that seems to promote ‘long only’ perspective with shares trading representing the most common market exposure for investors over the past century, that isn’t too surprising. However, the market movements in a ‘risk off’ scenario are far more aggressive than the typical advance. While there are assets like gold, Treasuries, money markets and others that are referenced in textbooks; the Dollar is perhaps my preferred haven asset of the moment given its ultimate liquidity and its greater current sensitivity to downdrafts in speculative assets. We’ve seen the recent swell in the DXY Dollar Index has drawn more from the fresh lift given to Fed rate expectations, but the upside on the market’s hawkish view will likely be very restricted going forward with large gaps between official updates. Alternatively, sentiment is flippant and can explode ‘out of the blue’. Should the S&P 500 bite on its tentative break during Friday exchange hours, it will likely in turn charge the VIX and give a more capable push for the Greenback.

Chart of DXY Dollar Index Overlaid with Implied Fed Funds Aug 2023 Rate, 20 and 60-Day Correl (Daily)

image2.png

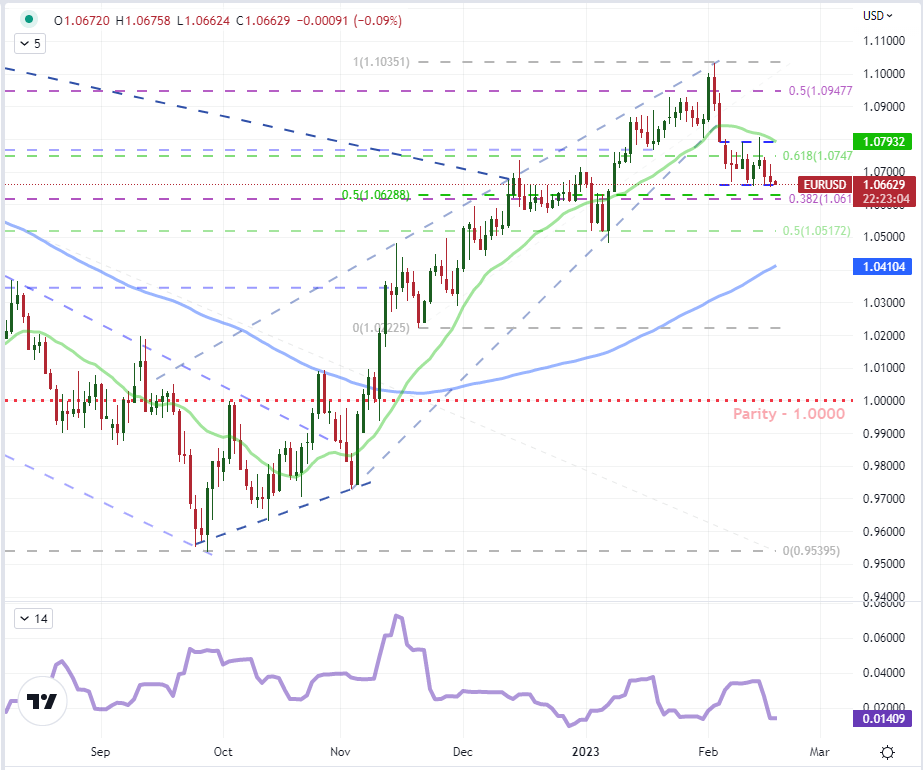
The DXY Index can be a good reference for the currency’s health, but it isn’t what most active FX traders are monitoring for making their calls on momentum. USDJPY has been of greater interest to me for this reason, and the break above 133 earlier this week was noteworthy, but a single pair – even a liquid one such as this – will not define the Dollar overall. Yet, if we see more of the ‘majors’ conform to a broader USD bid; the potential for a productive follow through will rise substantially. First and foremost, my attention is on EURUSD. The most liquid currency pair in the world bar none, we have a series of lower lows that has kept the pressure on the lower bound (roughly 1.0650) of the past two weeks. There is more technical support below this (a cluster of Fibs), but more breaks could see more capable momentum.

Chart of EURUSD with 20 and 100-Day SMAs, 10-Day Historical Range (Daily)

image3.png

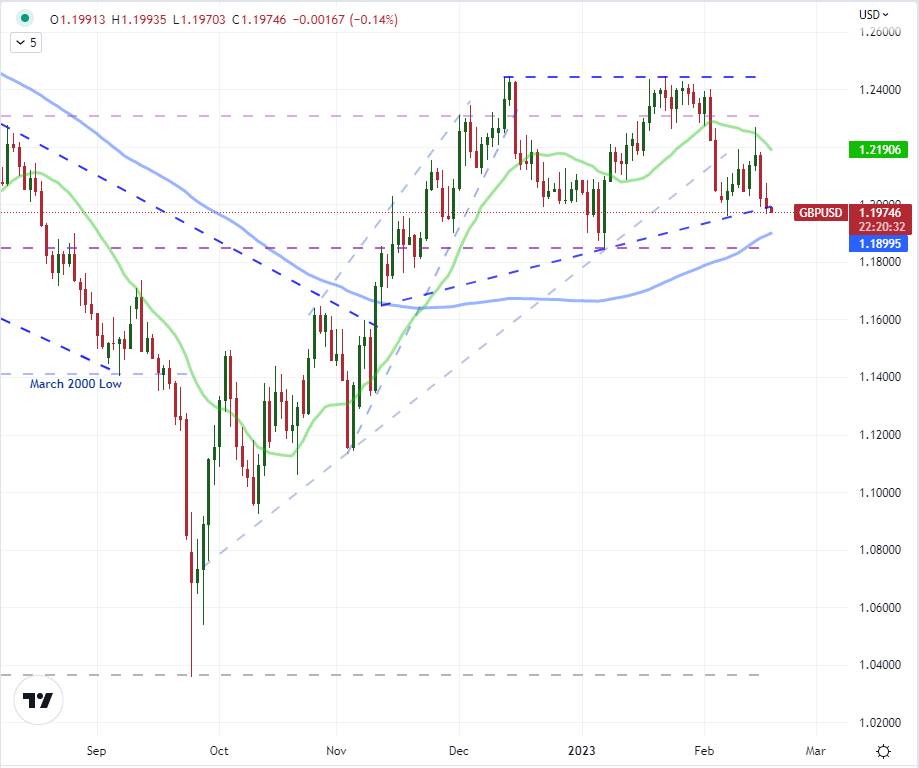
In a similar position to EURUSD, GBPUSD is entering Friday threatening a break of three-month rising triangle’s support. My trendline was at 1.2000, but the specific technical ray matters less than the build up of traction towards more bearish progress. It was remarkable that the added pressure of the UK inflation earlier this week – which sent many other Sterling crosses into significant movement – was curbed for the Sterling. If we take out the February low here and then move on to the 100-day SMA, it could generate a lot of heat in the broader view of the Dollar.

Chart of GBPUSD with 20 and 100-Day SMAs (Daily)

image4.png

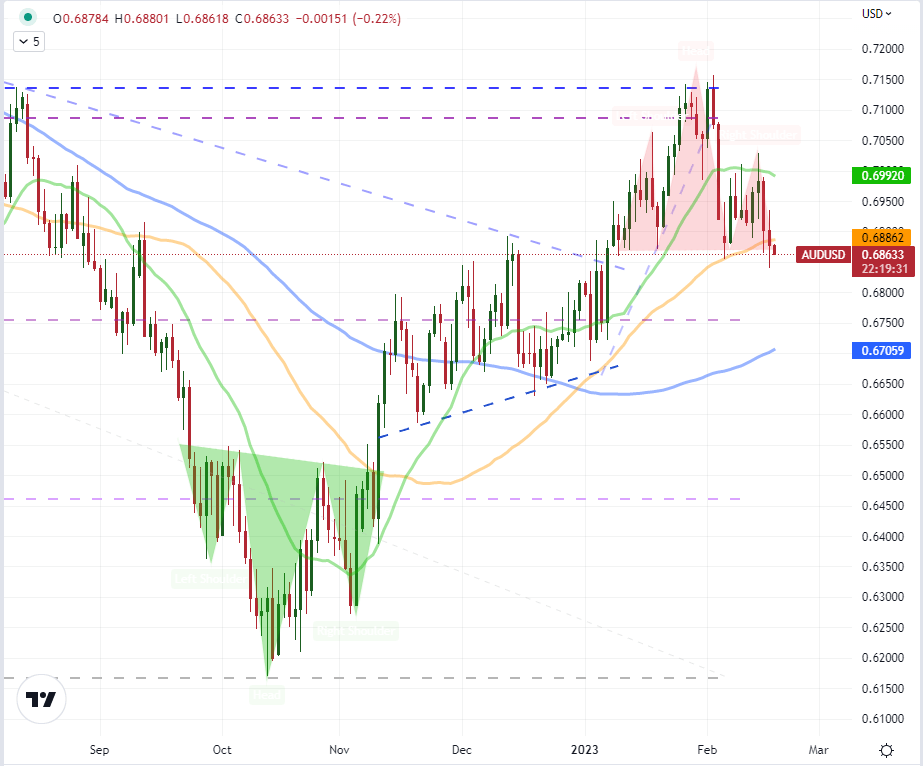
Much further down on the Bank for International Settlements’ (BIS) liquidity scale to EURUSD, USDJPY and GBPUSD is AUDUSD. This is not the type of cross that would singlehandedly motivate a commitment from the world’s largest currency. Yet, I’m not looking for a leader in this instance because conditions are not simply looking for a fundamental or technical catalyst. What we are seeking is breadth in the Dollar’s move to overcome a liquidity restriction. As such, a break of the head-and-shoulders pattern here would add considerable weight to a productive Dollar end to the week.

Chart of AUDUSD with 20, 50 and 100-Day SMAs (Daily)

image5.png

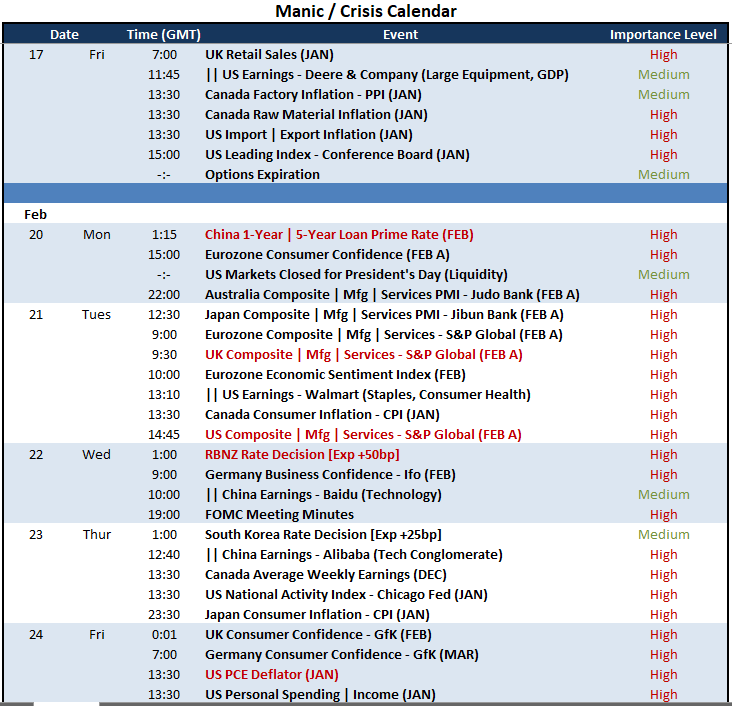
For event risk, I believe that any volatility from the market would come first and the listings we have Friday would be used as justification after the fact – this is why its important not to commit to the dogma of any one single analysis type. Nevertheless, I think US import inflation could speak to monetary policy while the Conference Board’s leading index has stood out as a ‘recession’ signal recently. The Pound will also have UK retail sales while the Loonie will pick up on upstream inflation. Then there is also the options expiration which can frequently cause distortion in ‘the roll’.

Top Global Macro Economic Event Risk for Friday and Next Week

image6.png