US Dollar Gains as Yields in JGB and Treasury Markets Rise. Where to for USD?

US Dollar Gains as Yields in JGB and Treasury Markets Rise. Where to for USD?

The US Dollar has found strength to start the week against most major currency pairs except for the Aussie and Kiwi Dollars after some firm Chinese PMI data.

image1.png

The market tends to place more emphasis on manufacturing PMI due to the wider implications for economic activity. Some economists had been anticipating a print below 49.0.

A rosier outlook for China led to some growth-linked parts of the region getting a boost. Korea’s KOSDAQ and the Hang Seng China Enterprise indices led the way, adding over 2% today. The broader Hang Seng Index (HSI) made a 3-month high.

Gold dipped lower toward US$ 1,950 on the stronger USD and crude oil also eased. The WTI futures contract is a touch above US$ 80 bbl while the Brent contract is near US$ 84.40 bbl at the time of going to print.

On Sunday, Minneapolis Federal Reserve President Neel Kashkari appeared on US television and seemed to slightly step back from his previously strongly hawkish perspective.

He said that inflation was heading in the right direction but that the labour market might have to pay the cost of bringing price pressures down. Treasury yields are up a couple of basis points across most of the curve.

The 10-year Japanese Government Bond (JGB) traded at its highest yield since 2014 above 0.60%.

The move comes hot on the heels of Friday’s Bank of Japan adjustment to yield curve control (YCC). The Bank announced an unscheduled bond-buying program today of 300 billion Yen in the 5-to-10-year part of the yield curve.

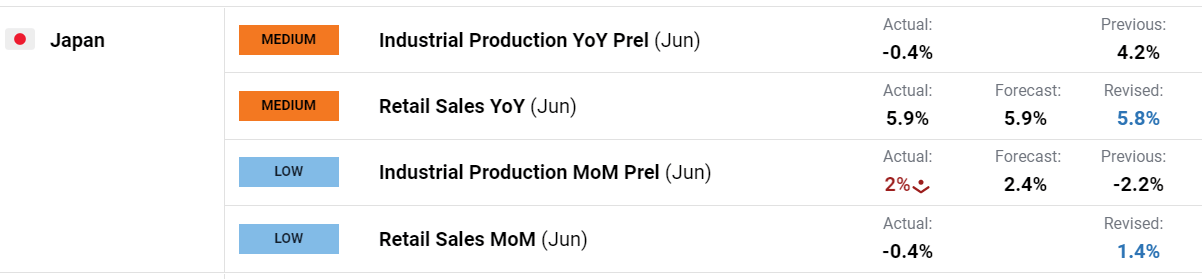
The Japanese Yen has been the biggest underperformer today with USD/JPY once again heading toward 142.00. There was mixed data out of Japan with retails sales beating forecasts while industrial production was underwhelming.

image2.png

Euro-wide GDP and CPI data will be released today. Tomorrow will see the Reserve Bank of Australia (RBA) make a decision on monetary policy ahead of the Bank of England on Thursday.

DXY (USD) INDEX TECHNICAL ANALYSIS

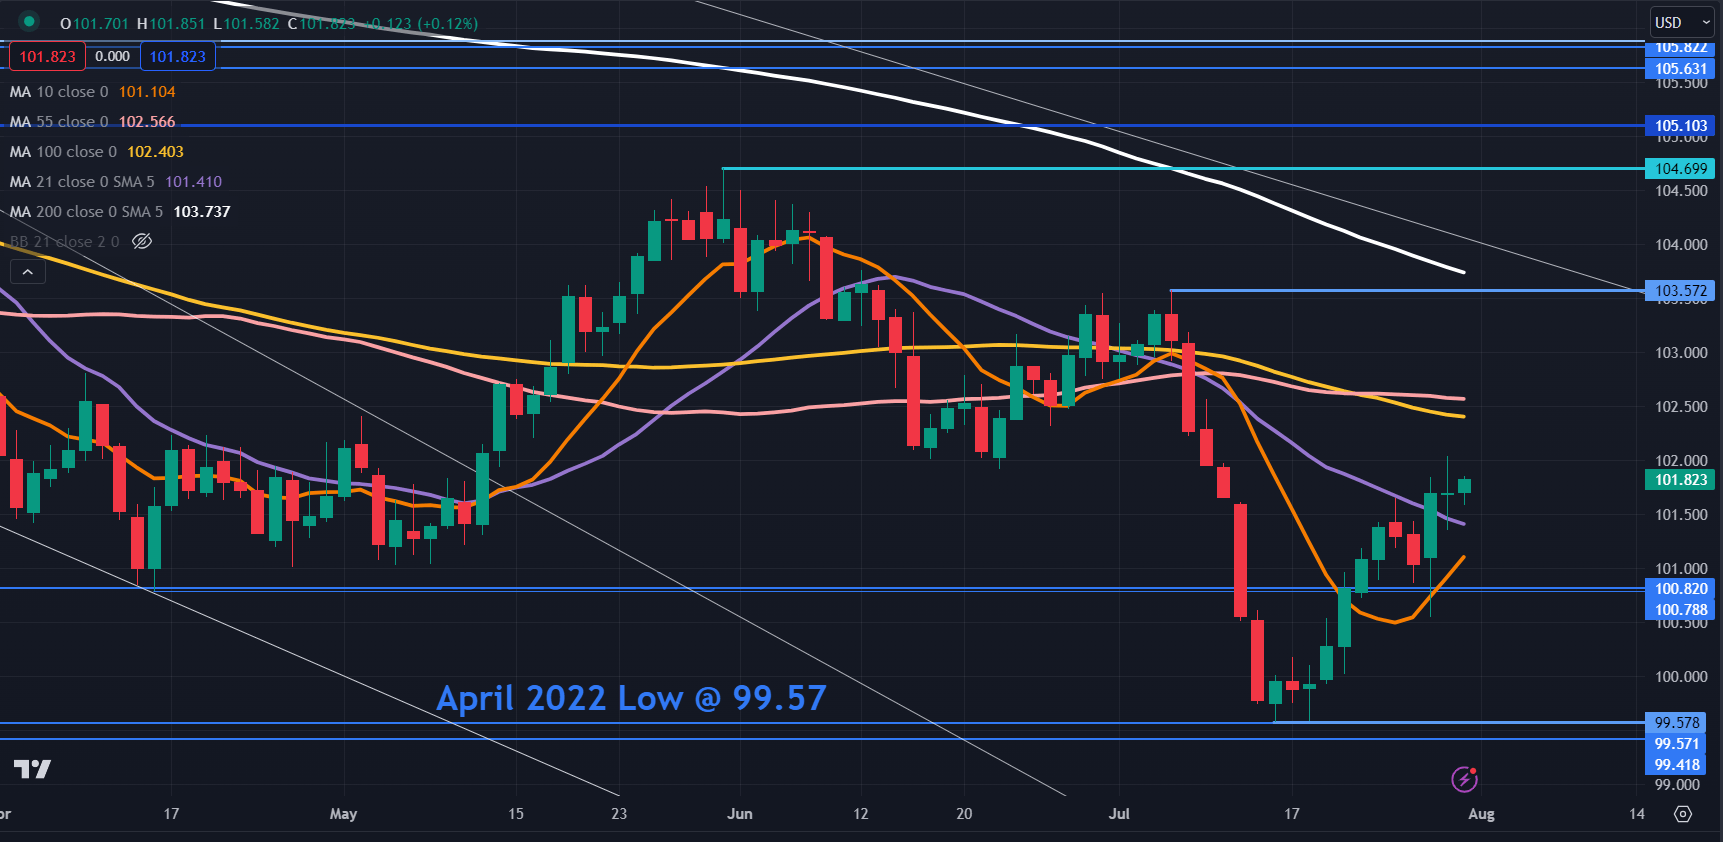
The DXY (USD) index steadied again today after making a 2-week high last Friday.

It remains above the 10- and 21-day simple moving averages (SMA) and that may indicate short-term bullish momentum could further evolve.

The next level of resistance might be at the 55- and 100-day SMAs in the 102.40 – 102.60 area. The 103.60 – 103.70 zone may also offer resistance with a prior peak and the 200-day SMA in that area.

Support could be at the breakpoint zone near 100.80 or below at the 15-month low of 99.58 which was just above the April 2022 low of 99.57.

image3.png


Japanese Yen After YCC Tweak; Has the Trend Changed in USD/JPY, AUD/JPY, EUR/JPY?

Japanese Yen After YCC Tweak; Has the Trend Changed in USD/JPY, AUD/JPY, EUR/JPY?

At its meeting on Friday, the BOJ maintained the band around the JGB 10-year yield of +- 0.5% with the yield target of around 0%. However, the Japanese central bank adjusted the rate at which it offers the fixed-rate purchase operations for consecutive days, from 0.5% to 1.0%, effectively signaling its willingness to allow the JGB 10-year yield to rise temporarily above the 0.5% upper bound. For more discussion see “Japanese Yen Drops as BOJ Keeps Policy Unchanged: What’s Next for USD/JPY?”, published July 28.

With BOJ committed to keep broader policy settings unhanged until it achieves 2% inflation target in a stable and sustained manner, the sharp rebound in USD/JPY suggests the YCC tweak is probably not viewed as a monetary tightening signal but managing the yield curve framework sustainably amid an environment of rising global yields.

USD/JPY Daily Chart

image1.png

USD/JPY: Testing the top end of the recent range

On technical charts, USD/JPY is holding above vital converged cushion at the mid-July low of 137.25, roughly coinciding with the lower edge of the Ichimoku cloud on the daily charts. While this support remains intact, the early-July slide can be viewed as consolidation within the interim uptrend (since the start of the year) at best.

USD/JPY 240-minute Chart

image2.png

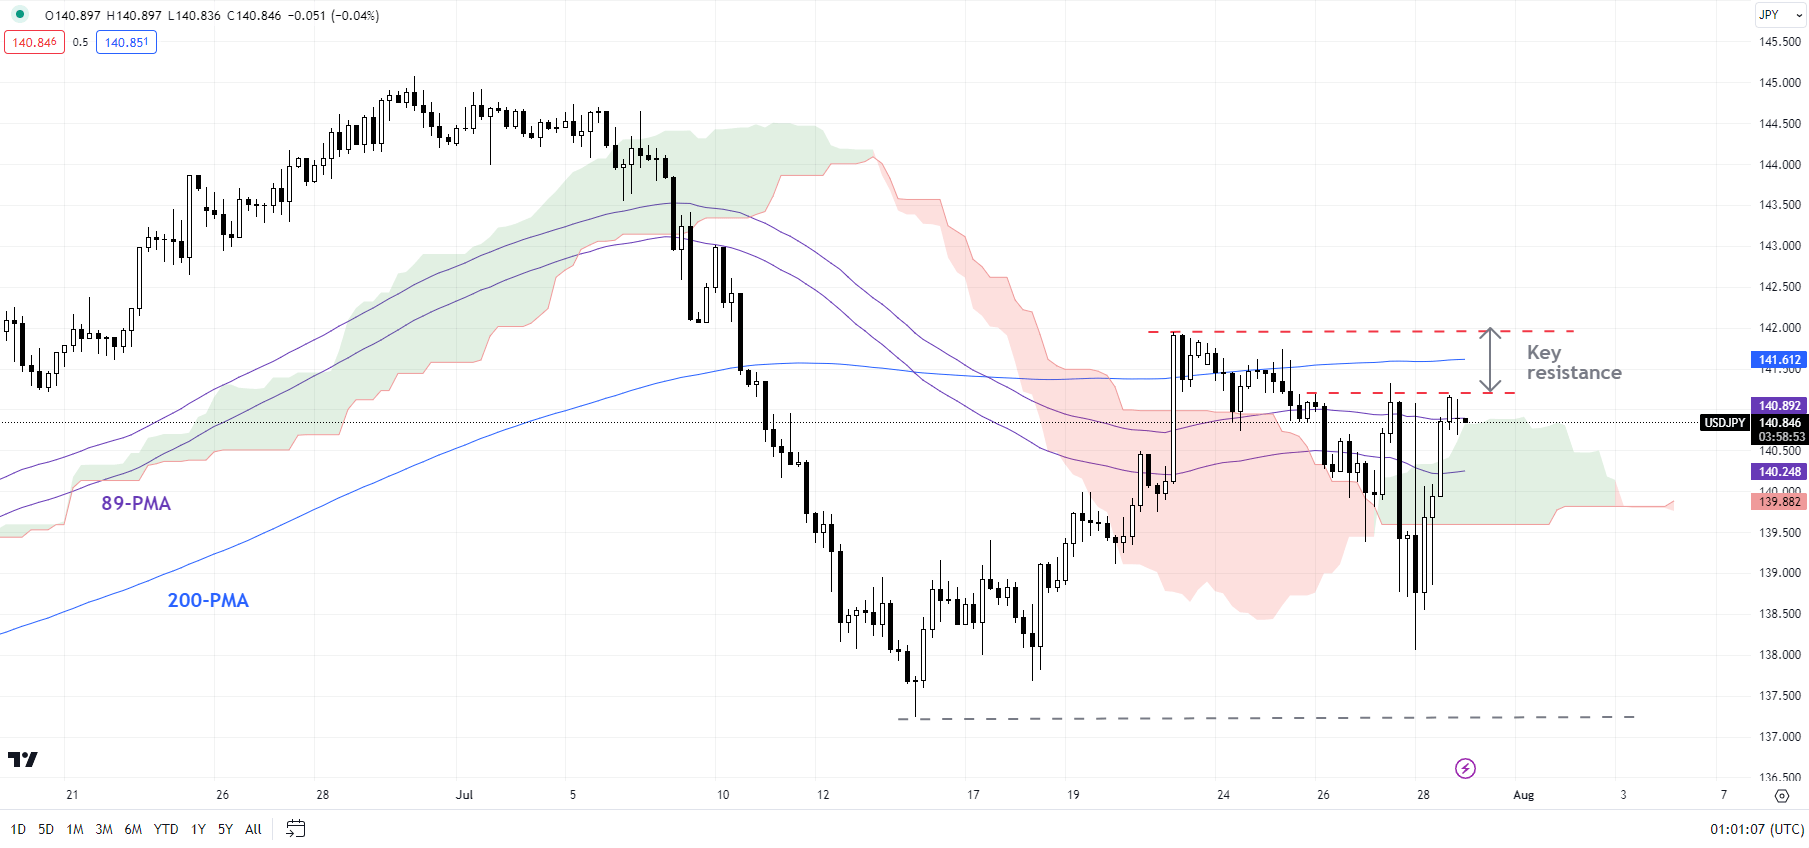
On the 4-hourly chart, USD/JPY is so far holding above a crucial barrier at 141.50-142.00, including the 200-period moving average and the July 21 high of 142.00. USD/JPY needs to clear this resistance for the seven-month-long uptrend to remain intact.

AUD/JPY 240-Minute Chart

image3.png

AUD/JPY: Rebounds from key support

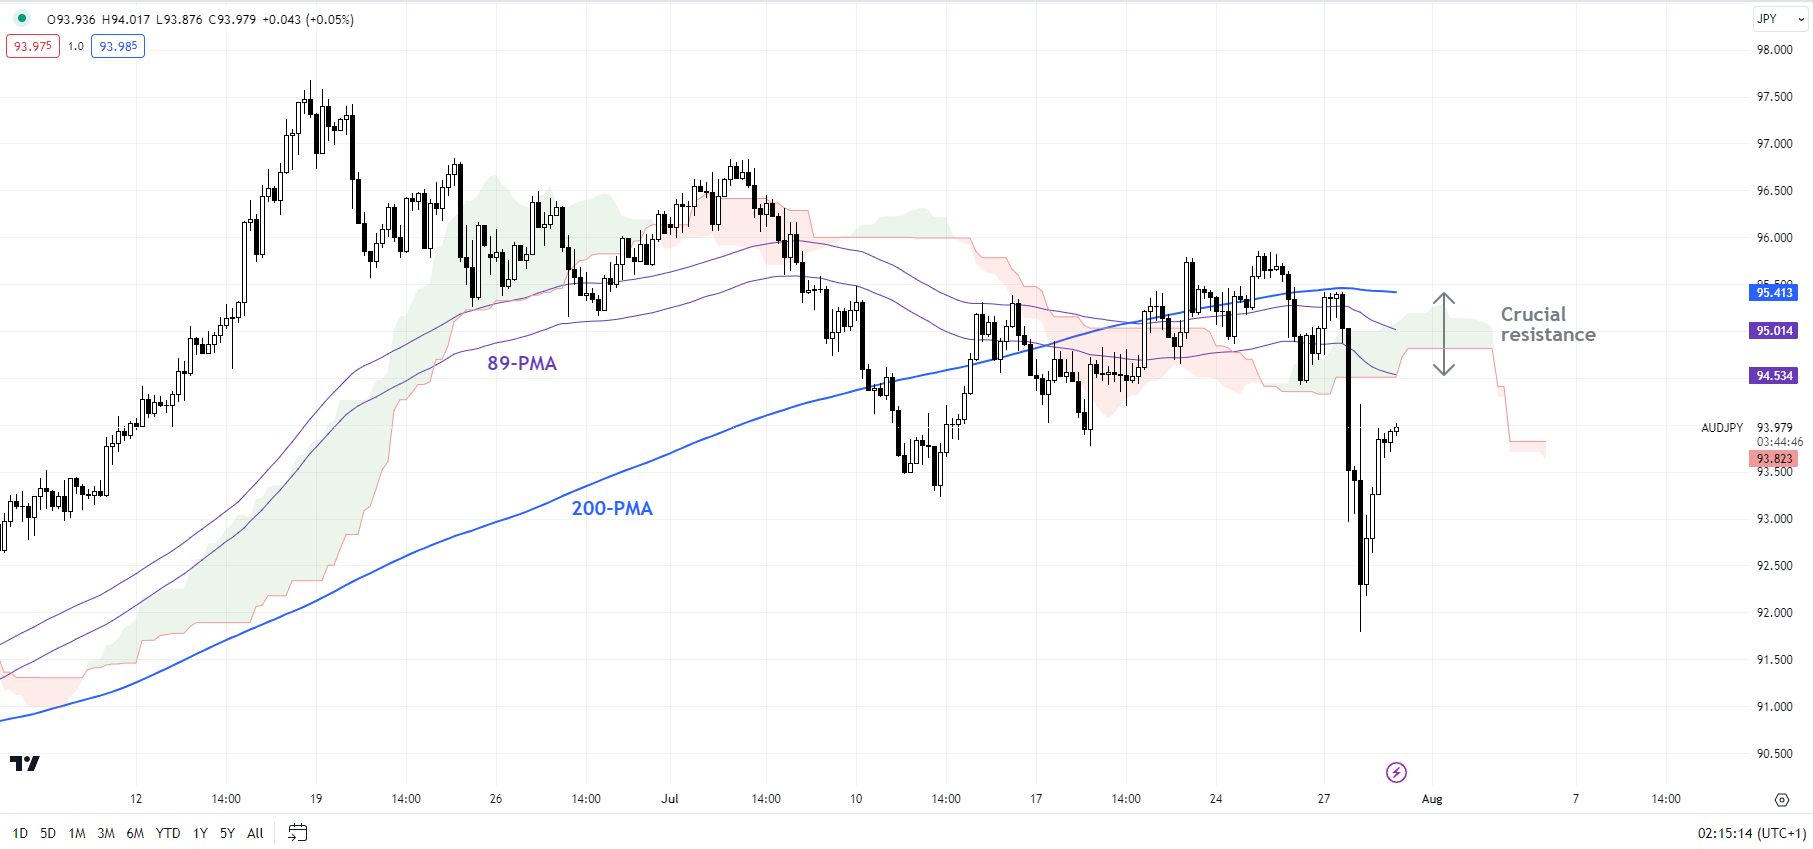
The lower-top-lower-bottom sequence since late June indicates that the near-term bias for AUD/JPY is down. For the immediate downtrend to reverse, AUD/JPY needs to rise above the stiff ceiling at 95.50-96.00, including the 200-period moving average on the 4-hour chart, and the last week’s high of 96.00. Until then, the rebound from Friday looks corrective at best.

EUR/JPY 240-Minute Chart

image4.png

EUR/JPY: Watch resistance

EUR/JPY has now run into a tough barrier at 156.00-157.00, including the last week’s high of 156.25 and the upper edge of the Ichimoku cloud on the 240-minute charts. A rise above the resistance area would reaffirm the near-term trend to range, prevailing since late June.

GBP Price Forecast: Pound Readies for BoE

GBP Price Forecast: Pound Readies for BoE

GBPUSD & EURGBP FUNDAMENTAL BACKDROP

The British pound is bid this Monday morning as markets prepare for the Bank of England (BoE) to raise interest rates later this week. Current money market pricing (refer to table below) shows that there is a 68% probability of a 25bps hike. There has been some underwhelming UK specific data concerning economic growth within the region while recent CPI data has revealed both headline and core inflation moderating, which leads me to favor current expectations.

BANK OF ENGLAND INTEREST RATE PROBABILITIES

image1.png

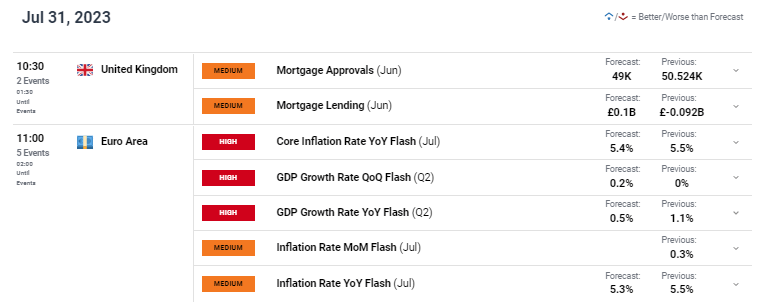
The rest of the trading day includes UK mortgage that are expected to remain subdued due to the aggressive monetary policy action by the central bank with focus on eurozone core inflation and GDP flash releases respectively (see economic calendar). ECB President Christine Lagarde reiterated that the ECB may still hike rates going forward if data warrants such action after citing Spanish, French and German GDP as “encouraging”.

From a US dollar perspective, the greenback has remained relatively elevated considering Friday’s core PCE figures. The buoyancy is as a result of a ‘soft landing’ with recessionary fears being limited; however, the week’s upcoming data (ISM services PMI and Non-Farm Payrolls (NFP)) will be closely monitored to see whether or not these key metrics corroborate the more dovish narrative being adhered to at present.

GBP/USD ECONOMIC CALENDAR (GMT +02:00)

image2.png

TECHNICAL ANALYSIS

GBP/USD DAILY CHART

image3.png

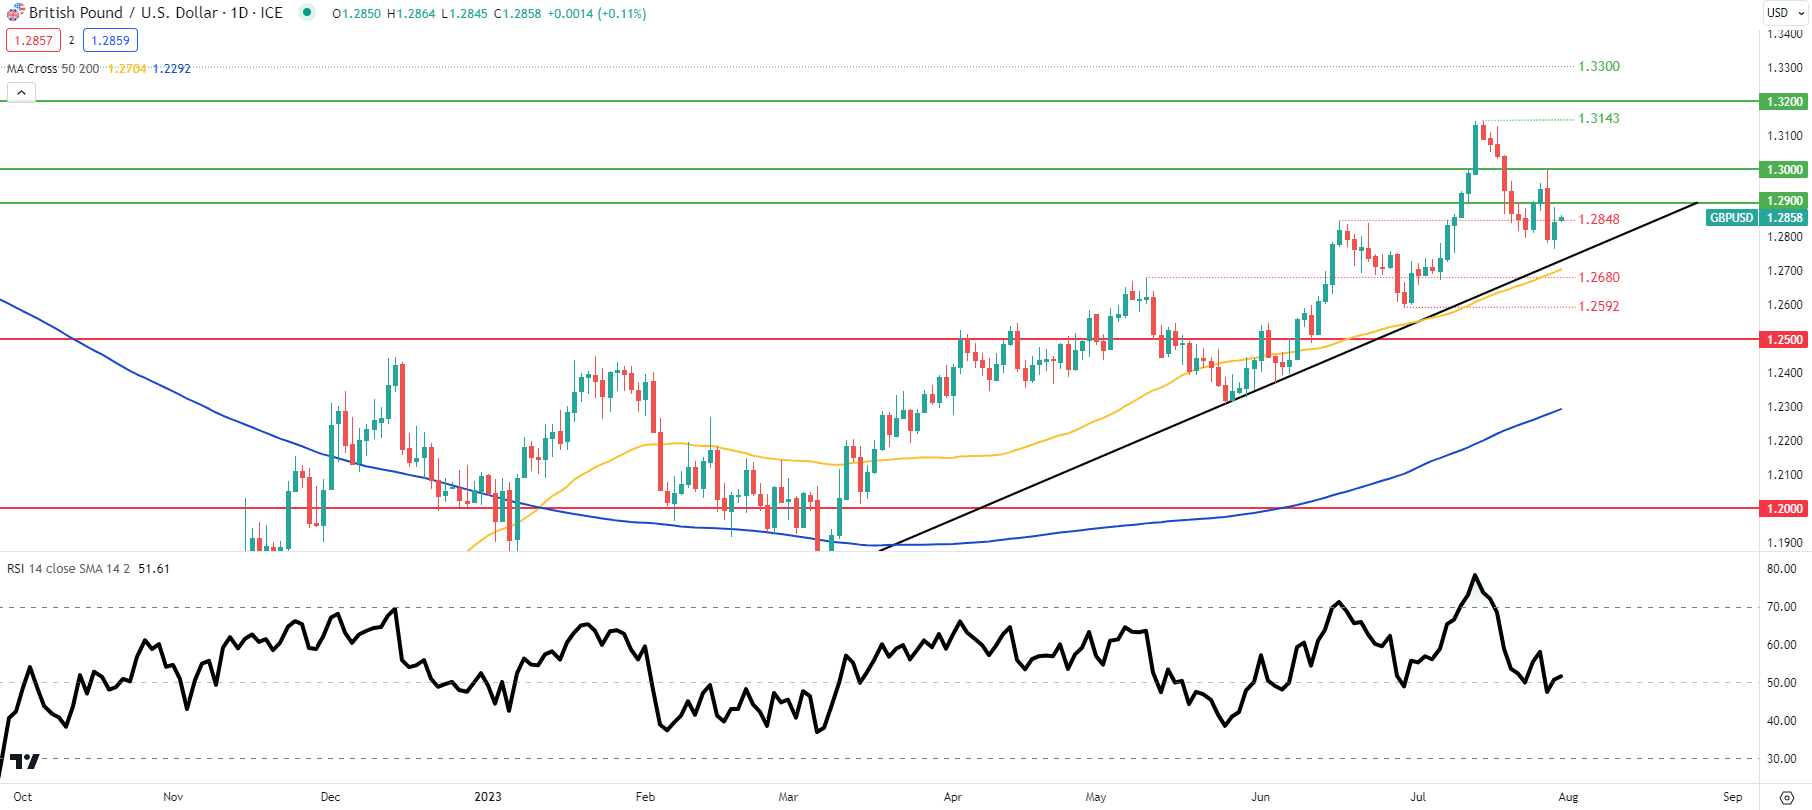
Price action on the daily cable chart above keeps the pair around the 1.2848 swing support handle while the Relative Strength Index (RSI) remains around the midpoint 50 level suggesting short-term uncertainty. Fundamental factors will be the primary drivers this week so traders should practice sound risk management technique as volatility is likely to pick up.

Key resistance levels:

  • 1.3000
  • 1.2900

Key support levels:

  • 1.2848
  • Trendline support
  • 50-day MA
  • 1.2680

CAUTIOUS IG CLIENT SENTIMENT (GBP/USD)

IG Client Sentiment Data (IGCS) shows retail traders are currently net short on GBP/USD with 52% of traders holding short positions (as of this writing). At DailyFX we typically take a contrarian view to crowd sentiment but due to recent changes in long and short positioning, we arrive at a short-term mixed bias.

EUR/GBP DAILY CHART

image4.png

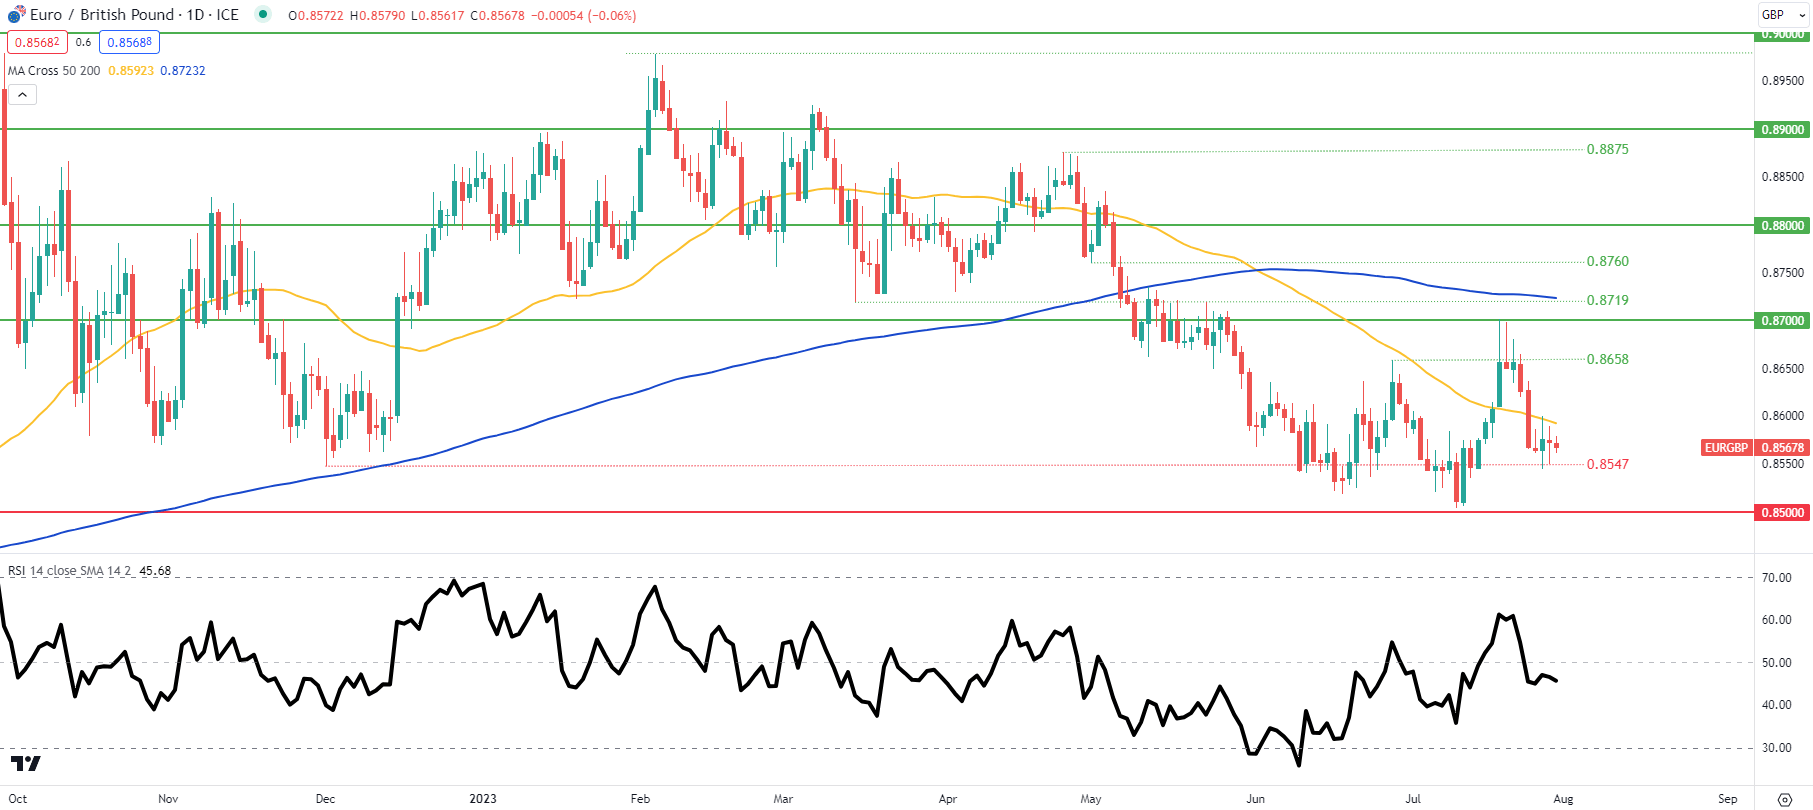
EUR/GBP reflects many of the same sentiments as GBP/USD with indecision displayed via several daily doji candlesticks and a similar RSI reading.

USD/JPY Bears Target Sub-138 on Bank of Japan YCC Policy Tweak

USD/JPY Bears Target Sub-138 on Bank of Japan YCC Policy Tweak

On Thursday, the USD/JPY fell by 0.58% to wrap up the day at 139.428. US GDP numbers for Q2 delivered support before reports of the BoJ planning to tweak its Yield Curve Control Policy sent the USD/JPY into negative territory.

This morning, Tokyo inflation numbers for July will set the tone ahead of the Bank of Japan monetary policy decision. A hotter-than-expected CPI report would support bets on a BoJ tweak from ultra-loose. Economists forecast the Tokyo annual core inflation rate to soften from 3.2% to 2.9%.

Trading Derivatives carries a high level of risk to your capital and you should only trade with money you can afford to lose. Trading Derivatives may not be suitable for all investors, so please ensure that you fully understand the risks involved, and seek independent advice if necessary. A Product Disclosure Statement (PDS) can be obtained either from this website or on request from our offices and should be considered before entering into a transaction with us. Raw Spread accounts offer spreads from 0.0 pips with a commission charge of USD $3.50 per 100k traded. Standard account offer spreads from 1 pips with no additional commission charges. Spreads on CFD indices start at 0.4 points. The information on this site is not directed at residents in any country or jurisdiction where such distribution or use would be contrary to local law or regulation.

While the numbers will move the dial, the Bank of Japan monetary policy meeting and press conference will have more impact. A tweak to the Yield Curve Control (YCC) Policy would weigh on the USD/JPY.

Overnight, reports of the Bank of Japan planning to allow longer-term interest rates to rise above the 0.5% cap for 10-year government bonds sent the USD/JPY into reverse.

The markets expect the Bank of Japan to begin moving away from its ultra-loose monetary policy stance. Initially, the Yield Curve Control Policy will be the likely focal point. A shift away from ultra-loose and an end to the Fed monetary policy tightening cycle would tip the scales in favor of the Yen.

The US Session

US Core PCE Price Index and personal spending numbers will be the stats to track. Fed Chair Powell left the door ajar for a September rate hike. A hotter-than-expected core PCE price index and personal spending would support a more hawkish Fed policy outlook.

The Core PCE Price Index is the Fed’s preferred inflation indicator. Sub-4% would likely shut the door on the Fed hawks. However, personal spending needs consideration, with a pickup in spending likely to drive consumer price inflation through demand.

USD/JPY Price Action

Daily Chart

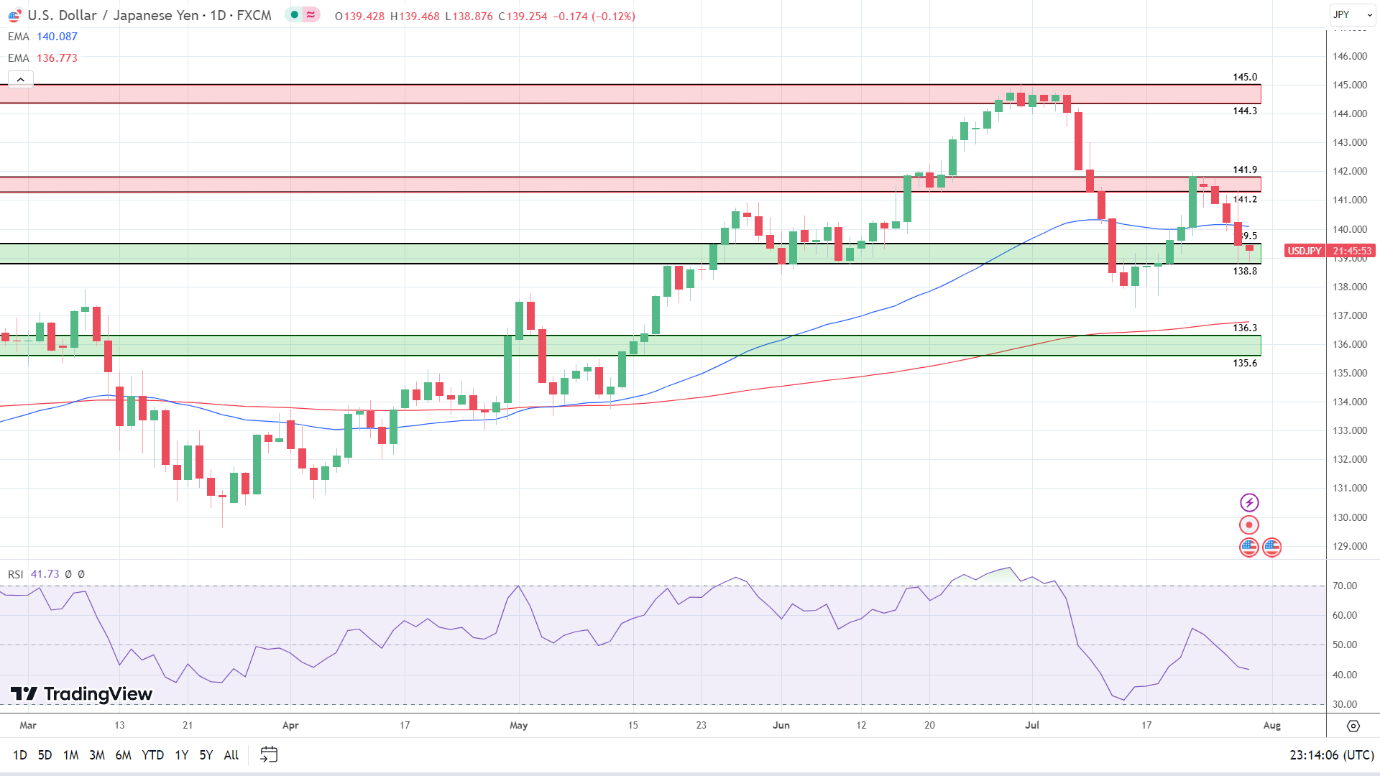
The Daily Chart showed the USD/JPY hovered at the upper level of the 139.5 – 138.8 support band. A fourth day in the red sent the USD/JPY through the 50-day EMA (140.087). However, the USD/JPY remained above the 200-day EMA (136.773), sending bearish near-term but bullish longer-term price signals.

Notably, the 50-day EMA narrowed on the 200-day EMA, supporting further losses.

Looking at the 14-Daily RSI, the 41.73 reading signals a bearish outlook, supporting a fall through the 139.5 – 138.8 support band to target sub-138. However, a USD/JPY move through the 50-day EMA (140.087) would give the bulls a run at the 141.2 – 141.9 resistance band.

Price action today is hinged on Tokyo inflation numbers and the Bank of Japan monetary policy decision and press conference.

USD/JPY Daily Chart turns bearish.

USDJPY 280723 Daily Chart

4-Hourly Chart

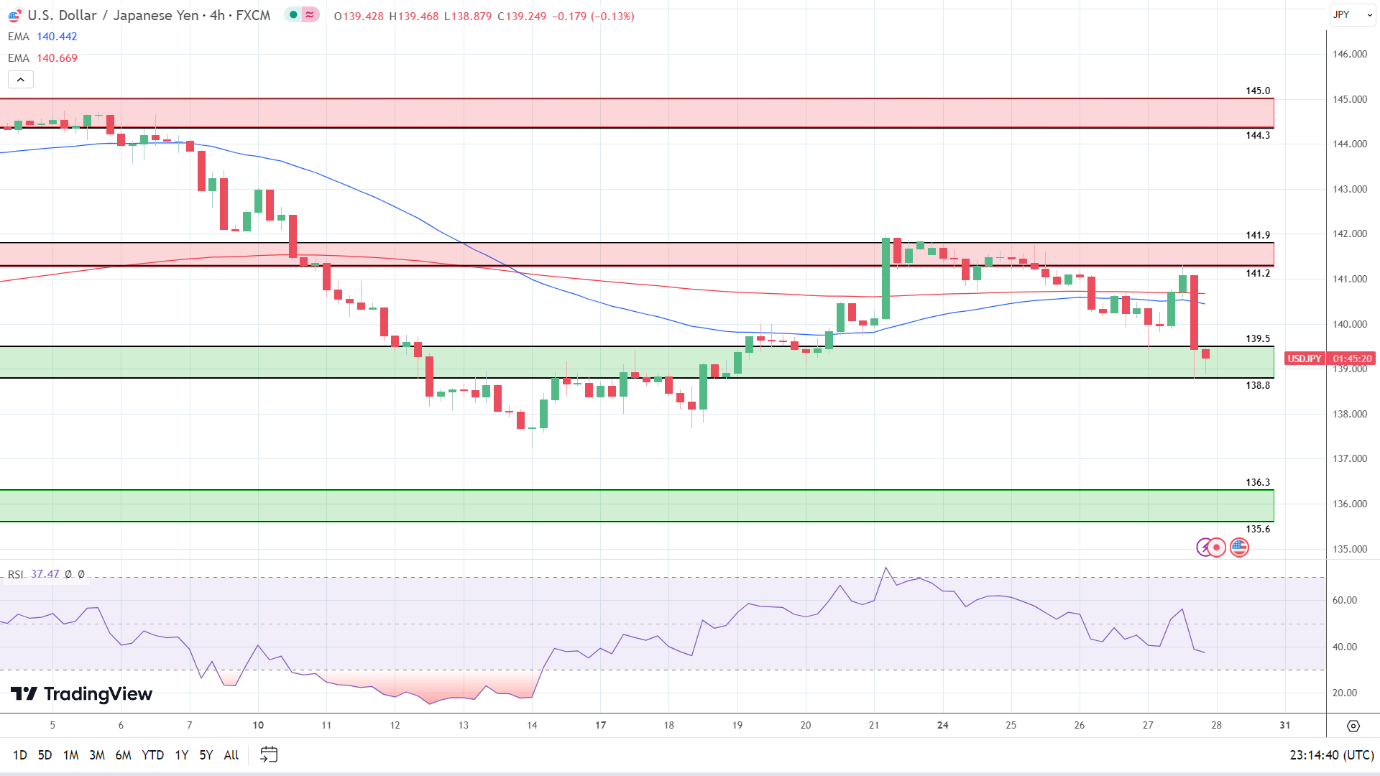
Looking at the 4-Hourly Chart, the USD/JPY faces strong resistance at 140. However, the USD/JPY sits below the 200-day (140.669) and 50-day (140.442) EMAs, sending bearish near and longer-term price signals.

Significantly, the 50-day EMA pulled back from the 200-day EMA, signaling a fall through the 139.5 – 138.8 support band. However, a USD/JPY move through the EMAs would bring the 141.2 – 141.9 resistance band into play.

The 14-4H RSI reading of 37.47 sends bearish signals, with selling pressure outweighing buying pressure. Notably, the RSI aligns with the EMAs and supports a fall through the 139.5 – 138.8 support band to bring sub-138 into view.

4-Hourly Chart sends bearish price signals.
USDJPY 280723 4 Hourly Chart
GDP increased significantly in Q2 2023 (+0.5% after +0.1%)

GDP increased significantly in Q2 2023 (+0.5% after +0.1%)

In Q2 2023, gross domestic product (GDP) increased significantly (+0.5% in volume terms*, after +0.1% in the previous quarter).

Foreign trade contributed positively to GDP growth (+0.7 points after +0.5 points). Exports bounced back this quarter (+2.6% after -0.8%), as well as imports to a lesser extent (+0.4% after – 2.0%).

Conversely, final domestic demand (excluding inventories) contributed again negatively to GDP growth (-0.1 points in Q2 2023, as in the previous quarter), because of the decrease of household consumption (-0.4% after 0.0%). Gross fixed capital formation (GFCF) increased (+0.1% after – 0.4%).

Finally, the contribution of inventory changes to GDP growth was slightly negative this quarter (- 0.1 points after -0.3 points in Q1 2023).

* Volumes are measured at previous year’s prices, chain-linked and adjusted for seasonal variations and working day effects (SA-WDA).

GDP – SA-WDA

470 000 500 000 530 000 560 000 590 000 470 000 500 000 530 000 560 000 590 000 in million euros Q1 2005 Q1 2006 Q1 2007 Q1 2008 Q1 2009 Q1 2010 Q1 2011 Q1 2012 Q1 2013 Q1 2014 Q1 2015 Q1 2016 Q1 2017 Q1 2018 Q1 2019 Q1 2020 Q1 2021 Q1 2022 Q2 2023

lib1lib1blib2lib2blib3592 964 million euros—–592 964 million euros—–592964—–592964Q1 2005Q2 2023

GDP and its main components

percentage change from previous period. working-day and seasonally adjusted data
GDP and its main components (percentage change from previous period. working-day and seasonally adjusted data)
2022 Q3 2022 Q4 2023 Q1 2023 Q2 2022 2023 (ovhg)
GDP 0.2 0.1 0.1 0.5 2.5 0.8
Imports 3.2 -0.5 -2.0 0.4 8.8 -0.3
Household consumption expenditure 0.5 -0.8 0.0 -0.4 2.1 -0.4
General government’s consumption expenditure 0.3 0.7 -0.2 0.0 2.6 0.4
GFCF 2.3 0.3 -0.4 0.1 2.3 1.2
Of which non-financial corporations and unincorporated enterprises 4.1 0.7 -0.2 0.7 3.8 3.0
Households -1.2 -1.0 -1.4 -1.6 -1.2 -3.7
General government 1.4 0.8 0.2 0.5 1.5 1.8
Exports 0.5 1.1 -0.8 2.6 7.3 2.3
Contributions:
Internal demand excluding inventory changes 0.9 -0.2 -0.1 -0.1 2.4 0.2
Inventory changes 0.2 -0.3 -0.3 -0.1 0.7 -0.3
Net foreign trade -0.9 0.5 0.5 0.7 -0.6 0.9
  • This growth rate is seasonally and working-day adjusted; volumes are chain-linked previous-year-prices volumes.

Total production accelerated in Q2 2023 (+0.8% after +0.4%)

Total production (goods and services) rose in the second quarter of 2023 at a faster pace than in the previous quarter (+0.8% after +0.4%).

This acceleration was partly due to the dynamism of the manufacturing industry (+1.1% after +0.8%). Production accelerated in transport equipment (+3.6% after +2.8%), slowed down significantly in the refineries (+1.7% after +10.1%), and recovered in “other manufactured products” (+0.5% after -0.4%). At the same time, energy production remained dynamic, following the continued reopening of nuclear power plants (+4.1% after +4.0%). Production of market services accelerated as well (+0.7% after 0.0%). It was driven in particular by production of business services (+0.8% after +0.2%), in information-communication (+1.4% after +1.1%), and of transport services (+1.2% after -1.1%). Conversely, production declined more markedly in construction (‑0.8% after ‑0.3%).

GDP and its main components

symboles_defaut.xml, symboles_defaut.xml,rond 0.0 1.0 2.0 3.0 4.0 -1.0 -2.0 -2.0 -1.0 0.0 1.0 2.0 3.0 4.0 quarterly variation in % and contribution in percentage points 2021 2022 2023 Inventory changes Net foreign trade Consumption GDP GFCF

lib1lib1blib2lib2blib30.04 points—–0.04 points—–0.04—–0.041st quart. 20212nd quart. 2023

Production, consumption and GFCF: main components

percentage change from previous period, working-day and seasonally adjusted data
Production, consumption and GFCF: main components (percentage change from previous period, working-day and seasonally adjusted data)
2022 Q3 2022 Q4 2023 Q1 2023 Q2 2022 2023 (ovhg)
Production of branches 0.4 0.2 0.4 0.8 3.7 1.6
Goods 0.2 0.1 1.5 1.8 0.5 3.0
Manufactured industry 0.9 -0.8 0.8 1.1 1.7 1.6
Construction -0.2 0.1 -0.3 -0.8 -0.7 -1.0
Market services 0.7 0.2 0.0 0.7 6.5 1.4
Non-market services 0.2 0.2 0.5 0.2 1.1 0.7
Household consumption 0.5 -0.8 0.0 -0.4 2.1 -0.4
Food products -1.1 -3.0 -2.6 -2.7 -3.7 -7.6
Energy 0.4 -7.9 6.2 1.7 -4.1 0.8
Engineered goods -0.2 0.2 -0.1 -0.1 -1.1 -0.1
Services 0.0 0.6 0.4 0.7 8.5 2.1
GFCF 2.3 0.3 -0.4 0.1 2.3 1.2
Manufactured goods 6.9 1.3 -0.9 0.4 3.4 3.9
Construction -0.1 0.2 -0.4 -0.9 -0.9 -1.1
Market services 2.4 -0.1 -0.2 1.2 5.4 2.3

Household consumption declined in Q2 2023 (-0.4% after 0.0%)

Household consumption declined in the second quarter of 2023 (-0,4% after 0.0%). The decline in household purchases of goods this quarter (-0.7% after +0.1%) was due to a further decrease of food consumption, which fell for the sixth consecutive quarter (-2.7% after -2.6%).

Energy consumption slowed down (+1.7% after +6.2%). Half of the increase in the second quarter was explained by the rise in actual energy consumption, and half by a further reduction this quarter in the share of energy expenditure borne by the public sector, due to the timing of payment of the energy voucher.

Household consumption of services rose by 0.7% (after +0.4% in the previous quarter). This acceleration was driven by accommodation and food services (+1.6% after -0.3%) and transport services (+3.0% after +1.6%).

GFCF bounced back slightly in Q2 2023 (+0.1% after -0.4%)

Total GFCF was slightly back on the rise in Q2 2023 (+0.1% after -0.4%). This rebound was driven by the GFCF in manufactured goods (+0.4% after -0.9%), thanks in particular to increased investment in transport equipment (+1.9% after ‑0.8%). GFCF in market services rebounded this quarter (+1.2% after -0.2%), driven by the dynamism of investment in information-communication (+2.1% after +1.7%), and despite the continuing decline of investment in real estate transaction services (‑1.3% after ‑8.0%). Investment in construction declined also again (‑0.9% after ‑0.4%).

In particular, household GFCF kept falling for the fourth consecutive quarter (-1.6% after -1.4%) due to a decline in new housing construction and a drop in real estate transactions in both new and existing buildings.

Foreign trade contributed positively to GDP growth (+0.7 points)

The contribution of foreign trade to GDP growth was positive again in Q2 2023 (+0.7 points, after +0.5 points in the previous quarter), due to a greater increase in exports than in imports.

Exports recovered clearly in the second quarter of 2023 (+2.6% after -0.8%). In particular, exports of transport equipment increased sharply (+11.2% after +1.8%), with notably the delivery of a cruise ship. Moreover, exports rebounded in coking and refining (+10.3% after -5.9%) and in the “other manufactured products” (+1.4% after -1.3%). Exports of services were for their part almost stable (+0.1% after -1.0%).

Imports partially rebounded in the second quarter of 2023 (+0.4% after -2.0%) driven by a rebound in manufactured product imports (+1.2% after -2.3%). In particular, imports in coking and refining grew significantly this quarter (+12.1%), after a sharp decline (-17.8%) in Q1 2023. Imports of the “others manufactured goods” increased this quarter (+1.5% after -3.0%) while those of capital goods continued to decline (-1.2% after -1.0%). At last, imports of services fell back this quarter (-2.0% after +2.5%), due to a decline in transport services (-7.0% after +7.7%).

The contribution of inventory changes to GDP growth was slightly negative in Q2 2023 (-0.1 points)

The contribution of inventory changes to GDP growth was slightly negative this quarter: -0.1 points, after -0.3 points in Q1 2023. This near-stability was due to a fall in transport equipment inventories, due in particular to the delivery of a cruise ship, offset by a rebound in coking and refining inventories, following the strikes in the first quarter of 2023.

Households’ disposable income and ratios of households’ account

percentage change from previous period, working-day and seasonally adjusted data
Households’ disposable income and ratios of households’ account (percentage change from previous period, working-day and seasonally adjusted data)
2022 Q3 2022 Q4 2023 Q1 2023 Q2 2022 2023
HDI 2.5 3.3 1.6 na 5.0 5.7
HDI (purchasing power) 0.9 1.3 -0.4 na 0.2 0.8
HDI by cu* (purchasing power) 0.7 1.2 -0.5 na -0.4 0.5
Adjusted HDI (purchasing power) 0.7 1.2 -0.3 na 1.1 0.8
Saving rate (level) 16.9 18.6 18.3 na 17.5 18.3
Financial saving rate (level) 5.5 7.6 7.3 na 6.2 7.3

Ratios of non-financial corporations’s account

level (in percent), WDA-SA data
Ratios of non-financial corporations’s account (level (in percent), WDA-SA data)
2022 Q3 2022 Q4 2023 Q1 2023 Q2 2022
Profit share 32.0 31.8 31.7 na 31.7
Investment ratio 26.3 26.3 26.1 na 25.9
Savings ratio 22.6 22.5 21.1 na 22.2
Self-financing ratio 85.8 85.6 80.9 na 85.7

Expenditure, receipts and net borrowing of public administrations

level, WDA-SA data
Expenditure, receipts and net borrowing of public administrations (level, WDA-SA data)
2022 Q3 2022 Q4 2023 Q1 2023 Q2 2022
In billions of euros
Total expenditure 388.3 394.2 393.6 na 1,536.0
Total receipts 356.3 352.2 360.6 na 1,411.5
Net lending (+) or borrowing (–) -32.0 -42.1 -33.0 na -124.5
In % of GDP
Net lending (+) or borrowing (–) -4.8 -6.2 -4.8 na -4.7

Revisions

The estimate of GDP growth has been revised downwards by 0.1 points in the first quarter of 2023 and upwards by 0.1 points in the fourth quarter of 2022. GDP thus increased by +0.1% in the fourth quarter of 2022 as in the first quarter of 2023. Since the previous publication, new information has been incorporated and the seasonal adjustment (SVA) and working day adjustment (WDA) coefficients have been updated.

In July 2023, consumer prices increased by 4.3% year on year

In July 2023, consumer prices increased by 4.3% year on year

Over a year, the Consumer Price Index (CPI) should rise by 4.3% in July 2023, after +4.5% in the previous month, according to the provisional estimate made at the end of the month. This further decrease in inflation should result from a new year-on-year decline in energy prices and a slowdown in food prices (for the fourth consecutive month) and in those of manufactured goods. The prices of services should increase over one year at a rate close to that of the previous month.

Over one month, consumer prices should be stable in July 2023, after +0.2% in June. The prices of energy should fall back due to the decrease in gas prices. The prices of manufactured goods, notably those of clothing and footwear, should also fall back due to the summer sales. The prices of food should slow down and those of services should accelerate due to the seasonal increase in transport service prices and in “other service” prices.

Year on year, the Harmonised Index of Consumer Prices should rise by 5.0% in July 2023, after +5.3% in June. Over one month, it should be stable, after +0.2% in June.

Consumer Price Indices

Year-on-year change %; 2015: 100
Consumer Price Indices (Year-on-year change %; 2015: 100) – *: Consumer Price Indices **: Harmonised Index of Consumer Prices
Weight 2023 July 2022 June 2023 July 2023 (p)
CPI – All items* 10000 6.1 4.5 4.3
Food 1624 6.8 13.7 12.6
– Fresh food 238 5.2 11.2 10.4
– Other food products 1386 7.1 14.1 13.0
Tobacco 185 0.1 9.8 9.8
Energy 857 28.5 -3.0 -3.8
Manufactured products 2322 2.7 4.2 3.4
Services 5012 3.9 3.0 3.1
HICP** – All items 10000 6.8 5.3 5.0

Variations in the consumer price index

0.0 0.5 1.0 1.5 2.0 2.5 3.0 3.5 4.0 4.5 5.0 5.5 6.0 6.5 -0.5 -1.0 -1.0 -0.5 0.0 0.5 1.0 1.5 2.0 2.5 3.0 3.5 4.0 4.5 5.0 5.5 6.0 6.5 % 2017 2018 2019 2020 2021 2022 2023 12-month-rate 1-month-rate

lib1lib1blib2lib2blib30.0 %—–0.0 %—–0.0—–0.0Jan 2017Jul 2023

For further information

Definition: the Harmonised Index of Consumer Prices (HICP) is designed for comparison of consumer price inflation between Members States of the European Union. It is computed for all households in France. The main difference between HICP and CPI is about the health costs: HICP is based on net prices of social security reimbursements and CPI is based on gross prices.

Publication of final results: 11 August 2023 at 8:45 am.

Next publication: 31 August 2023 at 8:45 am.

Inflation Remains Risk Confronting Financial Markets

Inflation Remains Risk Confronting Financial Markets

Overall inflation has moderated meaningfully in recent months in the United States and euro area, as energy and food prices have fallen significantly. Year-on-year headline inflation is now around 3 percent in the United States and below 5.5 percent in the euro area. However, core inflation, excluding food and energy prices, has declined more slowly. Services inflation has proven to be particularly sticky.

According to market pricing, investors expect headline inflation to continue to decline quite rapidly in coming quarters. However, some market participants still see upside risks to the inflation outlook, likely reflecting recent stickiness in core inflation. Indeed, pricing from inflation options—financial instruments that offer protection against inflation moving higher or lower than its current level—shows that such upside risk is particularly pronounced in Europe, where investors assign roughly similar odds to inflation returning to the European Central Bank’s 2 percent target and inflation remaining around 4 percent. In the United States, investors appear to put high odds on inflation being above target at around 3 percent.

At the same time, financial conditions—as proxied by our index that summarizes financing costs faced by firms and households in housing, credit, and equity markets—have eased notably in the United States and euro area in recent quarters. This easing has occurred despite continued monetary policy tightening by the Federal Reserve and ECB, in part reflecting investors’ relatively benign outlook for price pressures—an assessment that has boosted market valuations.

The recent easing creates a challenge for central banks in their efforts to get inflation back to their 2 percent targets. Historically, tighter monetary policy has been transmitted to the real economy, and subsequently to inflation, through tighter financial conditions. While financial conditions are currently tighter than the extremely loose levels seen in mid-2021, the recent easing may complicate the fight against inflation by preventing the slowdown in aggregate demand that may be needed to tamp down inflation pressures.
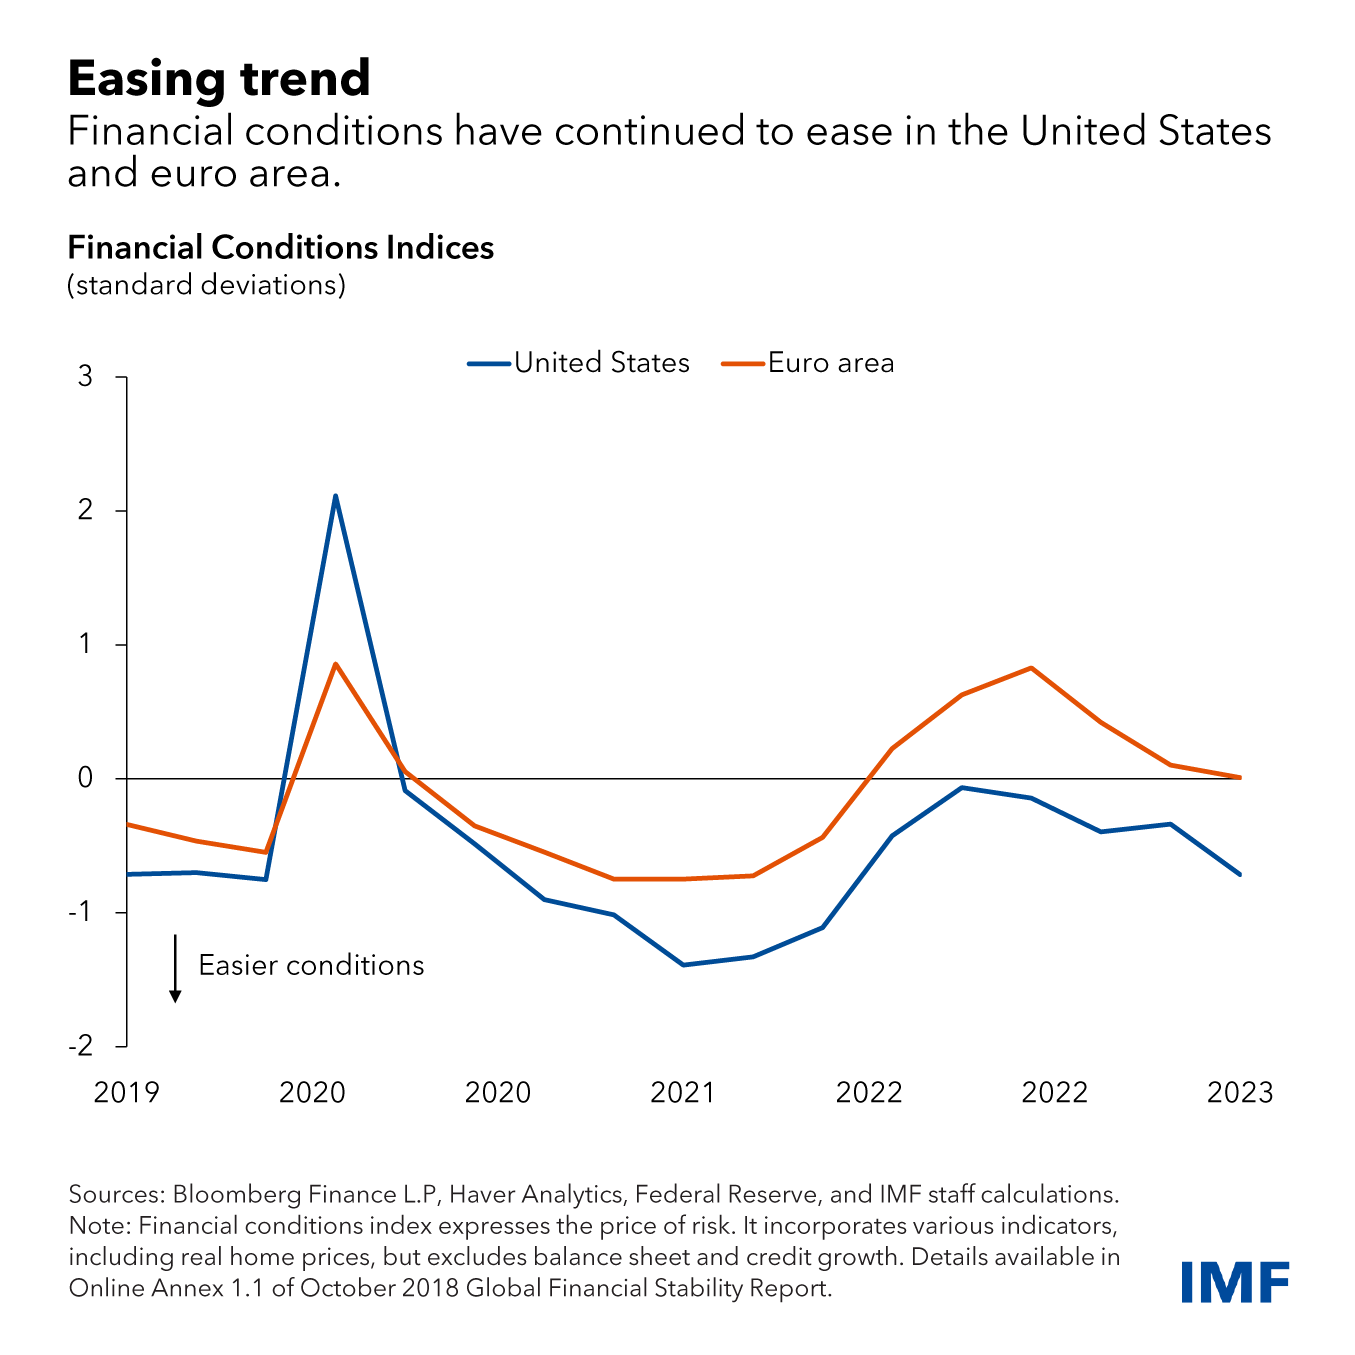
A further complication results from the combination of a prolonged period of extremely loose financial conditions and a monetary policy tightening cycle in advanced economies that started when inflation was already elevated. This may have dulled the transmission of monetary policy to financial conditions. For example, the share of fixed-rate mortgages with low rates (because of refinancings in the past few years) is very high in the United States. Similarly, corporations took advantage of exceptionally low borrowing costs and ample liquidity to extend their debt maturities.

In both cases, this may have dampened the effectiveness of monetary policy tightening, as many mortgage holders and companies have only begun to face higher borrowing costs, thus contributing to the continued strength in labor markets and aggregate demand. Of course, other factors may have played a role, including structural changes in the labor marker or housing markets after the pandemic, for example.

While financial condition indices based on financing costs in capital markets have eased, monetary policy transmission also works through credit extension, especially for borrowers more reliant on bank lending. Bank credit growth has remained positive in both the United States and euro area, although the pace of growth has slowed markedly, especially in the latter. More forward-looking information in recent loan officer surveys in both the United States and euro area point to significantly slower demand for credit and tightening underwriting standards by banks, suggesting that a further deceleration in bank credit provision may be in the offing. Recent earnings reports have shown strength at large banks, with earnings boosted by higher interest rates charged on loans while remuneration on deposits continues to lag the pace of policy tightening. Lending survey results, however, suggest that profitability could moderate going forward.
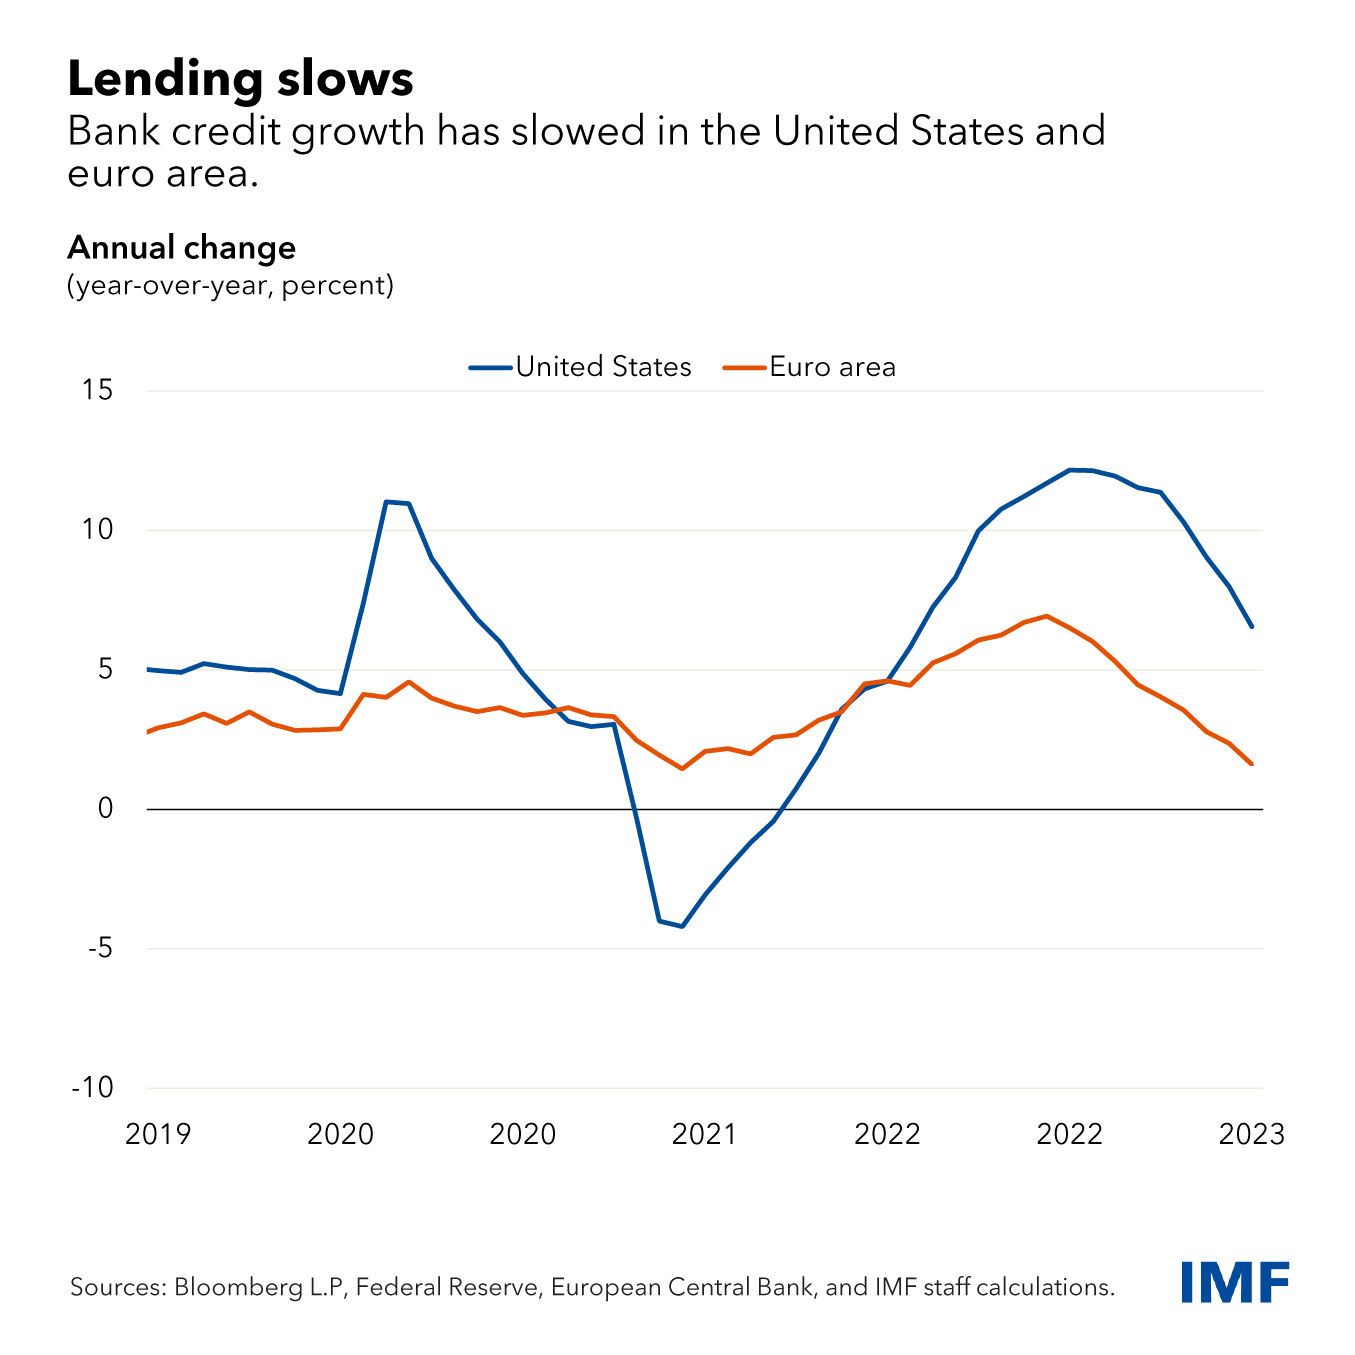
Nonbank credit provision may also be slowing, with corporate bond issuance down significantly this year. Importantly, we also see a pronounced differentiation: while issuers with high credit ratings continue to be able to borrow relatively easily, their lower-rated counterparts face greater headwinds. Default rates are starting to increase among lower-rated borrowers, albeit from low levels, along with bankruptcies at small and medium-sized enterprises. This suggests the credit cycle may be deteriorating.

Monetary policy has always operated with considerable lags, and the pace and timing of transmission of the tightening remains uncertain, particularly given possible structural changes in the economy due to the pandemic and rising geopolitical tensions. The central narrative among market participants is one of a benign soft landing, where inflation returns to target relatively quickly with only a modest slowdown in economic growth. While IMF’s baseline outlook doesn’t foresee recession in the United States or euro area, core inflation is expected to be more persistent than what is priced in markets, and consequently, further policy tightening is assumed.

But a scenario where underlying inflation continues to be sticky and declines only slowly is a risk. Tighter monetary policy for longer than currently priced by financial markets may be needed, resulting in higher real interest rates. This could hurt investor sentiment as market participants reassess the inflation and policy outlook, leading to a repricing of risk assets such as equities and credit and to a tightening of financial conditions. Such an outcome could heighten risks to economic activity and financial stability.

Potential vulnerabilities

From a financial stability standpoint, strategies predicated on a fast disinflation process and a soft landing could be vulnerable to an abrupt tightening in financial conditions and the unwinding of highly leveraged investment strategies may lead to disorderly market conditions.

For example, there are now widespread reports and anecdotal evidence in the United States of investors financing purchases of Treasury securities and simultaneously selling futures contracts to capture profits from the difference in prices. A sudden shock, for example related to upside surprises to inflation, may cause a widening of such price differences and force leveraged investors to unwind their positions, selling bonds just as the prices for those securities fall. The potential for an adverse feedback loop between such forced selling and banks that do not have the balance sheet capacity or willingness to buy these securities could lead to stress in markets and present financial stability challenges reminiscent of those that shook Treasury markets in March 2020 at the onset of the pandemic.

In addition, some segments in the US banking sector remain vulnerable as regional lenders may continue to face profitability issues in the quarters to come. The March banking turmoil in the United States and the government-supported sale of Credit Suisse underscored that managerial and supervisory failures can make banks vulnerable to shifts in market sentiment, with investor runs amplified by technology and social media.

Both pricing and positioning suggest that investors are perhaps too optimistic about the speed of disinflation and the likelihood of a soft landing in economic activity. Core inflation remains sticky, suggesting that inflation (and the risk of a resurgence) has not yet been fully tamed. History cautions against declaring victory too soon. Central banks must remain determined in their fight until there is tangible evidence that inflation is sustainably moving toward targets.

Quarterly National Accounts of Spain: main aggregates Second quarter of 2023. Preview

Quarterly National Accounts of Spain: main aggregates Second quarter of 2023. Preview

The economic effects of the COVID-19 pandemic have become evident in the aggregates of the National Accounts of Spain since the first quarter of 2020. Its The impact on economic activity and employment has, since then, posed a challenge in the unprecedented measurement of the situation. To these effects have been added, since March 2022, those caused by the international crisis derived from the Russian invasion of Ukraine, with very significant distortions of a different nature in various areas (on which energy markets, international trade, price trends, flows immigration, etc.) This preview of results is prepared

USD/JPY in Turmoil, Rumors of Possible BoJ YCC Tweak Sends Yen Soaring

USD/JPY in Turmoil, Rumors of Possible BoJ YCC Tweak Sends Yen Soaring

USD/JPY was on track for a solid rise Thursday morning after U.S. second-quarter GDP growth beat consensus estimates by a wide margin, but gave up its advance and swung sharply lower in afternoon trading on news that the Bank of Japan may surprise markets with a change to its yield curve control program at its July monetary policy meeting scheduled to end on Friday (Japan time).

Financial magazine Nikkei Asia reported that the BoJ would discuss modifying its YCC scheme to permit long-term interest rates on government debt to climb above its current band of 0.0% to 0.5%, using the expected upward revision of its inflation forecast as an excuse to start moving away from its ultra-accommodative stance.

According to the media outlet, the BoJ is considering allowing rates to float beyond the cap in a controlled and gradual fashion, without permitting disruptive and sudden spikes that could roil financial markets. The bank has neither confirmed nor refuted the information.

If the country’s monetary authority follows through with this plan, Japanese yields are likely to creep up to the new YCC ceiling quickly, eventually compressing rate differentials with developed markets and buoying the yen. Initially, however, global yields could rise in tandem with those in Japan, as Japanese investors sell their foreign bond holdings in favor of domestic debt.

While more details are needed to assess the outlook, if global yields were to rally aggressively in a short period of time, volatility could pick up overnight, throwing markets into turmoil. This scenario could disrupt the 2023 equity rally, creating a constructive backdrop for safe-haven assets.

USD/JPY TECHNICAL OUTLOOK

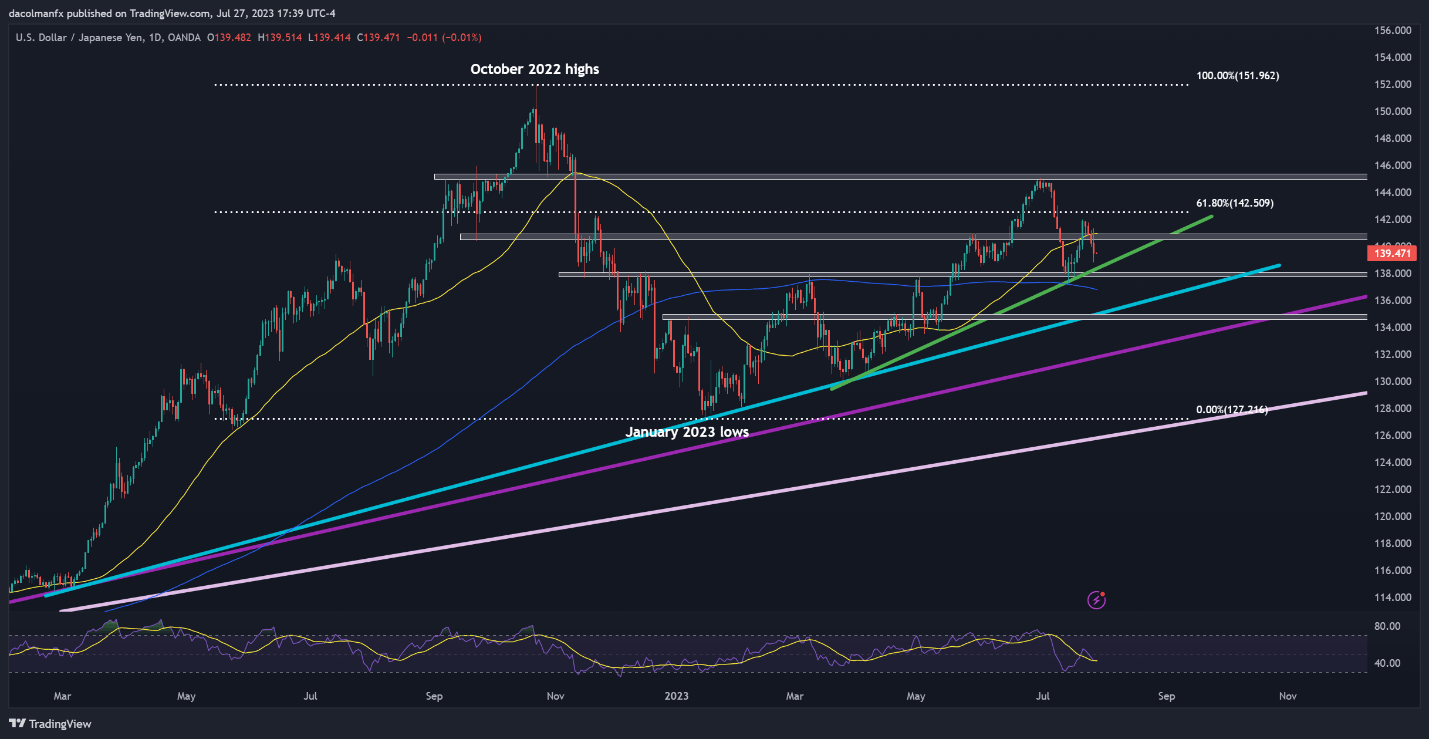
After the recent pullback, USD/JPY is hovering slightly above confluence support, stretching from 138.50 to 137.75. If bears manage to push prices below this floor, we could see a move toward the 200-day simple moving average, followed by a possible retest of the psychological 135.00 level.

On the flip side, if USD/JPY resumes its ascent, initial resistance appears at 141.00, followed by 142.50, the 61.8% Fibonacci retracement of the October 2022/January 2023 slump. If these technical barriers are taken out, bulls could become emboldened to launch an attack on the 2023 peak.

USD/JPY TECHNICAL CHART

image1.png