European Central Bank (ECB) Preview: 25bps and Done or More Hikes in the Offing?

European Central Bank (ECB) Preview: 25bps and Done or More Hikes in the Offing?

Central Banks take center stage this week with the Federal Reserve kicking things off with eyes now turning to the European Central Bank (ECB) and President Christine Lagarde. It’s been an interesting ride for the ECB in 2023 with positive signs at the beginning of year now finally starting to wane as the rate hike cycle appears to be bearing fruit.

Over the past week or so we have seen signs that the Euro Area is feeling the effects of the ECB hiking cycle as economic data continues to deteriorate. The poor data off late has reignited a debate about whether the ECB is hiking into a recession with some ECB policymakers for the first time in 2023 adopting a more neutral to dovish stance on the path moving forward. No matter the outcome of this week’s meeting, robust discussions and debates around the policy path moving forward are likely to dominate ECB proceedings for the foreseeable future.

Looking at the rate hike probability distribution for the ECB below and markets are pricing in another 20bps (after the July meeting) of hikes by December 2023 before rate cuts in 2024, something which may factor into ECB President Lagarde’s comments on Thursday. The Euro is overvalued at the moment something which has been weighing on exports from the Euro Area.
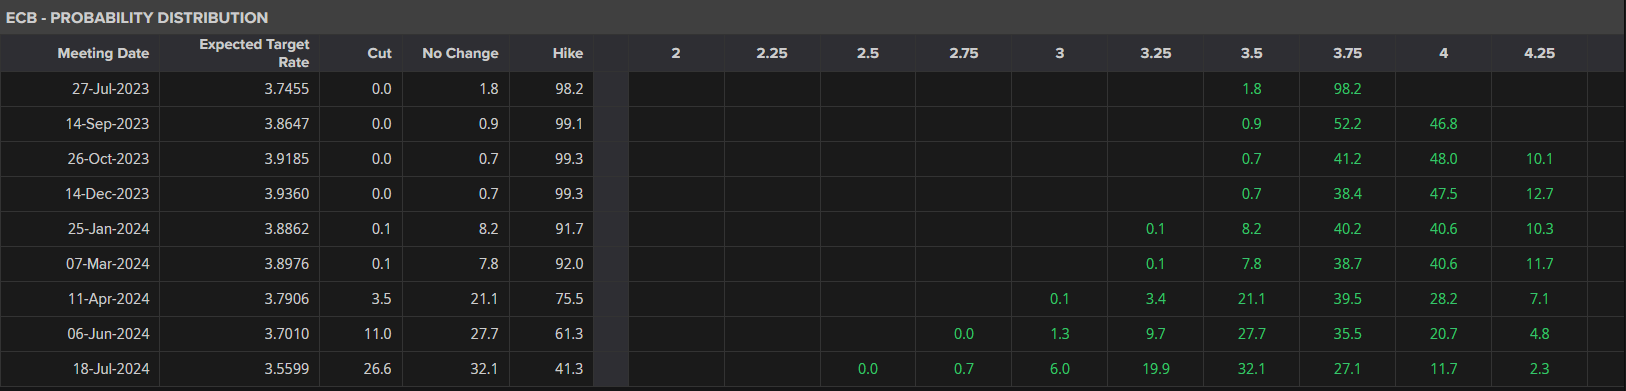
image1.png

THE INFLATION, DISINFLATION STORY

On the inflation front the Euro Area appears to be the front runner in combatting inflation with significant progress of late in comparison to the UK and the US. There is still work to do however with European Central Bank (ECB) President Lagarde leading the charge in getting inflation back under the Central Banks target. There have been signs that inflation could fall quicker than the ECB expect but that would likely occur toward the back end of Q3 heading into Q4 as the Summer season is likely to keep demand elevated for now and thus inflation as well.

Inflation in the UK, US and Euro Area
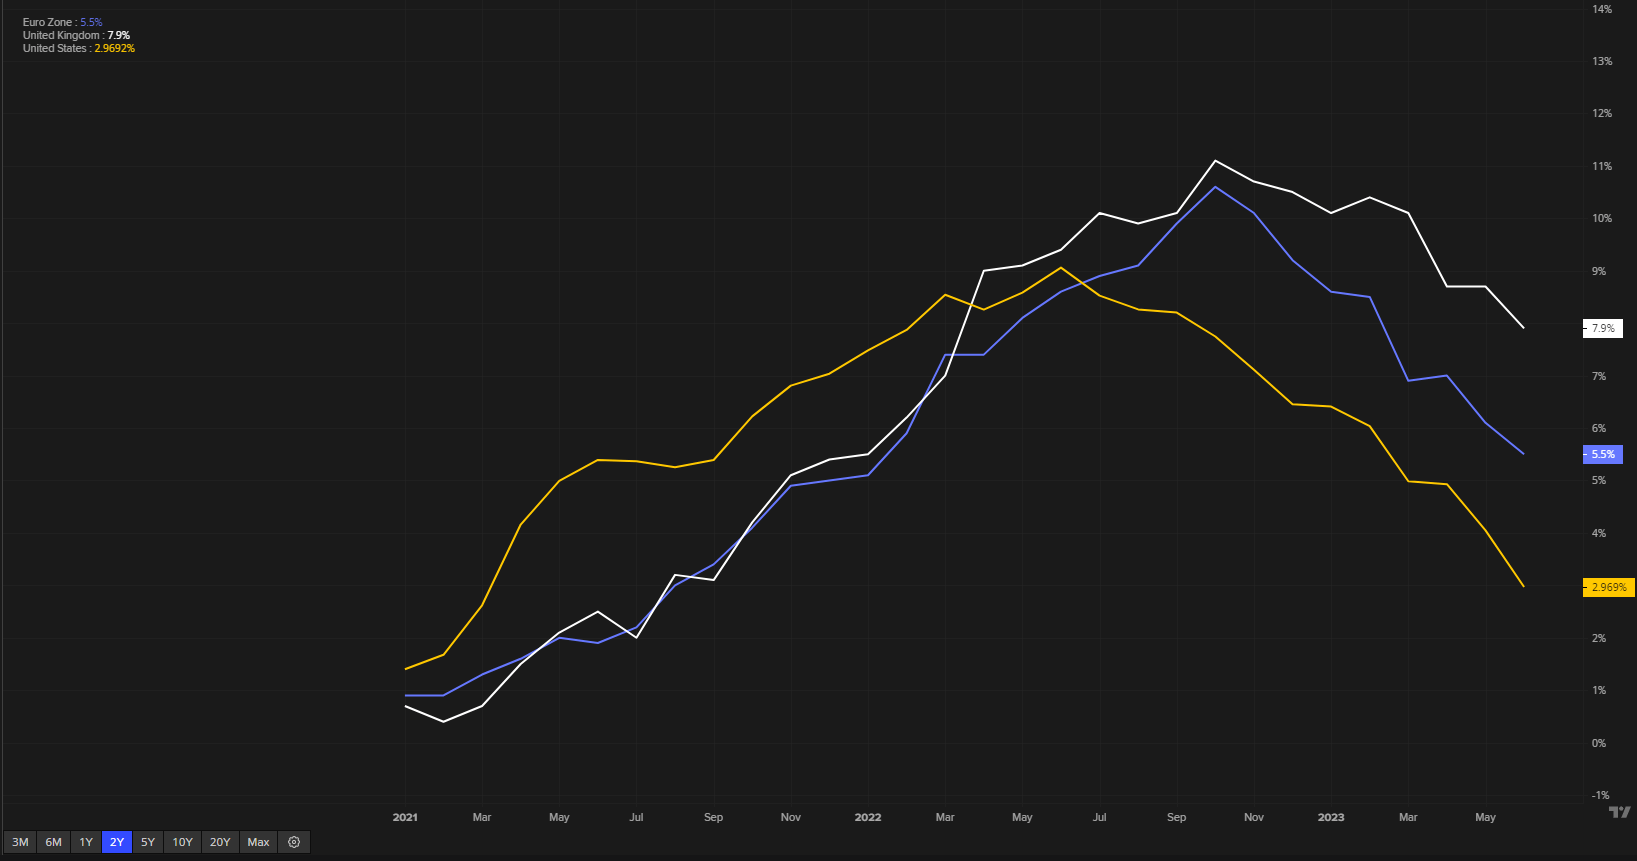
image2.png

The minutes of the previous ECB meeting hinted at robust discussions on the policy path moving forward with such discussion and debates likely to intensify as the ECB approaches its end goal. We are already seeing a change with certain policymakers hinting at a shift to data-dependency rather than any hawkish rhetoric or commitment to further hikes.

EURO AREA GROWTH CONCERNS

Monday this week started on a slightly sour note as Euro PMI data came in worse than expected while Tuesday morning brought another poor print in the form of German Ifo data. This has rekindled fears around a recession in the second half of the year and may give the European Central Bank (ECB) some food for thought as they plan the monetary policy path moving forward.

The IMF released updated forecasts yesterday as well upgrading Global Growth forecasts for 2023 to 3% from a previous 2.8%. However German GDP was revised down to a 0.3% contraction from a previous estimate of 0.1% as the Euro Area begins to feel the full effects of rate hikes over the past 12 months. The opportunity for further hawkish rhetoric does appear to be fading along with the Euro Areas growth prospects for 2023 with recent data around loans also painting a concerning picture. A pause in hikes after the July meeting is likely to depend on the data with a continued fall in inflationary pressures the desired result for the ECB and a sign that a pause may be in order.

POSSIBBLE SCENARIOS AND IMPACT

25bps Rate Hike with Dovish Tilt: a 25bps hike seems a certainty at this stage with the staff projections and overall rhetoric likely to have more sway. Whether the economic projections change following the recent spate of poor data remains to be seen. A dovish message from the ECB would come in the form of no commitment to a rate hike in September with a switch to data dependency, something we have heard from select ECB members of late.

25bps Rate Hike with Hawkish Tilt: a 25bps hike followed by continued concerns around core and service inflation prices with no real mention of data dependency as a guide moving forward could be viewed as hawkish on the part of the ECB. Such a move could provide the Euro with another jolt in the arm which should result in gains against major counterparts.

image3.png

TECHNICAL OUTLOOK

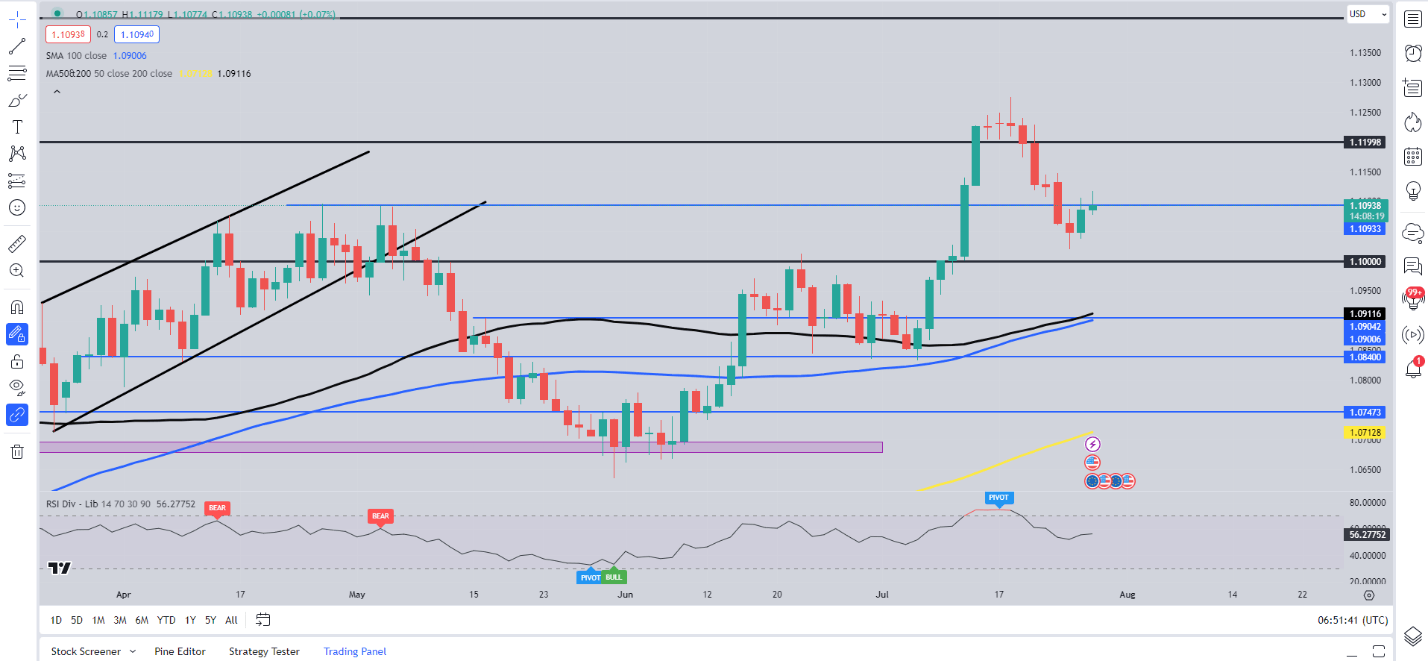
EURUSD from a technical perspective remain caught within a 250-pip range between the 1.1250 and 1.1000 handles at the moment with a bullish engulfing candle close yesterday hinting at the potential for a deeper retracement. Looking at the MAs and it may be something to keep an eye on as the 100-day MA looks ready to cross above the 200-day MA in what would be a golden cross pattern, further evidence that the overall bullish momentum remains in play.

A break below the 1.1000 mark could see the 100 and 200-day MAs tested serving as support and could cap further downside. The 1.0840 handle will remain key if we are to see some form of bullish continuation.

Support Areas

  • 1.1000 (Psychological Level)
  • 1.0900 (100-200-day MAs)
  • 1.0840 (July Swing Low)

Resistance Areas

  • 1.1150
  • 1.1250 (YTD Highs)
  • 1.1400

EUR/USD Daily Chart
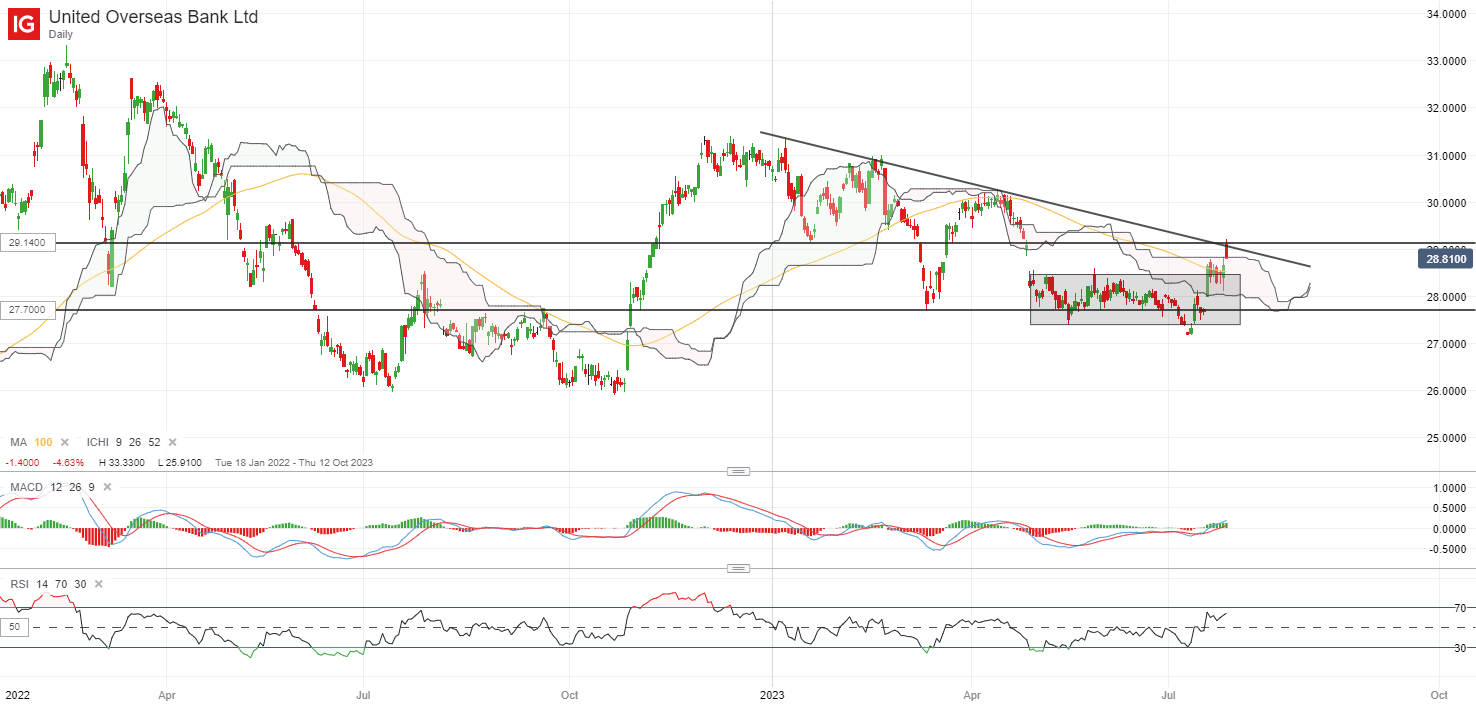
image4.png

4 Effective Trading Indicators Every Trader Should Know

4 Effective Trading Indicators Every Trader Should Know

Using Forex Indicators to Read Charts for Different Market Environments

There are many fundamental factors when determining the value of a currency relative to another currency. Many traders opt to look at the charts as a simplified way to identify trading opportunities – using forex indicators to do so.

When looking at the charts, you’ll notice two common market environments. The two environments are either ranging markets with a strong level of support and resistance, or floor and ceiling that price isn’t breaking through or a trending market where price is steadily moving higher or lower.

Using technical analysis allows you as a trader to identify range bound or trending environments and then find higher probability entries or exits based on their readings. Reading the indicators is as simple as putting them on the chart.

Trading with Moving Averages

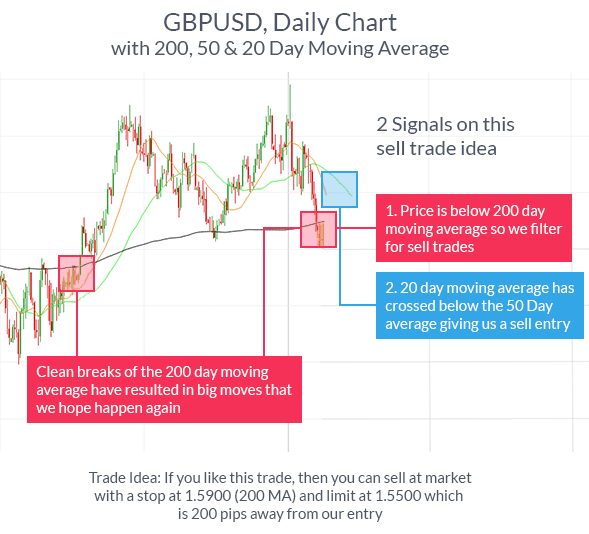
One of the best forex indicators for any strategy is moving average. Moving averages make it easier for traders to locate trading opportunities in the direction of the overall trend. When the market is trending up, you can use the moving average or multiple moving averages to identify the trend and the right time to buy or sell.

The moving average is a plotted line that simply measures the average price of a currency pair over a specific period of time, like the last 200 days or year of price action to understand the overall direction.

Learn Forex: GBPUSD Daily Chart – Moving Average

GBPUSD daily chart showing the use of Moving Averages as a forex indicator to measure the average price of a currency over time.

You’ll notice a trade idea was generated above only with adding a few moving averages to the chart. Identifying trade opportunities with moving averages allows you see and trade off of momentum by entering when the currency pair moves in the direction of the moving average, and exiting when it begins to move opposite.

Trading with RSI

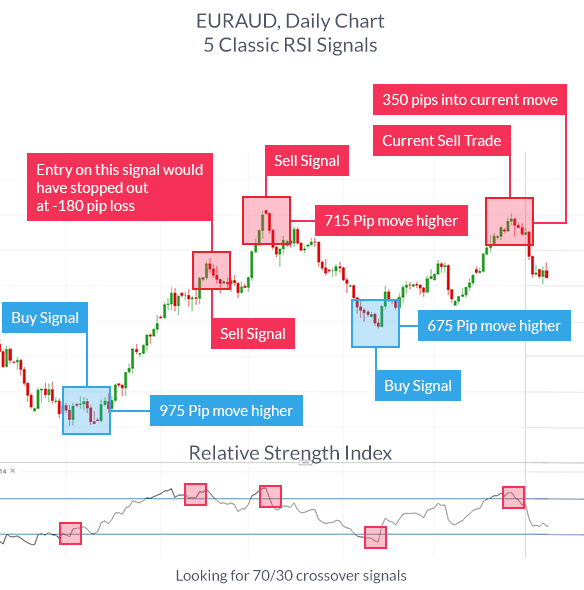
The Relative Strength Index or RSI is an oscillator that is simple and helpful in its application. Oscillators like the RSI help you determine when a currency is overbought or oversold, so a reversal is likely. For those who like to ‘buy low and sell high’, the RSI may be the right indicator for you.

EURAUD daily chart plotted with RSI indicator to identify better exit or entry prices for forex trading.

The RSI can be used equally well in trending or ranging markets to locate better entry and exit prices. When markets have no clear direction and are ranging, you can take either buy or sell signals like you see above. When markets are trending, it becomes more obvious which direction to trade (one benefit of trend trading) and you only want to enter in the direction of the trend when the indicator is recovering from extremes.

Because the RSI is an oscillator, it is plotted with values between 0 and 100. The value of 100 is considered overbought and a reversal to the downside is likely whereas the value of 0 is considered oversold and a reversal to the upside is commonplace. If an uptrend has been discovered, you would want to identify the RSI reversing from readings below 30 or oversold before entering back in the direction of the trend.

Trading with Stochastics

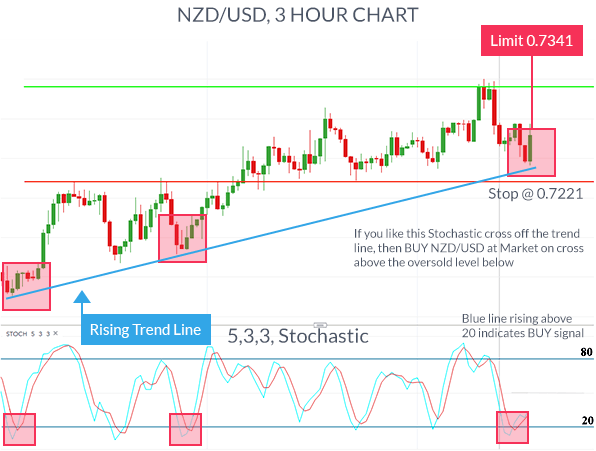
Slow stochastics are an oscillator like the RSI that can help you locate overbought or oversold environments, likely making a reversal in price. The unique aspect of trading with the stochastic indicator is the two lines, %K and %D line to signal our entry.

Because the oscillator has the same overbought or oversold readings, you simply look for the %K line to cross above the %D line through the 20 level to identify a solid buy signal in the direction of the trend.

NZDUSD 3 hour chart showing the use of the stochastic indicator to inform of a forex trading strategy.

Trading with the Moving Average Convergence & Divergence (MACD)

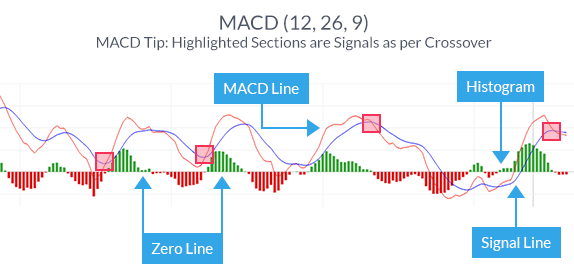
Sometimes known as the king of oscillators, the MACD can be used well in trending or ranging markets due to its use of moving averages provide a visual display of changes in momentum.

After you’ve identified the market environment as either ranging or trading, there are two things you want to look for to derive signals from this indictor. First, you want to recognize the lines in relation to the zero line which identify an upward or downward bias of the currency pair. Second, you want to identify a crossover or cross under of the MACD line (Red) to the Signal line (Blue) for a buy or sell trade, respectively.

Graph showing a MACD line that identifies the upward or downward bias of a currency pair.

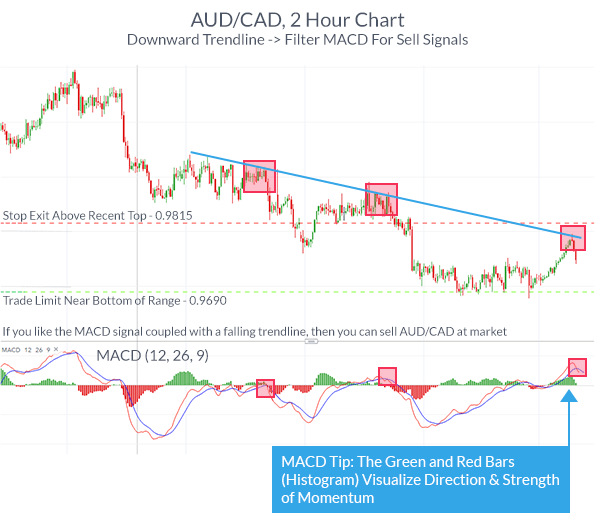
Like all indicators, the MACD is best coupled with an identified trend or range-bound market. Once you’ve identified the trend, it is best to take crossovers of the MACD line in the direction of the trend. When you’ve entered the trade, you can set stops below the recent price extreme before the crossover, and set a trade limit at twice the amount you’re risking.

AUDCAD 2 hour chart where the MACD indicator is being used to inform traders of a forex trading strategy.

Learn More about Forex Trading with our Free Guides

Underlying inflation has slipped below 6%, but is the slide enough to stop the RBA pushing up rates further?

Underlying inflation has slipped below 6%, but is the slide enough to stop the RBA pushing up rates further?

Australia’s inflation rate has fallen for the second consecutive quarter.

After reaching a 30-year high of 7.8% at the end of 2022, annual inflation as measured by the Bureau of Statistics’ quarterly Consumer Price Index slid to 7% in the March quarter of 2023, and fell further to 6% in the June quarter.

The quarterly results are consistent with the newer monthly measure of annual inflation which has also been falling since hitting a high of 8.4% in December.

The monthly measure slid to 5.4% in June.

Helping bring inflation down were state government electricity rebates and cuts in the prices some households paid for medicines.

The prices of new dwellings grew more slowly as demand eased and problems with the supply of materials improved.

Conversely, there were sharp increases in the prices of insurance and some other financial services.

The bureau’s measure of rents (which covers rents paid in distinction to more widely quoted measures of rents advertised) grew by 6.7% in the year to June, up from 4.9% in the year to March, and the most since 2009.

Underlying inflation down

To get a better idea of what would be happening were it not for some of these unusual and outsized moves, the bureau calculates what it calls a trimmed mean measure of “underlying” inflation.

This excludes the 15% of prices that climbed the most in the quarter and the 15% of prices that climbed the least or fell.

This measure, closely watched by the Reserve Bank, is also falling and is now 5.9%.

The fall in Australia’s inflation is in line with falls in other Western nations including the United States, Canada and the United Kingdom. They have been brought about by an easing of supply bottlenecks and slowing economic activity in response to increases in interest rates.

An exception is China, which has almost no inflation.

Much of the slide in Australia’s inflation rate reflects weaker economic growth.

The economy grew only 0.2% in the March quarter. The Reserve Bank believes it grew by only that much again in the June quarter.

Consumer climate recovers losses from previous month

Consumer climate recovers losses from previous month

Consumer climate recovers losses from previous month

Following the slight decline in the previous month, consumer sentiment stabilized again in July. Income expectations increased slightly, while economic expectations and the propensity to buy remained virtually unchanged from June. GfK is forecasting -24.4 points in consumer sentiment for August, up 0.8 points from July of this year (revised -25.2 points). These are the findings of the GfK Consumer Sentiment Study for July 2023.

With this slight increase, the consumer climate fully compensates for the losses it suffered in the previous month, although the propensity to buy and the propensity to save remain virtually unchanged compared with the previous month. “Currently, only income expectations are contributing to the improvement in consumer sentiment. The main reason for the decrease in pessimism is the hope of declining inflation rates,” explains GfK consumer expert Rolf Bürkl. “This has somewhat improved the chances of consumer sentiment resuming its recovery course. However, the level will still remain low in the coming months, and private consumption will therefore not be able to make a positive contribution to overall economic development.”

Income expectations at highest level since February 2022

Private households are currently more optimistic about their income expectations, probably because prices are rising less sharply. The indicator gained 5.5 points, climbing to a total of -5.1 points. This is the best value since the outbreak of the war in Ukraine. The measurement in February 2022 was 3.9 points.

This actually represents an increase of 40.6 points compared to the same period of the previous year. Nevertheless, the income indicator will remain affected in the coming months by the inflation-related loss of household purchasing power.

Propensity to buy continues its stable development at a low level

Unlike income expectations, the propensity to buy can hardly increase. The indicator has gained a marginal 0.3 points, climbing to -14.3 points. It is thus almost at the same level as in the previous year (July 2022: -14.5 points).

The stagnation of consumer buying at a low level is attributable to the continuing high level of uncertainty among consumers. High food and energy prices, the ongoing war in Ukraine, and concerns about rising costs due to real estate renovation measures as a result of the heating law are currently causing consumers to be more cautious with their planned purchases.

Economic optimism remains unchanged

The weakening of economic sentiment seen in the previous two months has been halted – at least for now. The indicator remained virtually unchanged in July compared with the previous month. Economic expectations continue to remain at 3.7 points. This represents an increase of almost 22 points compared to the previous year.

Stable employment continues to be a key pillar of the German economy. However, the monetary policy of the European Central Bank (ECB) is causing uncertainty among consumers. On the one hand, it is certainly necessary to bring inflation back to an acceptable level through a more restrictive monetary policy. On the other hand, there is a risk that an overly restrictive monetary policy will lead the already struggling economy further into recession. The coming months will show to what extent the ECB’s chosen path has produced the desired result.

The boomers boosting inflation as the RBA lifts rates to fight it

The boomers boosting inflation as the RBA lifts rates to fight it

In the fight to bring down inflation the Reserve Bank has smashed the more than one in three Australians with home loans by dramatically raising interest rates on repayments.

But a further third of our society have paid off their housing.

They tend to be older and they’re enjoying higher asset prices and bigger returns from their savings.

Data shows they’re spending at a rate far exceeding inflation — working against the goal of lowering the temperature of the economy.

This has a growing number of experts questioning whether interest rates should be used as almost the sole tool to tackle the inflation crisis.

Aquaculture expert Greg Jenkins has benefited from interest rates climbing at the steepest rate in the history of our economy.

On the verandah of his home on the outskirts of Perth, he’s looking forward to imminent retirement and some big trips.

Greg Jenkins 2

Greg Jenkins is recovering from surgery, considering retirement and reading up on road trips.(ABC News: Phil Hemingway)

“My wife and I, never been better,” he says.

“We don’t pay a mortgage, the stock market’s earned a 9 per cent increase in the year.

“The interest rates actually make it better for us because we’re earning more money on deposits.”

And that rising wealth has sent a clear signal: spend.

“We’ve probably spent more money in the last two years than we have in the last 20.”

But Greg isn’t happy about it.

“We’re not paying the price,” he says.

“I can guarantee that decades ago, when people got together and decided that interest rates were going to be the lever to control inflation, none of those people had mortgages.

“It doesn’t impact them, it doesn’t impact us. It’s not right.”

Asia Day Ahead: Lukewarm Reaction to Fed Meeting

Asia Day Ahead: Lukewarm Reaction to Fed Meeting

In a widely expected move, the Federal Reserve (Fed) hiked its policy interest rate by 25 basis-point (bp) to the 5.25%-5.5% range and left the door open for another hike in September. But given that Fed Chair Jerome Powell also guided for rate decisions to be on a “meeting-by-meeting” basis, additional tightening moves still lack commitment at current point in time. In light of the Fed’s data-dependent stance, along with the broader trend of moderating US inflation, Fed rate expectations remained firm for an extended pause through the rest of the year.

Perhaps something to keep on the back of mind is that the Fed Chair still does not see inflation returning to the Fed’s 2% inflation goal until 2025, which may suggest that he foresees a more arduous process in pushing pricing pressures down moving forward. The abating of base effects and some firming in commodities prices lately could present some potential challenges.

Wall Street managed to pare earlier losses to close flat for the day, with after-market moves edging higher on Meta’s results. A beat on all fronts (top and bottom line, active users base, average revenue per user), along with a better-than-expected guidance for the third quarter, were more than sufficient to put a 6.8% gain in its share price in after-hours trading.

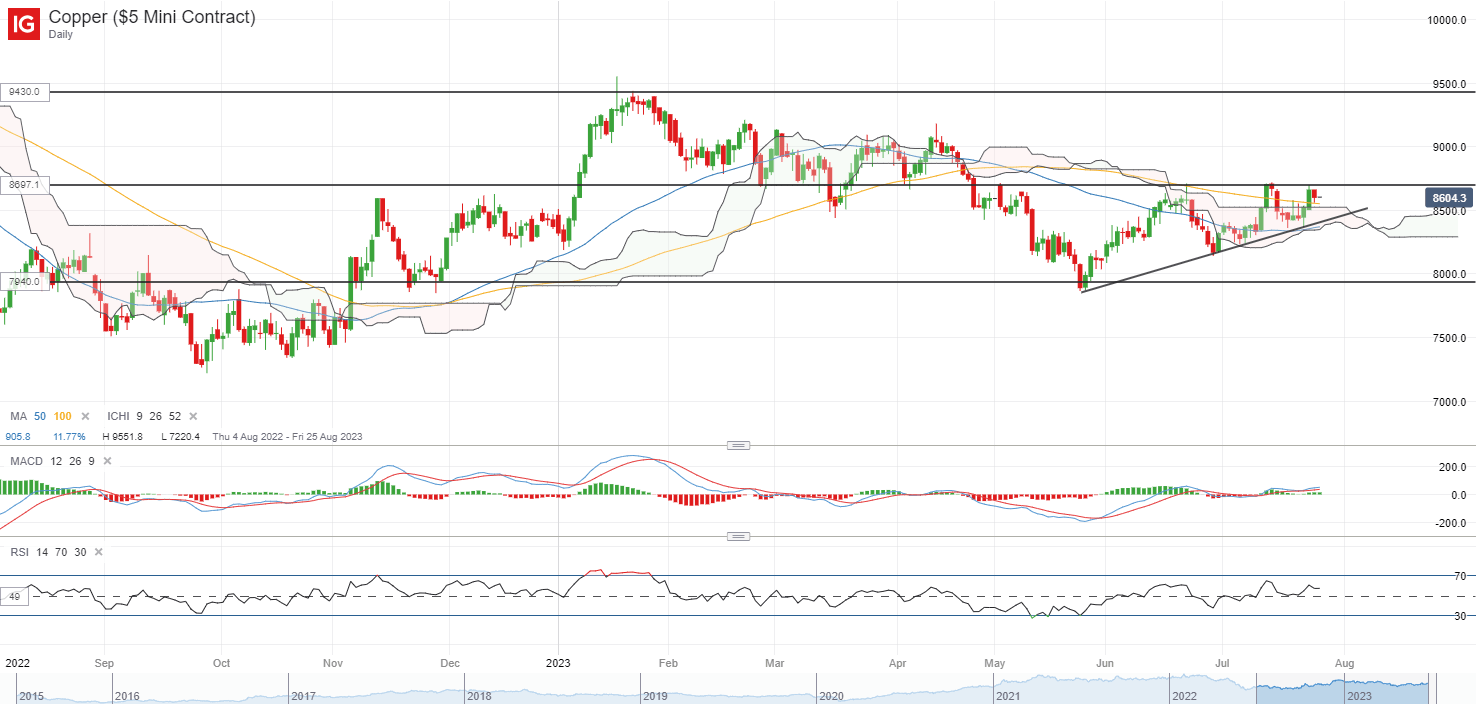
The US dollar were 0.3% lower, alongside a downtick in US Treasury yields. One to watch in the commodities space on a more subdued US dollar may be copper prices. Prices have been trading within an ascending triangle pattern over the past two months, with recent retest of the upper trendline resistance at the US$8,700/tonne level once more. Near-term upward momentum is supported by an increasing moving average convergence/divergence (MACD) and relative strength index (RSI) above 50, with any successful break above the level potentially paving the way to retest the US$9,000/tonne level next.

image1.png

Source: IG charts

Asia Open

Asian stocks look set for a slightly positive open, with Nikkei +0.11%, ASX +0.54% and KOSPI +0.57% at the time of writing. The Nasdaq Golden Dragon China Index were up 2.8% overnight, following a more lacklustre session in the earlier session, with cautious optimism still at play for further follow-through in China’s economic stimulus. Closer to home, the focus is on UOB’s 2Q 2023 result release this morning.

The bank continues to benefit from the net interest income tailwind, with a 31% year-on-year jump in the segment uplifting overall profits by 27%, in line with forecasts. Net interest margin continues to moderate for the second straight quarter (2.12% from previous 2.14%), but some may find comfort in the softer pace of decline, which could suggest some stabilising above the 2% level for the months ahead. Loan growth and net fee income remains more subdued with single-digit decline from a year ago, but thus far, management’s guidance may have provided a positive spin on outlook, pointing to some economic resilience in the region. Dividends were raised to S$0.85/share from last year’s S$0.60/share, potentially leaving a forward dividend yield of 5.5%.

For UOB’s share price, a gap higher this morning has led to a retest of key resistance confluence at the S$29.14 level. While buyers remain in control, with its MACD heading above zero and RSI sustaining above the key 50 level, a break above the S$29.14 resistance may be warranted to support further upmove to the psychological S$30.00 level. On the downside, the previous consolidation range at the S$28.45 level may serve as near-term support.

image2.png

Source: IG charts

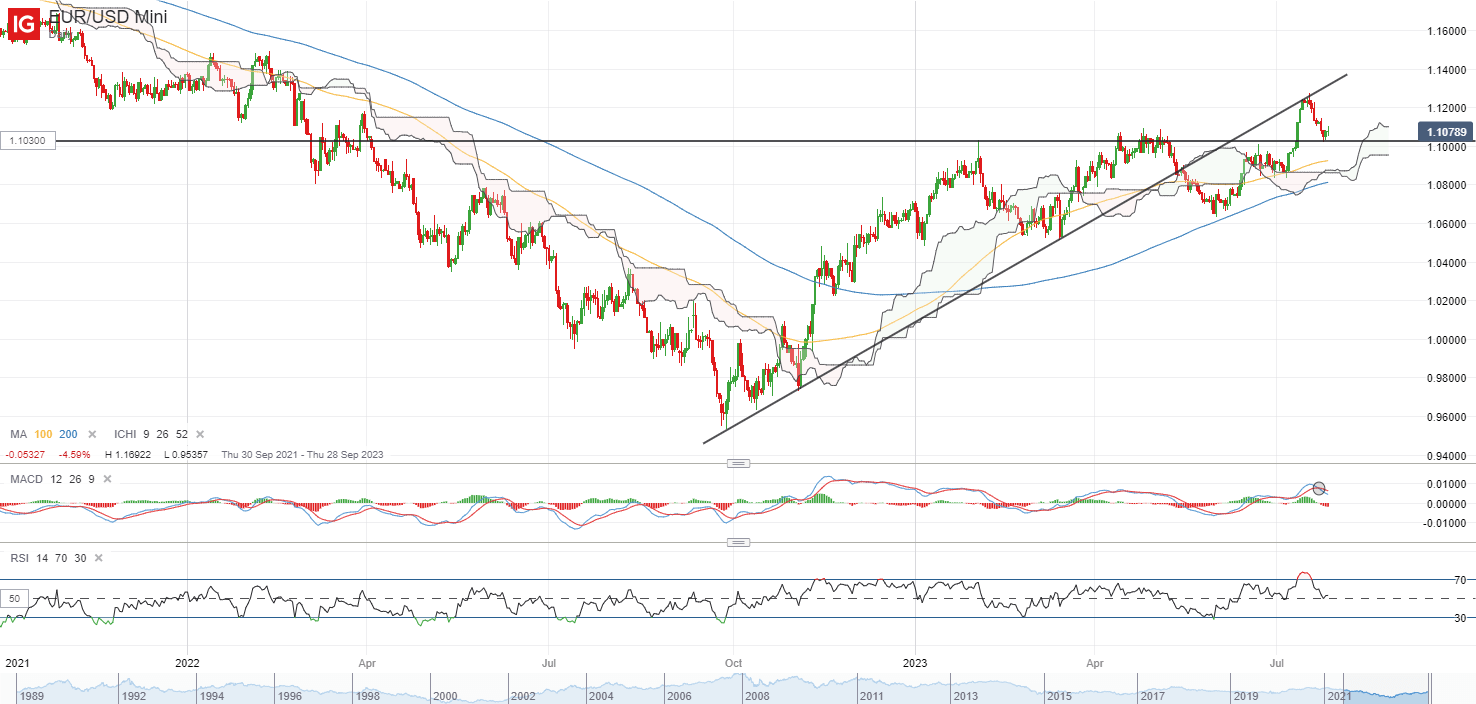
On the watchlist: EUR/USD resting at support ahead of European Central Bank (ECB) meeting

Thus far, the EUR/USD has been trading on an upward trend, with a series of higher highs and higher lows displayed since October last year. Following a lacklustre showing in the US dollar overnight post-FOMC, the EUR/USD is finding an attempt to stabilise at a near-term support around the 1.103 level, with all eyes on the ECB interest rate decision later today.

While rate expectations were firmly priced for an extended pause from the Fed moving forward, the ECB is expected to keep hiking over the next two meetings. Any validation on that front or more aggressive tone from the ECB could be supportive of the pair in the near term. With a bearish crossover on MACD and declining RSI pointing to some moderation in near-term momentum, the 1.103 level will have to see some defending ahead. Failing to do so may pave the way towards the 1.083 level as the next line of support.

image3.png

Source: IG charts

US Dollar Slips After Fed Rate Hike: What Has Changed for EUR/USD, GBP/USD, USD/JPY?

US Dollar Slips After Fed Rate Hike: What Has Changed for EUR/USD, GBP/USD, USD/JPY?

The US dollar slipped but held well within the recent range after the US Federal Reserve hiked interest rates by the widely expected quarter percentage point and on balance kept its options open for further tightening.

Powell’s remarks at the press conference came across as neutral, stopping short of committing either way. Meanwhile, the post-meeting statement was largely unchanged from the previous meeting, still containing the phrase “additional policy firming”, highlighting the slight hawkish tilt. On balance, the key takeaway appears to be the data-dependent/patient approach going into the next meeting.

For the US dollar, the balanced tone provides little cues. However, while risk sentiment remains resilient amid an encouraging start to the earnings season and hopes of additional stimulus from China, USD could stay on the back foot. In this regard, the USD hasn’t been able to recoup the losses triggered by the recent US jobs and inflation data. As long as the market believes US rates are near a peak, the appetite for the safe-haven USD could stay diminished.Meanwhile, key focus is now on the European Central Bank policy meeting (later Thursday) and the Bank of Japan meeting (Friday).


EUR/USD 240-minute Chart

image1.png

Chart Created by Manish Jaradi Using TradingView

EUR/USD: Holds above crucial support

EUR/USD on Wednesday held above stiff support around an uptrend line from early June, near the 200-period moving average on the 4-hour chart. Still, it would be too soon to conclude that the immediate bearish pressure has alleviated – the pair would need to clear the initial hurdle at Monday’s high of 1.1150. Until then, the bias appears to be of consolidation within a broadly constructive outlook. As highlighted in the previous update, only a fall below the mid-July lows of 1.0825 for the broader upward pressure to ease.

GBP/USD 240-minute Chart

image2.png

Chart Created by Manish Jaradi Using TradingView


GBPUSD: Bullish pressure is still intact

GBP/USD has managed to rebound from a fairly strong cushion on converged support around 1.2800, including an uptrend line from the end of June, and the mid-June high of 1.2850. A hold above the support was crucial to keep the short-term upward pressure intact. GBP/USD now needs to overcome the initial cap at Thursday’s high of 1.2965 to eliminate any imminent downside risks.

Any fall below Monday’s low of 1.2800 would confirm that the bullish pressure had faded in the near term, potentially opening the way toward the end-June low of 1.2600. Zooming out, the broader bias remains up, with a potential to rise toward 1.4200 in the coming months (see theprevious updatefor more details).

USD/JPY 240-minute Chart

image3.png

Chart Created by Manish Jaradi Using TradingView

USD/JPY: Growing odds of a false bullish candle

While EUR/USD and GBP/USD remained within the recent ranges, the reaction in USD/JPY was relatively convincing. Wednesday’s fall below immediate support at Monday’s low of 140.75 has raised the odds of a false move higher last week. For more on this, see “US Dollar Scenarios Ahead of Fed Rate Decision: EUR/USD, GBP/USD, USD/JPY Price Setups,” published July 26.

USD/JPY is now testing the vital converged support area at 139.50-140.00. Any break below could confirm that the sharp rebound on Friday above the 200-period moving average on the 240-minute chart was a false one. On the upside, a rise above Friday’s high of 142.00 remains a vital hurdle to clear.

Gold Prices Embrace Golden Cross as XAU/USD Looks to Beyond the Fed Next

Gold Prices Embrace Golden Cross as XAU/USD Looks to Beyond the Fed Next

Gold prices were left slightly higher in the aftermath of Wednesday’s rate hike from the Federal Reserve. The most meaningful development from the central bank was not the widely anticipated tightening, but rather commentary from Chair Jerome Powell that most officials do not envision a recession in the horizon, underscoring expectations of a soft landing.

With that in mind, it is widely anticipated that the Fed will do nothing in September. Anything beyond that will be dictated by incoming economic data. For now, let us examine how the technical landscape is shaping up in gold.

The most interesting development from the XAU/USD daily chart is that a bullish Golden Cross is taking shape between the 20-day and 50-day Moving Averages (MA). This is offering an increasingly upside technical bias and reverses the bearish Death Cross seen in May.

The Golden Cross has formed in the aftermath of prices breaking above a near-term falling trendline from May. Since then, gold seems to have found resistance around the 23.6% Fibonacci retracement level at 1971. Clearing higher exposes the minor 14.6% point at 2013 before May highs kick in. These make for a range of resistance between 2048 and 2081.

Otherwise, a turn lower and drop through the moving averages places the focus on immediate support, which is the 1936 inflection point. Beyond that sits the 38.2% level at 1903. Clearing the latter opens the door to a stronger bearish conviction.

image1.png


US Equity Indices Post FOMC: Nasdaq, S&P 500, Dow Price Setups

US Equity Indices Post FOMC: Nasdaq, S&P 500, Dow Price Setups

US equity indices were largely flat, hovering around year-to-date highs after the US Federal Reserve hiked interest rates by the widely expected quarter percentage point.

While the post-meeting statement kept the bias for “additional policy firming”, at the press conference, Fed Chair Powell seemed to have leaned toward the dovish side. “I would say it’s certainly possible that we will raise funds again at the September meeting if the data warranted,” said Powell. “And I would also say it’s possible that we would choose to hold steady and we’re going to be making careful assessments, as I said, meeting by meeting.” The data-dependent/ patient approach going into the next meeting has boosted the market’s perception that US interest rates are peaking, supporting risk appetite at the margin.

With the earnings season off to a good start, global growth being resilient, and additional China stimulus remaining a possibility, markets have reasons to cheer. Having said that, extreme optimism, overbought conditions, overcrowded positioning, and seasonality headwinds are potential risks. Dow Jones Industrial Average Weekly Chart

image1.png

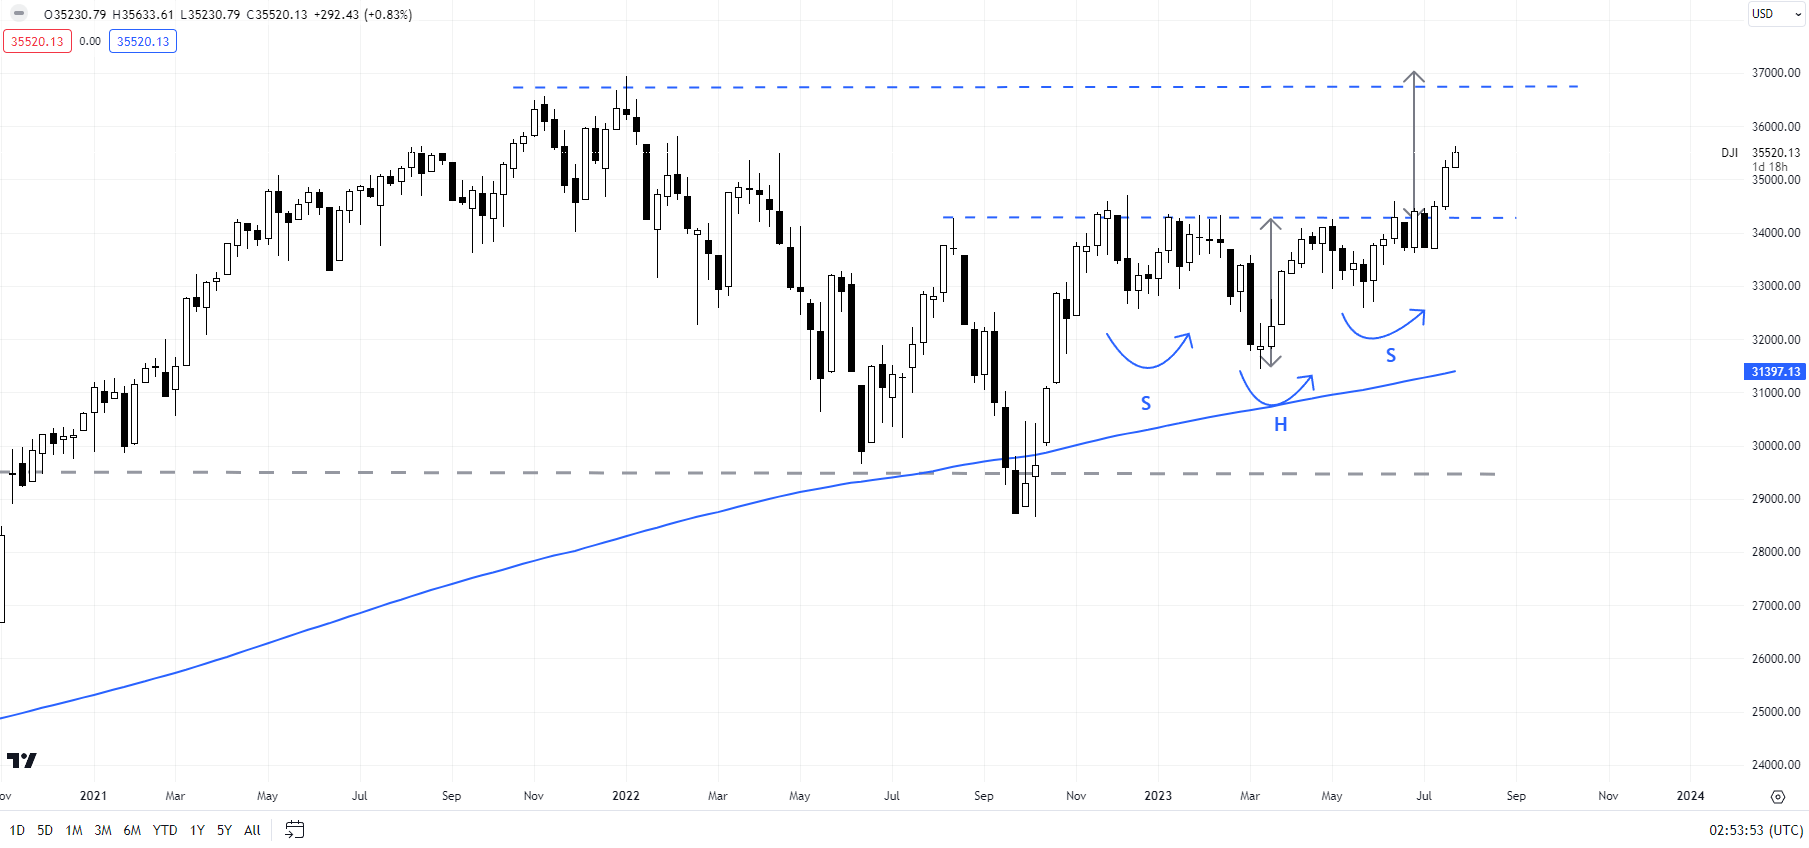
Dow Jones Industrial Average: Scope for further gains

The Dow Jones Industrial Average’s recent break above a horizontal trendline from August at about 34280 has triggered a reverse head & shoulders pattern, first highlighted in “Dow, S&P 500, Nasdaq Technical Outlook: No Sign of a Reversal,” published July 9. The left shoulder is at the December low, the head is at the March low, and the right shoulder is at the May low. The bullish break has opened the way toward the 2022 high of around 37000.

NASDAQ 100 Monthly Chart

image2.png

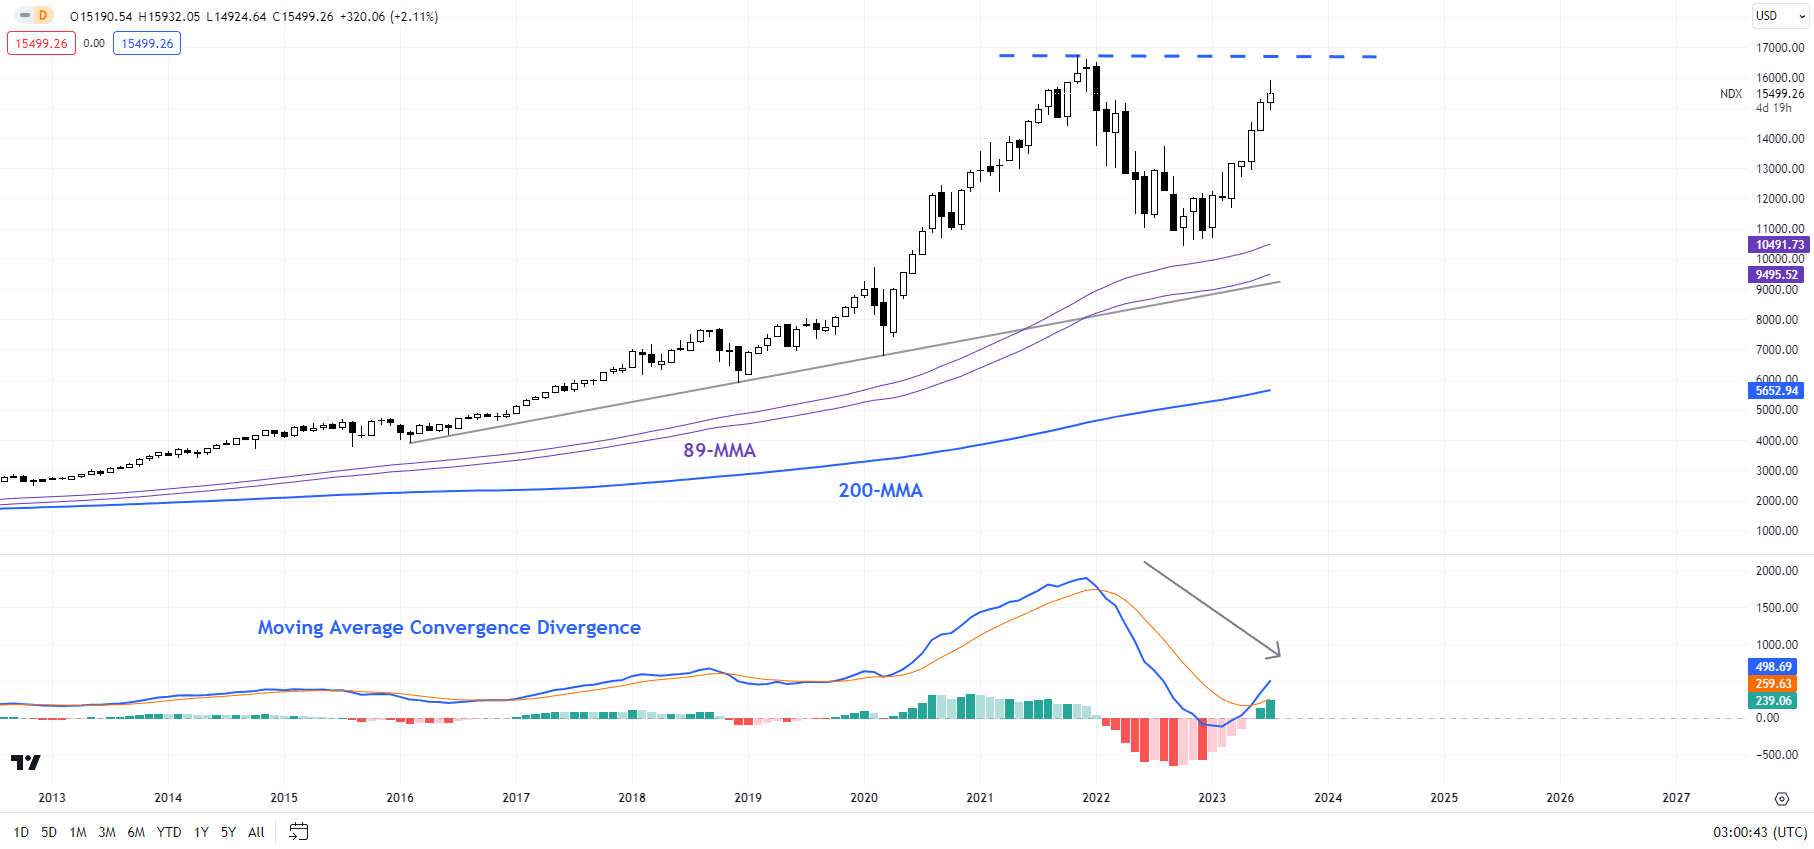
Nasdaq 100: Overbought, but no sign of reversal

The Nasdaq 100 index is looking quite overbought, while diversity continues to remain low. For more on diversity, see “S&P 500, Nasdaq 100 Forecast: Overly Optimistic Sentiment Poses a Minor Setback Risk,” published July 23. Furthermore, the momentum on higher timeframe charts has failed to reflect the strength on shorter timeframe charts. For instance, on the monthly chart, the index is close to its 2021 peak, but the Moving Average Convergence Divergence indicator has hardly picked up.

To be sure, this doesn’t necessarily mean the index is bearish, not at least until there is a price confirmation. It probably means, from a risk: reward perspective, it may be prudent to turn cautious. Immediate support is at the mid-June high of 15285, around the 30-day moving average. Subsequent support is at the end-June low of 14690 – a break below this support would be needed for the immediate bullish pressure to ease.

S&P 500 Weekly Chart

image3.png

S&P 500: Uptrend intact as it nears a key hurdle

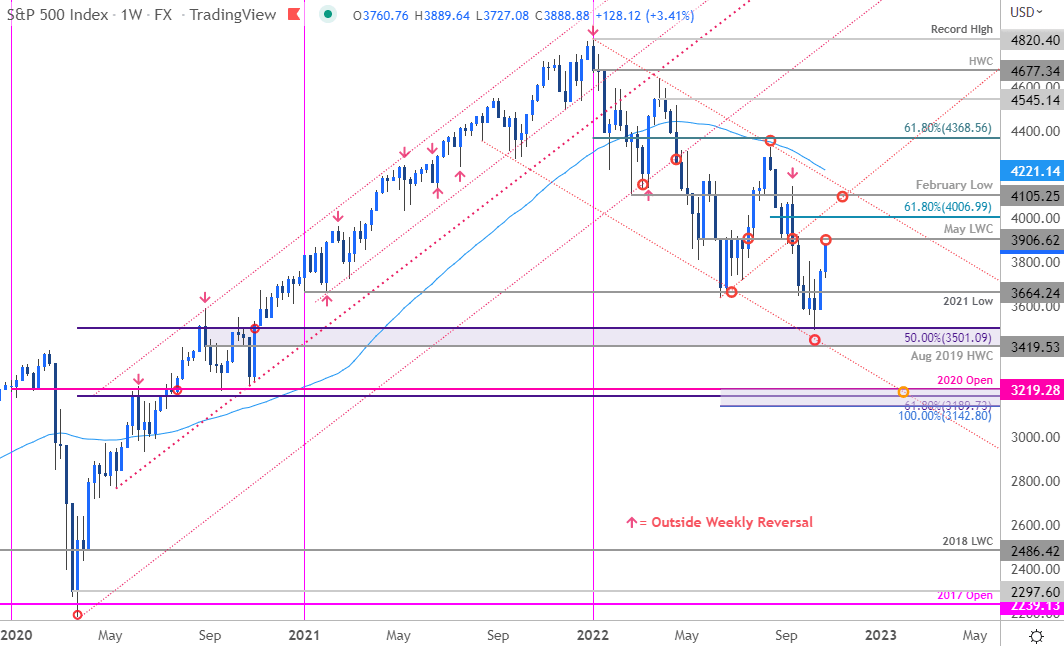
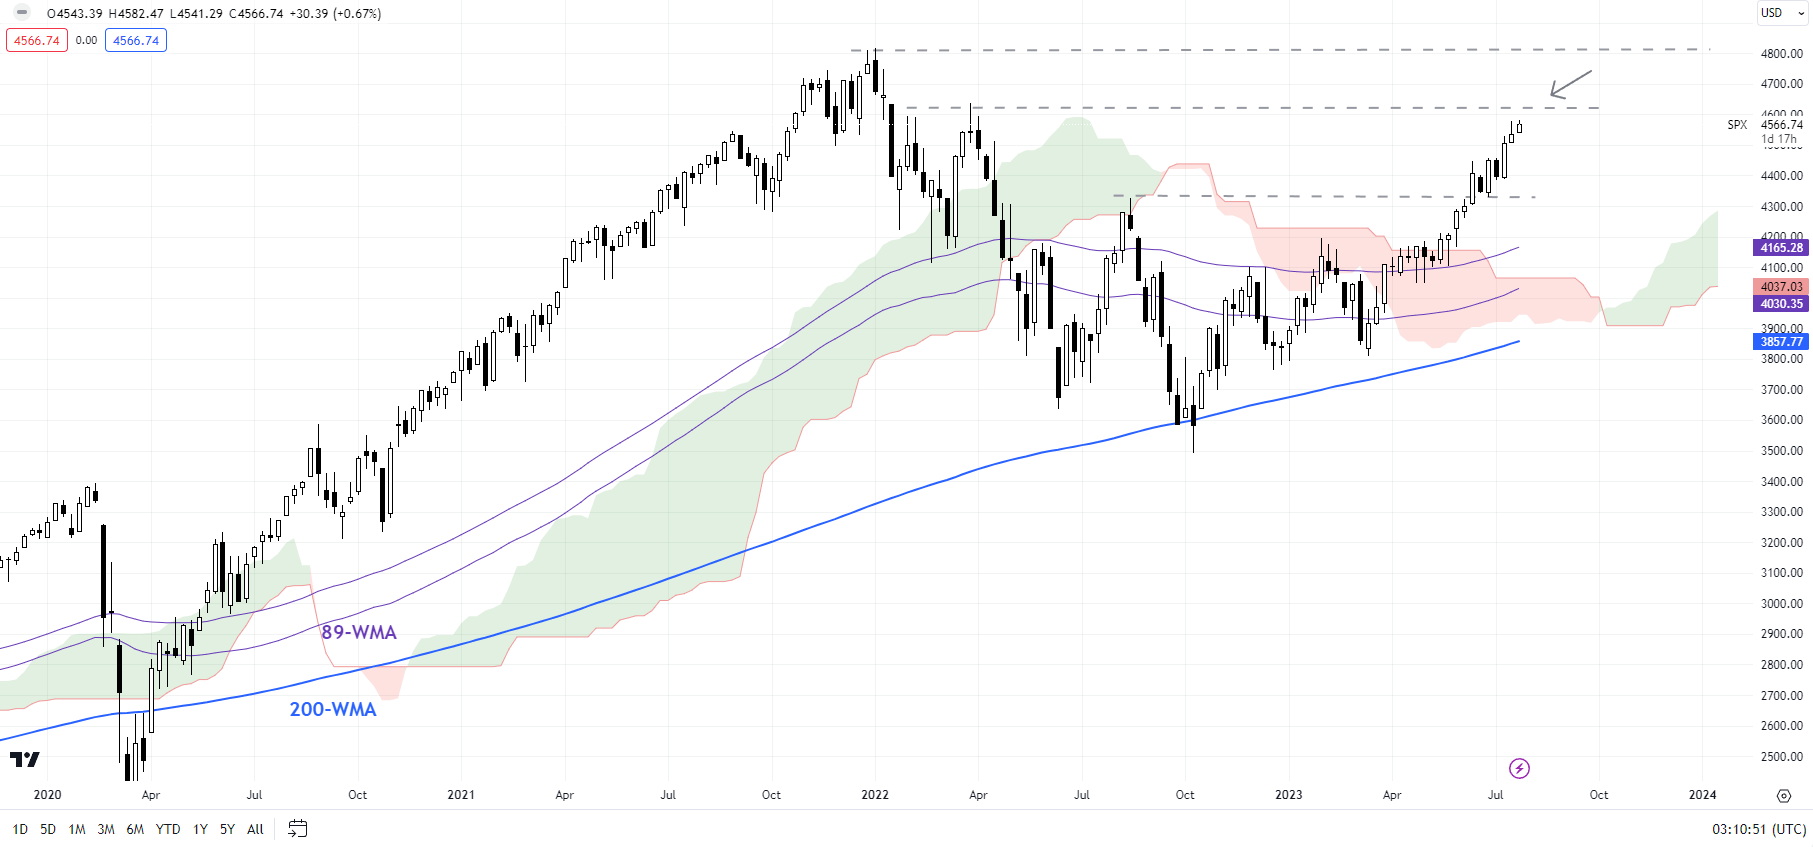
From a trend perspective, like the Nasdaq 100 index, there is no sign of a reversal of the uptrend on the S&P 500 index charts. Having said that, tentative signs of fatigue are emerging as the S&P 500 index nears the April 2022 high of 4637, slightly below the 2022 record high of 4819.

Still, unless the index breaks below immediate support at the mid-June high of 4450, the path of least resistance remains sideways to up in the near term – a point confirmed by still-solid momentum on the weekly charts. Only a break below 4450 would indicate that the bullish pressure had temporarily faded. For the broader bullish outlook to reverse, the index would need to fall below the 89-day moving average (now at about 4250).