Australian Dollar depreciates as US Dollar remains stable due to hawkish Fed

Australian Dollar depreciates as US Dollar remains stable due to hawkish Fed

The Australian Dollar (AUD) struggles against the US Dollar (USD) on Thursday. However, market concerns eased following news that the China-specific tariffs proposed under US President Donald Trump’s revised plan are significantly smaller than initially expected. This development helped calm investors’ nerves, especially given the strong trade ties between China and Australia, which make Australian markets sensitive to changes in China’s economic landscape.

President Trump announced plans to implement a 10% tariff on Chinese imports starting February 1, citing concerns over fentanyl shipments from China to Mexico and Canada, according to Reuters. In response, Chinese Vice Premier Ding Xuexiang warned on Tuesday about the potential trade war fallout, stating that “there are no winners” in such conflicts. His remarks come as China braces for possible tariffs under the Trump administration, as reported by CNBC.

Chinese authorities on Thursday introduced several measures to stabilize its stock markets, including allowing pension funds to increase investments in domestic equities. A pilot scheme enabling insurers to purchase equities will be launched in the first half of 2025, with an initial scale of at least 100 billion Yuan. Meanwhile, the People’s Bank of China (PBoC) said that they “will expand the scope and increase the scale of liquidity tools to fund share purchases at the proper time.”

The S&P/ASX 200 Index fell below 8,400 on Thursday, driven primarily by a decline in mining stocks as weaker commodity prices weighed on the sector. This decline in the Australian equity market occurred despite strong gains on Wall Street. Investors remain cautious as they assess the implications of President Trump’s policy changes.

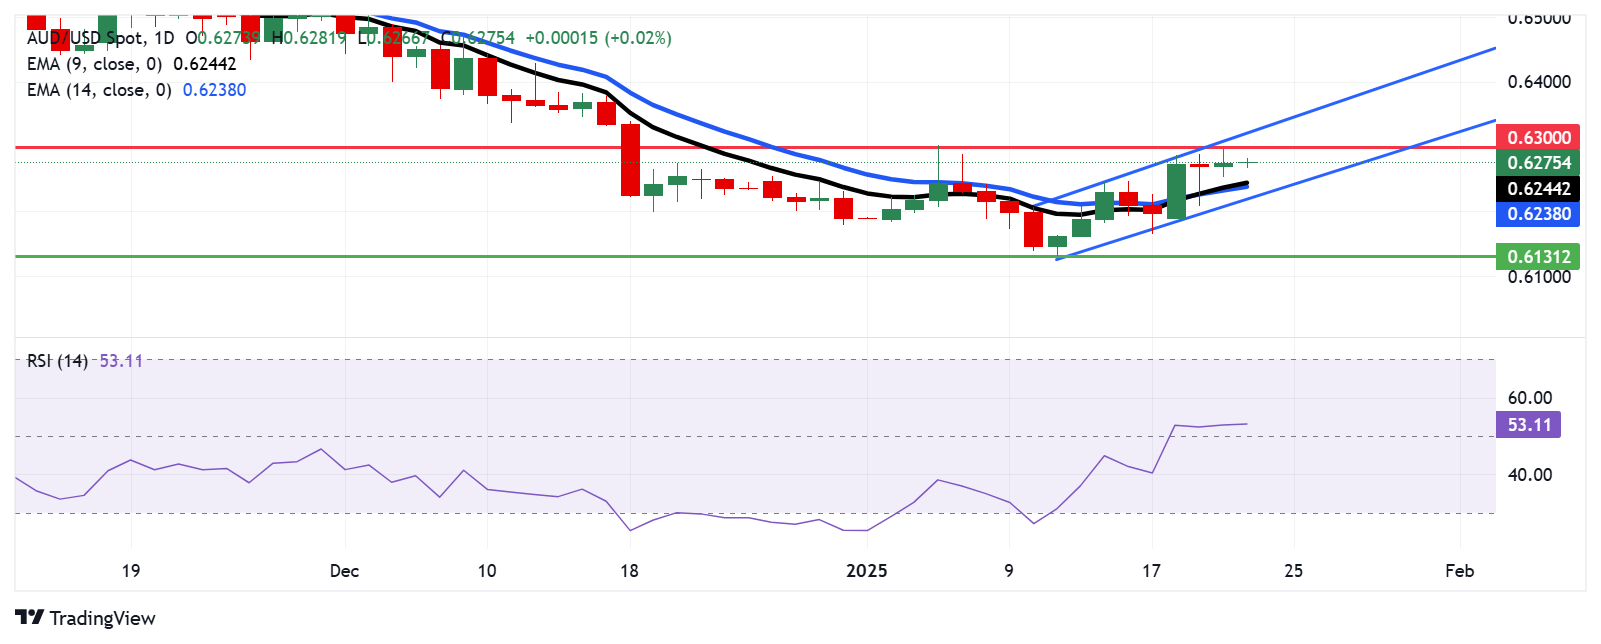
Technical Analysis: Australian Dollar remains below 0.6300 and ascending channel’s upper boundary

The AUD/USD pair trades near 0.6270 on Thursday, with a daily chart analysis indicating movement within an ascending channel pattern, suggesting a potential bullish bias. Additionally, the 14-day Relative Strength Index (RSI) is slightly above 50, reinforcing positive market sentiment.

On the upside, the AUD/USD pair could test the psychological resistance level at 0.6300, with the next target near the upper boundary of the ascending channel around 0.6320.

The initial support appears at the nine-day Exponential Moving Average (EMA) at 0.6244, followed by the 14-day EMA at 0.6238. Stronger support is seen at the ascending channel’s lower boundary around 0.6220, with further support at the psychological level of 0.6200.

AUD/USD: Daily Chart
China’s Commerce Ministry: Willing to work with US to promote stable development of trade ties

China’s Commerce Ministry: Willing to work with US to promote stable development of trade ties

China’s Commerce Ministry said in a statement on Thursday that they are “willing to work with the US to promote stable and healthy development of economic and trade ties.”

“Tariff measures are not good for China, US, and the rest of the world,” the Ministry said.

These comments came as they responded to US President Donald Trump’s 10% tariff threat on Chinese imports.

Market reaction

AUD/USD remains depressed at around 0.6270 following these comments, down 0.08% on the day.

gold-bar-and-dollar-bills-42586628_XtraLarge

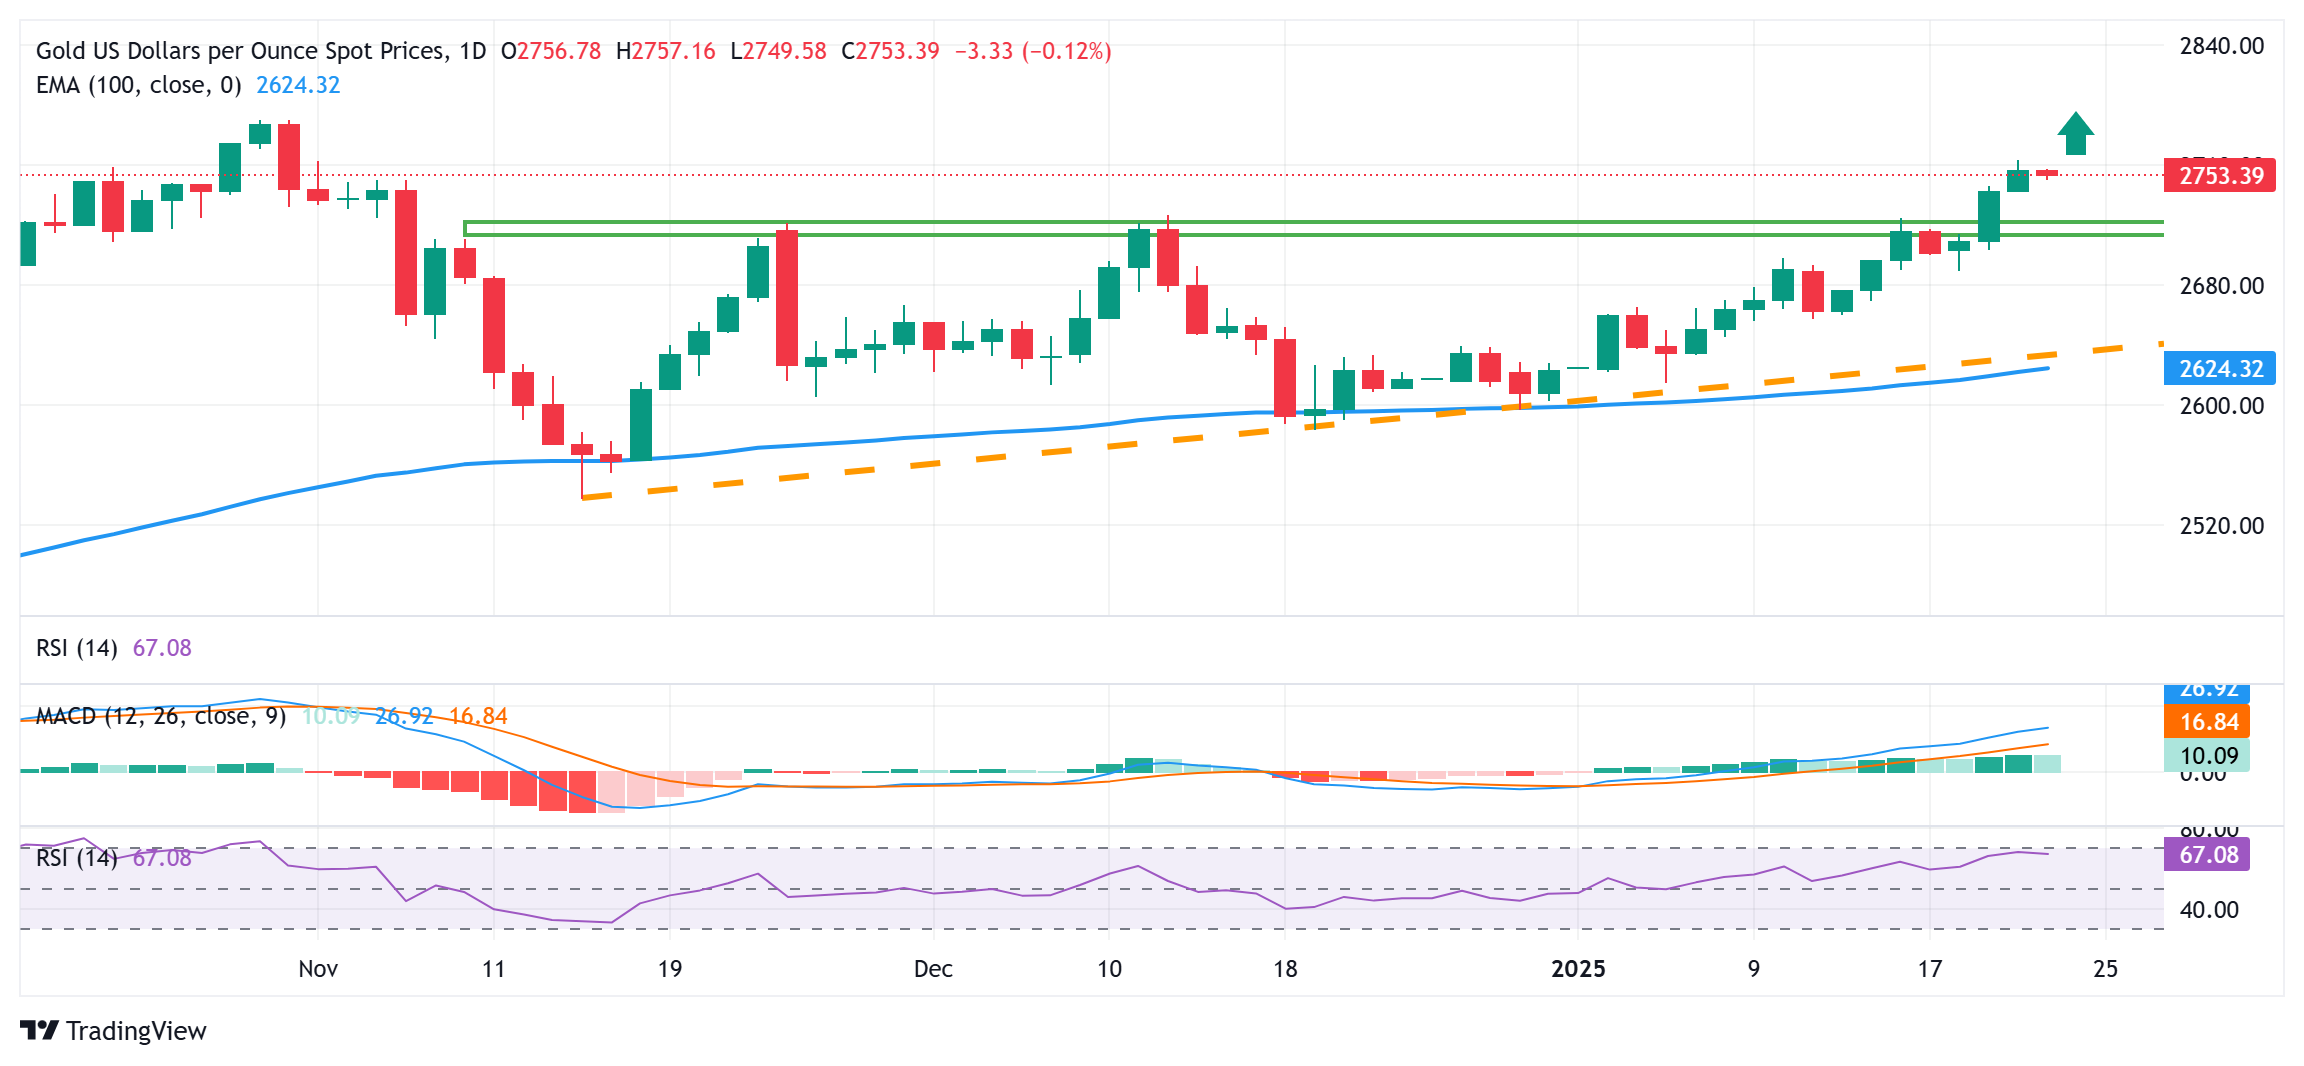
Gold price sticks to negative bias, remains close to multi-month peak set on Wednesday

Gold price (XAU/USD) remains depressed through the first half of the European session on Thursday and for now, seems to have snapped a three-day winning streak to its highest level since early November touched the previous day. The US Dollar (USD) gains some positive traction for the second straight day and recovers further from the monthly low. This, along with a stable performance around the equity markets, turn out to be key factors undermining the safe-haven precious metal.

That said, bets that the Federal Reserve (Fed) will cut rates twice this year keep a lid on the US Treasury bond yields, which, in turn, should cap the USD and offer some support to the non-yielding Gold price. Furthermore, uncertainty over US President Donald Trump’s trade policies, which could trigger trade wars and elevate market volatility, should help limit losses for the XAU/USD. This warrants caution before confirming that the one-month-old uptrend has run out of steam.

Gold price retains negative bias amid modest USD strength; downside remains cushioned

  • The US Dollar holds steady above its lowest level since late December touched on Wednesday amid a modest rebound in the US Treasury bond yields and prompts some selling around the Gold price on Thursday.
  • The lack of details about US President Donald Trump’s tariff plans and easing geopolitical tensions remain supportive of the risk-on mood, which is seen as another factor undermining the safe-haven precious metal.
  • Trump’s proposed policies are broadly regarded as inflationary, which, in turn, might compel the Federal Reserve to stick to its hawkish stance and keep interest rates higher for longer to rein in rising price pressures.
  • Investors, however, are still pricing in the possibility that the US central bank will lower borrowing costs at least two times by the end of this year. This might cap the upside for the US bond yields and the Greenback.
  • Trump’s speech at the World Economic Forum will be looked upon for more concrete announcements on tariffs. Apart from this, the release of the US Weekly Jobless Claims should provide some impetus to the XAU/USD.
  • The Bank of Japan is scheduled to announce its decision at the end of a two-day policy meeting on Friday and is expected to raise interest rates from 0.25% to 0.50%, or the highest since the 2008 global financial crisis.
  • Rate decisions from the Fed and European Central Bank are scheduled for Wednesday and Thursday next week, respectively, which could infuse volatility and provide some impetus to the non-yielding yellow metal.

Gold price bulls have the upper hand while above the $2,720-2,25 resistance breakpoint

fxsoriginal

From a technical perspective, any subsequent slide is more likely to find decent support near the $2,625-2,620 strong horizontal resistance breakpoint, now turned support. Some follow-through selling could drag the Gold price to the $2,700 mark, which if broken decisively should pave the way for deeper losses. The XAU/USD might then fall towards the $2,665-2,662 area en route to the 2,627-2,622 confluence. The latter comprises the 100-day Exponential Moving Average (EMA) and a short-term ascending trend line, which, in turn, should act as a key pivotal point for short-term traders.

On the flip side, the overnight swing high, around the $2,763-2,764 area, now seems to offer some resistance, above which the Gold price could aim to challenge the all-time peak, around the $2,790 region touched in October. This is closely followed by the $2,800 mark, which if conquered will be seen as a fresh trigger for bullish trades and set the stage for an extension of the recent well-established uptrend witnessed over the past month or so.

china-768x576

EUR/USD: To trade in range between 1.0380 and 1.0440

Euro (EUR) is likely to trade in range between 1.0380 and 1.0440. In the longer run, current price action is part of a recovery phase that could extend to 1.0480, UOB Group’s FX analysts Quek Ser Leang and Lee Sue Ann note.

Current price action is part of a recovery phase

24-HOUR VIEW: “Following Tuesday’s price movements, we noted yesterday that ‘there has been no further increase in momentum.’ We were of the view that EUR ‘is likely to trade in a range, probably between 1.0345 and 1.0440.’ However, EUR rose to 1.0457, pulling back swiftly to close at 1.0407 (-0.21%). The price action did not result in any increase in either downward or update momentum. Today, we continue to expect EUR to trade in a range, most likely between 1.0380 and 1.0440.”

1-3 WEEKS VIEW: “We turned positive in EUR two days ago (21 Jan, spot at 1.0415), indicating that ‘the current price action is part of a recovery phase that could extend to 1.0480.’ Yesterday, EUR rose briefly to a three-week high of 1.0457 before pulling back. While there has been no further increase in momentum, we will maintain our view as long as 1.0340 (‘strong support’ level was at 1.0320 yesterday) is intact.”

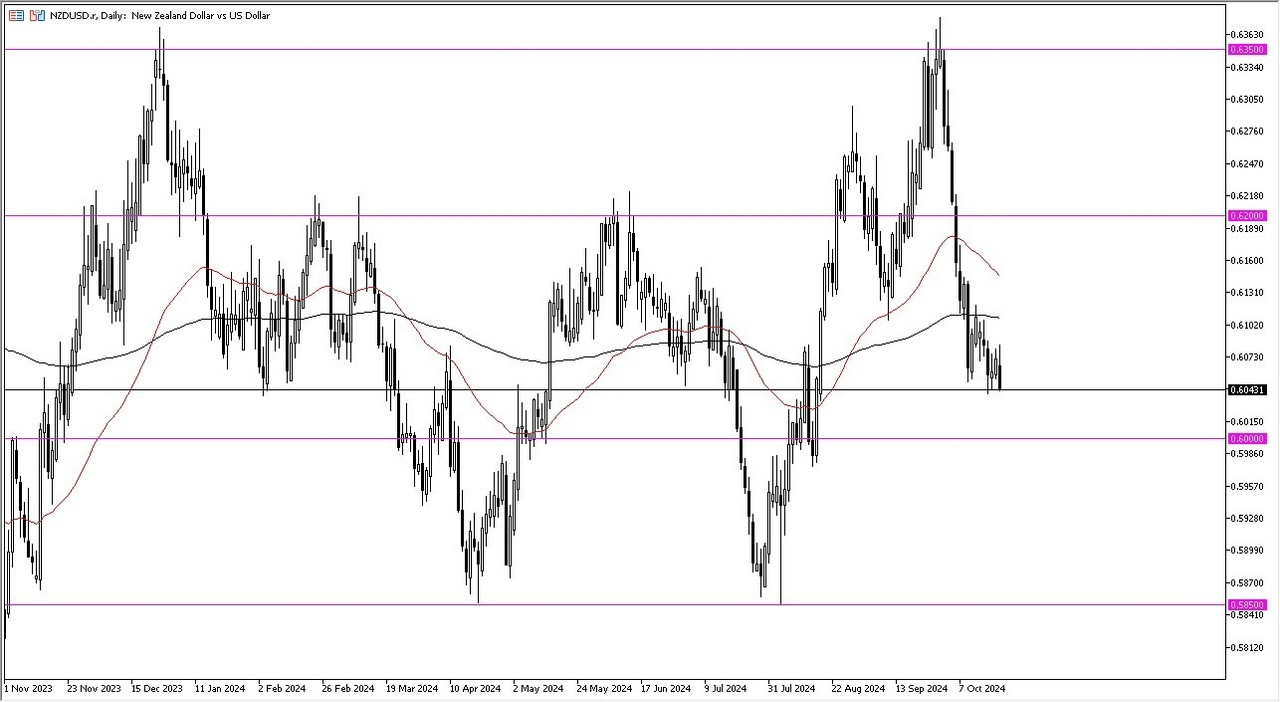
NZD/USD drops to near 0.5650 as US Dollar appreciates ahead of Initial Jobless Claims

NZD/USD drops to near 0.5650 as US Dollar appreciates ahead of Initial Jobless Claims

NZD/USD continues to remain subdued for the third consecutive session, trading around 0.5660 during the European hours on Thursday. The pair’s downside is attributed to the stronger US Dollar (USD) amid hawkish sentiment surrounding the US Federal Reserve’s (Fed) policy stance.

According to the CME FedWatch tool, traders are confident that the Fed will keep its key borrowing rates in the range of 4.25%-4.50% in the upcoming three policy meetings. Moreover, US President Donald Trump’s policies could drive inflationary pressures, potentially limiting the Fed to just one more rate cut in 2025.

eur6

EUR/USD hovers near 1.0400 as focus shifts to US data

EUR/USD trades listlessly near 1.0400 in the European session on Thursday. The pair stays defensive as US President Trump has threatened to impose tariffs on the Eurozone. Further, ECB rate cut expectations also weigh on the major alongside fresh US Dollar demand ahead of US data.

The Relative Strength Index (RSI) indicator retreated below 60 on Thursday, pointing to a loss of bullish momentum. Nevertheless, while EUR/USD holds above 1.0390, where the 200-period Simple Moving Average (SMA) meets the Fibonacci 50% retracement of the latest downtrend, technical sellers could refrain from betting on an extended slide.

On the upside, 1.0440 (Fibonacci 61.8% retracement, 50-day SMA) aligns as strong resistance before 1.0500 (round level, Fibonacci 78.6% retracement). In case 1.0390 level fails, 1.0350 (Fibonacci 38.2% retracement) and 1.0320 (100-period SMA) could be seen as next support levels

EUR/USD climbed to its highest level in over a month above 1.0450 in the early American session on Wednesday but struggled to preserve its bullish momentum. After closing the day marginally lower, the pair trades in a tight channel near 1.0400 in the European morning on Thursday.

In the absence of high-tier data releases, the upbeat market sentiment helped EUR/USD hold its ground midweek. Rising US Treasury bond yields, however, supported the US Dollar and capped the pair’s upside.

Later in the day, the US Department of Labor will release the weekly Initial Jobless Claims data. Markets expect the number of first-time applications for unemployment benefits to rise to 220,000 from 217,000 in the previous week. A reading below 210,000 could help the USD stay resilient against its rivals and cause EUR/USD to stretch lower. On the flip side, a print of 230,000 or higher could trigger a USD selloff and boost the pair in the second half of the day.

During the American trading hours, the European Commission will publish the preliminary Eurozone Consumer Confidence data for January, which is forecast to edge higher to -14.2 from -14.5 in December.

trading-plan_body_Actionplantradingplan-Copy

GBP/USD: Resistance at 1.2410 is probably out of reach today

Pound Sterling (GBP) is expected to continue to advance; the significant resistance at 1.2410 is probably out of reach today. In the longer run, GBP view is positive, anticipating a move to 1.2410, UOB Group’s FX analysts Quek Ser Leang and Lee Sue Ann note.

GBP view is positive

24-HOUR VIEW: “Our view for GBP to ‘trade with a downward bias’ yesterday was incorrect. GBP surged, blowing past several resistance levels with ease (high has been 1.2344). Although we expect GBP to continue to advance today, the significant resistance at 1.2410 is probably out of reach today. Note that there is another resistance level at 1.2380. On the downside, any pullback is likely to remain above 1.2240.”

1-3 WEEKS VIEW: “Yesterday (20 Jan, spot at 1.2170), we highlighted, “there has been a tentative buildup in momentum, but GBP must break clearly below 1.2100/1.2130 support zone before further weakness can be expected.” The tentative buildup in momentum fizzled out quickly, as GBP surged above our ‘strong resistance’ level at 1.2305. From here, we are revising our view for GBP to positive, anticipating a move to 1.2410. We will maintain our view as long as the ‘strong support’ level, currently at 1.2210, is not breached. The ‘strong support’ level is set to move higher in the coming days.”

Share: Share on WhatsApp
gold_246-768x419

Gold price eases from over two-month top on stronger USD, positive risk tone

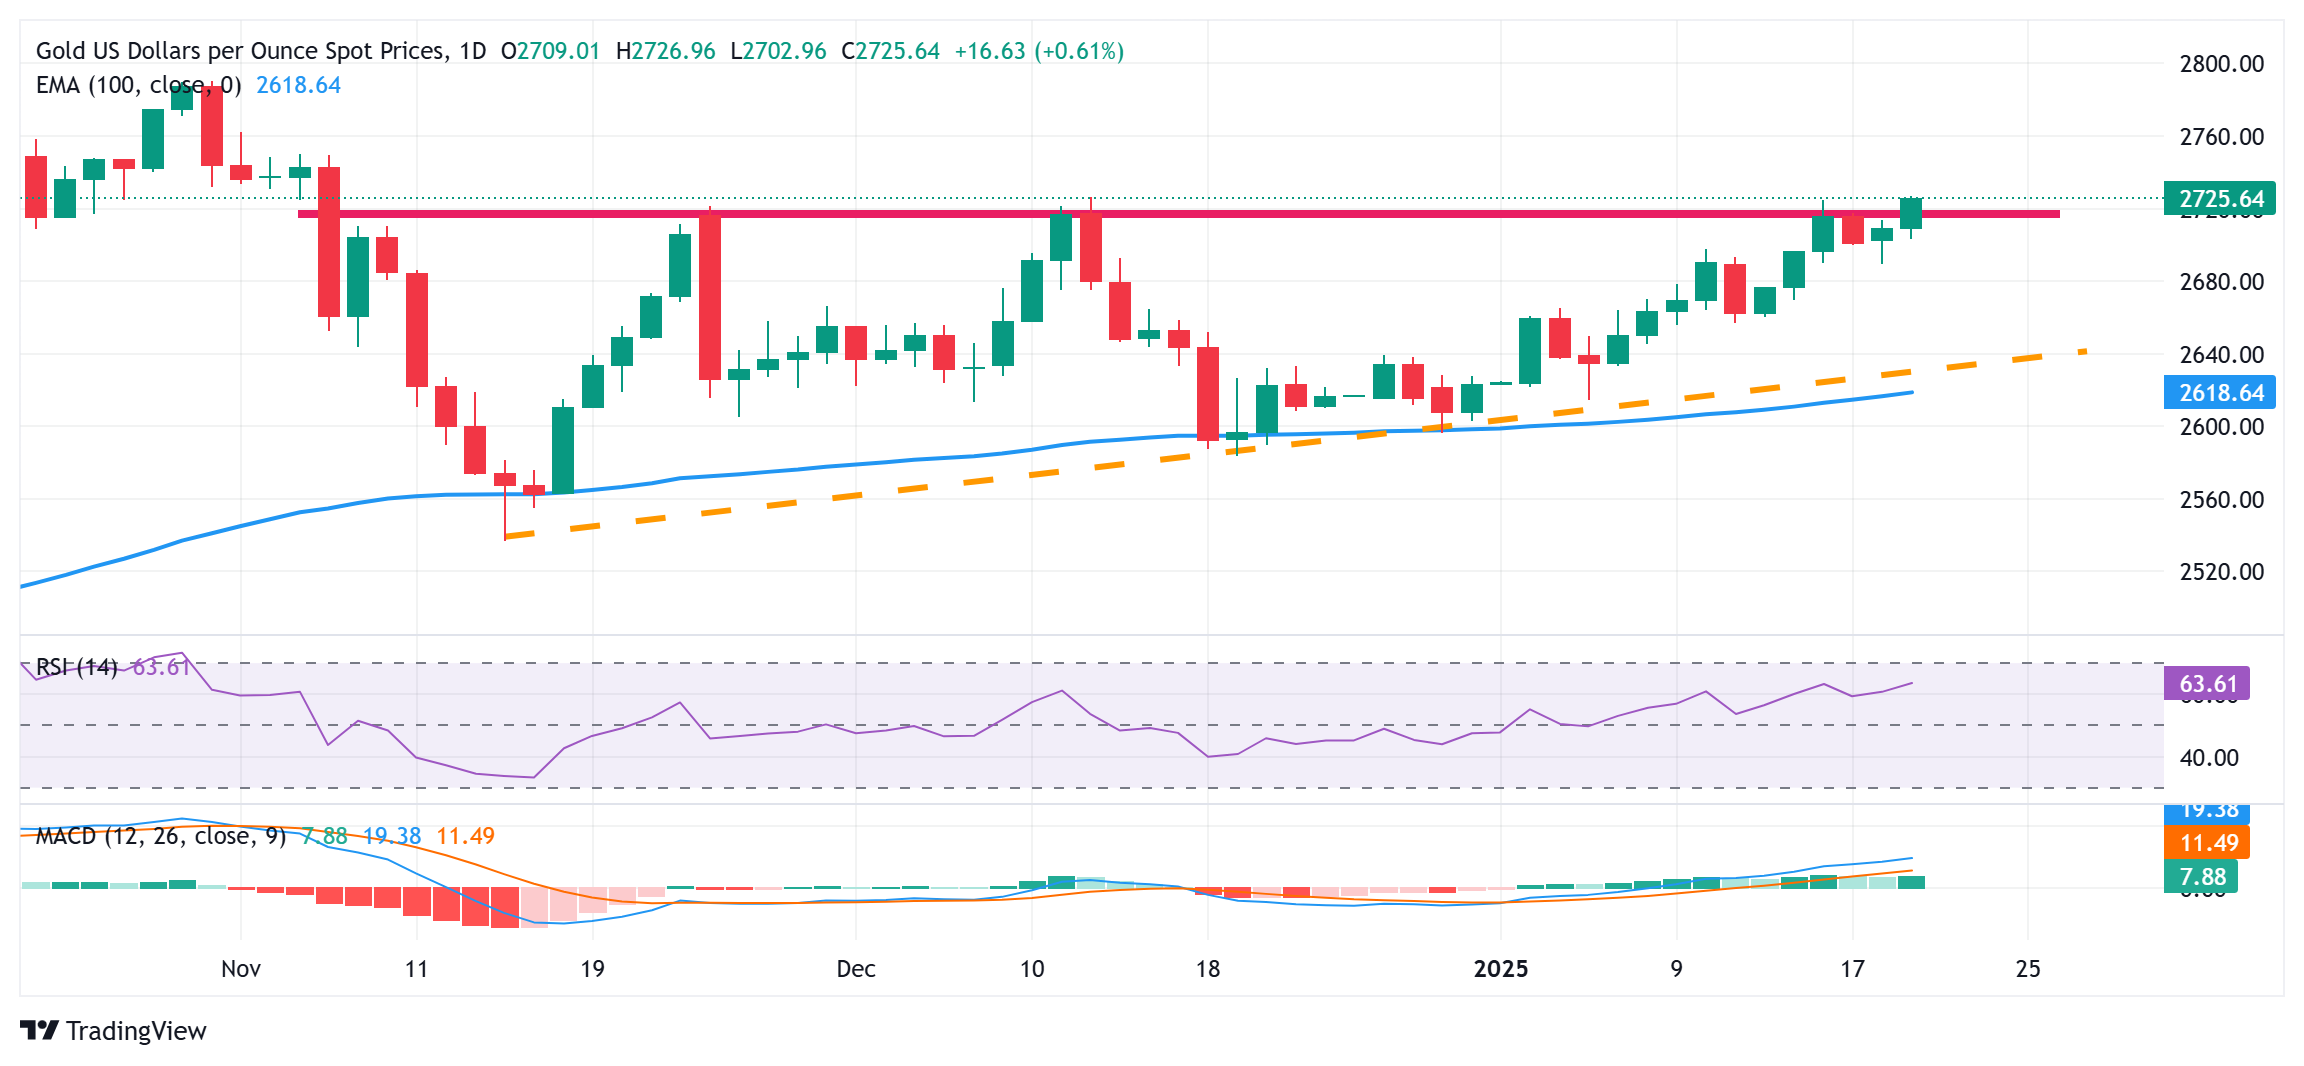
Gold price (XAU/USD) retreats slightly after touching its highest level since November 6 during the early European session on Tuesday and currently trades just below the $2,725 area, still up over 0.50% for the day. The US Dollar (USD) stages a goodish recovery from a two-week low touched on Monday amid expectations that US President Donald Trump’s protectionist policies would boost inflation and force the Federal Reserve (Fed) to stick to its hawkish stance. This, along with a generally positive tone around the equity markets, acts as a headwind for the safe-haven precious metal.

Meanwhile, Trump’s tariff remarks spark concerns about a fresh wave of a global trade war. Furthermore, bets that the Fed will cut interest rates twice this year, which has been a key factor behind the recent sharp pullback in the US Treasury bond yields, should limit any meaningful corrective pullback for the non-yielding Gold price. Nevertheless, the XAU/USD retains its positive bias for the second straight day. Moreover, the fundamental backdrop suggests that the path of least resistance for the commodity remains to the upside in the absence of any relevant economic data from the US.

Gold price remains on trak to test the next relevant hurdle near the $2,746-2,748 region

fxsoriginal

From a technical perspective, the Gold price now seems to have found acceptance above the $2,720 supply zone. Moreover, oscillators on the daily chart have been gaining positive traction and are still away from being in the overbought territory. This, in turn, favors bullish traders and suggests that the path of least resistance for the XAU/USD is to the upside. Hence, some follow-through strength towards the next relevant hurdle near the $2,735 horizontal zone, en route to the $2,746-2,748 region, looks like a distinct possibility. The momentum could extend further towards challenging the all-time peak, around the $2,790 area touched in October 2024.

On the flip side, any corrective pullback now seems to find decent support near the $2,700 mark. A subsequent slide below the overnight swing low, around the $2,689 region, could prompt some technical selling and drag the Gold price further towards the $2,662-2,660 region. The latter should act as a pivotal point, below which the XAU/USD could fall to the $2,635 zone en route to the $2,622-2,618 confluence – comprising a short-term ascending trend-line extending from the November low and the 100-day Exponential Moving Average (EMA).

Canada CPI expected to rise 1.8% in December, bolstering BoC to further ease policy

Canada CPI expected to rise 1.8% in December, bolstering BoC to further ease policy

Statistics Canada is set to release its latest inflation report for December, based on the Consumer Price Index (CPI), this Tuesday. Early forecasts suggest headline inflation may have risen by 1.8% compared to the same month of the previous year.

In addition to the headline figures, the Bank of Canada (BoC) will publish its core CPI data, which excludes more unpredictable items like food and energy. For context, November’s core CPI showed a 0.1% contraction compared to the previous month but showed a 1.6% increase from a year earlier. Meanwhile, headline inflation for November rose just 1.9% annually and actually came in flat on a monthly basis.

These inflation numbers are under a microscope, particularly because of their potential impact on the Canadian Dollar (CAD). The BoC’s approach to interest rates plays a critical role here. The central bank has already reduced its policy rate by 175 basis points since it began easing in June 2024, bringing it down to 3.25% on December 11.

On the currency front, the CAD has faced significant challenges, losing value steadily. This has pushed the USD/CAD exchange rate to its highest levels since May 2020, breaching the 1.4400 mark. Markets will be paying close attention to Tuesday’s data to gauge what might come next for the Canadian economy and its currency.

What can we expect from Canada’s inflation rate?

The Bank of Canada’s decision to cut rates by 50 basis points on December 11 to 3.25% was a close call, according to the meeting Minutes published on December 23. Some council members favoured a smaller 25 basis point reduction, leading to significant debate. Governor Tiff Macklem signalled that future cuts would likely be more gradual, marking a shift from earlier messaging about the need for steady easing. Proponents of the larger cut cited concerns about weaker growth and downside inflation risks, though not all recent data supported such an aggressive move. The decision highlights the central bank’s careful navigation of economic uncertainties.

Previewing the data release, analysts at TD Securities note: “We look for CPI to edge higher to 2.0% YoY as prices fall by 0.2% MoM. Seasonal headwinds to core goods will weigh heavily on a MoM basis, while food prices and a softer Loonie provide a source of strength. Core inflation should slow by 0.2pp to 2.45% YoY on average as CPI-trim/median overshoot BoC projections for Q4, but we expect the BoC to look through this in January.”

When is the Canada CPI data due, and how could it affect USD/CAD?

Canada’s inflation report for December is set to be released on Tuesday at 13:30 GMT, but the Canadian Dollar’s reaction will likely depend on whether the data delivers any major surprises. If the figures align with expectations, they are unlikely to influence the Bank of Canada’s current rate outlook.

Meanwhile, USD/CAD has been navigating a consolidative range since mid-December, reaching multi-year highs just beyond the 1.4500 hurdle. This rise has been primarily driven by a robust rebound in the US Dollar (USD), largely attributed to the so-called “Trump trade,” which continues to exert significant pressure on risk-sensitive currencies like the Canadian Dollar.

Pablo Piovano, Senior Analyst at FXStreet, suggests that given the current scenario of persistent gains in the Greenback and heightened volatility in crude oil prices, further weakness in the Canadian Dollar should remain in the pipeline for the time being.

“Bullish attempts should lead USD/CAD to another potential visit to the 2024 peak of 1.4485 (January 20), ahead of the highest level reached in 2020 at 1.4667 (March 19),” Piovano adds.

On the downside, there is an initial support zone at the 2025 low of 1.4278 (January 6), prior to the provisional 55-day SMA at 1.4177 and the psychological 1.4000 threshold. Down from here comes the November low of 1.3823 (November 6), closely followed by the more significant 200-day SMA at 1.3816. Should USD/CAD break below this level, it could trigger additional selling pressure, initially targeting the September low of 1.3418 (September 25), Piovano notes.

Untitled

US Dollar rallies on US President Trump’s tariff threats

Here is what you need to know on Tuesday, January 21:

After declining sharply on the first trading day of the week, the US Dollar (USD) Index benefits from the souring risk mood and gathers bullish momentum on Tuesday. The European economic docket will feature ZEW Survey – Economic Sentiment data for Germany and the Eurozone. Later in the day, December Consumer Price Index (CPI) data from Canada will be watched closely by investors.

US Dollar PRICE Today

The table below shows the percentage change of US Dollar (USD) against listed major currencies today. US Dollar was the strongest against the Canadian Dollar.

USD EUR GBP JPY CAD AUD NZD CHF
USD 0.38% 0.42% -0.09% 0.91% 0.57% 0.61% 0.21%
EUR -0.38% 0.04% -0.42% 0.52% 0.20% 0.23% -0.19%
GBP -0.42% -0.04% -0.50% 0.48% 0.15% 0.19% -0.22%
JPY 0.09% 0.42% 0.50% 0.97% 0.64% 0.66% 0.27%
CAD -0.91% -0.52% -0.48% -0.97% -0.33% -0.29% -0.70%
AUD -0.57% -0.20% -0.15% -0.64% 0.33% 0.03% -0.37%
NZD -0.61% -0.23% -0.19% -0.66% 0.29% -0.03% -0.41%
CHF -0.21% 0.19% 0.22% -0.27% 0.70% 0.37% 0.41%

The heat map shows percentage changes of major currencies against each other. The base currency is picked from the left column, while the quote currency is picked from the top row. For example, if you pick the US Dollar from the left column and move along the horizontal line to the Japanese Yen, the percentage change displayed in the box will represent USD (base)/JPY (quote).

During the early trading hours of the American session on Monday, reports of US President Donald Trump refraining from announcing day-one tariffs at his inauguration ceremony caused the USD to come under selling pressure. Later in the day, Trump said they could impose tariffs on China if they make a TikTok deal and China doesn’t approve it. Additionally, he noted that they are thinking about putting a 25% tariff on imports from Mexico and Canada, triggering a USD rally in the Asian trading hours on Tuesday.

The UK’s Office for National Statistics reported on Tuesday that the ILO Unemployment Rate edged higher to 4.4% in the three months to November from 4.3%. Other details of the jobs report showed that Employment Change was +35K in the same period. Finally, wage inflation, as measured by the change in the Average Earnings Including Bonus, climbed to 5.6% from 5.2%, as expected. GBP/USD showed no immediate reaction to these figures and was last seen trading deep in negative territory below 1.2300.

After losing more than 1% on Monday, USD/CAD reversed its direction and touched its highest level since March 2020 above 1.4500 in the Asian session on Tuesday before correcting lower toward 1.4450. On a yearly basis, the CPI in Canada is forecast to rise 1.8% in December, down slightly from the 1.9% increase recorded in November.

USD/MXN turned north as Trump’s tariff comments weighed heavily on the Mexican Peso. The pair was last seen gaining more than 1% on a daily basis at 20.7640.

EUR/USD registered strong gains on Monday but lost its traction early Tuesday. At the time of press, the pair was down about 0.4% on the day at 1.0375.

Gold closed marginally higher on Monday and gathered bullish momentum early Tuesday. XAU/USD was last seen trading at its strongest level since early November above $2,725.